Abstract
Non-ergonomic execution of repetitive physical tasks represents a major cause of work-related musculoskeletal disorders (WMSD). This study was focused on the pushing and pulling (P&P) of an industrial handcart (which is a generic physical task present across many industries), with the aim to investigate the dependence of P&P execution on the operators’ psychological status and the presence of pain syndromes of the upper limbs and spine. The developed acquisition system integrated two three-axis force sensors (placed on the left and right arm) and six electromyography (EMG) electrodes (placed on the chest, back, and hand flexor muscles). The conducted experiment involved two groups of participants (with and without increased psychological scores and pain syndromes). Ten force parameters (for both left and right side), one EMG parameter (for three different muscles, both left and right side), and two time-domain parameters were extracted from the acquired signals. Data analysis showed intergroup differences in the examined parameters, especially in force integral values and EMG mean absolute values. To the best of our knowledge, this is the first study that evaluated the composite effects of pain syndromes, spine mobility, and psychological status of the participants on the execution of P&P tasks—concluding that they have a significant impact on the P&P task execution and potentially on the risk of WMSD. The future work will be directed towards the development of a personalized risk assessment system by considering more muscle groups, supplementary data derived from operators’ poses (extracted with computer vision algorithms), and cognitive parameters (extracted with EEG sensors).
1. Introduction
With the ongoing progress of technology, workplace safety standards have also risen, proposing a “zero injuries” goal as an acceptable number of workplace accidents [1]. This challenge is studied by safety science and ergonomics, scientific disciplines that aim to design and/or improve workplaces through the minimization of discomfort, exertion, stress, and elimination of hazards and risk of injuries [2]. Studying how to improve the safety of repetitive tasks still remains highly challenging and relevant since its non-ergonomic execution represents a major cause of work-related musculoskeletal disorders (WMSD) [3]. WMSDs are described as a long-term accumulation of negative effects caused by repetitive unsafe acts (manual handling, heavy physical jobs, and awkward postures) [4]. Moreover, they have multiple negative sociological and economic implications. In the European Union in 2007, 8.6% of the people aged 15 to 64 that worked or previously worked reported a work-related health problem, which corresponds to approximately 23 million persons with WMSDs as the main work-related health problem (60%) [5]. This study is restricted to analyzing the task of P&P handcarts, which was chosen as a representative dynamic physical task whose variants are present across many industries (including warehouses, transportation, healthcare, sports, etc.).
Chen et al. reconstructed the human model in order to obtain the visualization of the WMSD risk factors of, among the others, the P&P task using a wearable and connected gait analytics system and the Kinect [6]. Aiming to determine ergonomic risk levels of P&P, the construction worker tasks were studied using a wearable insole pressure system [7]. Gómez applied a statistical model for the prediction of work-related musculoskeletal discomfort and ergonomic evaluation to data collected by means of direct observation and surveys as a part of the meat processing industry (P&P of heavy loads included) [8]. Nath et al. created a machine learning-based solution for data acquisition and data processing, human activity recognition of three classes (category 0: wait; category 1: lift/lower/carry; category 2: push/pull), estimation of activity durations and frequencies, and assessment of overexertion and ergonomic risks using time-stamped motion data from a body-mounted smartphone [9].
The most useful information about the muscular load of the industrial worker and the potential threat of WMSDs could be provided by electromyography (EMG) data, which measures the electrical activity of the skeletal muscle in response to nerve stimulation. The idea of analyzing EMG data in the industrial workplace dates back to 1990 [10], and detailed instructions for measurement methodology have already been presented [11]. With the aim of analyzing the impact of a particular task on the human body and reducing its physical demands, previous studies focused on the framework for adaptation of the robot to human fatigue in different human–robot collaborative industrial tasks [12]. EMG electrodes were used in a specially designed laboratory experiment simulating roofing jobs to examine the effects of common risk factors based on lower back muscle activity and working frequency [13]. Salas et al. conducted a comparative analysis of experienced and inexperienced rodworkers using EMG and the Xsens MTx Xbus system to evaluate levels of back moments L4/L5 and time spent in upright and flexed posture [14]. Peppoloni et al. proposed a wireless wearable system (using IMU sensors and EMG) for the assessment of WMSD risks for the upper limb performing the task of repetitive object lifting and dropping [15].
Safe performance of work activities, especially repetitive ones, requires the worker’s continuous attention. Given that attention is affected by a person’s psychological/emotional status, it is expected that individuals with a more negative psychological status (anxiety, stress, depression, or apathy) would be at a higher risk of workplace-related injury. There are still scarce data on the association between psychological status and the risk of workplace injury. In general, depression is associated with concentration difficulties, and it has been shown that chronic stress negatively affects an individual’s attention and executive function [16]. Depression and anxiety increase the risk of injury among athletes [17], and workers perceive that symptoms of anxiety and depression place them at risk of workplace injury [18]. A recent study has examined longitudinal associations between depression or anxiety with a work-related injury and showed that the presence of depression was able to predict injury, while the effect of anxiety was less clear [19]. However, none of the previous studies have considered the association of psychological status and patterns of activities related to specific tasks such as cart pushing/pulling.
Given that P&P is highly associated with risks from musculoskeletal injuries, there is interest in the effects of various aspects of the pushing/pulling task on loads experienced by the body, especially the spine [20]. However, while cart P&P tasks might affect the spine and extremities, it is also reasonable to assume that the presence of pain syndromes of the upper extremities as well as the pain syndromes and reduced mobility of the spine would affect how an individual performs the pushing/pulling task. A previous study showed that upper limb pain slows down force generation at handgrip [21]. In addition, the effect of handle stability on maximum push/pull force was investigated to enhance individuals’ push/pull capabilities and reduce fatigue and musculoskeletal disorders [22]. Nevertheless, previous studies have not considered the actual performance of individuals with different states of musculoskeletal health.
As may be noted, P&P safety risks could be divided into (1) ergonomics (workplace-related) and (2) individual (poor health habits or physical conditions) [23]. While the first topic is well studied in the literature, recent studies have started paying more attention to the studying correlation between WMSDs and individual operator characteristics and/or behavior in the workplace [24,25]. In this study, we aim to analyze in detail P&P safety by enveloping the above-mentioned aspects.
2. Materials and Methods
2.1. Study Participants
The study was approved by the Ethics Committee of the Faculty of Medicine, University of Belgrade, and all of the included participants provided informed consent for their participation in the study. A total of 20 male individuals (mean age: 35.0 ± 5.8 years) were included in the study (Table 1). The mean body weight was 94.9 ± 11.0 kg, and the mean height was 186.0 ± 8.8 cm. None of the subjects had previous workplace injuries. The participants were initially selected from the groups of experienced and nonexperienced in physical tasks in industry, with various levels of subjectively reported WMSDs (primarily back pain). Such inclusion criteria were chosen to enable investigation of multiple research problems upon the initial analysis of the acquired data. After the physical and psychological assessments were performed by clinical professionals, the aim was to examine the correlation between the clinical examinations and patterns in execution of physical tasks such as P&P.

Table 1.
Characteristics of the participants.
2.2. Physical and Psychological Assessment
We used the DASS, a 42-item self-report instrument designed to measure negative emotional states including depression (dysphoria, hopelessness, devaluation of life, self-deprecation, lack of interest/involvement, anhedonia, and inertia), anxiety (autonomic arousal, skeletal muscle effects, situational anxiety, and subjective experience of anxious affect), and tension/stress (chronic non-specific arousal, including difficulty, relaxing, nervous arousal, and being easily upset/agitated, irritable/over-reactive, and impatient) [26,27]. The Serbian adaptation [28] of the instrument was used from the official website of the DASS scale. Each of the three DASS scales contains 14 items, and the participants were asked to rate each item on a 4-point Likert scale to show how severely or frequently they experienced each state over the past week. Then, we calculated the scores for Depression, Anxiety, and Stress by summing the scores for the relevant items. In accordance with the DASS manual, the threshold scores for Depression, Anxiety, and Stress were 15, 8, and 10, respectively. Apathy was evaluated by the Starkstein apathy scale [29,30,31]. It contains 14 items, and the total score can be in the range between 0 and 42. Scores equal to or higher than 14 were considered clinically meaningful apathy.
A standard physical examination was performed by a senior specialist in physical medicine and rehabilitation. Particular emphasis was placed on pain syndromes of the upper extremities (pain on palpation of the trigger points of the target muscles), assessment of a range of motion of the spine, and signs of a radicular lesion (straight leg raise test). Pain syndromes were scored on a Verbal Rating Scale (VRS) from 0 to 4, where 0 indicated ‘no pain’ and 4 indicated ‘very severe pain.’
2.3. Experiment Design
The flowchart of the experiment is presented in Figure 1. The industrial trolley was made of steel-welded thin-walled box profiles (2 × 4 cm). The dimensions of the industrial trolley are 180 × 73 × 195 (L × W × H). The total height of the trolley with wheels is 205 cm. The aluminum handle, ergonomically shaped, is placed at 115 cm from the floor. There are four rubberized wheels and their size is ⍉75. The approximate weight of the industrial trolley is 100 kg (Figure 2).
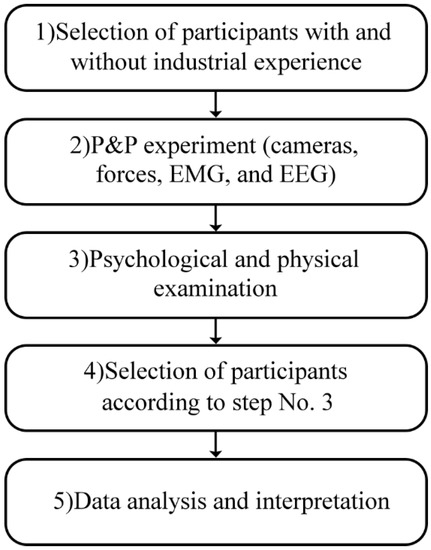
Figure 1.
Flowchart of the experiment.
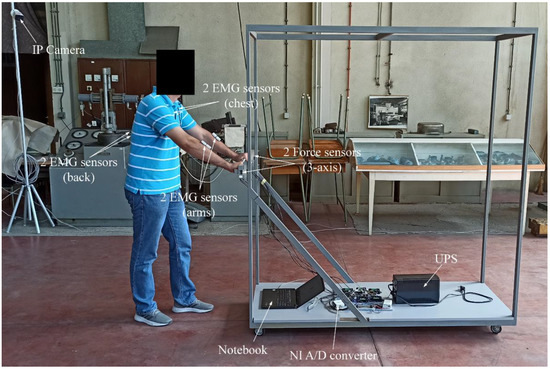
Figure 2.
Trolley and equipment used in the experiment.
The polygon was 9 × 6m in size (Figure 3). The floor was flat, similar to the industrial one, with occasional transitions from one type of base to another. This way of manipulating industrial carts (pushing, pulling, and turning) is a typical way of manipulation in industry. It contains all the elements necessary for conducting the experiment in terms of the direction of P&P, and the representation of the rotation of the cart in all directions, bearing in mind the most characteristic movements that occur in the industry.
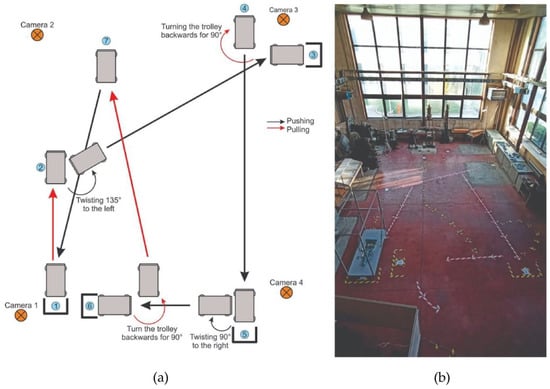
Figure 3.
Considered P&P tasks and experimental environment. (a) P&P path sketch and (b) Workplace polygon.
Participants had to cover a distance of about 30 m in one attempt. The movement was carried out in 5 series, and each series consisted of two attempts (10 repetitions). There was a 2-s pause between the two attempts (with the arms relaxed next to the body). There was a 20-s break between the two series. If a participant had felt any pain or fatigue, the experiment was stopped. The total average time during the whole session was about 11 min per participant.
The P&P task is visually presented in Figure 3 and Figure 4. It starts from position ① by pulling the cart to position ②. Then, by turning the cart at the waist 135 degrees to the left, they push to position ③, where it stops at the marked place. Then, the trolley is pulled back and turned backward by 90 degrees to the ④ position. The trolley is pushed to the ⑤ position, stops, and turns at the waist 90 degrees to the left. The trolley is then pushed to position ⑥. By walking backward, the trolley is pulled to position ⑦ and then pushed to the starting position ①.
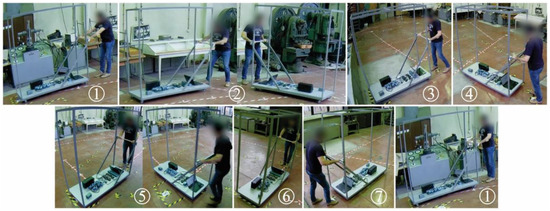
Figure 4.
Trolleys’ and operators’ positions during sessions illustrated in Figure 3.
2.4. Data Acquisition
The P&P forces were measured using the three-axis force sensors. The Forsentek 3-axis force sensors, on strain gauge technology based on high precision amplified circuits, are connected to the central microprocessor edge device. All signals were sampled at 100 Hz. The measurement hardware includes two identical 3-axis force sensors for the left and right arm each. Based on these measurements, sensor values are processed directly on the edge device. Every sample contains xR, yR, zR, xL, yL, and zL force values for the right (R) and left (L) arm. The force intensity FR and FL are calculated by using equations
Six EMG surface electrodes were placed on the subject’s body on the latissimus dorsi, pectoralis major, and flexor carpi ulnaris muscles bilaterally (Figure 2). The EMG signals were acquired using the Delsys Trigno Wireless Biofeedback system and the biosignalsplux muscleBAN to measure muscle activity as a reference to the effective physical effort required for the tasks. The Trigno EMG System is supported by EMGworks Acquisition software for standardized and simple data acquisition and EMGworks Analysis software to analyze the recorded signals. Prior to the experiment, the maximal voluntary contraction (MVC) for each muscle was extracted according to the MVC procedures [32]. The MVC represents the maximum value of the EMG signal during the maximum contraction of the specified muscle. Afterward, the recorded EMG signals were filtered and normalized to the corresponding MVC.
All the experiments were recorded with four DAHUA IPC-HFW2831TP-ZS 8MP WDR IR Bullet IP Cameras, with a DAHUA PFS3010-8ET-96 8port Fast Ethernet PoE switch. The host PC had a CPU 1151 INTEL Core i3-8100 3.6GHz 6MB BOX. Cameras were placed in the corners of the workplace (Figure 2), capturing the full body of the participant during the whole experiment.
Before every new participant’s session, we assured that IP cameras were capturing the complete workplace and that there were no dead angles and occlusions, so the participant was visible on every camera throughout the experiment. Each participant had a trial of a few minutes to practice. At the beginning of the experiment, the subject was at position ①. When EMG and force sensors were turned on, supervisors instructed the participant to start. This way, video data, force signals, and muscle signals were recorded almost simultaneously, which eased the process of post-processing.
Based on the psychological assessment and physical examination (Table 2), we identified two extreme groups of participants. Group 1 (two individuals) comprised individuals without high psychological scores of stress, depression, anxiety, and apathy; without pain syndromes of the upper extremity; and without limited mobility of the thoracolumbar spine. Group 2 comprised individuals (three individuals) with two high psychological scores (stress, depression, anxiety, or apathy); with pain syndromes of the upper extremity (at least two active (painful) trigger points with a VRS score of 3 or 4 on palpation); and with limited mobility of the thoracolumbar spine. None of the participants had a positive straight leg raise test. For further analysis, we selected these two groups of participants.
Table 2.
Analysis of forces.
For the purpose of data interpretation and analysis, the experiment (Figure 3) was divided into six phases: from position ① to position ③ (P1-2-3); from position ② to position ④ (P2-3-4); from position ③ to position ⑤ (P3-4-5); from position ④ to position ⑥ (P4-5-6); from position ⑤ to position ⑦ (P5-6-7); and from position ⑥ to position ① (P6-7-1). Furthermore, to be able to relate the physical action with the actual position more precisely (e.g., P2), all phases were further divided as follows: the last 30% of the time needed to reach the middle position from the beginning position (e.g., P1-2), and the first 70% of the time from the middle position to the end position (e.g., P2-3), as depicted in Figure 5. All force and EMG parameters were calculated on the aforementioned six sub-segments. Parameters for relative moments of the events of sub-segments were in the range from −1 (30% left of the middle point, e.g., P1) to 1 (70% right of the middle point, e.g., P3). The middle point had a value of 0 (e.g., P2). The force parameters considered for both left and right sensors were: mean value, standard deviation, maximal value, minimal value, the integral value (area under force curve), overall duration, the relative moment of the middle position, the relative moment of the maximal value, the relative moment of minimal value, the maximal difference of consecutive extremums, number of local maxima, number of local minima, and position-related task time. The normalized EMG parameter considered for each muscle was mean absolute value (MAV).
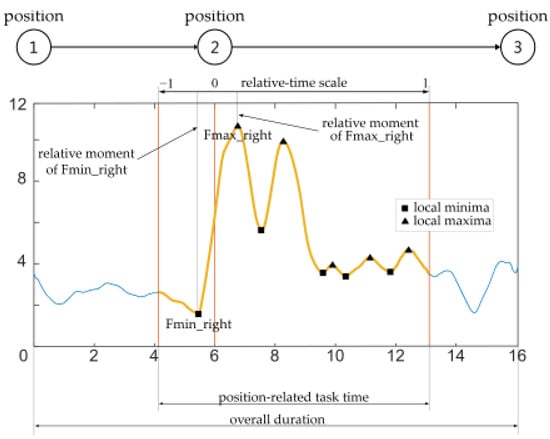
Figure 5.
Parameters extracted from the acquired force signal.
3. Results
Table 2 shows the results of force measurements in Groups 1 and 2, as well as the percent of the difference between Groups 1 and 2 for each of the measured parameters. Most of the measured parameters were numerically different between the two groups, with the highest percent of the difference between Group 2 and Group 1 recorded for integral right value (almost 90%) and integral left value. We also calculated the percentage of the difference between the last two series and the first two series in order to illustrate the variability between these series and evaluate the temporal evolution of force patterns. Table 3 shows the results of EMG measurements in Groups 1 and 2, as well as the percent of the difference between Groups 1 and 2 for each of the measured parameters.
Table 3.
Analysis of EEG.
4. Discussion
The vertical force component had the lowest influence on the resultant forces (both FR and FL), which is the consequence of the handcart handle position placed at the right height, according to standards of industrial P&P. As shown in Table 2, Group 2 had almost equal mean values of left and right force sensors, meaning that these participants conducted the P&P tasks more symmetrically and carefully compared with participants in Group 1. In contrast, subjects in Group 1 relied primarily on the dominant arm, which led to asymmetrical task execution (also validated with a higher maximal right than maximal left-hand value). On average, the overall duration of each sub-segment was longer for Group 2, which means that they carried out the task with more caution. The standard deviation of the left and right sensors was quite low and approximately equal for both groups, which is desirable as it implies the repeatability of the experimental measurements. When it comes to the integral value, one of the most important parameters that directly shows the amount of energy spent for a specific task, Group 2 had almost two times larger values (554.118 and 553.0317) compared with Group 1 (292.9955 and 264.0737). Hence, individuals with high scores of stress, depression, anxiety, or apathy, with pain syndromes of the upper extremity, and with limited mobility of the thoracolumbar spine put significantly more effort into the same task execution than individuals from Group 1. Even though the time of the middle position for both groups was almost identical, the relative time-points of the maximal value of Group 1 preceded the moments of the maximal value of Group 2, suggesting their different motion planning and faster decision-making for the upcoming action needed. The number of local maxima for both left and right sides of Group 2 was approximately 20% larger than that for Group 1, suggesting that despite doing the task more watchfully and symmetrically, the subjects from Group 2 had some sudden unnecessary movements.
The EMG results presented in Table 3, precisely MAVs, indicated that the subjects in Group 2 had higher activity in the tested muscles of the chest and back. Moreover, amplitudes of the left and right sides were symmetrical in Group 2, but they used the left chest and left back muscles significantly more than subjects in Group 1 (especially the left back muscle, with an intergroup difference of over 400%). Participants in Group 1 used the right back and the right chest muscles predominantly, implying that there was a difference in muscle activation patterns for the same task between the groups. Muscle activity of the left and right arms was identical within the group but was 40% higher for Group 2 compared with Group 1. However, the variation of almost all parameters between S9–10 and S1–2 was lower in Group 2 than in Group 1. This might be the result of the caution and persistent task execution of participants in Group 2, as well as the result of the reduced duration time of the sessions for Group 1 (the difference between S9–10 and S1–2 is more than 16%).
To the best of our knowledge, this is the first study that evaluated the composite effects of pain syndromes, spine mobility, and psychological status of the participants on the execution of P&P tasks. We showed that the presence of stress, depression, anxiety, or apathy, in combination with pain syndromes and limited spinal mobility, can drastically influence work performance. Previous studies have analyzed risk factors for work-related injuries in various contexts, and some of them addressed the influence of psychological status, such as depression and anxiety, on the risk of injury [19,33,34]. However, no studies have simultaneously considered the effects of psychological status and muscle pain syndromes of the upper extremities on the patterns of task performance in P&P. A systematic review [35] indicated that pushing/pulling tasks might increase upper extremity symptoms in workers, specifically for shoulders, but it is still unclear whether these tasks favor the development of symptoms in the rest of the upper extremity. Moreover, there is insufficient evidence as to whether pain syndromes of the upper extremity alter the task execution. Here, we showed that pain syndromes of the upper extremity, which reflect overuse injury of the muscles and are common musculoskeletal problems both in workers and in the general population, change the activation patterns of the muscle groups during the conducted experiment, which is very important from a clinical point of view. These results together may provide meaningful information about the cause of injury and provide strategy guidelines for proper task execution, thereby leading to a lower number of WMSDs.
However, it should be acknowledged that the current study has some limitations. First, as this was a pilot study, we focused on a limited number of participants. Second, EMG recordings were based just on three muscles, and further studies should consider other muscles of interest, especially other muscles of the upper extremity. Third, due to the small sample size, in this study, we considered a composite effect of psychological status, pain syndromes of the upper extremities, and spine range of motion, which means that we cannot distinguish the individual effects of these three groups of factors. Considering that musculoskeletal injuries predispose to psychological changes, including depression [19,36,37], it is particularly hard to separate the effects of the physical and psychological factors on task performance. That is another reason why we considered it acceptable to examine the composite effect of physical and psychological factors on the performance of P&P tasks.
Overall, our quantitative assessment of the task performance revealed that the two groups showed different patterns of activation and differential manner of task performance. The activities of the individuals from Group 2 were clearly affected by their characteristics as described above. However, it should also be noted that Group 1 is not devoid of any risk of injury because our analysis of video recordings suggested that those subjects were quicker and less careful with the tasks compared with Group 2. Additional work is needed to define specific actionable steps to reduce the risk of injury in both groups; nevertheless, our work is important as it documents a rationale to further explore the individual characteristics as risk factors for a work-related injury, which is essential for a comprehensive and holistic understanding of workplace safety.
In future work, we aim to further analyze P&P and similar tasks by combining available technology in a unique assessment procedure. P&P has shown to be complex task; therefore, there is a need for more extensive and diverse datasets and more muscle groups to be taken into account (dynamic parameters of the human body). While our qualitative analysis of video recordings suggested some differences in how the tasks are performed by different groups, for a broader analysis, the application of computer vision algorithms, such as pose estimation for assessment of whole body pose, could be incorporated. Some critical information about the current psychological state of workers, in particular alertness and attention, should also be examined during experiments, for example, with the use of electroencephalogram measurements.
5. Conclusions
Studying the safety of repetitive physical tasks is of great importance as their non-ergonomic execution has been reported as a major cause of work-related musculoskeletal disorders. In this study, we presented a dedicated acquisition system with the purpose of assessing the safety of P&P of an industrial handcart. The system integrated two three-axis force sensors (placed on the left and right arm) and six EMG electrodes (placed on latissimus dorsi, pectoralis major, and flexor carpi ulnaris muscles). The study included a total of 20 male individuals without previous workplace injuries who were instructed to perform P&P over the complex path of ~30 m (ten repetitions). Detailed quantitative analysis was performed in two subgroups, Group 1 (without high psychological scores of stress, depression, anxiety, and apathy; without pain syndromes of the upper extremity; and without limited mobility of the thoracolumbar spine) and Group 2 (with high scores of stress, depression, anxiety, or apathy; with pain syndromes of the upper extremity; and with limited mobility of the thoracolumbar spine). The analysis of the acquired signal included the computation of ten force parameters (for both left and right side), one EMG parameter (for three different muscles, both left and right side), and three time-domain parameters. Out of all the parameters, the force parameter, integral values, and the EMG parameter, MAV of the left latissimus dorsi, were substantially different between the two groups. Specifically, the force parameter was approximately 100% and the EMG parameter was more than 400% higher in Group 2, suggesting that participants in Group 2 put significantly more effort into the same task. Moreover, the MAV of the left and right sides had similar values in Group 2, which was not the case for Group 1, implying different muscle activation patterns and that subjects in Group 2 conducted the task more symmetrically and carefully than those in Group 1. We can conclude that psychological factors and pain syndromes of the upper limb muscles have a significant impact on P&P safety and probably also on the risk of WMSD. Accordingly, future research on this topic will be directed towards considering more industrial workplaces and muscle groups, as well as incorporating computer vision algorithms for pose analysis (or alternative visual systems, such as [38]) and EEG sensor data for monitoring brain activities during working hours [39]. Additionally, innovative methods such as the use of brain–computer interface (BCI), EEG-based attention test with CPT and TOVA, and eye-tracking systems could be helpful to further examine attention levels [40,41,42,43]. To enhance safety, industrial workplaces of the future will rely on the integration of new industry 4.0 technologies: Safety 4.0 [44,45], Quality 4.0 [46], Logistics 4.0 [47], and collaborative robotics, especially from the perspective of ergonomics [48] and neuroergonomics [49].
Author Contributions
Conceptualization, A.M.V., P.M. and M.G.; Data curation, M.P., A.M.V., M.D., A.P., M.J., M.G., M.S., C.C. and V.I.; Formal analysis, M.P. and P.M.; Funding acquisition, A.M.V.; Methodology, A.M.V.; Project administration, A.M.V. and M.D.; Resources, M.D., I.M. and K.J.; Software, M.P., A.M.V., A.P. and N.M.; Supervision, A.M.V. and K.J.; Validation, M.G.; Visualization, M.P.; Writing—original draft, M.P., A.M.V. and P.M.; Writing—review & editing, M.P., A.M.V. and P.M. All authors have read and agreed to the published version of the manuscript.
Funding
This study was supported by the Science Fund of the Republic of Serbia, project ID 6524219-AI4WorkplaceSafety.
Institutional Review Board Statement
The study was approved by the Ethics Committee of the Faculty of Medicine, University of Belgrade, number 1322/X-42, date 1 October 2020.
Informed Consent Statement
Informed consent was obtained from all subjects involved in the study.
Conflicts of Interest
The authors declare no conflict of interest.
Abbreviation List
| Abbreviation | Meaning |
| WMSD | Work-related Musculoskeletal Disorder |
| P&P | Pushing and Pulling |
| EMG | Electromyography |
| EEG | Electroencephalography |
| DASS | Depression Anxiety Stress Scales |
| VRSMAV | Verbal Rating ScaleMean Absolute Value |
References
- Zarte, M.; Pechmann, A.; Nunes, I.L. Principles for Human-Centered System Design in Industry 4.0—A Systematic Literature Review. In Proceedings of the Advances in Human Factors and Systems Interaction, San Diego, CA, USA, 16–20 July 2020; Nunes, I.L., Ed.; Springer International Publishing: Cham, Switzerland, 2020; pp. 140–147. [Google Scholar]
- Yaris, C.; Ditchburn, G.; Curtis, G.J.; Brook, L. Combining Physical and Psychosocial Safety: A Comprehensive Workplace Safety Model. Saf. Sci. 2020, 132, 104949. [Google Scholar] [CrossRef]
- Anderson, S.P.; Oakman, J. Allied Health Professionals and Work-Related Musculoskeletal Disorders: A Systematic Review. Saf. Health Work 2016, 7, 259–267. [Google Scholar] [CrossRef] [PubMed]
- Antwi-Afari, M.F.; Li, H.; Edwards, D.J.; Pärn, E.A.; Seo, J.; Wong, A.Y.L. Biomechanical Analysis of Risk Factors for Work-Related Musculoskeletal Disorders during Repetitive Lifting Task in Construction Workers. Autom. Constr. 2017, 83, 41–47. [Google Scholar] [CrossRef]
- Eurostat, E.C. Health and Safety at Work in Europe (1999–2007). A Statistical Portrait; Publications Office of the European Union: Luxembourg, 2010. [Google Scholar]
- Chen, D.; Cai, Y.; Cui, J.; Chen, J.; Jiang, H.; Huang, M.-C. Risk Factors Identification and Visualization for Work-Related Musculoskeletal Disorders with Wearable and Connected Gait Analytics System and Kinect Skeleton Models. Smart Health 2018, 7–8, 60–77. [Google Scholar] [CrossRef]
- Antwi-Afari, M.F.; Li, H.; Umer, W.; Yu, Y.; Xing, X. Construction Activity Recognition and Ergonomic Risk Assessment Using a Wearable Insole Pressure System. J. Constr. Eng. Manag. 2020, 146, 4020077. [Google Scholar] [CrossRef]
- Márquez Gómez, M. Prediction of Work-Related Musculoskeletal Discomfort in the Meat Processing Industry Using Statistical Models. Int. J. Ind. Ergon. 2020, 75, 102876. [Google Scholar] [CrossRef]
- Nath, N.D.; Chaspari, T.; Behzadan, A.H. Automated Ergonomic Risk Monitoring Using Body-Mounted Sensors and Machine Learning. Adv. Eng. Inform. 2018, 38, 514–526. [Google Scholar] [CrossRef]
- Marras, W.S. Industrial Electromyography (EMG). Int. J. Ind. Ergon. 1990, 6, 89–93. [Google Scholar] [CrossRef]
- Day, S. Important Factors in Surface EMG Measurement; Bortec Biomedical Publications Ltd.: Calgary, AB, Canada, 2002; pp. 1–17. [Google Scholar]
- Peternel, L.; Tsagarakis, N.; Caldwell, D.; Ajoudani, A. Robot Adaptation to Human Physical Fatigue in Human–Robot Co-Manipulation. Auton. Robot. 2018, 42, 1011–1021. [Google Scholar] [CrossRef]
- Wang, D.; Hu, B.; Dai, F.; Ning, X. Sensor-Based Factorial Experimental Study on Low Back Disorder Risk Factors among. In Proceedings of the International Construction Specialty Conference of the Canadian Society for Civil Engineering (ICSC), Vancouver, BC, Canada, 7–10 June 2015; pp. 238–248. [Google Scholar]
- Salas, E.A.; Vi, P.; Reider, V.L.; Moore, A.E. Factors Affecting the Risk of Developing Lower Back Musculoskeletal Disorders (MSDs) in Experienced and Inexperienced Rodworkers. Appl. Ergon. 2016, 52, 62–68. [Google Scholar] [CrossRef]
- Peppoloni, L.; Filippeschi, A.; Ruffaldi, E.; Avizzano, C.A. A Novel Wearable System for the Online Assessment of Risk for Biomechanical Load in Repetitive Efforts. Int. J. Ind. Ergon. 2016, 52, 1–11. [Google Scholar] [CrossRef]
- Liu, Q.; Liu, Y.; Leng, X.; Han, J.; Xia, F.; Chen, H. Impact of Chronic Stress on Attention Control: Evidence from Behavioral and Event-Related Potential Analyses. Neurosci. Bull. 2020, 36, 1395–1410. [Google Scholar] [CrossRef] [PubMed]
- Yang, J.; Cheng, G.; Zhang, Y.; Covassin, T.; Heiden, E.O.; Peek-Asa, C. Influence of Symptoms of Depression and Anxiety on Injury Hazard among Collegiate American Football Players. Res. Sports Med. 2014, 22, 147–160. [Google Scholar] [CrossRef]
- Haslam, C.; Atkinson, S.; Brown, S.; Haslam, R.A. Perceptions of the Impact of Depression and Anxiety and the Medication for These Conditions on Safety in the Workplace. Occup. Environ. Med. 2005, 62, 538–545. [Google Scholar] [CrossRef] [PubMed]
- Gerasimaviciute, V.; Bültmann, U.; Diamond, P.M.; Tullar, J.M.; Delclos, G.L.; de Porras, D.; Amick III, B.C. Reciprocal Associations between Depression, Anxiety and Work-Related Injury. Inj. Prev. 2020, 26, 529–535. [Google Scholar] [CrossRef]
- Pinupong, C.; Jalayondeja, W.; Mekhora, K.; Bhuanantanondh, P.; Jalayondeja, C. The Effects of Ramp Gradients and Pushing–Pulling Techniques on Lumbar Spinal Load in Healthy Workers. Saf. Health Work 2020, 11, 307–313. [Google Scholar] [CrossRef]
- Seo, N.J.; Sindhu, B.S.; Shechtman, O. Influence of Pain Associated with Musculoskeletal Disorders on Grip Force Timing. J. Hand Ther. 2011, 24, 335–344. [Google Scholar] [CrossRef]
- Seo, N.J.; Armstrong, T.J. Biomechanical Analysis for Handle Stability during Maximum Push and Pull Exertions. Ergonomics 2009, 52, 1568–1575. [Google Scholar] [CrossRef]
- Karwowski, W. The Discipline of Ergonomics and Human Factors. In Handbook of Human Factors and Ergonomy; Wiley: Hoboken, NJ, USA, 2006; Volume 3, pp. 3–31. [Google Scholar]
- Iqbal, M.U.; Srinivasan, B.; Srinivasan, R. Dynamic Assessment of Control Room Operator’s Cognitive Workload Using Electroencephalography (EEG). Comput. Chem. Eng. 2020, 141, 106726. [Google Scholar] [CrossRef]
- Iqbal, M.U.; Shahab, M.A.; Choudhary, M.; Srinivasan, B.; Srinivasan, R. Electroencephalography (EEG) Based Cognitive Measures for Evaluating the Effectiveness of Operator Training. Process Saf. Environ. Prot. 2021, 150, 51–67. [Google Scholar] [CrossRef]
- Lovibond, P.F.; Lovibond, S.H. The Structure of Negative Emotional States: Comparison of the Depression Anxiety Stress Scales (DASS) with the Beck Depression and Anxiety Inventories. Behav. Res. Ther. 1995, 33, 335–343. [Google Scholar] [CrossRef]
- Antony, M.M.; Bieling, P.J.; Cox, B.J.; Enns, M.W.; Swinson, R.P. Psychometric Properties of the 42-Item and 21-Item Versions of the Depression Anxiety Stress Scales in Clinical Groups and a Community Sample. Psychol. Assess. 1998, 10, 176. [Google Scholar] [CrossRef]
- The Serbian adaptation of the DASS scale. Available online: http://www2.psy.unsw.edu.au/Groups/Dass/Serbian/DASS-CYR.pdf (accessed on 25 July 2022).
- Pedersen, K.F.; Alves, G.; Larsen, J.P.; Tysnes, O.-B.; Møller, S.G.; Brønnick, K. Psychometric Properties of the Starkstein Apathy Scale in Patients with Early Untreated Parkinson Disease. Am. J. Geriatr. Psychiatry 2012, 20, 142–148. [Google Scholar] [CrossRef] [PubMed]
- Starkstein, S.E.; Migliorelli, R.; Manes, F.; Tesón, A.; Petracca, G.; Chemerinski, E.; Sabe, L.; Leiguarda, R. The Prevalence and Clinical Correlates of Apathy and Irritability in Alzheimer’s Disease. Eur. J. Neurol. 1995, 2, 540–546. [Google Scholar] [CrossRef]
- Starkstein, S.E.; Jorge, R.; Mizrahi, R. The Prevalence, Clinical Correlates and Treatment of Apathy in Alzheimer’s Disease. Eur. J. Psychiatry 2006, 20, 96–106. [Google Scholar] [CrossRef]
- Konrad, P. The Abc of Emg. A Practical Introduction to Kinesiological Electromyography. Electromyography 2005, 1, 30–35. [Google Scholar]
- Park, H.; Sprince, N.L.; Lewis, M.Q.; Burmeister, L.F.; Whitten, P.S.; Zwerling, C. Risk Factors for Work-Related Injury among Male Farmers in Iowa: A Prospective Cohort Study. J. Occup. Environ. Med. 2001, 43, 542–547. [Google Scholar] [CrossRef]
- Huiyun Xiang MD, M.P.H.; PhD, D.L.S.; BS, Y.C.; BS, A.E. Non-Fatal Agricultural Injuries and Risk Factors Among Colorado Female Farmers. J. Agromedicine 1999, 5, 21–33. [Google Scholar] [CrossRef]
- Hoozemans, M.J.M.; Knelange, E.B.; Frings-Dresen, M.H.W.; Veeger, H.E.J.; Kuijer, P.P.F.M. Are Pushing and Pulling Work-Related Risk Factors for Upper Extremity Symptoms? A Systematic Review of Observational Studies. Occup. Environ. Med. 2014, 71, 788–795. [Google Scholar] [CrossRef]
- Kim, J. Depression as a Psychosocial Consequence of Occupational Injury in the US Working Population: Findings from the Medical Expenditure Panel Survey. BMC Public Health 2013, 13, 303. [Google Scholar] [CrossRef]
- Gu, J.K.; Charles, L.E.; Fekedulegn, D.; Ma, C.C.; Violanti, J.M.; Andrew, M.E. Occupational Injury and Psychological Distress among U.S. Workers: The National Health Interview Survey, 2004–2016. J. Saf. Res. 2020, 74, 207–217. [Google Scholar] [CrossRef] [PubMed]
- Glowinski, S.; Krzyzynski, T.; Bryndal, A.; Maciejewski, I. A Kinematic Model of a Humanoid Lower Limb Exoskeleton with Hydraulic Actuators. Sensors 2020, 20, 6116. [Google Scholar] [CrossRef] [PubMed]
- Mehta, R.K.; Parasuraman, R. Neuroergonomics: A Review of Applications to Physical and Cognitive Work. Front. Hum. Neurosci. 2013, 7, 889. [Google Scholar] [CrossRef] [PubMed]
- Katona, J. Examination and Comparison of the EEG Based Attention Test with CPT and T.O.V.A. In Proceedings of the 2014 IEEE 15th International Symposium on Computational Intelligence and Informatics (CINTI), Budapest, Hungary, 19–21 November 2014; pp. 117–120. [Google Scholar]
- Katona, J.; Kovari, A. The Evaluation of Bci and Pebl-Based Attention Tests. Acta Polytech. Hung. 2018, 15, 225–249. [Google Scholar]
- Kovari, A.; Katona, J.; Costescu, C. Evaluation of Eye-Movement Metrics in a Software Debbuging Task Using Gp3 Eye Tracker. Acta Polytech. Hung 2020, 17, 57–76. [Google Scholar] [CrossRef]
- Katona, J. Analyse the Readability of LINQ Code Using an Eye-Tracking-Based Evaluation. Acta Polytech. Hung 2021, 18, 193–215. [Google Scholar] [CrossRef]
- Vukicevic, A.M.; Djapan, M.; Stefanovic, M.; Macuzic, I. SafE-Tag Mobile: A Novel Javascript Framework for Real-Time Management of Unsafe Conditions and Unsafe Acts in SMEs. Saf. Sci. 2019, 120, 507–516. [Google Scholar] [CrossRef]
- Vukicevic, A.M.; Djapan, M.; Isailovic, V.; Milasinovic, D.; Savkovic, M.; Milosevic, P. Generic Compliance of Industrial PPE by Using Deep Learning Techniques. Saf. Sci. 2022, 148, 105646. [Google Scholar] [CrossRef]
- Vukicevic, A.M.; Djapan, M.; Todorovic, P.; Erić, M.; Stefanovic, M.; Macuzic, I. Decision Support System for Dimensional Inspection of Extruded Rubber Profiles. IEEE Access 2019, 7, 112605–112616. [Google Scholar] [CrossRef]
- Vukićević, A.; Mladineo, M.; Banduka, N.; Mačužić, I. A Smart Warehouse 4.0 Approach for the Pallet Management Using Machine Vision and Internet of Things (IoT): A Real Industrial Case Study. Adv. Prod. Eng. Manag. 2021, 16, 297–306. [Google Scholar]
- Petrovic, M.; Vukicevic, A.M.; Lukic, B.; Jovanovic, K. Assessment of the Human-Robot Collaborative Polishing Task by Using EMG Sensors and 3D Pose Estimation. In Proceedings of the Advances in Service and Industrial Robotics; RAAD 2022; Müller, A., Brandstötter, M., Eds.; Springer International Publishing: Klagenfurt am Wörthersee, Austria, 2022; pp. 564–570. [Google Scholar] [CrossRef]
- Savković, M.; Caiazzo, C.; Djapan, M.; Vukićević, A.M.; Pušica, M.; Mačužić, I. Development of Modular and Adaptive Laboratory Set-Up for Neuroergonomic and Human-Robot Interaction Research. Front. Neurorobot. 2022, 16, 1–13. [Google Scholar] [CrossRef] [PubMed]


Publisher’s Note: MDPI stays neutral with regard to jurisdictional claims in published maps and institutional affiliations. |
© 2022 by the authors. Licensee MDPI, Basel, Switzerland. This article is an open access article distributed under the terms and conditions of the Creative Commons Attribution (CC BY) license (https://creativecommons.org/licenses/by/4.0/).