
Monitoring Argon L-Shell Auger Decay Using 250-eV Attosecond X-ray Pulses †

Abstract
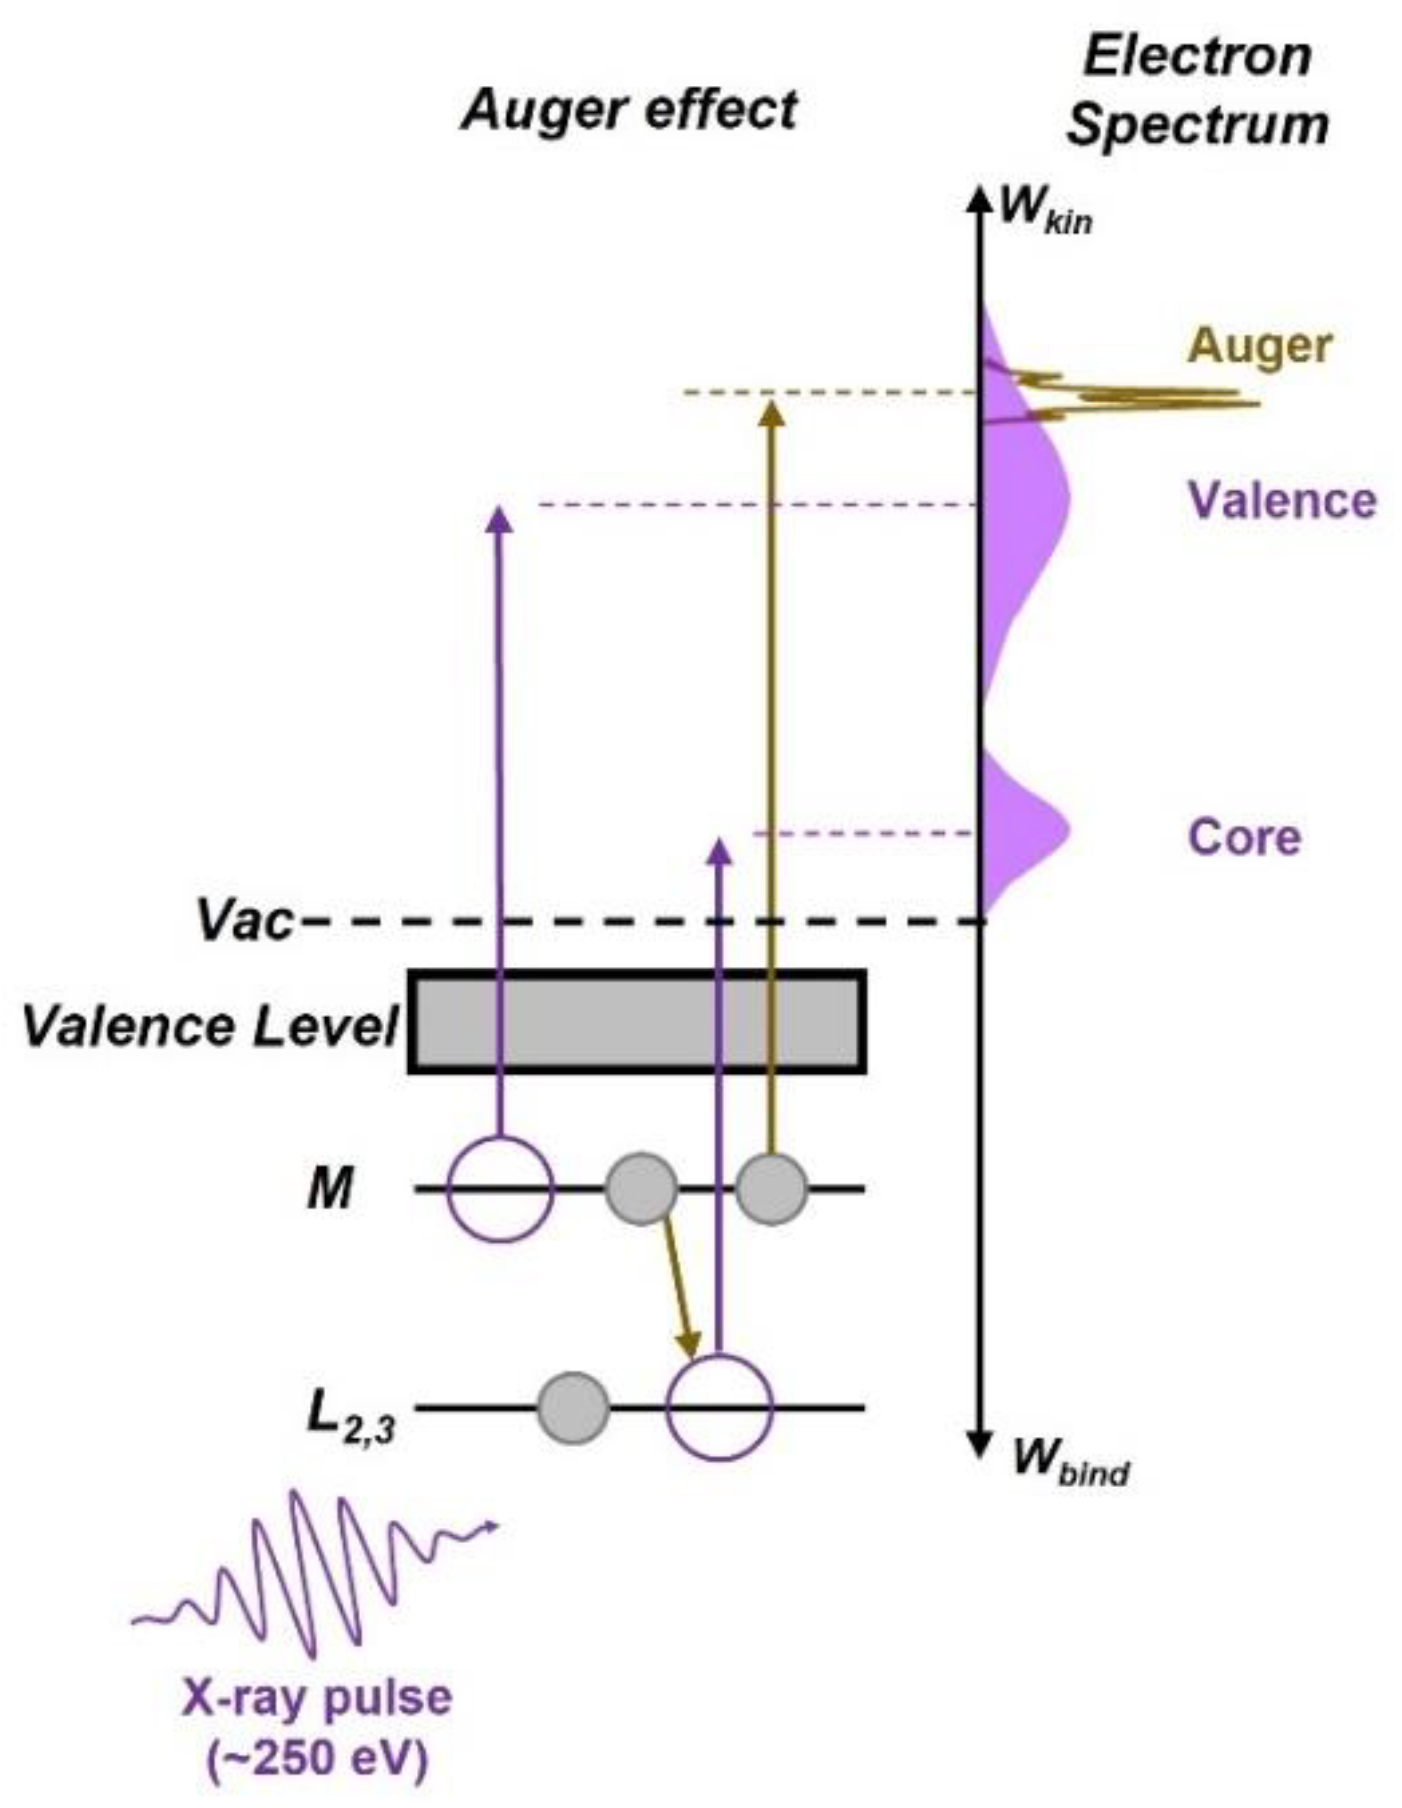
:1. Introduction
2. Materials and Methods
2.1. Theoretical Model
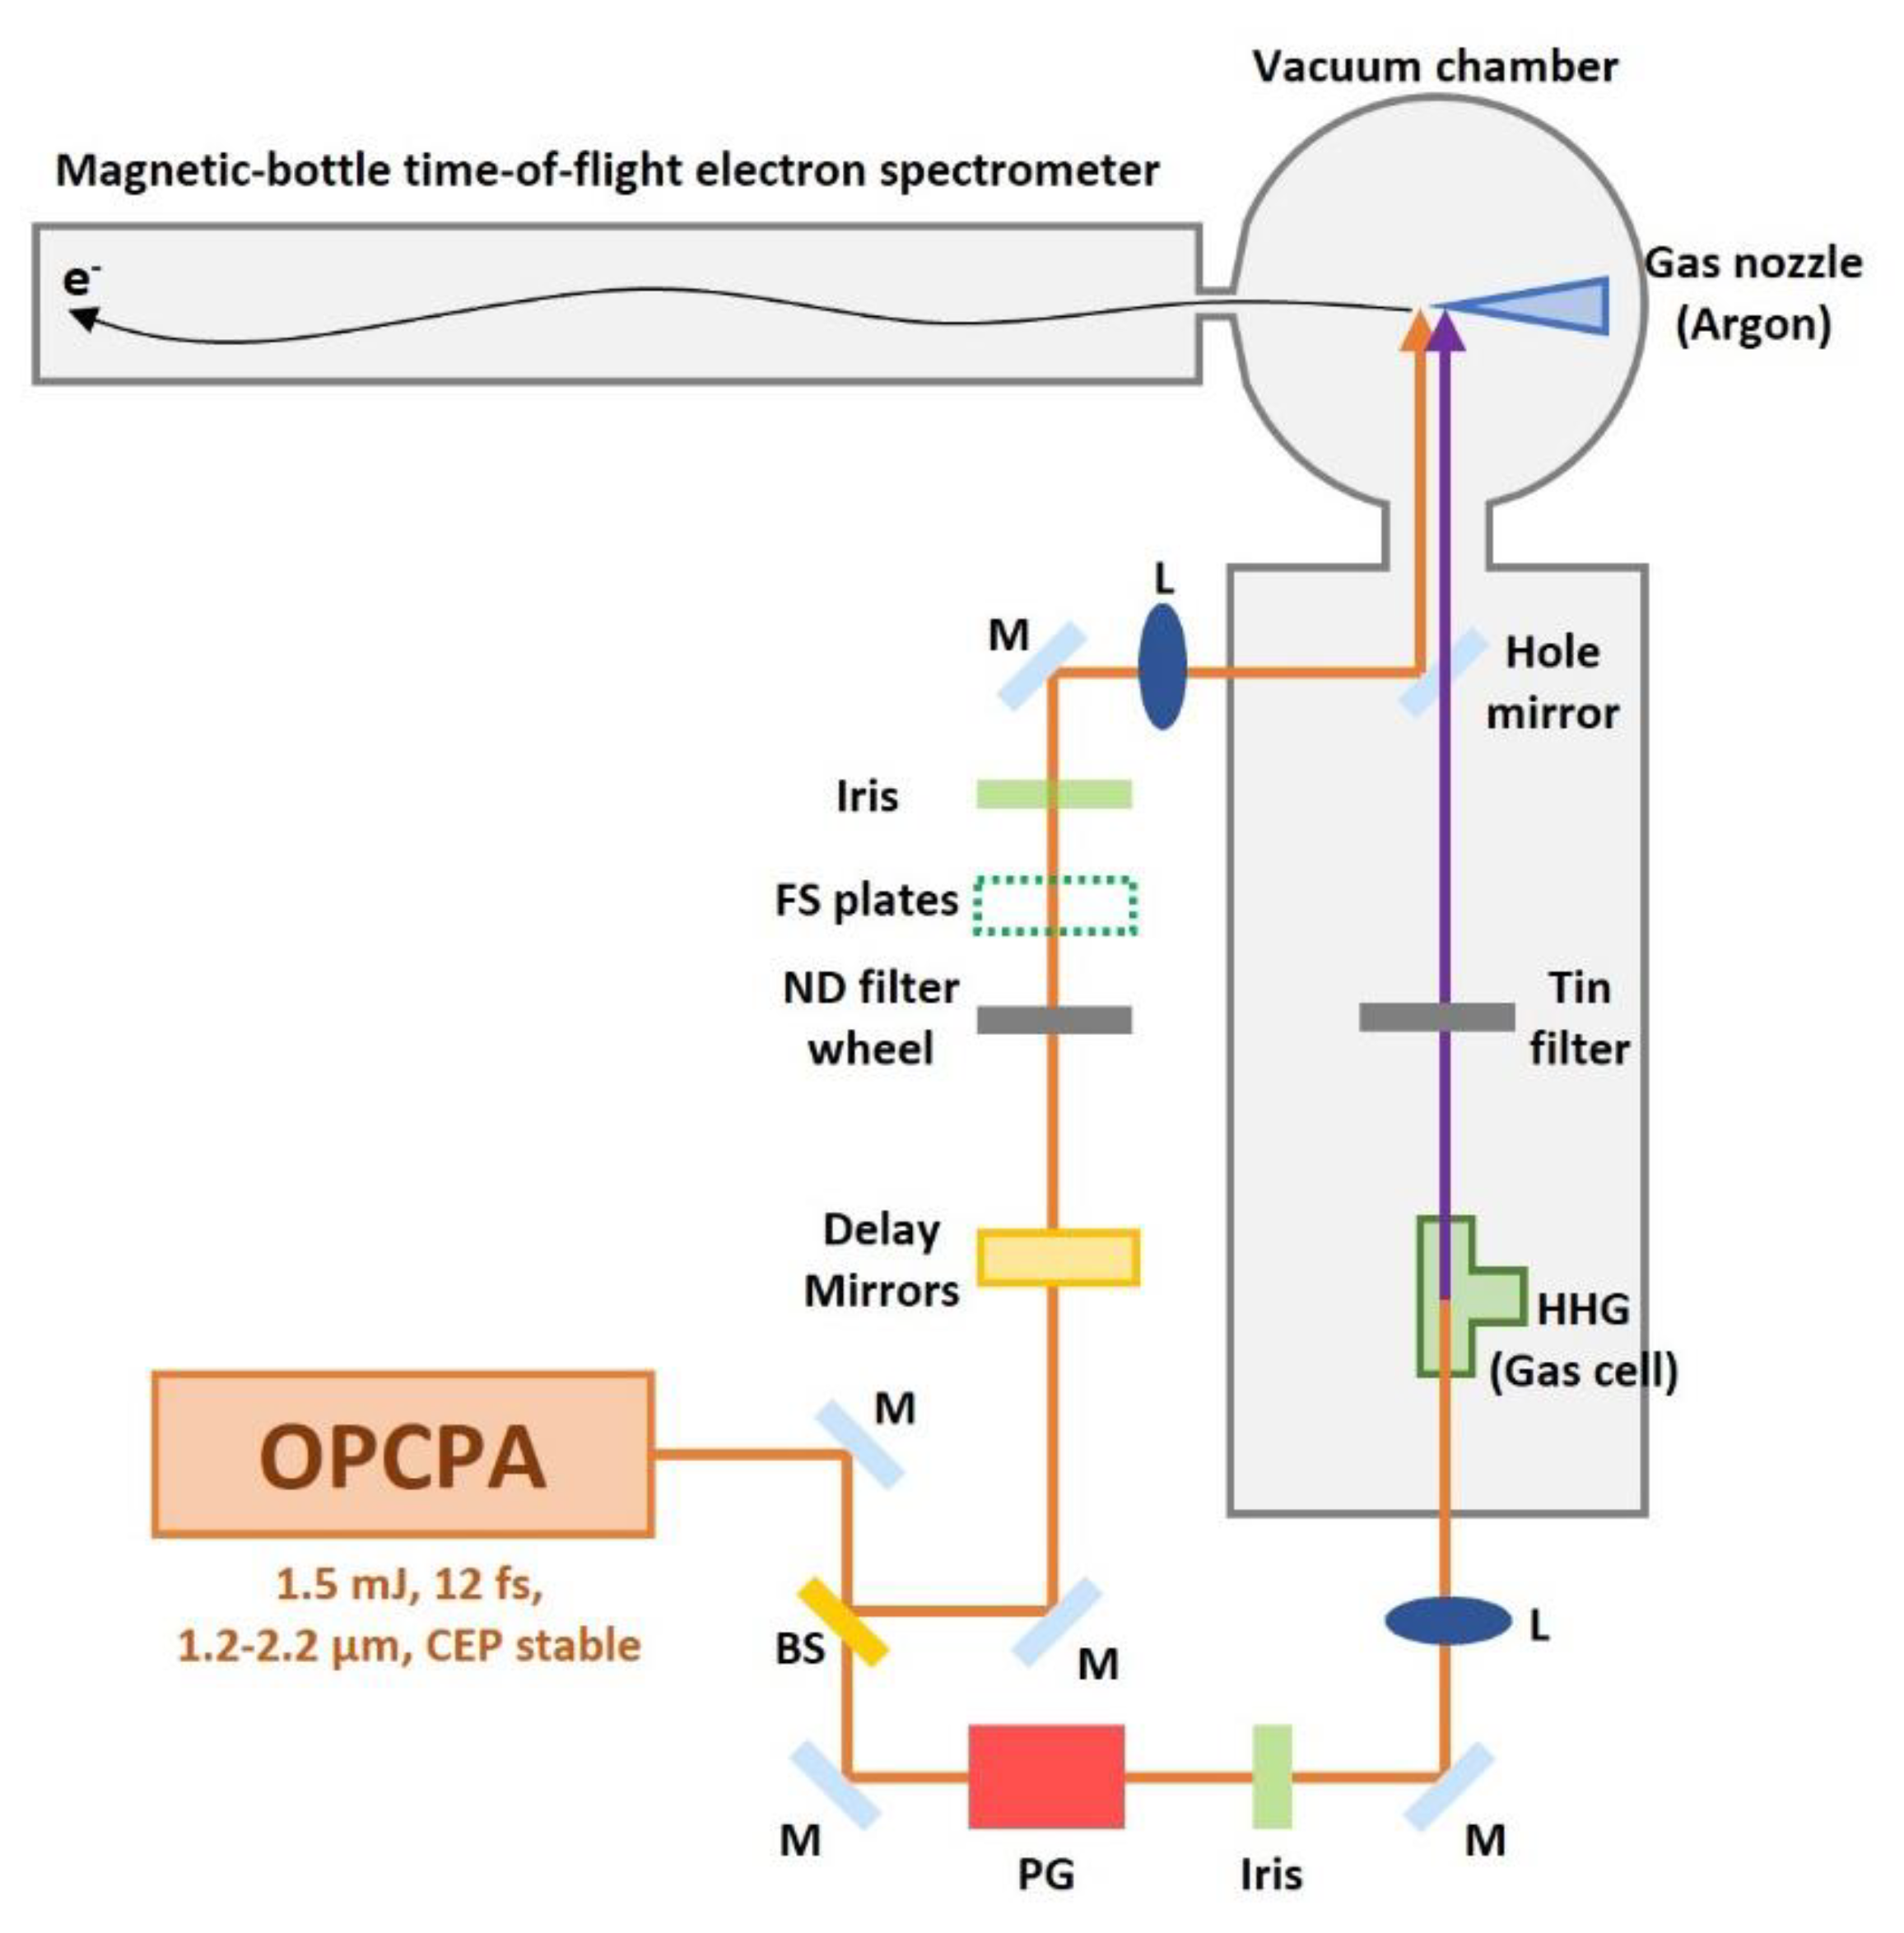
2.2. Experimental Setup
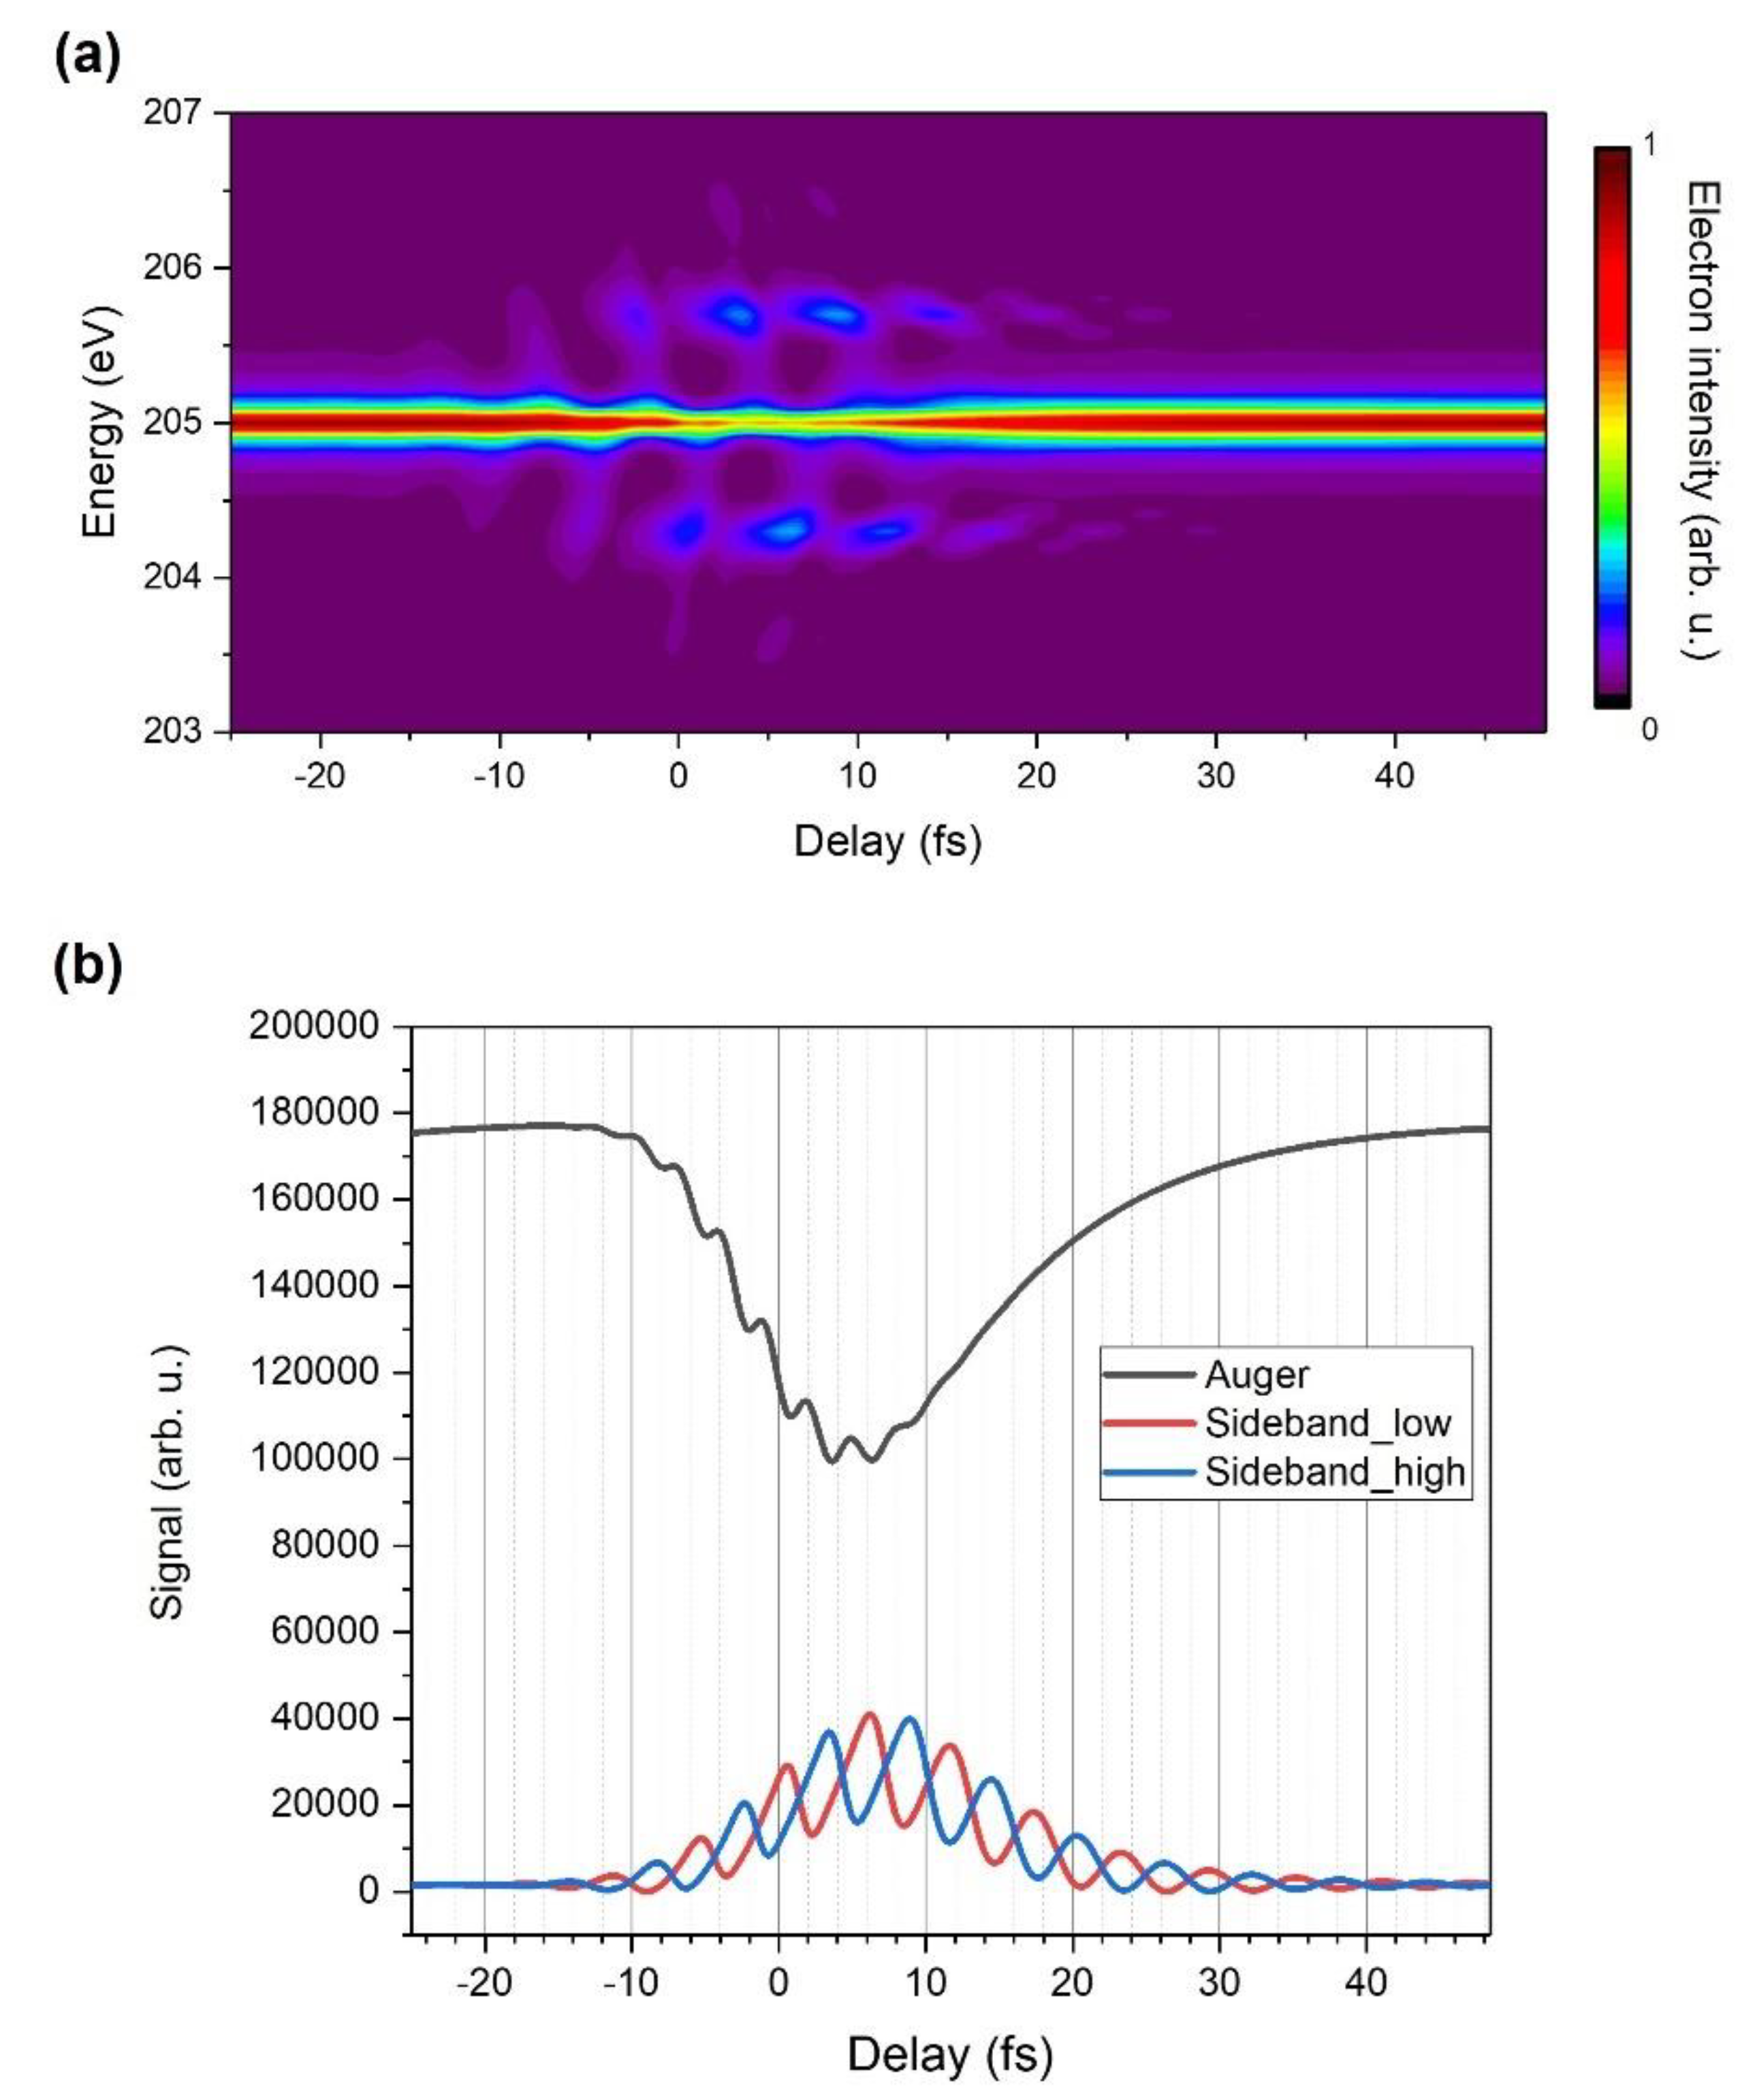
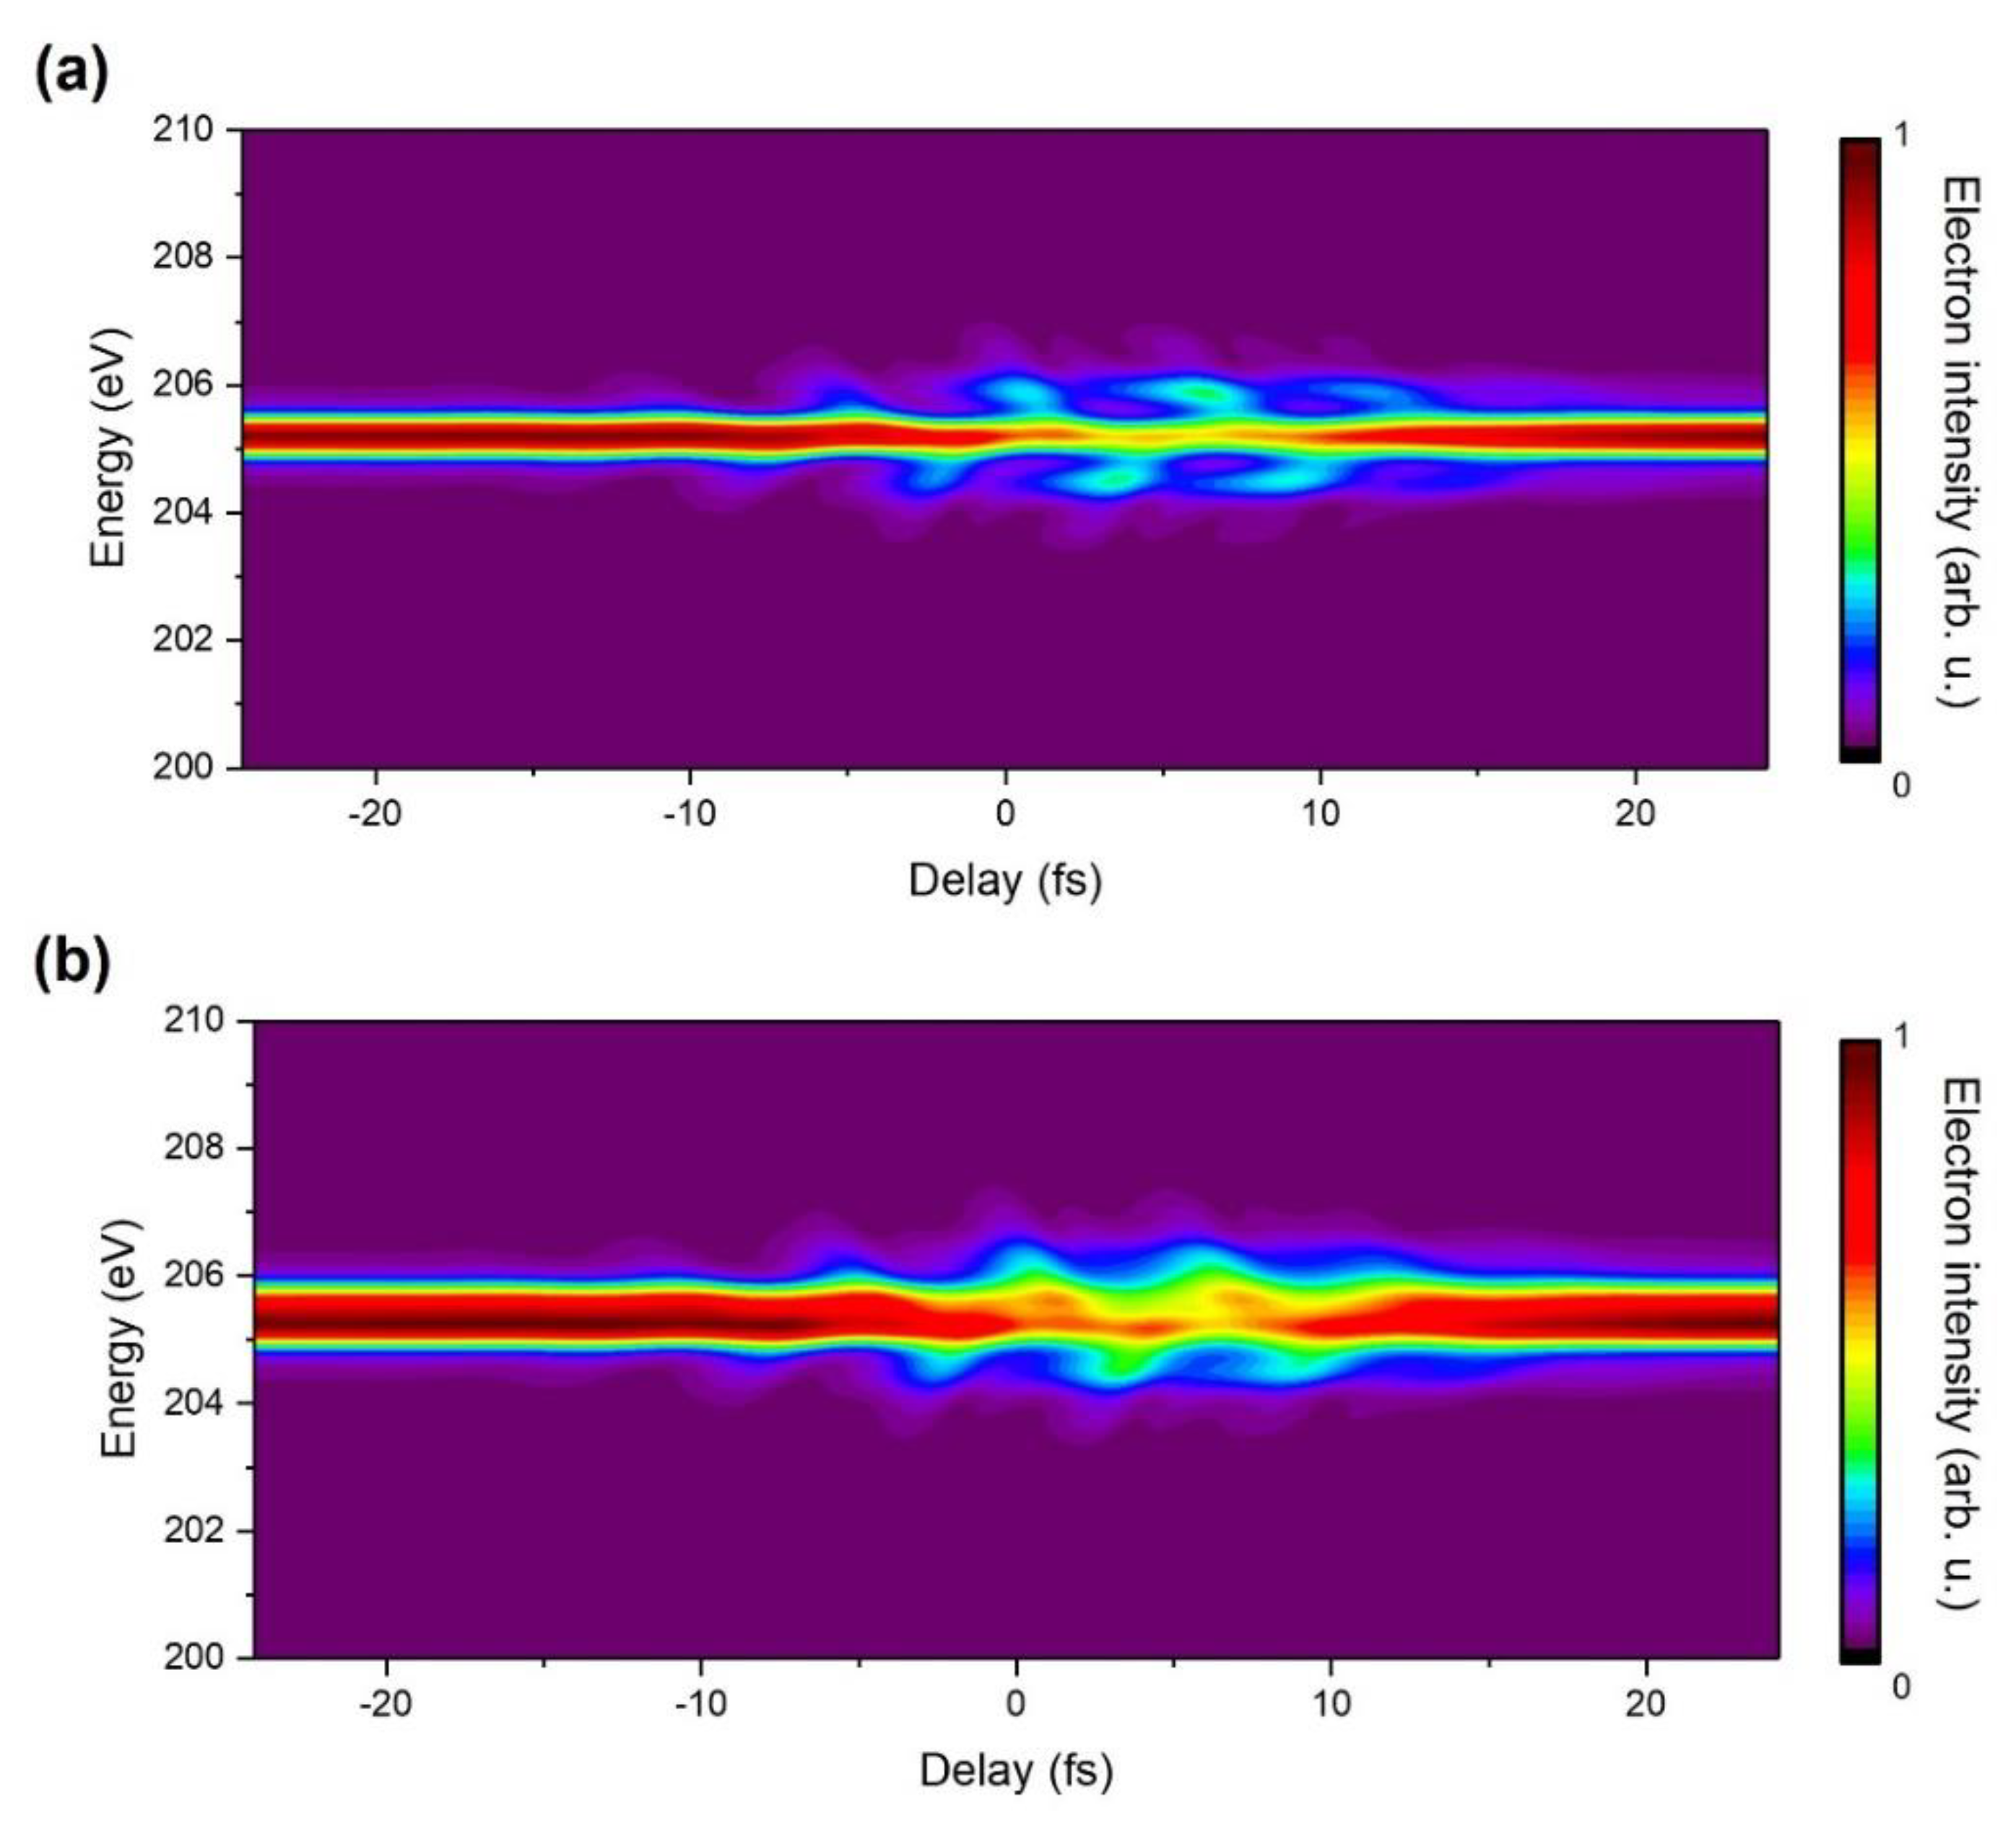
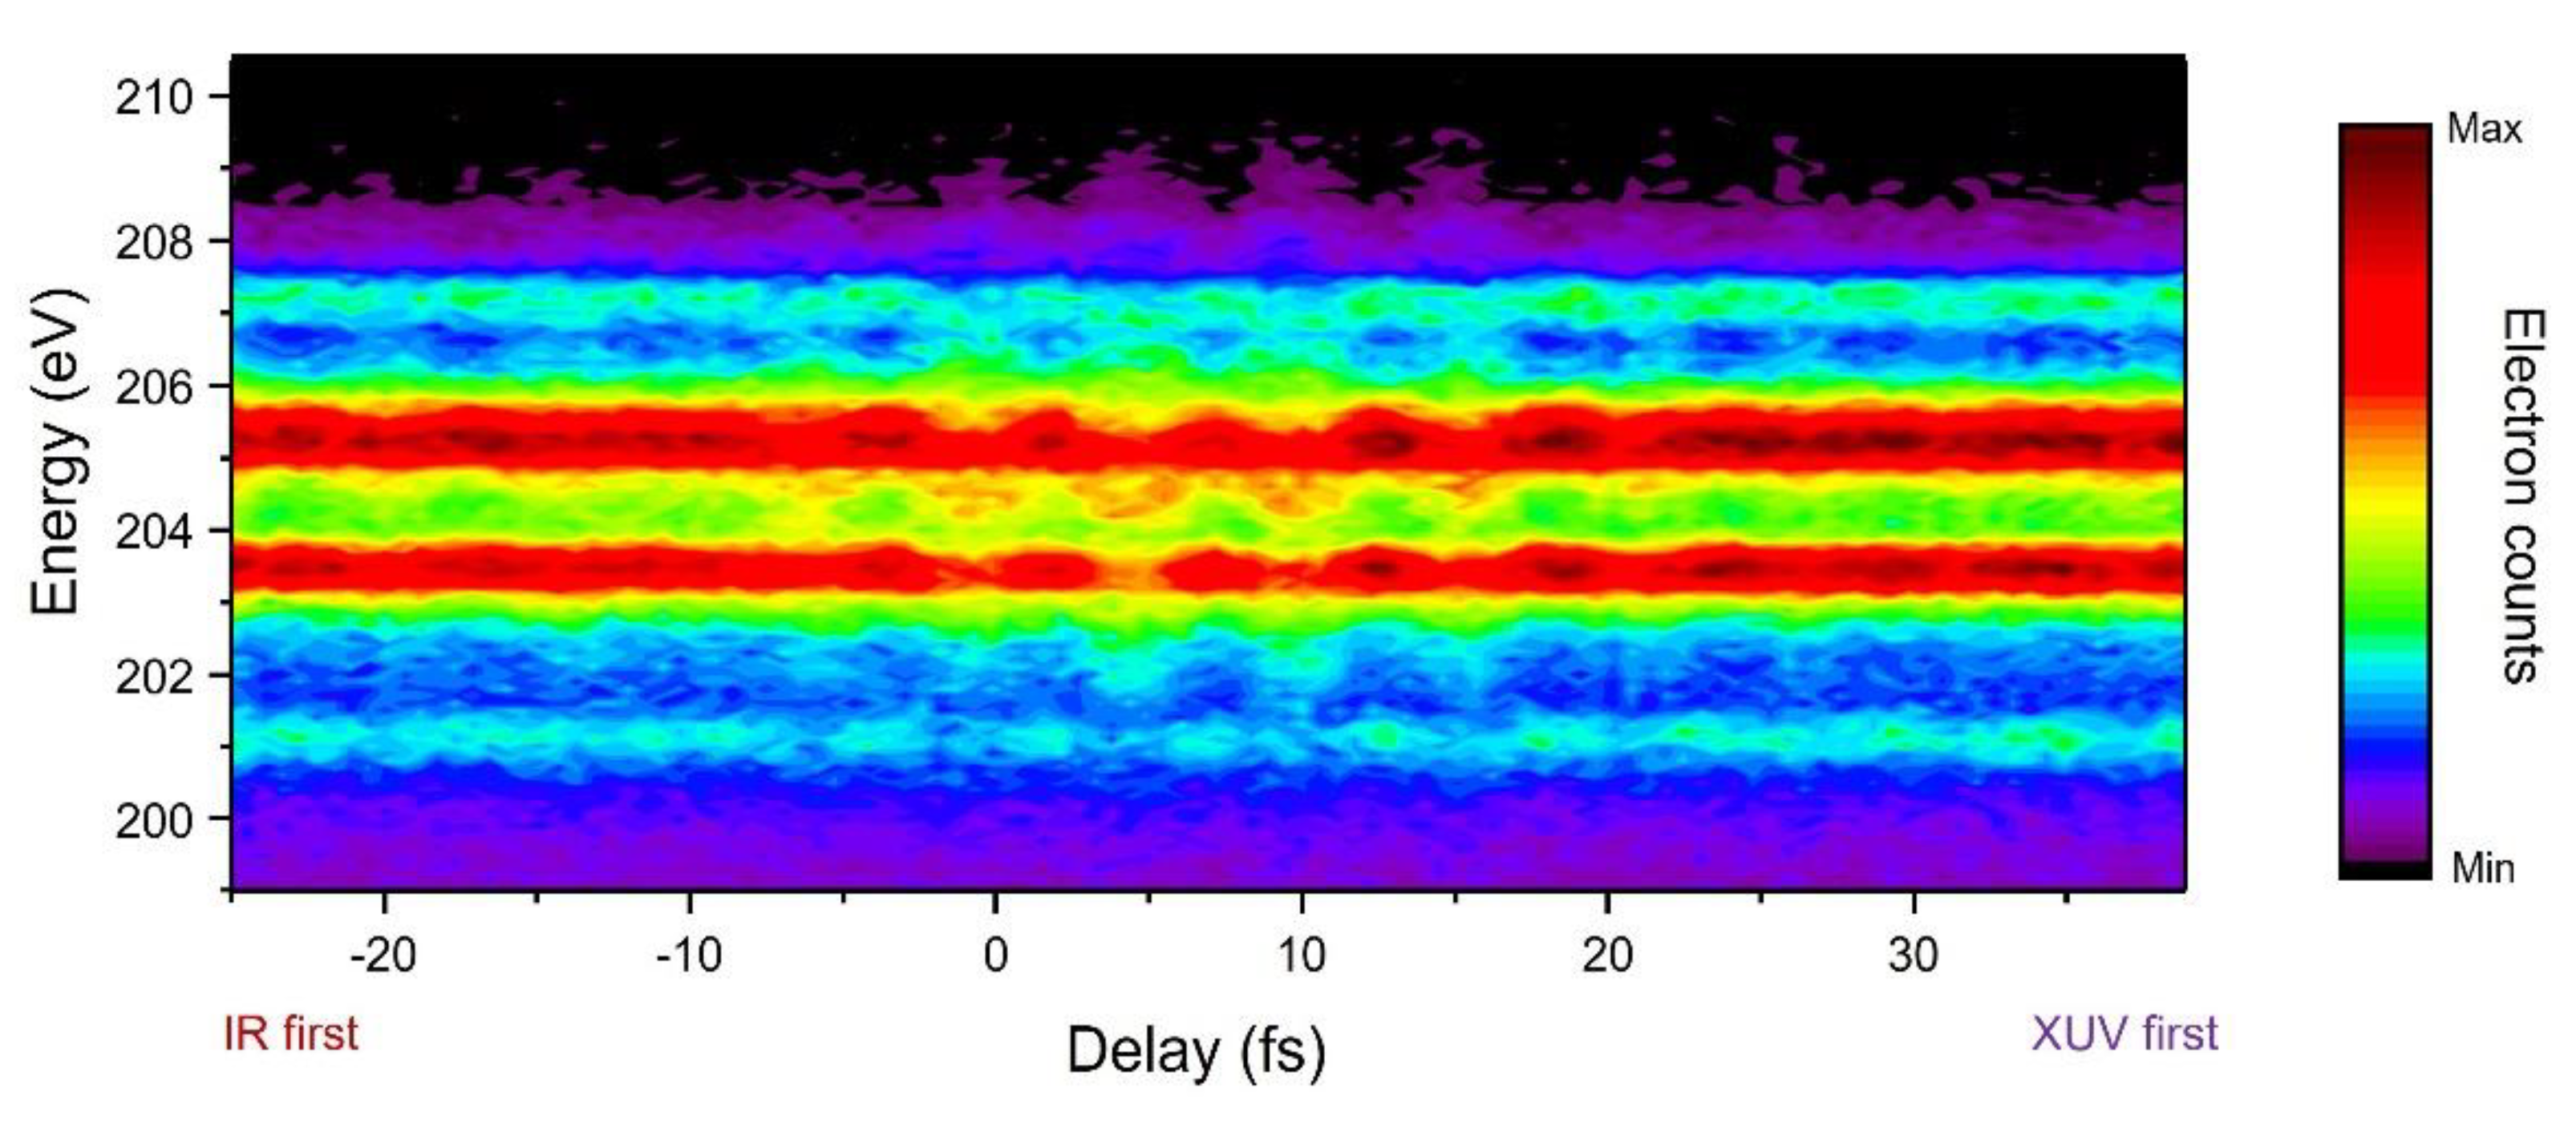
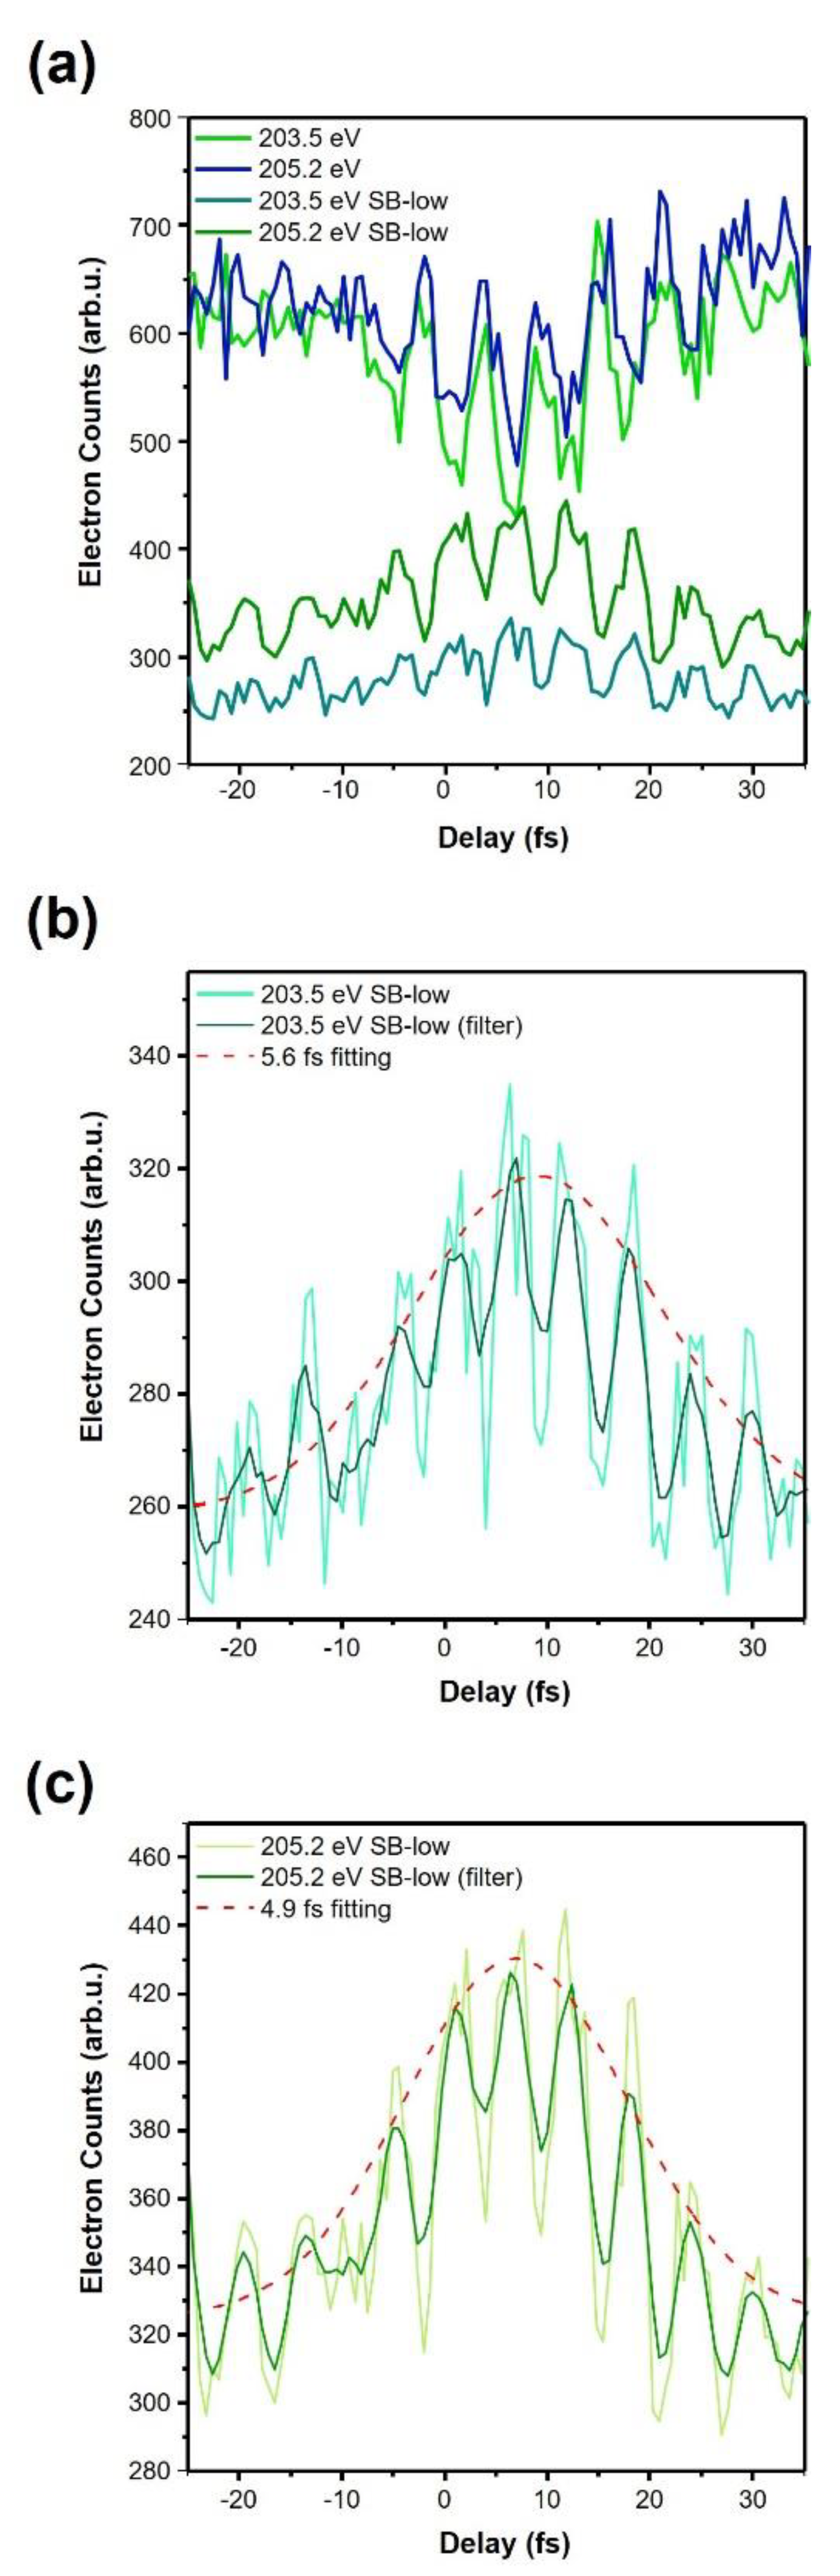
3. Results and Discussion
4. Conclusions
Author Contributions
Funding
Institutional Review Board Statement
Informed Consent Statement
Data Availability Statement
Acknowledgments
Conflicts of Interest
References
- Zewail, A.H. Femtochemistry: Atomic-Scale Dynamics of the Chemical Bond Using Ultrafast Lasers (Nobel Lecture). In Femtochemistry; Wiley-VCH Verlag GmbH: Weinheim, Germany, 2003; pp. 1–85. [Google Scholar]
- Bromage, J.; Stroud, C.R. Excitation of a three-dimensionally localized atomic electron wave packet. Phys. Rev. Lett. 1999, 83, 4963–4966. [Google Scholar] [CrossRef] [Green Version]
- Hentschel, M.; Kienberger, R.; Spielmann, C.; Reider, G.A.; Milosevic, N.; Brabec, T.; Corkum, P.; Heinzmann, U.; Drescher, M.; Krausz, F. Attosecond metrology. Nature 2001, 414, 509–513. [Google Scholar] [CrossRef] [PubMed]
- Kienberger, R.; Hentschel, M.; Uiberacker, M.; Spielmann, C.; Kitzler, M.; Scrinzi, A.; Wieland, M.; Westerwalbesloh, T.; Kleineberg, U.; Heinzmann, U.; et al. Steering attosecond electron wave packets with light. Science 2002, 297, 1144–1148. [Google Scholar] [CrossRef] [PubMed]
- Itatani, J.; Quéré, F.; Yudin, G.L.; Ivanov, M.Y.; Krausz, F.; Corkum, P.B. Attosecond Streak Camera. Phys. Rev. Lett. 2002, 88, 173903. [Google Scholar] [CrossRef] [PubMed] [Green Version]
- Goulielmakis, E.; Loh, Z.-H.; Wirth, A.; Santra, R.; Rohringer, N.; Yakovlev, V.S.; Zherebtsov, S.; Pfeifer, T.; Azzeer, A.M.; Kling, M.F.; et al. Real-time observation of valence electron motion. Nature 2010, 466, 739–743. [Google Scholar] [CrossRef]
- Ossiander, M.; Siegrist, F.; Shirvanyan, V.; Pazourek, R.; Sommer, A.; Latka, T.; Guggenmos, A.; Nagele, S.; Feist, J.; Burgdörfer, J.; et al. Attosecond correlation dynamics. Nat. Phys. 2017, 13, 280–285. [Google Scholar] [CrossRef]
- Krausz, F. Tracking Light Oscillations: Attosecond Spectroscopy Comes of Age. Opt. Photonics News 2002, 13, 62. [Google Scholar] [CrossRef]
- Saito, N.; Sannohe, H.; Ishii, N.; Kanai, T.; Kosugi, N.; Wu, Y.; Chew, A.; Han, S.; Chang, Z.; Itatani, J. Real-time observation of electronic, vibrational, and rotational dynamics in nitric oxide with attosecond soft x-ray pulses at 400 eV. Optica 2019, 6, 1542. [Google Scholar] [CrossRef] [Green Version]
- Wang, H.; Chini, M.; Chen, S.; Zhang, C.-H.; He, F.; Cheng, Y.; Wu, Y.; Thumm, U.; Chang, Z. Attosecond Time-Resolved Autoionization of Argon. Phys. Rev. Lett. 2010, 105, 143002. [Google Scholar] [CrossRef]
- Li, J.; Ren, X.; Yin, Y.; Cheng, Y.; Cunningham, E.; Wu, Y.; Chang, Z. Polarization gating of high harmonic generation in the water window. Appl. Phys. Lett. 2016, 108, 231102. [Google Scholar] [CrossRef]
- Li, J.; Ren, X.; Yin, Y.; Zhao, K.; Chew, A.; Cheng, Y.; Cunningham, E.; Wang, Y.; Hu, S.; Wu, Y.; et al. 53-attosecond X-ray pulses reach the carbon K-edge. Nat. Commun. 2017, 8, 186. [Google Scholar] [CrossRef] [PubMed] [Green Version]
- Ren, X.; Li, J.; Yin, Y.; Zhao, K.; Chew, A.; Wang, Y.; Hu, S.; Cheng, Y.; Cunningham, E.; Wu, Y.; et al. Attosecond light sources in the water window. J. Opt. 2018, 20, 023001. [Google Scholar] [CrossRef]
- Lewenstein, M.; Balcou, P.; Ivanov, M.Y.; L′Huillier, A.; Corkum, P.B. Theory of high-harmonic generation by low-frequency laser fields. Phys. Rev. A 1994, 49, 2117–2132. [Google Scholar] [CrossRef] [PubMed]
- Chang, Z.; Corkum, P. Attosecond photon sources: The first decade and beyond [Invited]. J. Opt. Soc. Am. B 2010, 27, B9. [Google Scholar] [CrossRef] [Green Version]
- Goulielmakis, E.; Schultze, M.; Hofstetter, M.; Yakovlev, V.S.; Gagnon, J.; Uiberacker, M.; Aquila, A.L.; Gullikson, E.M.; Attwood, D.T.; Kienberger, R.; et al. Single-cycle nonlinear optics. Science 2008, 320, 1614–1617. [Google Scholar] [CrossRef] [Green Version]
- Sola, I.J.; Mével, E.; Elouga, L.; Constant, E.; Strelkov, V.; Poletto, L.; Villoresi, P.; Benedetti, E.; Caumes, J.P.; Stagira, S.; et al. Controlling attosecond electron dynamics by phase-stabilized polarization gating. Nat. Phys. 2006, 2, 319–322. [Google Scholar] [CrossRef]
- Chang, Z. Attosecond chirp compensation in water window by plasma dispersion. Opt. Express 2018, 26, 33238. [Google Scholar] [CrossRef]
- Chang, Z. Compensating chirp of attosecond X-ray pulses by a neutral hydrogen gas. OSA Contin. 2019, 2, 314. [Google Scholar] [CrossRef]
- Gaumnitz, T.; Jain, A.; Pertot, Y.; Huppert, M.; Jordan, I.; Ardana-Lamas, F.; Wörner, H.J. Streaking of 43-attosecond soft-X-ray pulses generated by a passively CEP-stable mid-infrared driver. Opt. Express 2017, 25, 27506. [Google Scholar] [CrossRef]
- Drescher, M.; Hentschel, M.; Kienberger, R.; Uiberacker, M.; Yakovlev, V.; Scrinzi, A.; Westerwalbesloh, T.; Kleineberg, U.; Heinzmann, U.; Krausz, F. Time-resolved atomic inner-shell spectroscopy. Nature 2002, 419, 803–807. [Google Scholar] [CrossRef]
- Verhoef, A.J.; Mitrofanov, A.V.; Nguyen, X.T.; Krikunova, M.; Fritzsche, S.; Kabachnik, N.M.; Drescher, M.; Baltuška, A. Time-and-energy-resolved measurement of Auger cascades following Kr 3d excitation by attosecond pulses. New J. Phys. 2011, 13, 113003. [Google Scholar] [CrossRef] [Green Version]
- Han, S.; Xu, P.; Wang, Y.; Zhao, K.; Chang, Z. Streaking of Argon L-shell Auger emissions with >250 eV attosecond X-ray pulses. In Proceedings of the Conference on Lasers and Electro-Optics; OSA: Washington, DC, USA, 2019. paper FF3C.4.. [Google Scholar]
- Werme, L.O.; Bergmark, T.; Siegbahn, K. The L 2,3 MM Auger Spectrum of Argon. Phys. Scr. 1973, 8, 149–153. [Google Scholar] [CrossRef]
- Kitzler, M.; Milosevic, N.; Scrinzi, A.; Krausz, F.; Brabec, T. Quantum Theory of Attosecond XUV Pulse Measurement by Laser Dressed Photoionization. Phys. Rev. Lett. 2002, 88, 173904. [Google Scholar] [CrossRef]
- Yin, Y.; Li, J.; Ren, X.; Zhao, K.; Wu, Y.; Cunningham, E.; Chang, Z. High-efficiency optical parametric chirped-pulse amplifier in BiB_3O_6 for generation of 3 mJ, two-cycle, carrier-envelope-phase-stable pulses at 1.7 μm. Opt. Lett. 2016, 41, 1142. [Google Scholar] [CrossRef]
- Fuji, T.; Apolonski, A.; Krausz, F. Self-stabilization of carrier-envelope offset phase by use of difference-frequency generation. Opt. Lett. 2004, 29, 632. [Google Scholar] [CrossRef] [PubMed]
- Tournois, P. Acousto-optic programmable dispersive filter for adaptive compensation of group delay time dispersion in laser systems. Opt. Commun. 1997, 140, 245–249. [Google Scholar] [CrossRef]
- Zhang, Q.; Zhao, K.; Chang, Z. High resolution electron spectrometers for characterizing the contrast of isolated 25 as pulses. J. Electron Spectros. Relat. Phenom. 2014, 195, 48–54. [Google Scholar] [CrossRef]
- Jurvansuu, M.; Kivimäki, A.; Aksela, S. Inherent lifetime widths of Ar 2p−1, Kr 3d−1, Xe 3d−1, and Xe 4d−1 states. Phys. Rev. A 2001, 64, 012502. [Google Scholar] [CrossRef]


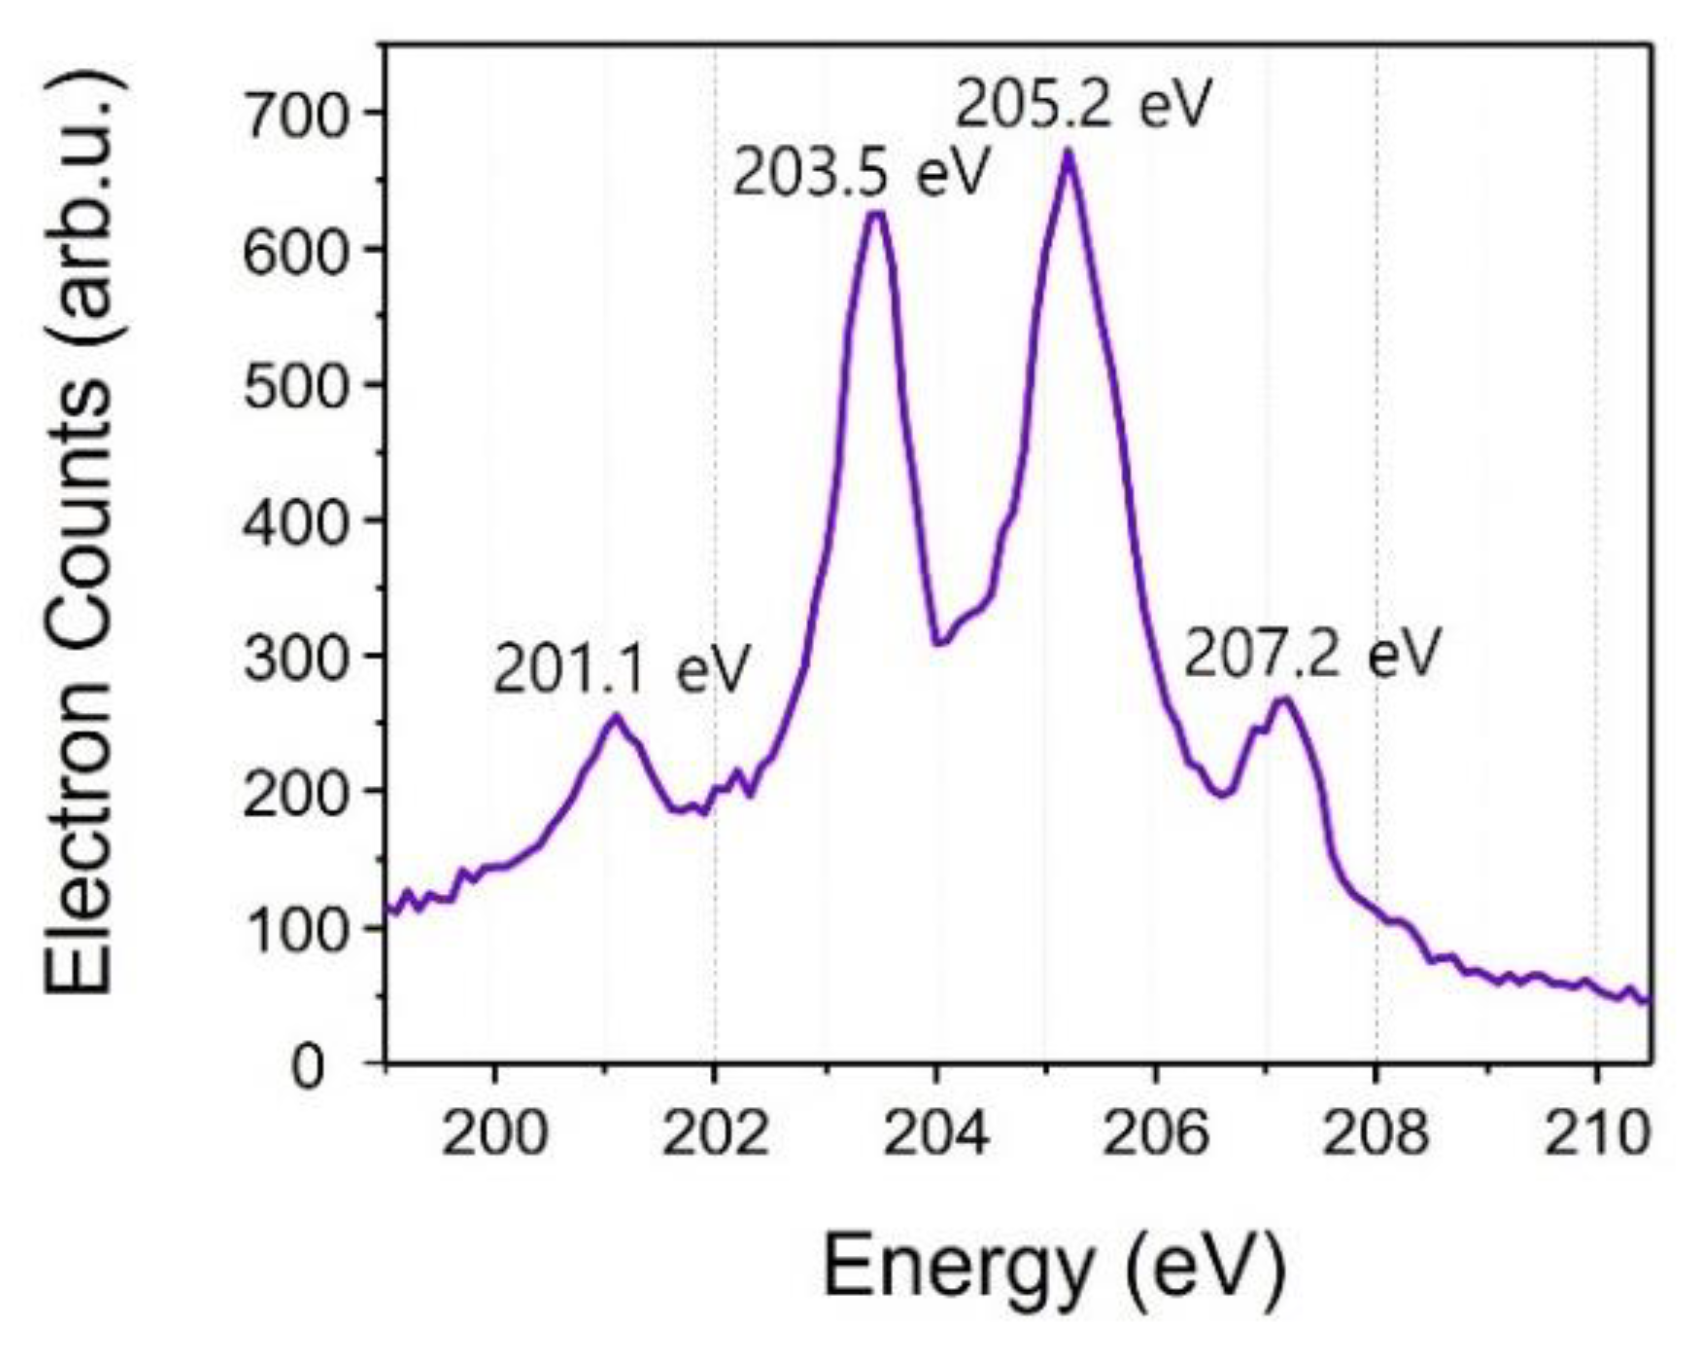
| Kinetic Energy of Argon Auger Peak (eV) | Assignments | Relative Intensity (arb. u.) |
|---|---|---|
| 201.09 | L3M2,3M2,3(1S0) | 100 |
| 203.23 | L2M2,3M2,3(1S0) | 55 |
| 203.47 | L3M2,3M2,3(1D2) | 270 |
| 205.21 | L3M2,3M2,3(3P0,1,2) | 272 |
| 205.62 | L2M2,3M2,3(1D2) | 183 |
| 207.23 | L2M2,3M2,3(3P0,1,2) | 139 |
Publisher’s Note: MDPI stays neutral with regard to jurisdictional claims in published maps and institutional affiliations. |
© 2022 by the authors. Licensee MDPI, Basel, Switzerland. This article is an open access article distributed under the terms and conditions of the Creative Commons Attribution (CC BY) license (https://creativecommons.org/licenses/by/4.0/).
Share and Cite
Han, S.; Zhao, K.; Chang, Z. Monitoring Argon L-Shell Auger Decay Using 250-eV Attosecond X-ray Pulses. Sensors 2022, 22, 7513. https://doi.org/10.3390/s22197513
Han S, Zhao K, Chang Z. Monitoring Argon L-Shell Auger Decay Using 250-eV Attosecond X-ray Pulses. Sensors. 2022; 22(19):7513. https://doi.org/10.3390/s22197513
Chicago/Turabian StyleHan, Seunghwoi, Kun Zhao, and Zenghu Chang. 2022. "Monitoring Argon L-Shell Auger Decay Using 250-eV Attosecond X-ray Pulses" Sensors 22, no. 19: 7513. https://doi.org/10.3390/s22197513