
Clothing Insulation Rate and Metabolic Rate Estimation for Individual Thermal Comfort Assessment in Real Life


Abstract
1. Introduction
- The method inventively adapts state-of-the-art computer vision solutions to the thermal comfort domain, achieving a contactless approach that can be employed in multi-person real-life applications.
- The method can detect and track each person, at the same time recognizing his or her clothing status (long-sleeved, short-sleeved) and key posture (sitting, standing).
- The method can further output a person’s skin temperature and clothes temperature, based on which his or her is estimated.
- The method proposes three useful features from a person’s bounding box tracked across time. These features can category the person’s activity into a certain intensity level which indicates the M.
2. Related Work
2.1. and M Estimation
2.2. Detection and Tracking
3. Methodology
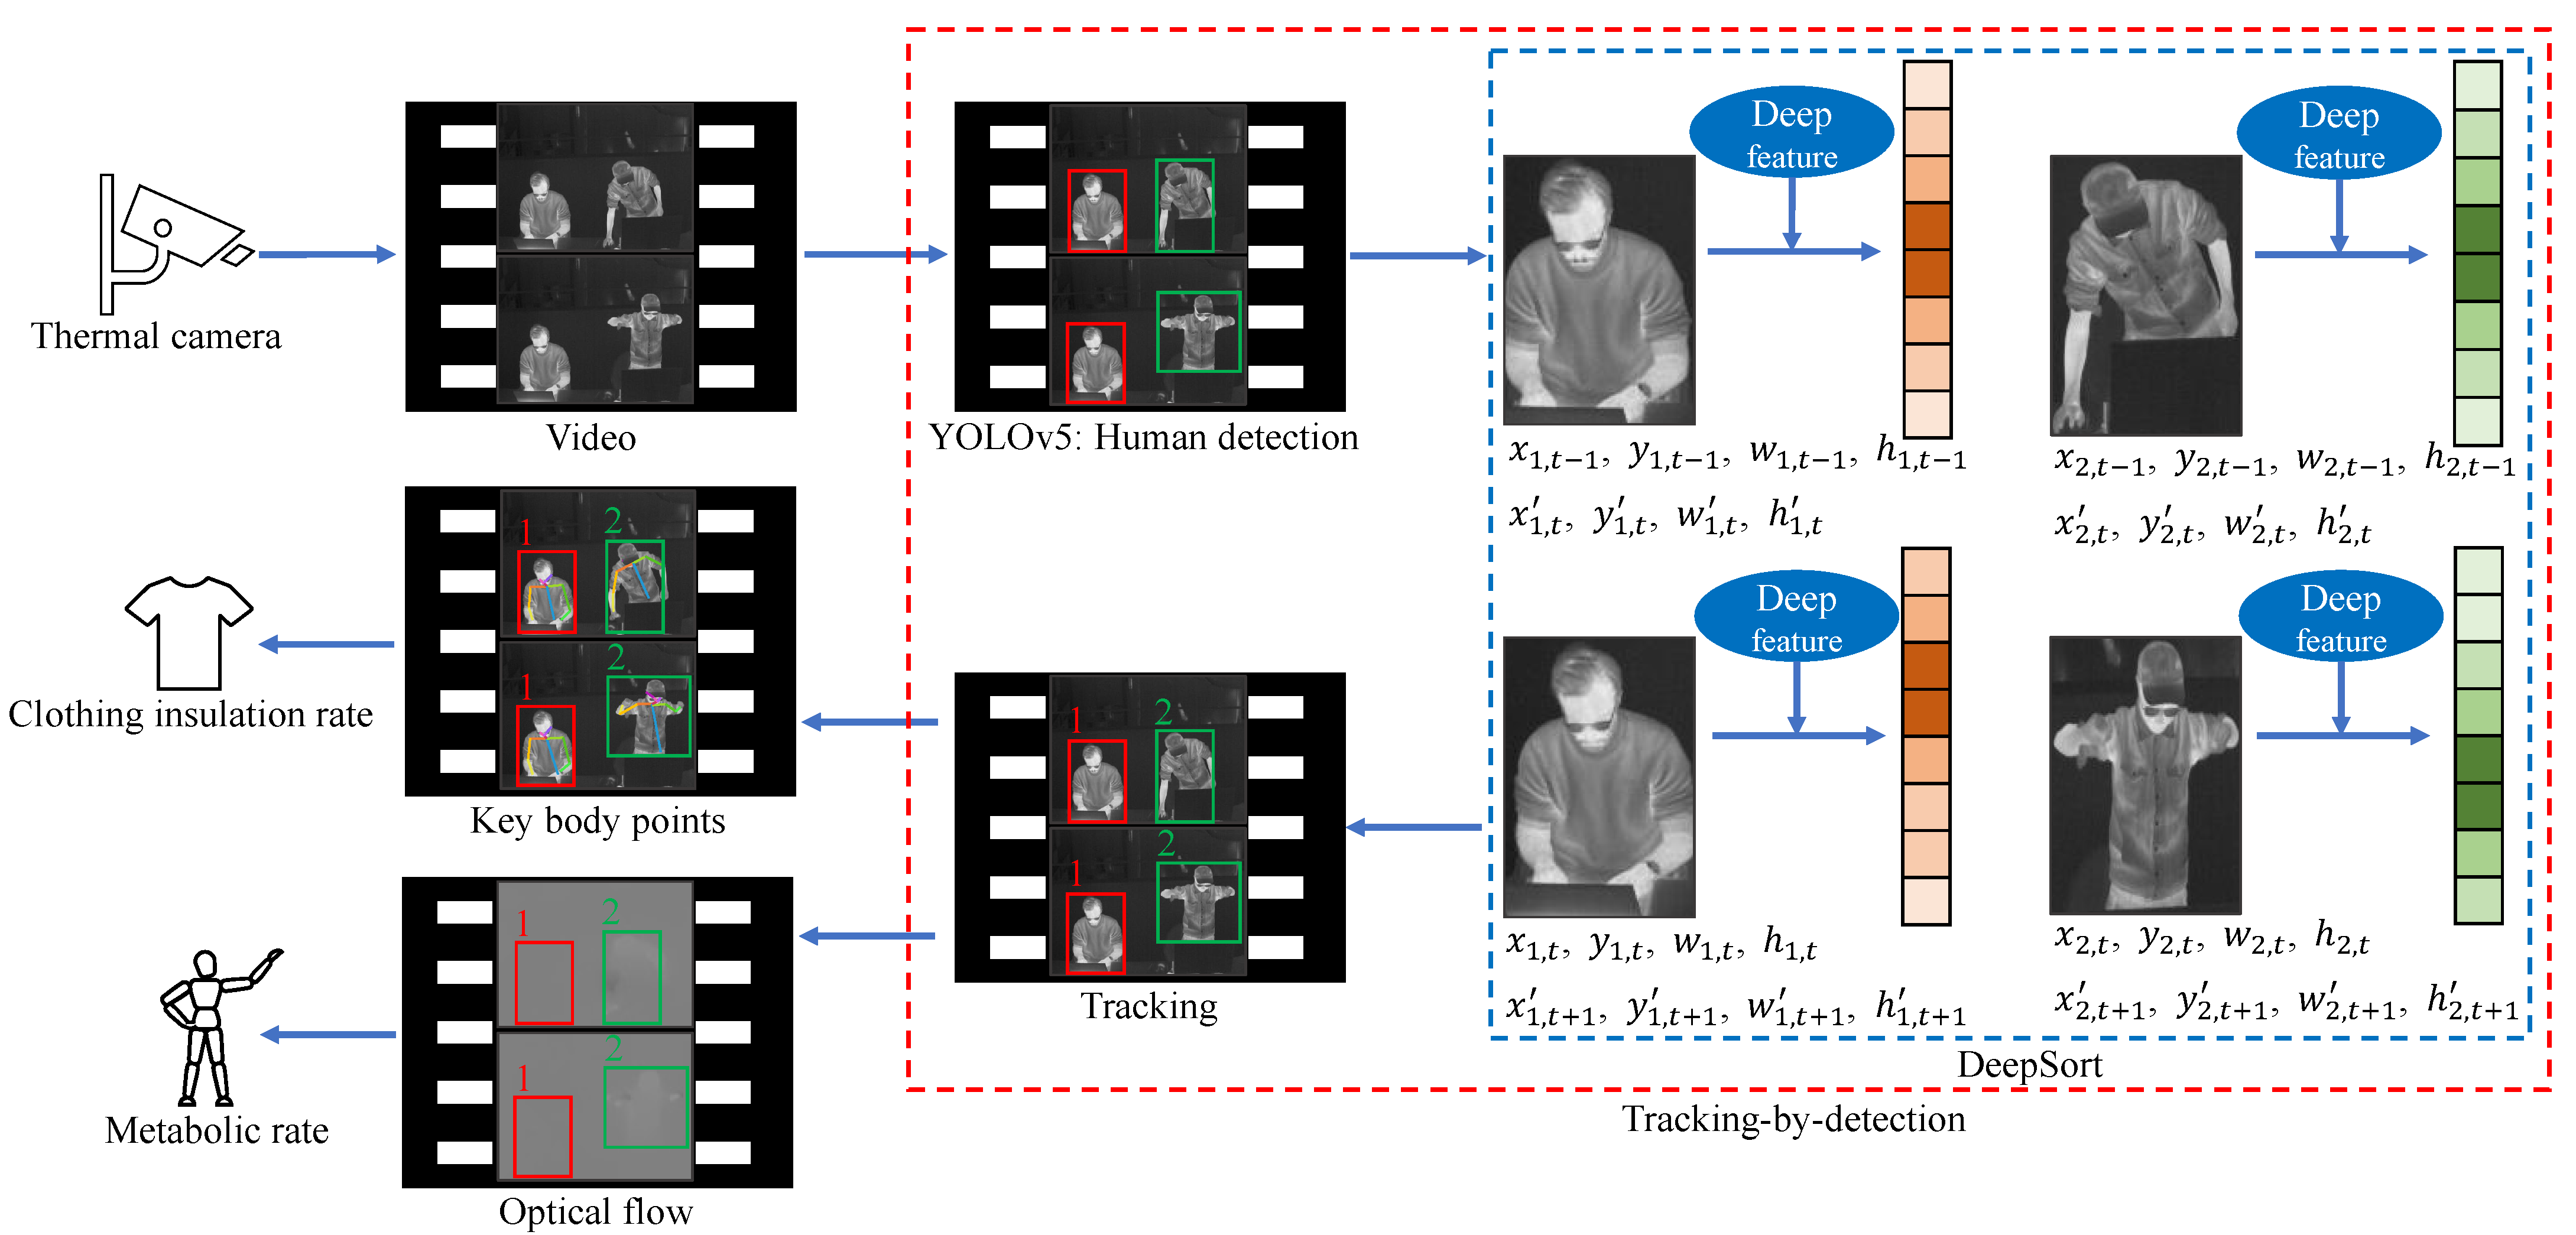
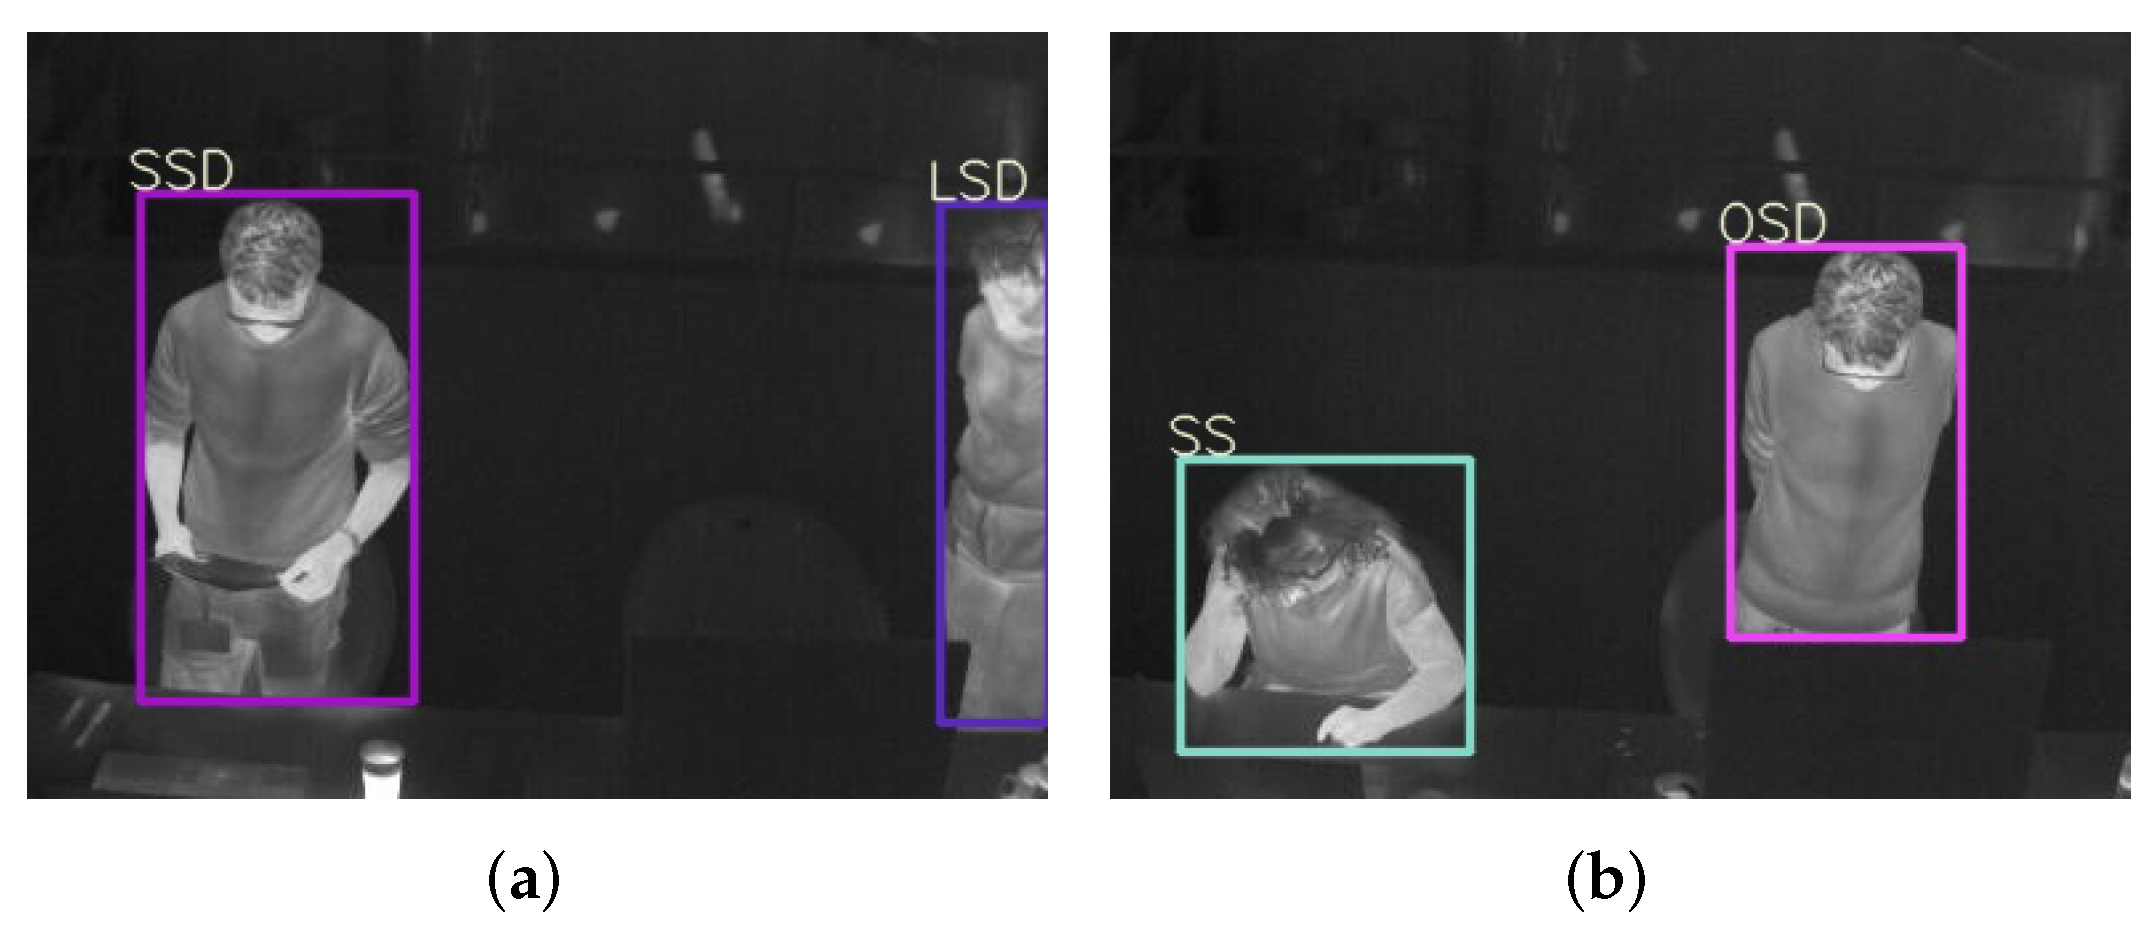
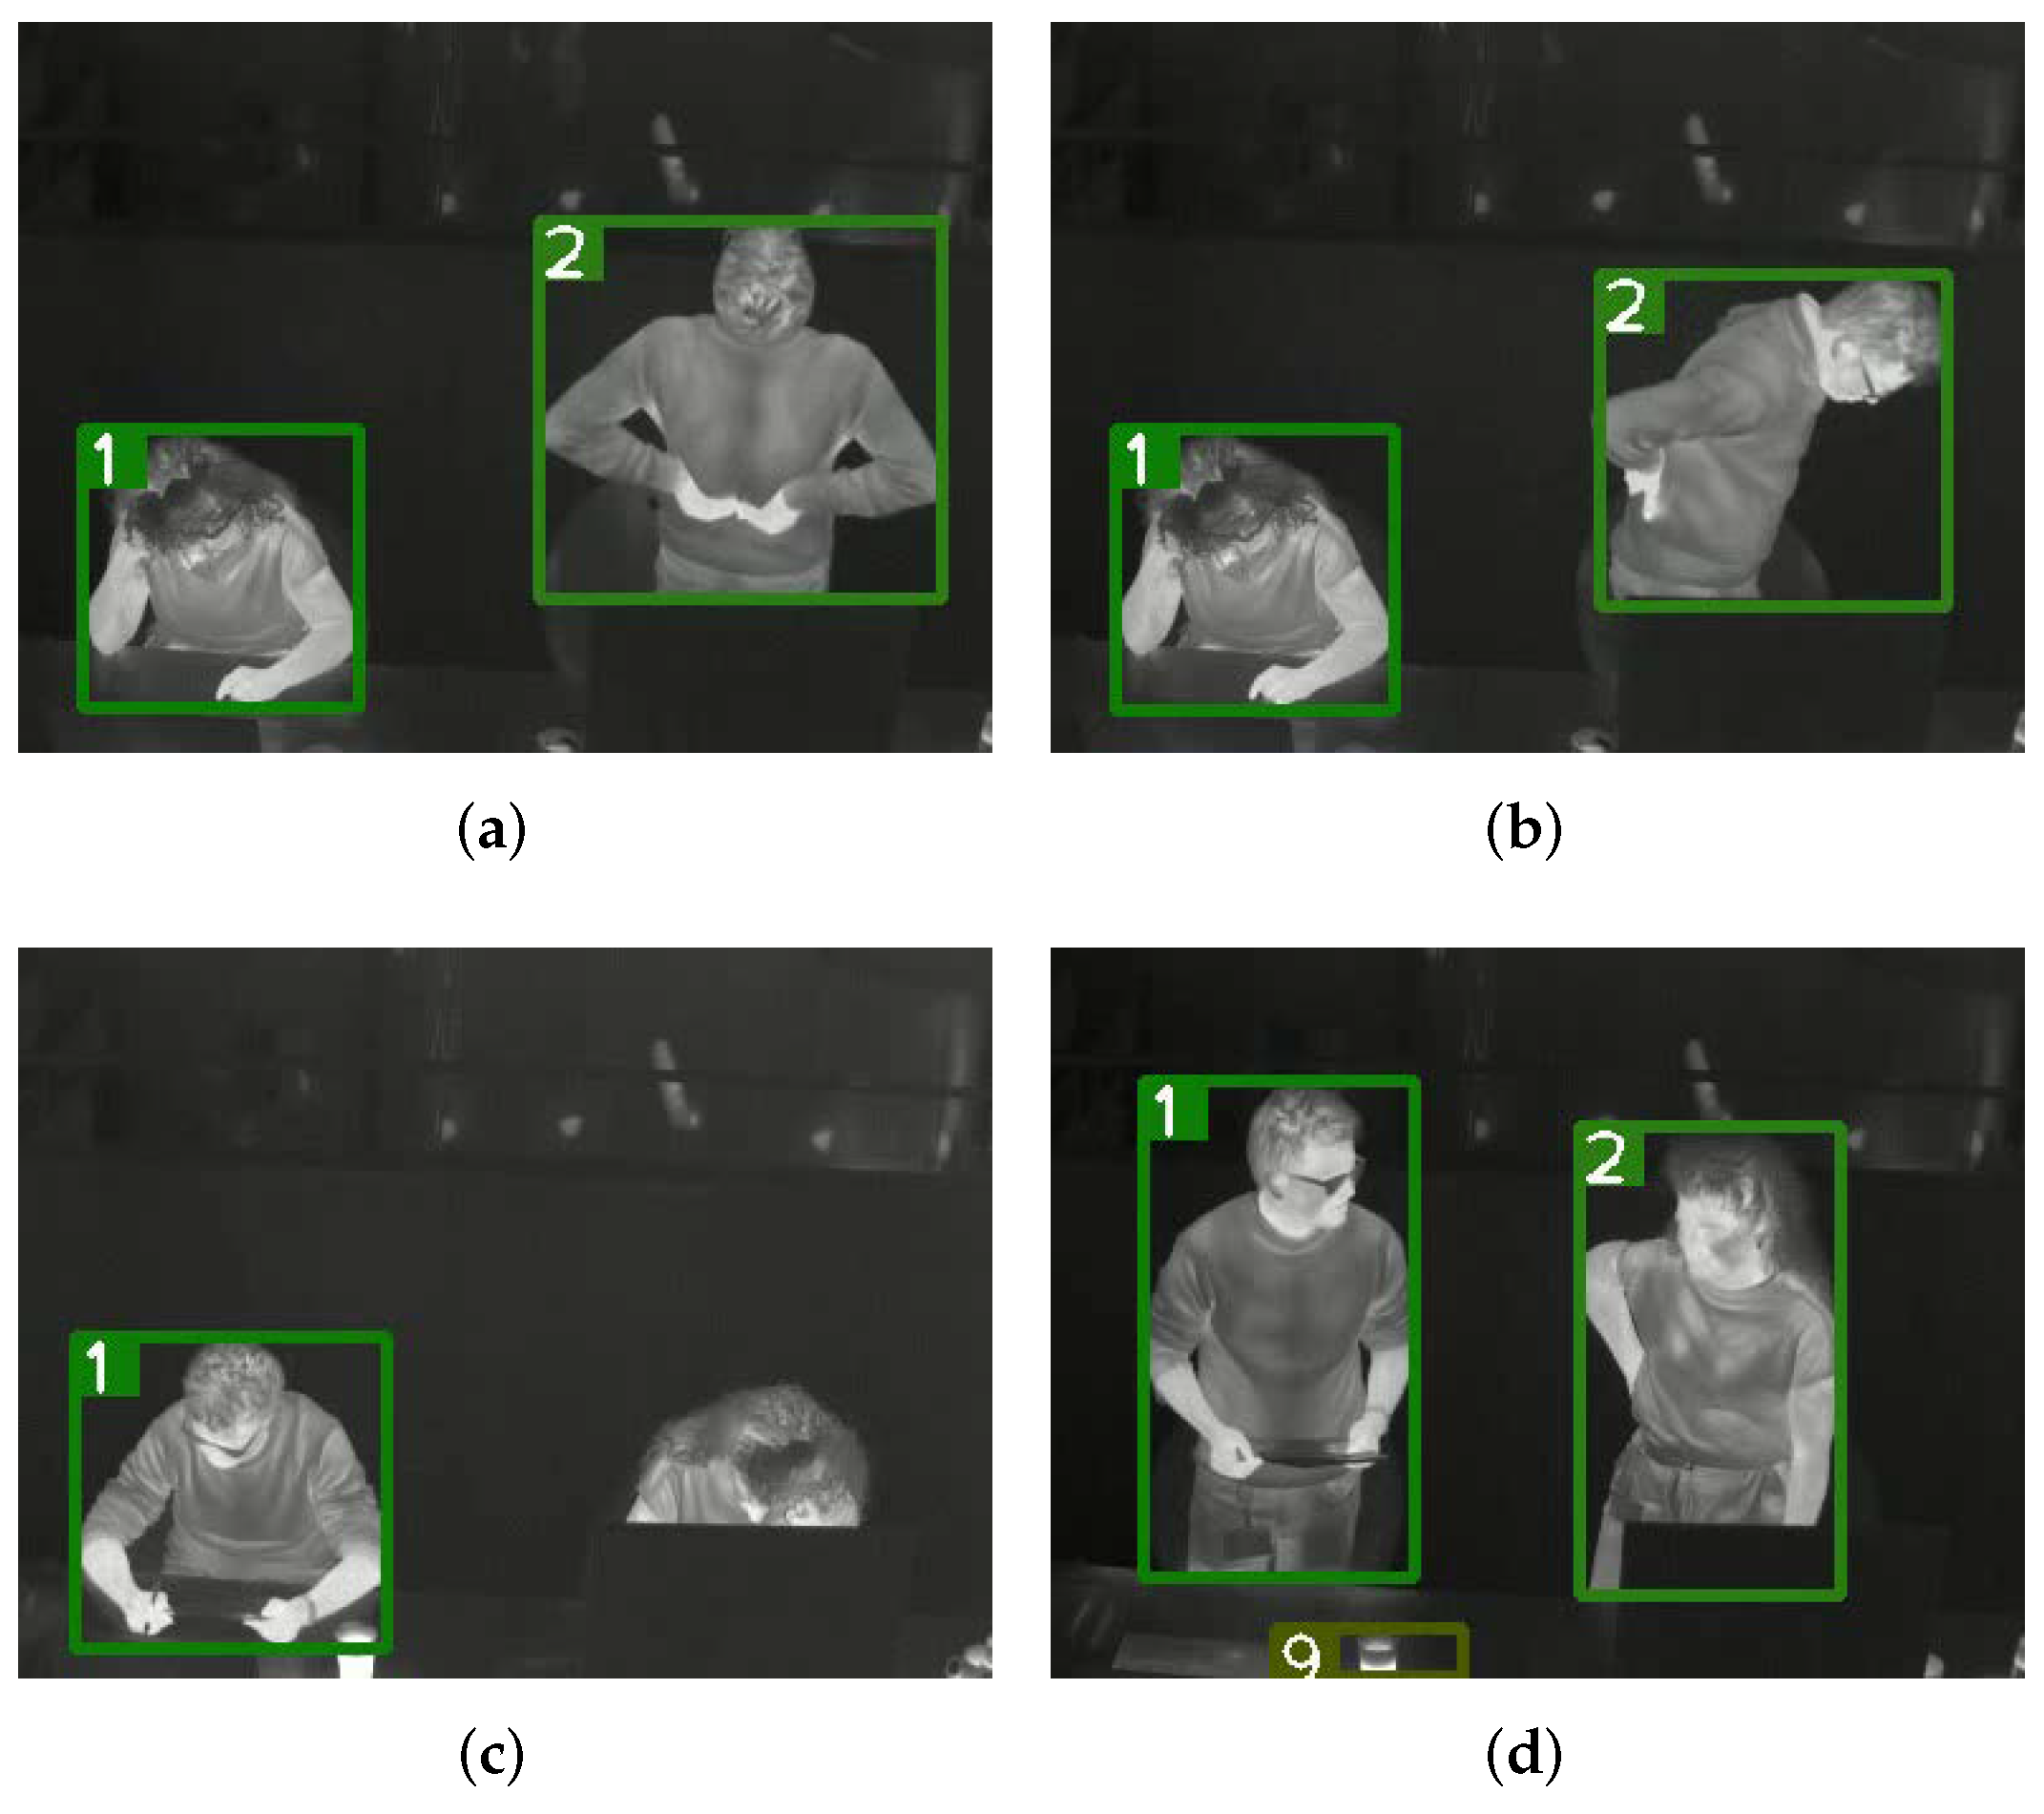
- The thermal input goes through a tracking-by-detection framework (see the red dashed box) to track each individual (see the ID 1 and ID 2) and at the same time categorize each person to get his or her clothing status and key posture (see the red and green solid boxes around persons which indicate different categories).
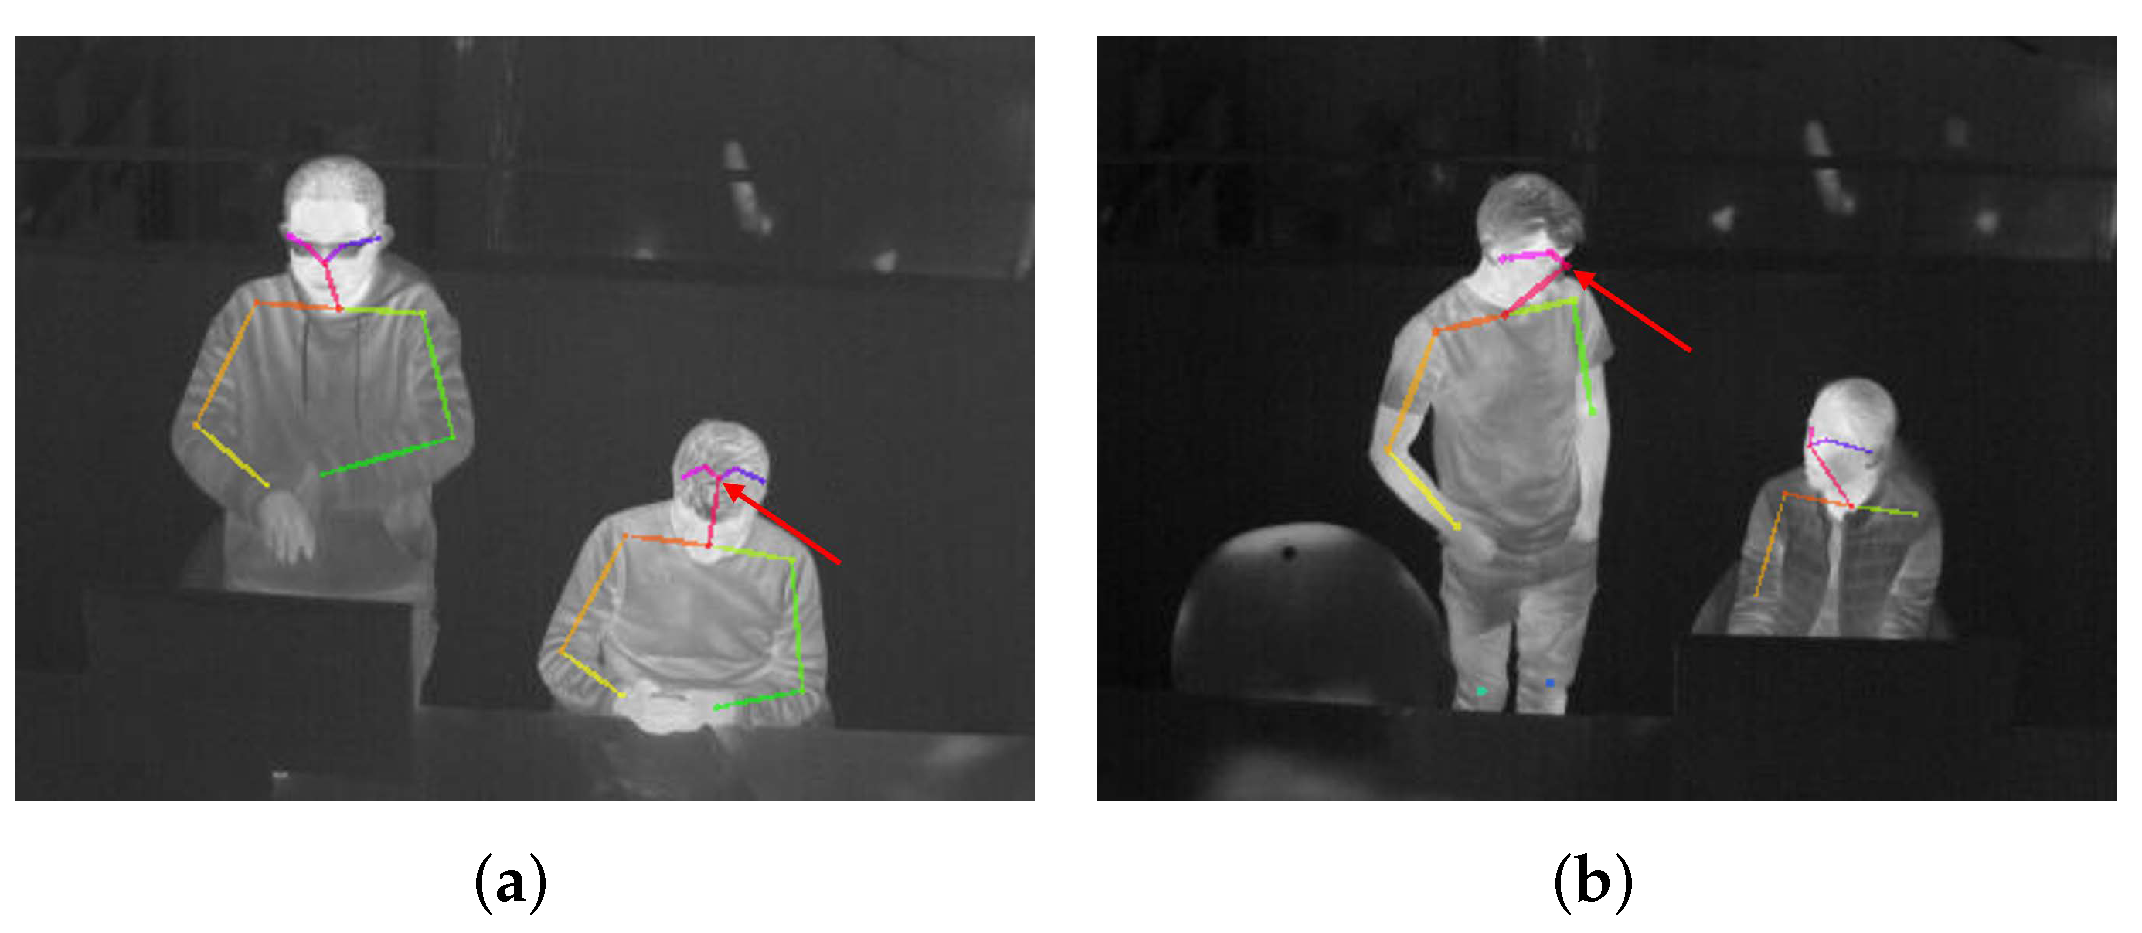
- With ID information, for each person, the clothing status classified by the tracking-by-detection part helps differentiate the skin region from the clothing-covered region. Then the detected key body points from these two regions can represent the skin temperature and the clothes temperature, based on which is estimated.
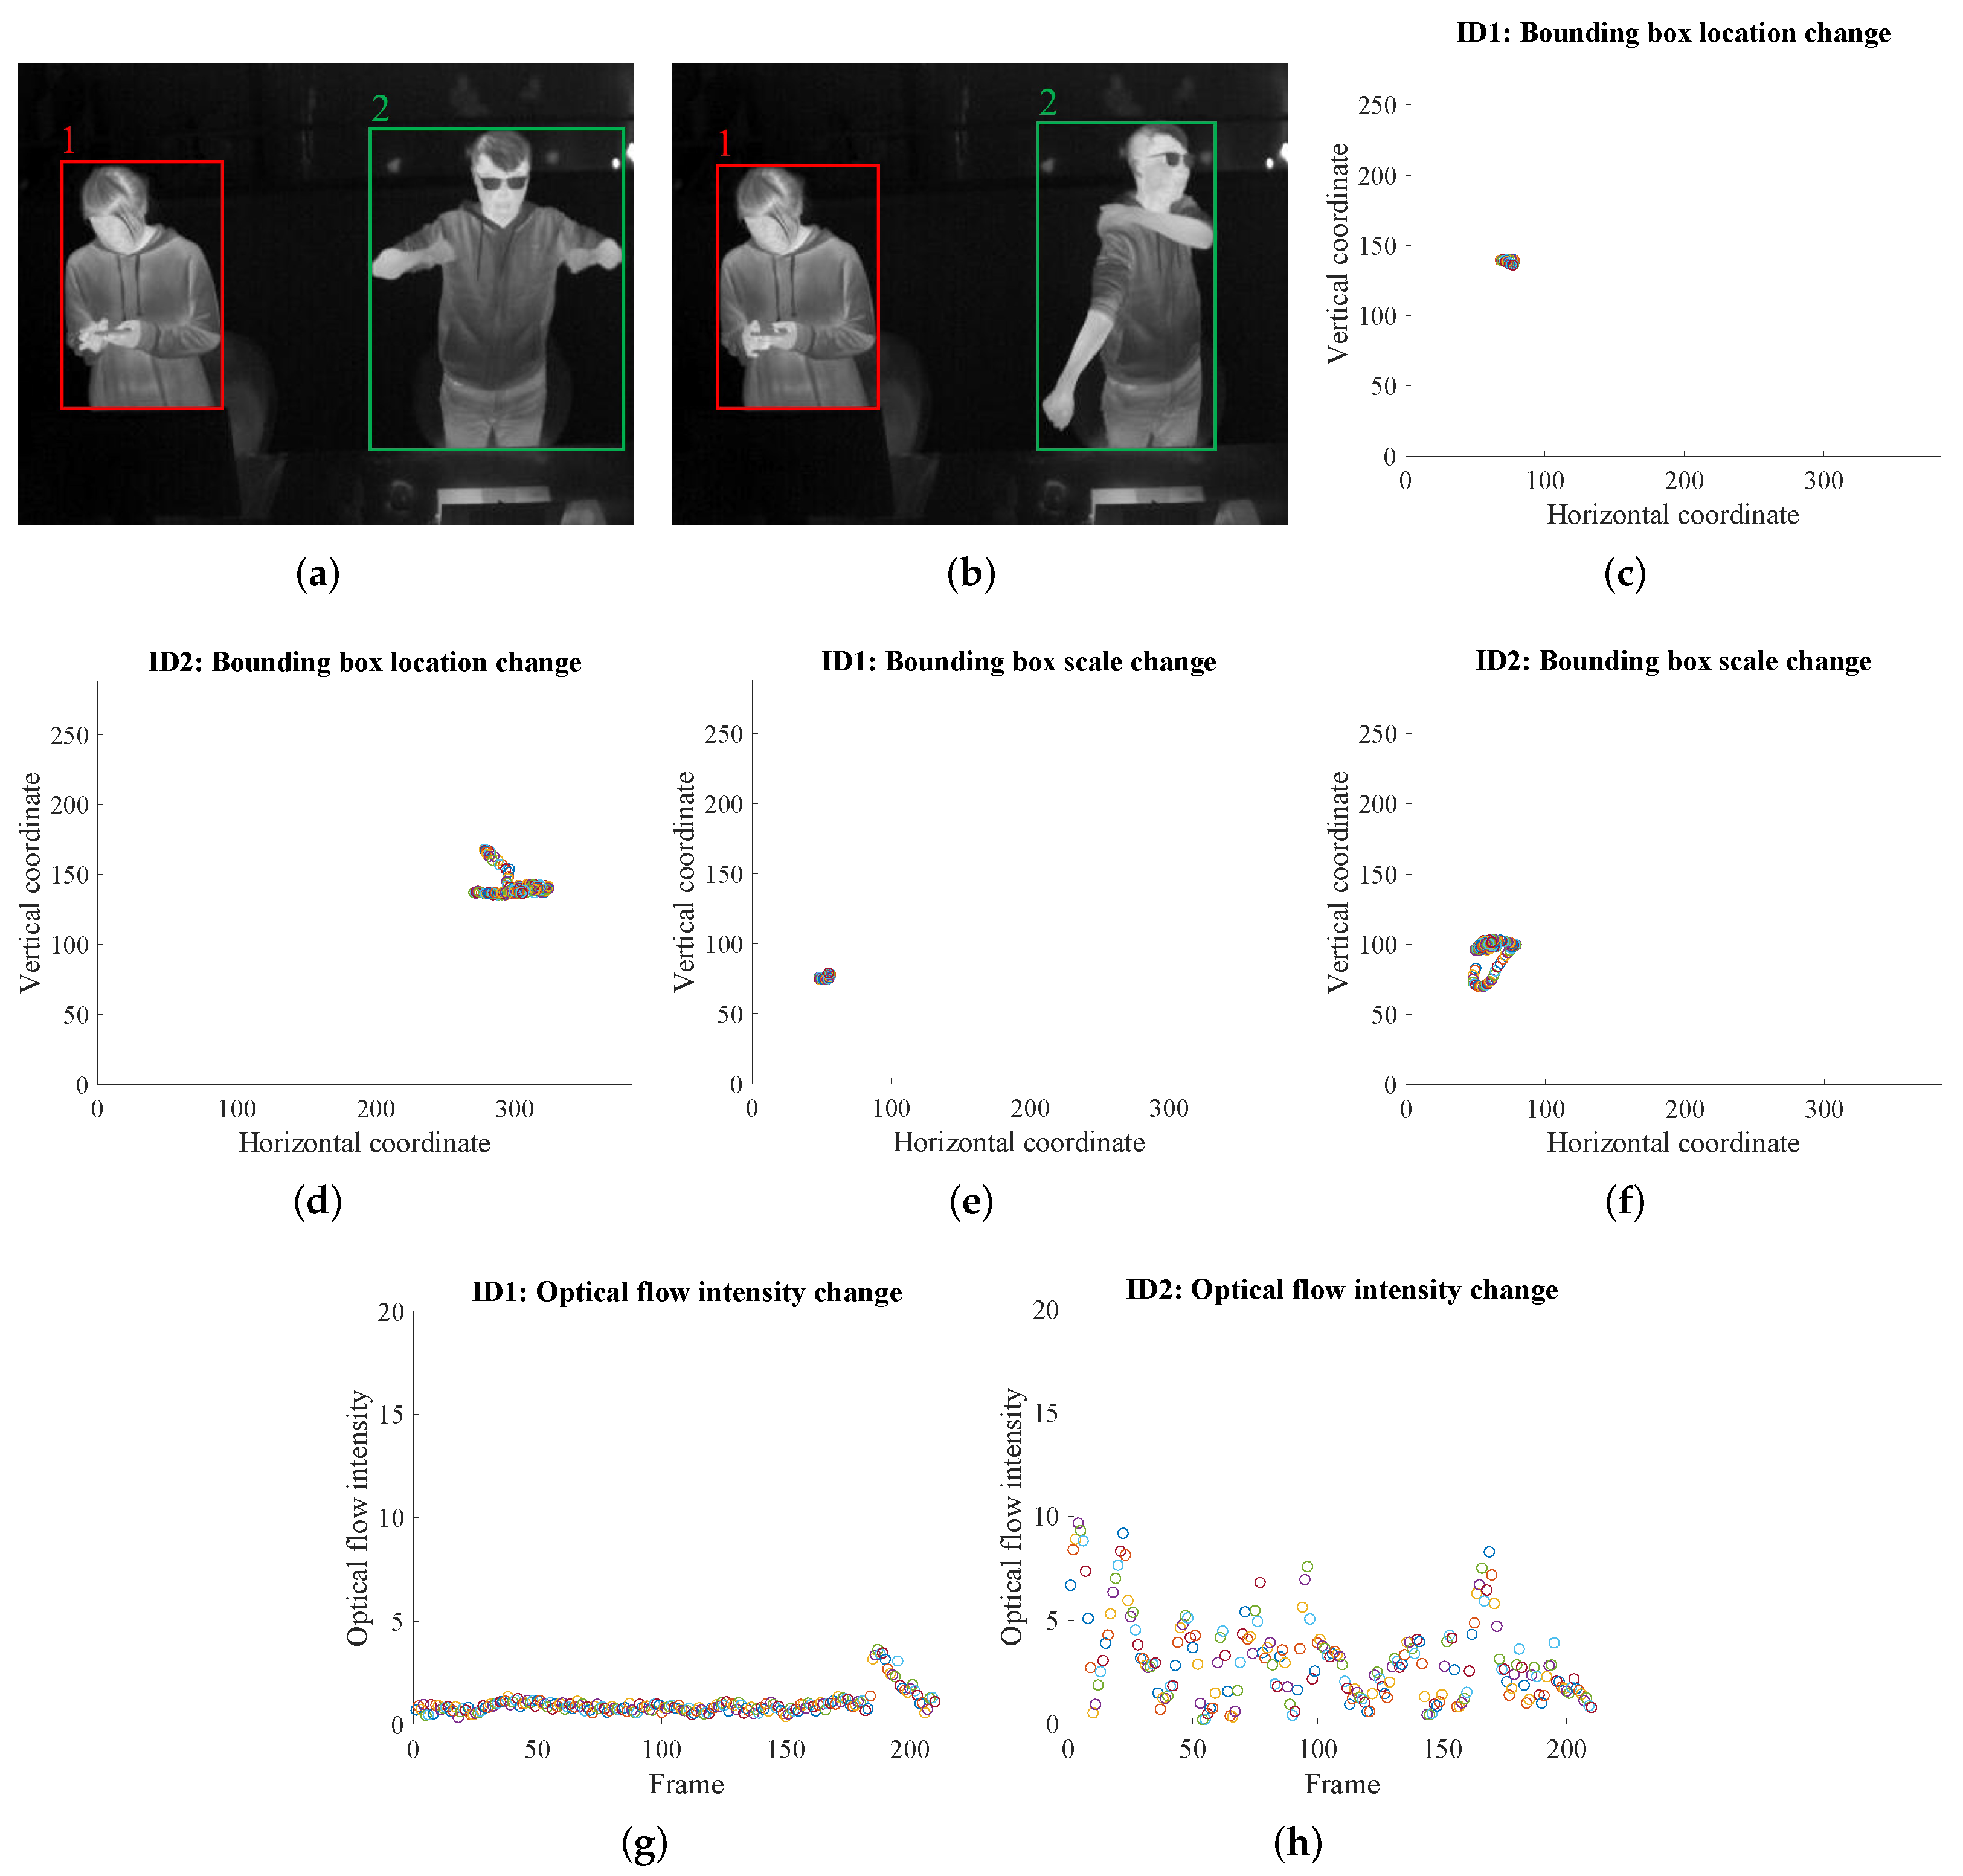
- With ID information, for each person, the optical flow within each person’s bounding box region, together with the bounding box (center location and box size) changes across time are calculated. These three features are good representations of the person’s activity intensity, which are used to estimate M.
3.1. Tracking-by-Detection
3.2. Estimation
3.3. M Estimation
3.3.1. Three Vision-Based Features
3.3.2. M Estimation from the Three Features
4. Experiments
4.1. Dataset Information
4.2. Evaluation of the Tracking-by-Detection Module
4.3. Evaluation of the Estimation Module
4.4. Evaluation of the M Estimation Module
4.5. Application in Thermal Comfort Assessment
5. Conclusions and Future Work
Author Contributions
Funding
Institutional Review Board Statement
Informed Consent Statement
Data Availability Statement
Acknowledgments
Conflicts of Interest
Abbreviations
| mAP | Mean Average Precision |
| MOTA | Multiple Object Tracking Accuracy |
| HVAC | Heaters, ventilation, and air conditioners |
| CNN | Convolutional Neural Network |
| ISO | International Organization for Standardization |
| R-CNN | Region-based Convolutional Neural Network |
| YOLO | You Only Look Once |
| FPN | Feature Pyramid Network |
| RGB | Red Green Blue |
| SORT | Simple Online and Realtime Tracking |
| DeepSort | Simple Online and Realtime Tracking with a Deep Association Metric |
| CDA_DDAL | Confidence-based Data Association and Discriminative Deep Appearance Learning |
| ID | Identity |
| PANet | Path Aggregation Network |
| FN | False Negative |
| FP | False Positive |
| TV-L1 | Total Variation L1 Norm |
| CBE | Center for the Built Environment |
| CUDA | Compute Unified Device Architecture |
| GPU | Graphics Processing Unit |
| KNN | K-NearestNeighbor |
| SVM | Support Vector Machine |
| RF | Random Forest |
References
- EIA. 2012 Commercial Buildings Energy Consumption Survey Data. Available online: https://www.eia.gov/consumption/commercial/data/2012/ (accessed on 15 August 2021).
- Atalie, D.; Tesinova, P.; Tadesse, M.G.; Ferede, E.; Dulgheriu, I.; Loghin, E. Thermo-Physiological Comfort Properties of Sportswear with Different Combination of Inner and Outer Layers. Materials 2021, 14, 6863. [Google Scholar] [CrossRef]
- Ullah, H.M.K.; Lejeune, J.; Cayla, A.; Monceaux, M.; Campagne, C.; Devaux, É. A review of noteworthy/major innovations in wearable clothing for thermal and moisture management from material to fabric structure. Text. Res. J. 2021, 00405175211027799. [Google Scholar] [CrossRef]
- Peng, Y.; Sun, F.; Xiao, C.; Iqbal, M.I.; Sun, Z.; Guo, M.; Gao, W.; Hu, X. Hierarchically Structured and Scalable Artificial Muscles for Smart Textiles. ACS Appl. Mater. Interfaces 2021, 13, 54386–54395. [Google Scholar] [CrossRef]
- Zhu, F.; Feng, Q. Recent advances in textile materials for personal radiative thermal management in indoor and outdoor environments. Int. J. Therm. Sci. 2021, 165, 106899. [Google Scholar] [CrossRef]
- Fanger, P.O. Thermal comfort. Analysis and applications in environmental engineering. In Thermal Comfort. Analysis and Applications in Environmental Engineering; Danish Technical Press: Copenhagen, Denmark, 1970. [Google Scholar]
- Fanger, P.O. Assessment of man’s thermal comfort in practice. Occup. Environ. Med. 1973, 30, 313–324. [Google Scholar] [CrossRef]
- The International Organization for Standardization. Ergonomics of the Thermal Environment—Analytical Determination and Interpretation of Thermal Comfort Using Calculation of the PMV and PPD Indices and Local Thermal Comfort Criteria. Available online: https://www.iso.org/standard/39155.html/ (accessed on 1 September 2021).
- The International Organization for Standardization. Ergonomics of the Thermal Environment—Analytical Determination and Interpretation of Heat Stress Using Calculation of the Predicted Heat Strain. Available online: https://www.iso.org/standard/37600.html/ (accessed on 1 September 2021).
- The International Organization for Standardization. Ergonomics of the Thermal Environment—Estimation of Thermal Insulation and Water Vapour Resistance of a Clothing Ensemble. Available online: https://www.iso.org/standard/39257.html/ (accessed on 1 September 2021).
- The International Organization for Standardization. Ergonomics of the Thermal Environment—Determination of Metabolic Rate. Available online: https://www.iso.org/standard/34251.html/ (accessed on 1 September 2021).
- ASHRAE. Thermal Environmental Conditions for Human Occupancy. Available online: https://www.ashrae.org/technical-resources/bookstore/standard-55-thermal-environmental-conditions-for-human-occupancy (accessed on 1 September 2021).
- De Carli, M.; Olesen, B.W.; Zarrella, A.; Zecchin, R. People’s clothing behaviour according to external weather and indoor environment. Build. Environ. 2007, 42, 3965–3973. [Google Scholar] [CrossRef]
- Ngarambe, J.; Yun, G.Y.; Kim, G. Prediction of indoor clothing insulation levels: A deep learning approach. Energy Build. 2019, 202, 109402. [Google Scholar] [CrossRef]
- de Carvalho, P.M.; da Silva, M.G.; Ramos, J.E. Influence of weather and indoor climate on clothing of occupants in naturally ventilated school buildings. Build. Environ. 2013, 59, 38–46. [Google Scholar] [CrossRef]
- Liu, W.; Yang, D.; Shen, X.; Yang, P. Indoor clothing insulation and thermal history: A clothing model based on logistic function and running mean outdoor temperature. Build. Environ. 2018, 135, 142–152. [Google Scholar] [CrossRef]
- Matsumoto, H.; Iwai, Y.; Ishiguro, H. Estimation of Thermal Comfort by Measuring Clo Value without Contact; MVA; Citeseer: Princeton, NJ, USA, 2011; pp. 491–494. [Google Scholar]
- Konarska, M.; Soltynski, K.; Sudol-Szopinska, I.; Chojnacka, A. Comparative evaluation of clothing thermal insulation measured on a thermal manikin and on volunteers. Fibres Text. East. Eur. 2007, 15, 73. [Google Scholar]
- Lu, S.; Cochran Hameen, E. Integrated IR Vision Sensor for Online Clothing Insulation Measurement. In Proceedings of the 23rd Annual Conference of the Association for Computer-Aided Architectural Design Research in Asia, Beijing, China, 17–19 May 2018. [Google Scholar]
- Lee, J.H.; Kim, Y.K.; Kim, K.S.; Kim, S. Estimating clothing thermal insulation using an infrared camera. Sensors 2016, 16, 341. [Google Scholar] [CrossRef] [PubMed]
- Lee, K.; Choi, H.; Kim, H.; Kim, D.D.; Kim, T. Assessment of a real-time prediction method for high clothing thermal insulation using a thermoregulation model and an infrared camera. Atmosphere 2020, 11, 106. [Google Scholar] [CrossRef]
- Choi, H.; Na, H.; Kim, T.; Kim, T. Vision-based estimation of clothing insulation for building control: A case study of residential buildings. Build. Environ. 2021, 202, 108036. [Google Scholar] [CrossRef]
- Luo, M.; Zhou, X.; Zhu, Y.; Sundell, J. Revisiting an overlooked parameter in thermal comfort studies, the metabolic rate. Energy Build. 2016, 118, 152–159. [Google Scholar] [CrossRef]
- Zhai, Y.; Li, M.; Gao, S.; Yang, L.; Zhang, H.; Arens, E.; Gao, Y. Indirect calorimetry on the metabolic rate of sitting, standing and walking office activities. Build. Environ. 2018, 145, 77–84. [Google Scholar] [CrossRef]
- Ji, W.; Luo, M.; Cao, B.; Zhu, Y.; Geng, Y.; Lin, B. A new method to study human metabolic rate changes and thermal comfort in physical exercise by CO2 measurement in an airtight chamber. Energy Build. 2018, 177, 402–412. [Google Scholar] [CrossRef]
- Calvaresi, A.; Arnesano, M.; Pietroni, F.; Revel, G.M. Measuring metabolic rate to improve comfort management in buildings. Environ. Eng. Manag. J. (EEMJ) 2018, 17, 2287–2296. [Google Scholar]
- Hasan, M.H.; Alsaleem, F.; Rafaie, M. Sensitivity study for the PMV thermal comfort model and the use of wearable devices biometric data for metabolic rate estimation. Build. Environ. 2016, 110, 173–183. [Google Scholar] [CrossRef]
- Zhang, Y.; Zhou, X.; Zheng, Z.; Oladokun, M.O.; Fang, Z. Experimental investigation into the effects of different metabolic rates of body movement on thermal comfort. Build. Environ. 2020, 168, 106489. [Google Scholar] [CrossRef]
- Lee, J.; Ham, Y. Physiological sensing-driven personal thermal comfort modelling in consideration of human activity variations. Build. Res. Inf. 2021, 49, 512–524. [Google Scholar]
- Gilani, S.I.u.H.; Khan, M.H.; Ali, M. Revisiting Fanger’s thermal comfort model using mean blood pressure as a bio-marker: An experimental investigation. Appl. Therm. Eng. 2016, 109, 35–43. [Google Scholar] [CrossRef]
- Jensen, M.M.; Poulsen, M.K.; Alldieck, T.; Larsen, R.G.; Gade, R.; Moeslund, T.B.; Franch, J. Estimation of energy expenditure during treadmill exercise via thermal imaging. Med. Sci. Sport. Exerc. 2016, 48, 2571–2579. [Google Scholar] [CrossRef][Green Version]
- Gade, R.; Godsk Larsen, R.; Moeslund, T.B. Measuring energy expenditure in sports by thermal video analysis. In Proceedings of the IEEE Conference on Computer Vision and Pattern Recognition Workshops, Honolulu, HI, USA, 21–26 July 2017; pp. 131–138. [Google Scholar]
- Na, H.; Choi, H.; Kim, T. Metabolic rate estimation method using image deep learning. In Building Simulation; Springer: Berlin/Heidelberg, Germany, 2020; Volume 13, pp. 1077–1093. [Google Scholar]
- Liu, J.; Foged, I.W.; Moeslund, T.B. Vision-Based Individual Factors Acquisition for Thermal Comfort Assessment in a Built Environment. In Proceedings of the 2020 15th IEEE International Conference on Automatic Face and Gesture Recognition (FG 2020), Buenos Aires, Argentina, 18–22 May 2020; pp. 662–666. [Google Scholar]
- Liu, J.; Foged, I.W.; Moeslund, T.B. Automatic estimation of clothing insulation rate and metabolic rate for dynamic thermal comfort assessment. Pattern Anal. Appl. 2021, 1–16. [Google Scholar] [CrossRef]
- Ren, S.; He, K.; Girshick, R.; Sun, J. Faster R-CNN: Towards real-time object detection with region proposal networks. IEEE Trans. Pattern Anal. Mach. Intell. 2016, 39, 1137–1149. [Google Scholar] [CrossRef] [PubMed]
- Redmon, J.; Divvala, S.; Girshick, R.; Farhadi, A. You only look once: Unified, real-time object detection. In Proceedings of the IEEE Conference on Computer Vision and Pattern Recognition, Las Vegas, NV, USA, 27–30 June 2016; pp. 779–788. [Google Scholar]
- Redmon, J.; Farhadi, A. YOLO9000: Better, faster, stronger. In Proceedings of the IEEE Conference on Computer Vision and Pattern Recognition, Honolulu, HI, USA, 21–26 July 2017; pp. 7263–7271. [Google Scholar]
- Redmon, J.; Farhadi, A. Yolov3: An incremental improvement. arXiv 2018, arXiv:1804.02767. [Google Scholar]
- Bochkovskiy, A.; Wang, C.Y.; Liao, H.Y.M. YOLOv4: Optimal Speed and Accuracy of Object Detection. arXiv 2020, arXiv:2004.10934. [Google Scholar]
- Ultralytics. YOLOv5. Available online: https://github.com/ultralytics/yolov5/ (accessed on 5 March 2021).
- Lin, T.Y.; Dollár, P.; Girshick, R.; He, K.; Hariharan, B.; Belongie, S. Feature pyramid networks for object detection. In Proceedings of the IEEE Conference on Computer Vision and Pattern Recognition, Honolulu, HI, USA, 21–26 July 2017; pp. 2117–2125. [Google Scholar]
- Lin, T.Y.; Maire, M.; Belongie, S.; Hays, J.; Perona, P.; Ramanan, D.; Dollár, P.; Zitnick, C.L. Microsoft coco: Common objects in context. In European Conference on Computer Vision; Springer: Berlin/Heidelberg, Germany, 2014; pp. 740–755. [Google Scholar]
- Everingham, M.; Van Gool, L.; Williams, C.K.; Winn, J.; Zisserman, A. The pascal visual object classes (voc) challenge. Int. J. Comput. Vis. 2010, 88, 303–338. [Google Scholar] [CrossRef]
- Bewley, A.; Ge, Z.; Ott, L.; Ramos, F.; Upcroft, B. Simple online and realtime tracking. In Proceedings of the 2016 IEEE International Conference on Image Processing (ICIP), Phoenix, AZ, USA, 25–28 September 2016; pp. 3464–3468. [Google Scholar]
- Wojke, N.; Bewley, A.; Paulus, D. Simple online and realtime tracking with a deep association metric. In Proceedings of the 2017 IEEE International Conference on Image Processing (ICIP), Beijing, China, 17–20 September 2017; pp. 3645–3649. [Google Scholar]
- Bae, S.H.; Yoon, K.J. Confidence-based data association and discriminative deep appearance learning for robust online multi-object tracking. IEEE Trans. Pattern Anal. Mach. Intell. 2017, 40, 595–610. [Google Scholar] [CrossRef]
- Zhao, D.; Fu, H.; Xiao, L.; Wu, T.; Dai, B. Multi-object tracking with correlation filter for autonomous vehicle. Sensors 2018, 18, 2004. [Google Scholar] [CrossRef]
- Zhang, W.; Zhou, H.; Sun, S.; Wang, Z.; Shi, J.; Loy, C.C. Robust multi-modality multi-object tracking. In Proceedings of the IEEE/CVF International Conference on Computer Vision, Seoul, Korea, 27–28 October 2019; pp. 2365–2374. [Google Scholar]
- Lu, Z.; Rathod, V.; Votel, R.; Huang, J. Retinatrack: Online single stage joint detection and tracking. In Proceedings of the IEEE/CVF Conference on Computer Vision and Pattern Recognition, Seattle, WA, USA, 14–19 June 2020; pp. 14668–14678. [Google Scholar]
- Krišto, M.; Ivasic-Kos, M.; Pobar, M. Thermal Object Detection in Difficult Weather Conditions Using YOLO. IEEE Access 2020, 8, 125459–125476. [Google Scholar] [CrossRef]
- Huda, N.U.; Hansen, B.D.; Gade, R.; Moeslund, T.B. The Effect of a Diverse Dataset for Transfer Learning in Thermal Person Detection. Sensors 2020, 20, 1982. [Google Scholar] [CrossRef]
- Liu., J.; Philipsen., M.; Moeslund., T. Supervised versus Self-supervised Assistant for Surveillance of Harbor Fronts. In Proceedings of the 16th International Joint Conference on Computer Vision, Imaging and Computer Graphics Theory and Applications–Volume 5: VISAPP, INSTICC; SciTePress: Setúbal, Portugal, 2021; pp. 610–617. [Google Scholar]
- Yao, Y.; Lian, Z.; Liu, W.; Jiang, C. Measurement methods of mean skin temperatures for the PMV model. HVAC&R Res. 2008, 14, 161–174. [Google Scholar]
- Dai, C.; Zhang, H.; Arens, E.; Lian, Z. Machine learning approaches to predict thermal demands using skin temperatures: Steady-state conditions. Build. Environ. 2017, 114, 1–10. [Google Scholar] [CrossRef]
- Cosma, A.C.; Simha, R. Thermal comfort modeling in transient conditions using real-time local body temperature extraction with a thermographic camera. Build. Environ. 2018, 143, 36–47. [Google Scholar] [CrossRef]
- Liu, S.; Qi, L.; Qin, H.; Shi, J.; Jia, J. Path aggregation network for instance segmentation. In Proceedings of the IEEE Conference on Computer Vision and Pattern Recognition, Salt Lake City, UT, USA, 18–23 June 2018; pp. 8759–8768. [Google Scholar]
- Petersson, J.; Halder, A. Updated Database of Clothing Thermal Insulation and Vapor Permeability Values of Western Ensembles for Use in ASHRAE Standard 55, ISO 7730, and ISO 9920. ASHRAE Trans. 2021, 127, 773–799. [Google Scholar]
- Tang, Y.; Su, Z.; Yu, H.; Zhang, K.; Li, C.; Ye, H. A database of clothing overall and local insulation and prediction models for estimating ensembles’ insulation. Build. Environ. 2022, 207, 108418. [Google Scholar] [CrossRef]
- Cao, Z.; Hidalgo, G.; Simon, T.; Wei, S.E.; Sheikh, Y. OpenPose: Realtime multi-person 2D pose estimation using Part Affinity Fields. IEEE Trans. Pattern Anal. Mach. Intell. 2019, 43, 172–186. [Google Scholar] [CrossRef]
- Miura, J.; Demura, M.; Nishi, K.; Oishi, S. Thermal comfort measurement using thermal-depth images for robotic monitoring. Pattern Recognit. Lett. 2020, 137, 108–113. [Google Scholar] [CrossRef]
- Ainsworth, B.E.; Haskell, W.L.; Whitt, M.C.; Irwin, M.L.; Swartz, A.M.; Strath, S.J.; O Brien, W.L.; Bassett, D.R.; Schmitz, K.H.; Emplaincourt, P.O.; et al. Compendium of physical activities: An update of activity codes and MET intensities. Med. Sci. Sport. Exerc. 2000, 32, S498–S504. [Google Scholar] [CrossRef]
- Ainsworth, B.E.; Haskell, W.L.; Herrmann, S.D.; Meckes, N.; Bassett, D.R.; Tudor-Locke, C.; Greer, J.L.; Vezina, J.; Whitt-Glover, M.C.; Leon, A.S. 2011 Compendium of Physical Activities: A second update of codes and MET values. Med Sci Sport. Exerc 2011, 43, 1575–1581. [Google Scholar] [CrossRef]
- Zach, C.; Pock, T.; Bischof, H. A duality based approach for realtime tv-l 1 optical flow. In Joint Pattern Recognition Symposium; Springer: Berlin/Heidelberg, Germany, 2007; pp. 214–223. [Google Scholar]
- Zhao, Y.; Xiong, Y.; Lin, D. MMAction. Available online: https://github.com/open-mmlab/mmaction (accessed on 5 March 2021).
- Tartarini, F.; Schiavon, S.; Cheung, T.; Hoyt, T. CBE Thermal Comfort Tool: Online tool for thermal comfort calculations and visualizations. SoftwareX 2020, 12, 100563. [Google Scholar] [CrossRef]
- Ainsworth, B.E.; Haskell, W.L.; Herrmann, S.D.; Meckes, N.; Bassett, D.R.; Tudor-Locke, C.; Greer, J.L.; Vezina, J.; Whitt-Glover, M.C.; Leon, A.S. 2011 Compendium of Physical Activities Tables. Available online: https://sites.google.com/site/compendiumofphysicalactivities/compendia (accessed on 10 September 2021).
- Chen, H.; Cai, W.; Wu, F.; Liu, Q. Vehicle-mounted far-infrared pedestrian detection using multi-object tracking. Infrared Phys. Technol. 2021, 115, 103697. [Google Scholar] [CrossRef]
- Andriluka, M.; Pishchulin, L.; Gehler, P.; Schiele, B. 2d human pose estimation: New benchmark and state of the art analysis. In Proceedings of the IEEE Conference on computer Vision and Pattern Recognition, Columbus, OH, USA, 23–28 June 2014; pp. 3686–3693. [Google Scholar]
- Pedregosa, F.; Varoquaux, G.; Gramfort, A.; Michel, V.; Thirion, B.; Grisel, O.; Blondel, M.; Prettenhofer, P.; Weiss, R.; Dubourg, V.; et al. Scikit-learn: Machine Learning in Python. J. Mach. Learn. Res. 2011, 12, 2825–2830. [Google Scholar]


| Garment | (clo) | |
|---|---|---|
| Underwear | Singlet | 0.04 |
| T-shirt | 0.09 | |
| Shirts with long sleeves | 0.12 | |
| Shirts, blouses | Short sleeves | 0.15 |
| Lightweight, long sleeves | 0.2 | |
| Normal, long sleeves | 0.25 | |
| Activity | M (W/m2) |
|---|---|
| Reclining | 46 |
| Seated, relaxed | 58 |
| Sedentary activity | 70 |
| Standing, light activity | 93 |
| Standing, medium activity | 116 |
| Walking on level ground: | |
| 2 km/h | 110 |
| 3 km/h | 140 |
| 4 km/h | 165 |
| 5 km/h | 200 |
| Category | Meaning |
|---|---|
| LongSit | Long-sleeved clothes, sitting |
| ShortSit | Short-sleeved clothes, sitting |
| OclSit | Difficult to predict clothes type due to occlusion, sitting |
| LongStand | Long-sleeved clothes, standing |
| ShortStand | Short-sleeved clothes, standing |
| OclStand | Difficult to predict clothes type due to occlusion, standing |
| Number of Images | Number of Persons | ||||||
|---|---|---|---|---|---|---|---|
| LongSit | ShortSit | OclSit | LongStand | ShortStand | OclStand | ||
| Training | 5299 | 2099 | 1615 | 828 | 2280 | 2735 | 254 |
| Validation | 362 | 172 | 29 | 274 | 140 | 100 | 9 |
| Testing | 434 | 22 | 157 | 92 | 149 | 443 | 2 |
| Parameters | Training Accuracy | Testing Accuracy | |
|---|---|---|---|
| KNN | metric=‘manhattan’, weights= ‘distance’, n_neighbors=13 | 100% | 92.7% |
| SVM | C=50, kernel=‘rbf’, gamma=‘scale’ | 83.5% | 88.2% |
| RF | max_depth=2, random_state=0 | 95.6% | 95.6% |
Publisher’s Note: MDPI stays neutral with regard to jurisdictional claims in published maps and institutional affiliations. |
© 2022 by the authors. Licensee MDPI, Basel, Switzerland. This article is an open access article distributed under the terms and conditions of the Creative Commons Attribution (CC BY) license (https://creativecommons.org/licenses/by/4.0/).
Share and Cite
Liu, J.; Foged, I.W.; Moeslund, T.B. Clothing Insulation Rate and Metabolic Rate Estimation for Individual Thermal Comfort Assessment in Real Life. Sensors 2022, 22, 619. https://doi.org/10.3390/s22020619
Liu J, Foged IW, Moeslund TB. Clothing Insulation Rate and Metabolic Rate Estimation for Individual Thermal Comfort Assessment in Real Life. Sensors. 2022; 22(2):619. https://doi.org/10.3390/s22020619
Chicago/Turabian StyleLiu, Jinsong, Isak Worre Foged, and Thomas B. Moeslund. 2022. "Clothing Insulation Rate and Metabolic Rate Estimation for Individual Thermal Comfort Assessment in Real Life" Sensors 22, no. 2: 619. https://doi.org/10.3390/s22020619
APA StyleLiu, J., Foged, I. W., & Moeslund, T. B. (2022). Clothing Insulation Rate and Metabolic Rate Estimation for Individual Thermal Comfort Assessment in Real Life. Sensors, 22(2), 619. https://doi.org/10.3390/s22020619