


Fast and Non-Destructive Quail Egg Freshness Assessment Using a Thermal Camera and Deep Learning-Based Air Cell Detection Algorithms for the Revalidation of the Expiration Date of Eggs


Abstract
1. Introduction
2. Materials and Methods
2.1. Experimental Environment
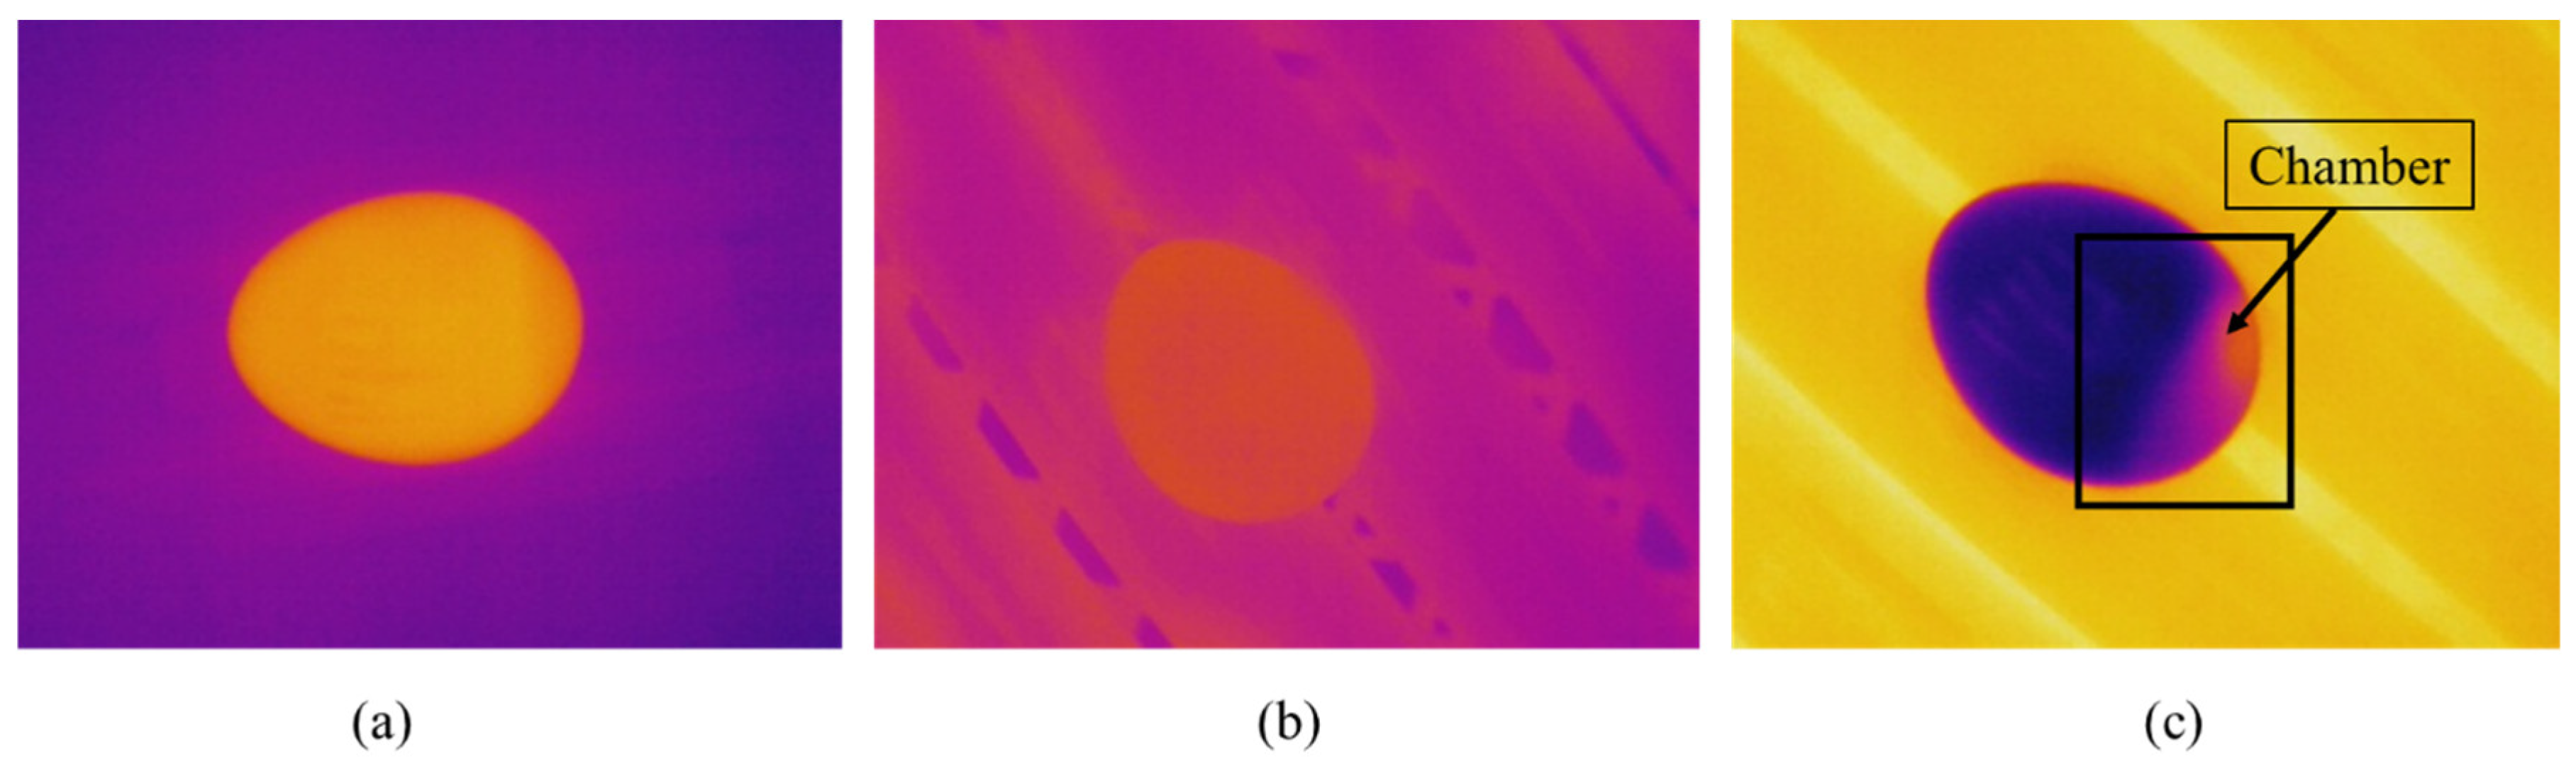
2.2. Thermal Imaging
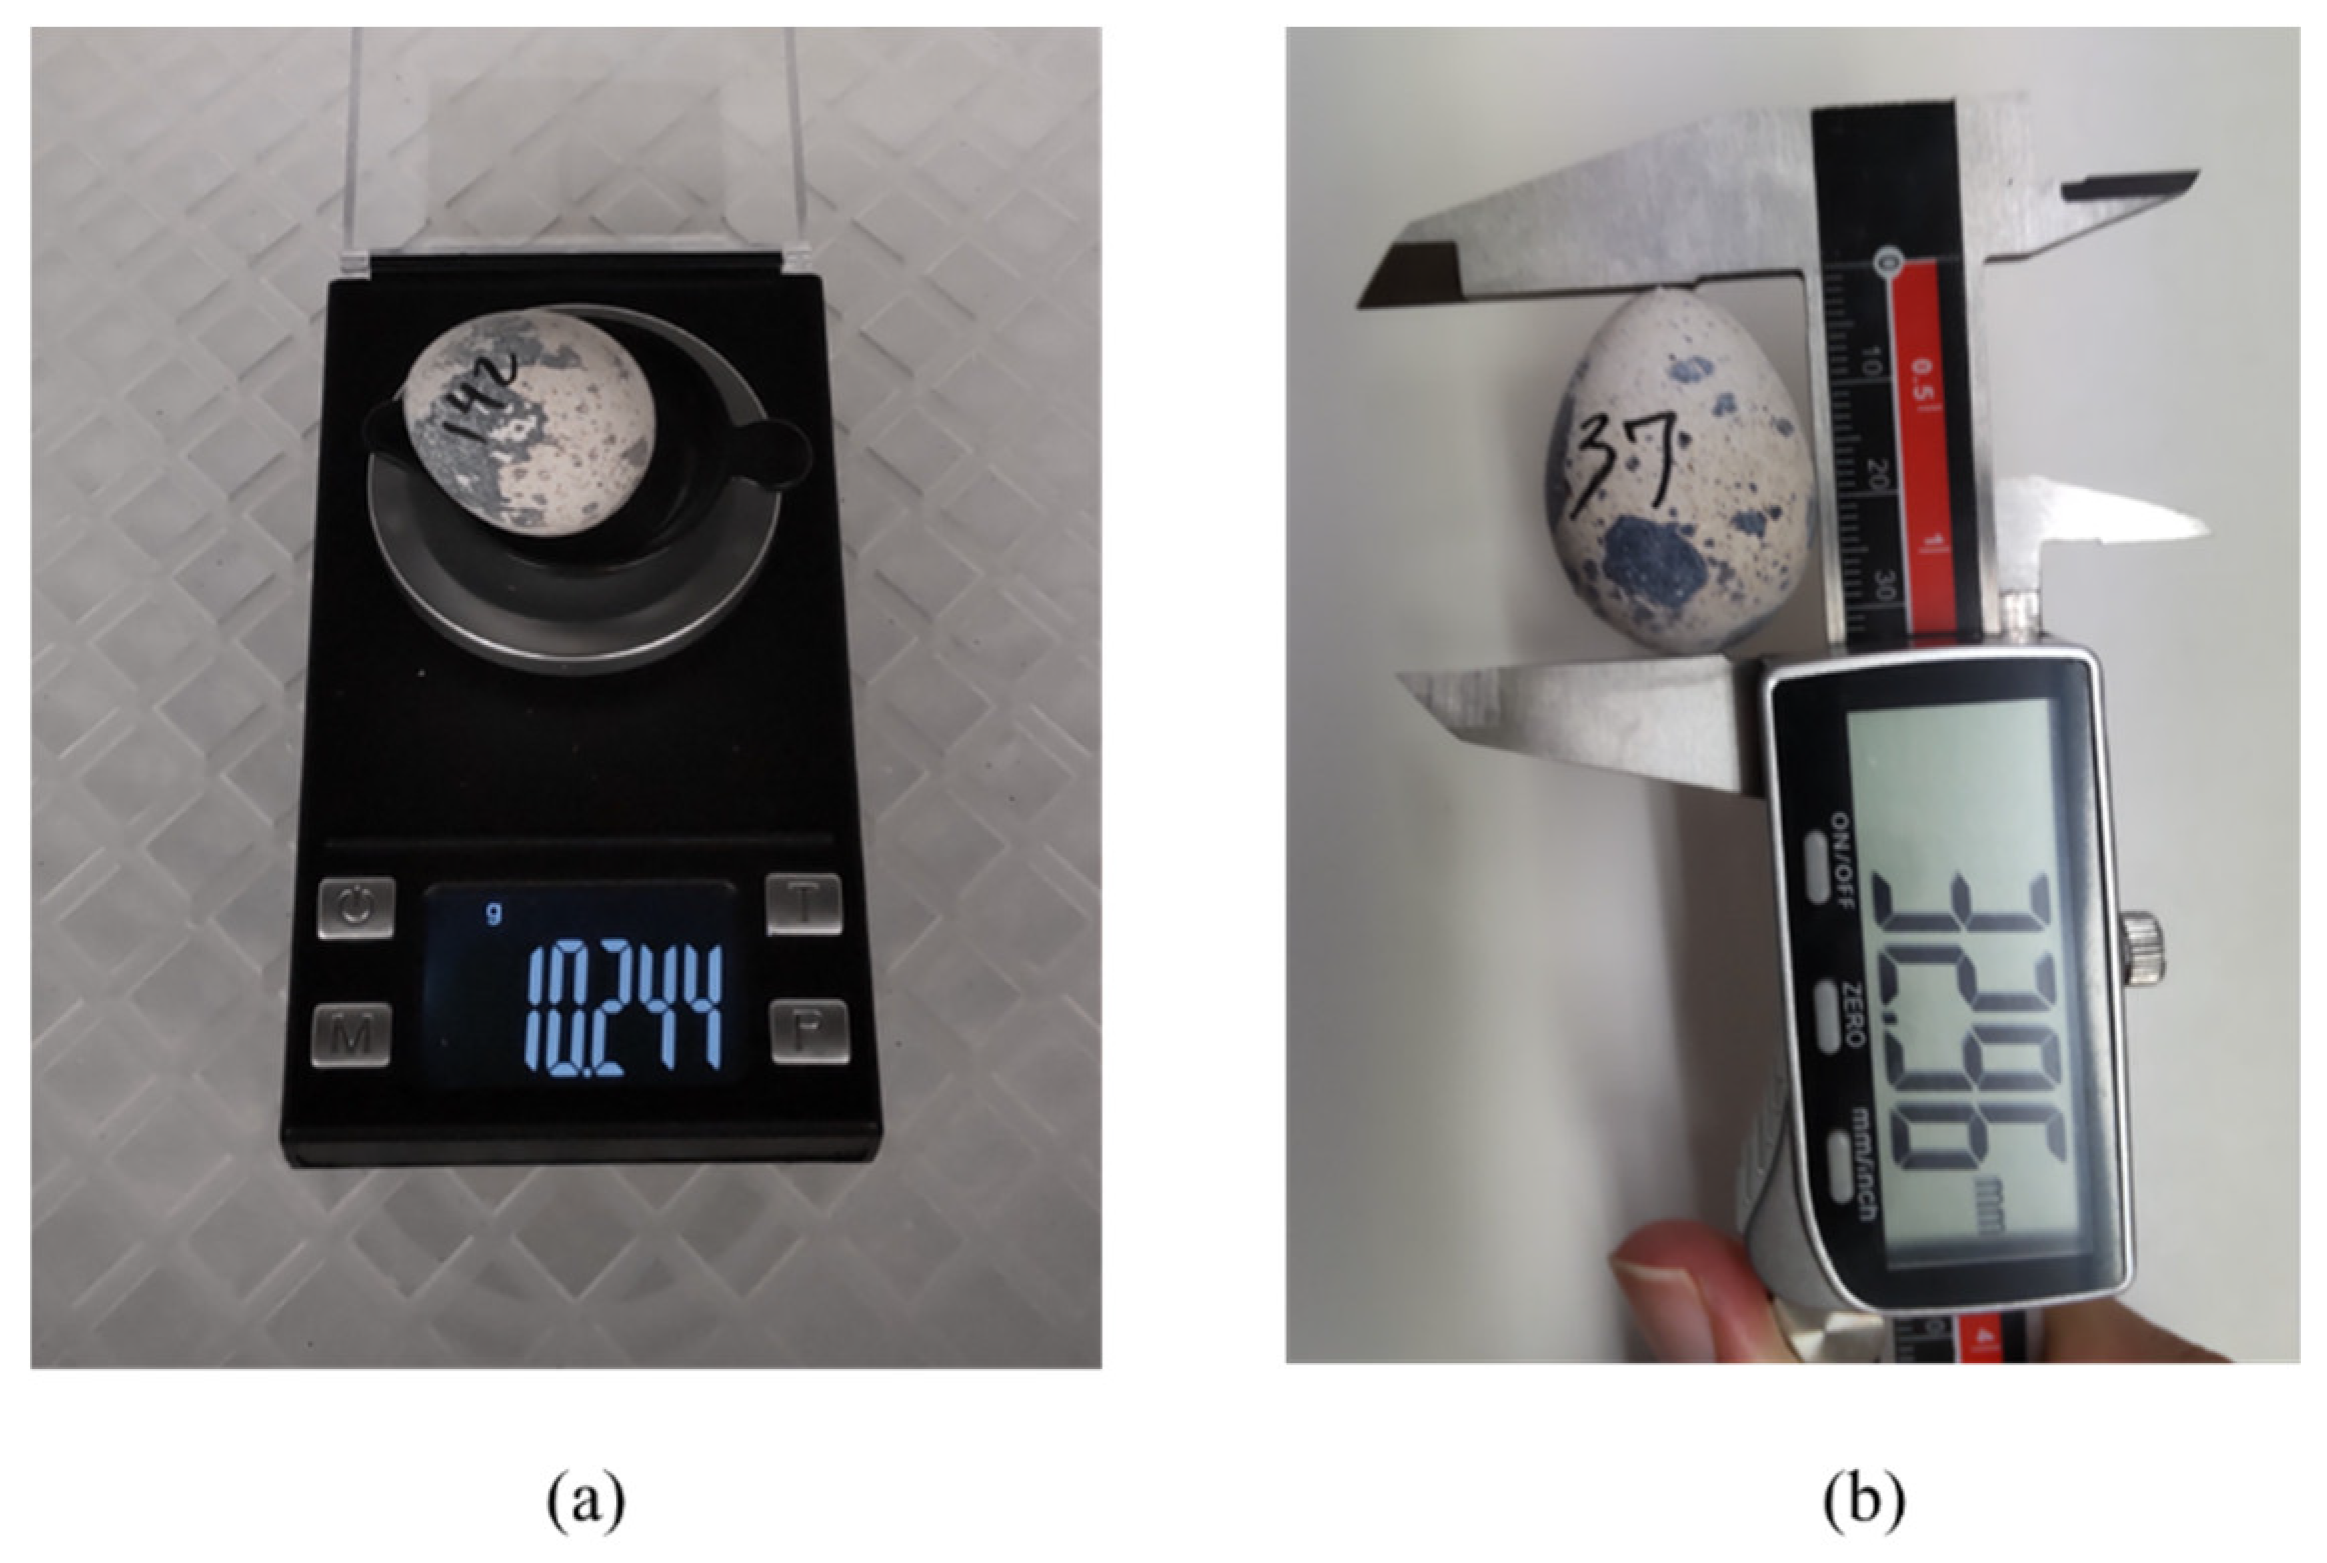
2.3. Dataset Collection
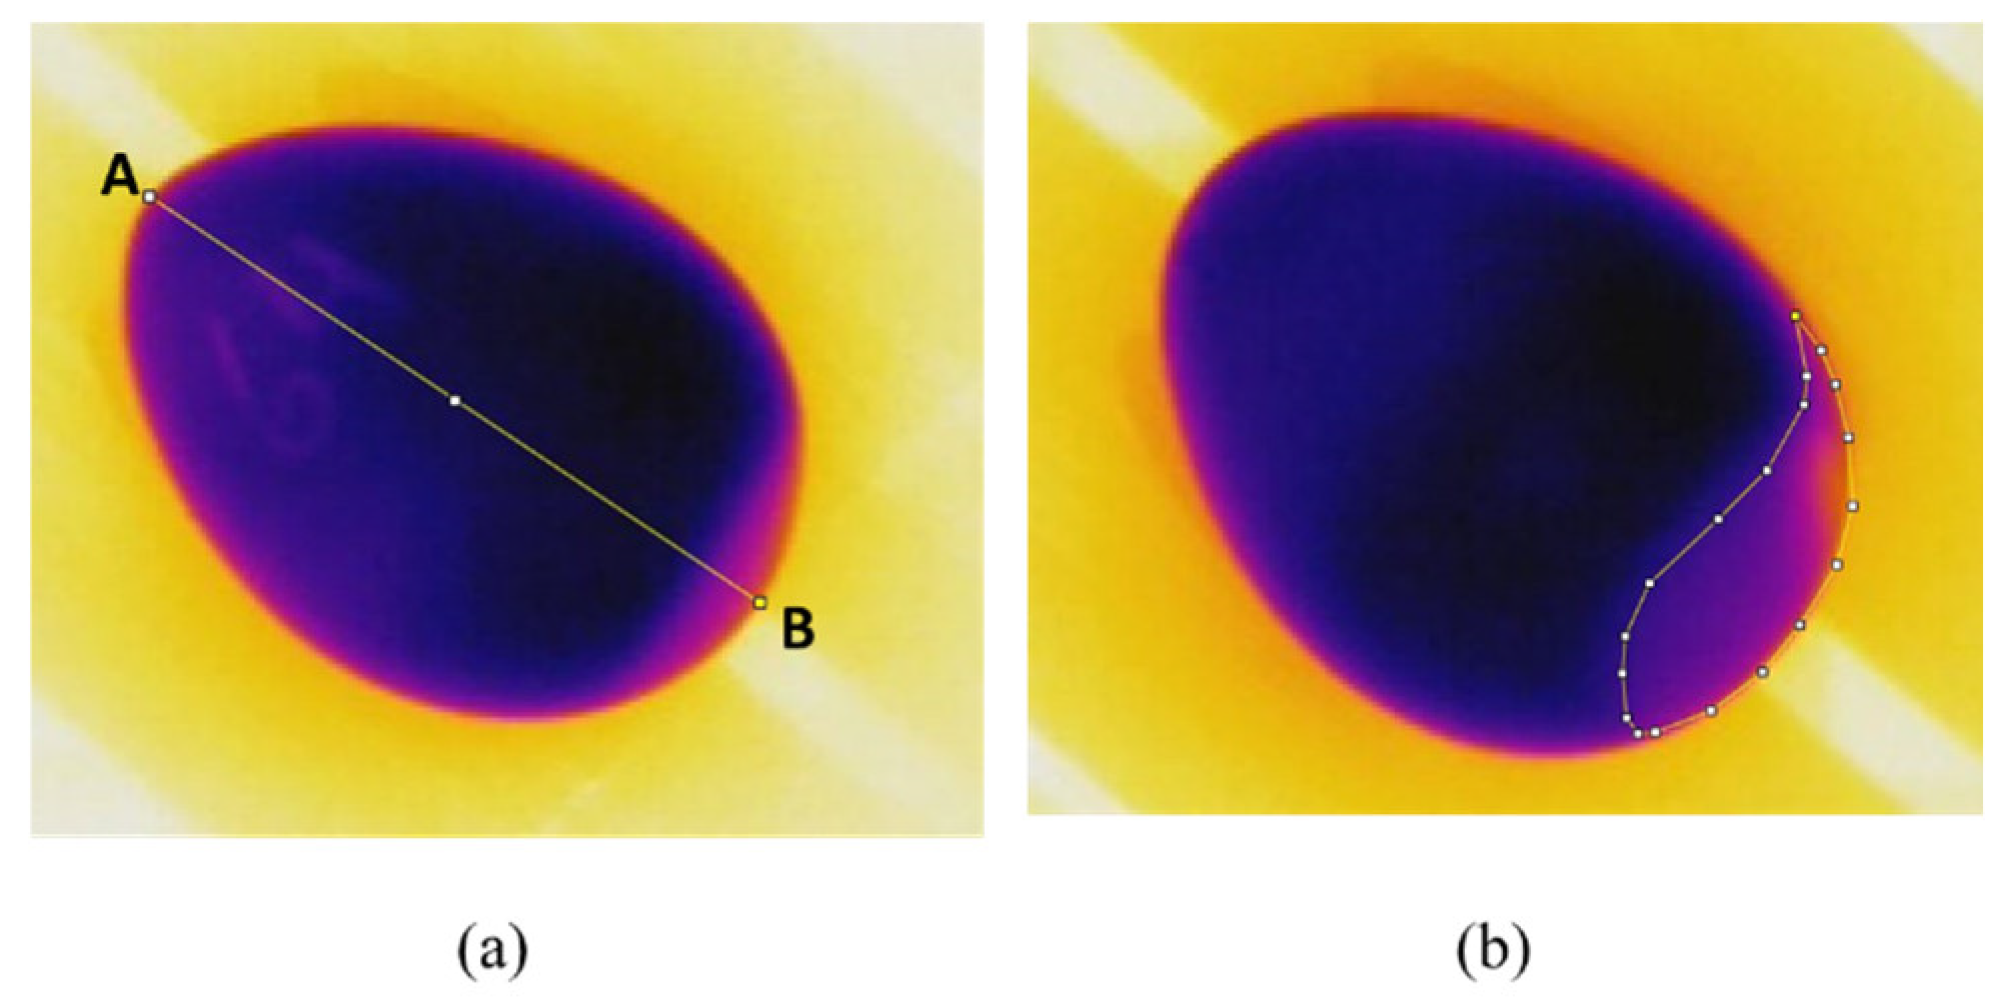
2.4. Air Cell Assessment Methodology
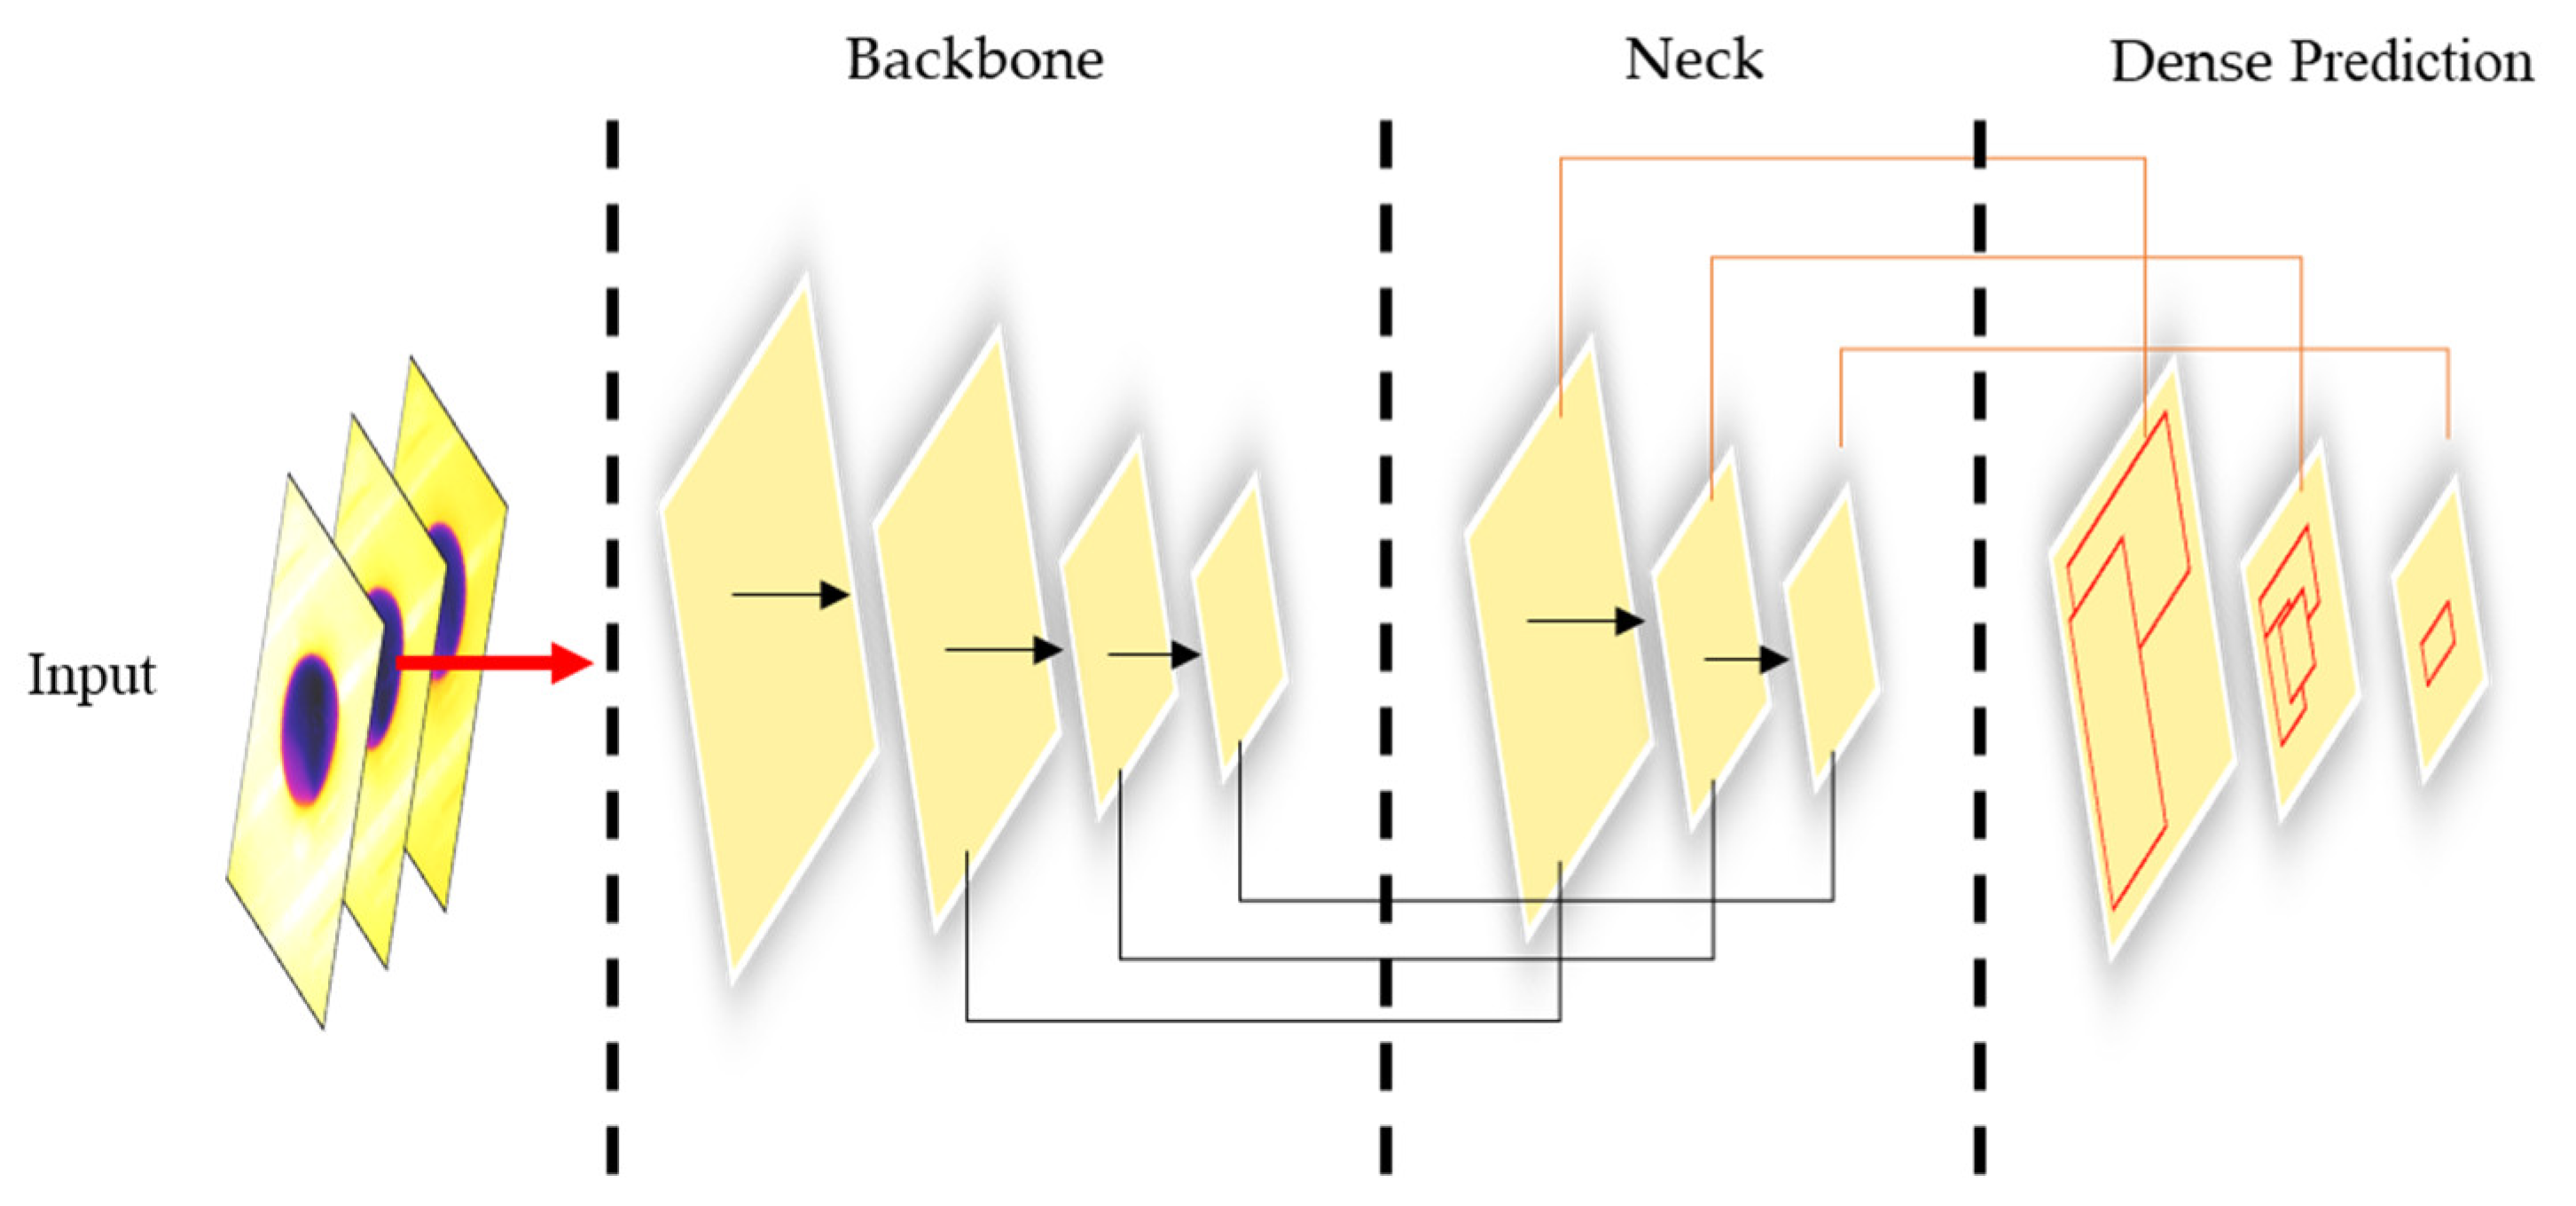
2.5. Deep Learning-Based Object Detection Algorithms
2.5.1. Data Labeling
2.5.2. Training Parameters
2.5.3. Evaluation Metrics
3. Results
3.1. Correlation Test
3.2. Computer Vision Model Prediction
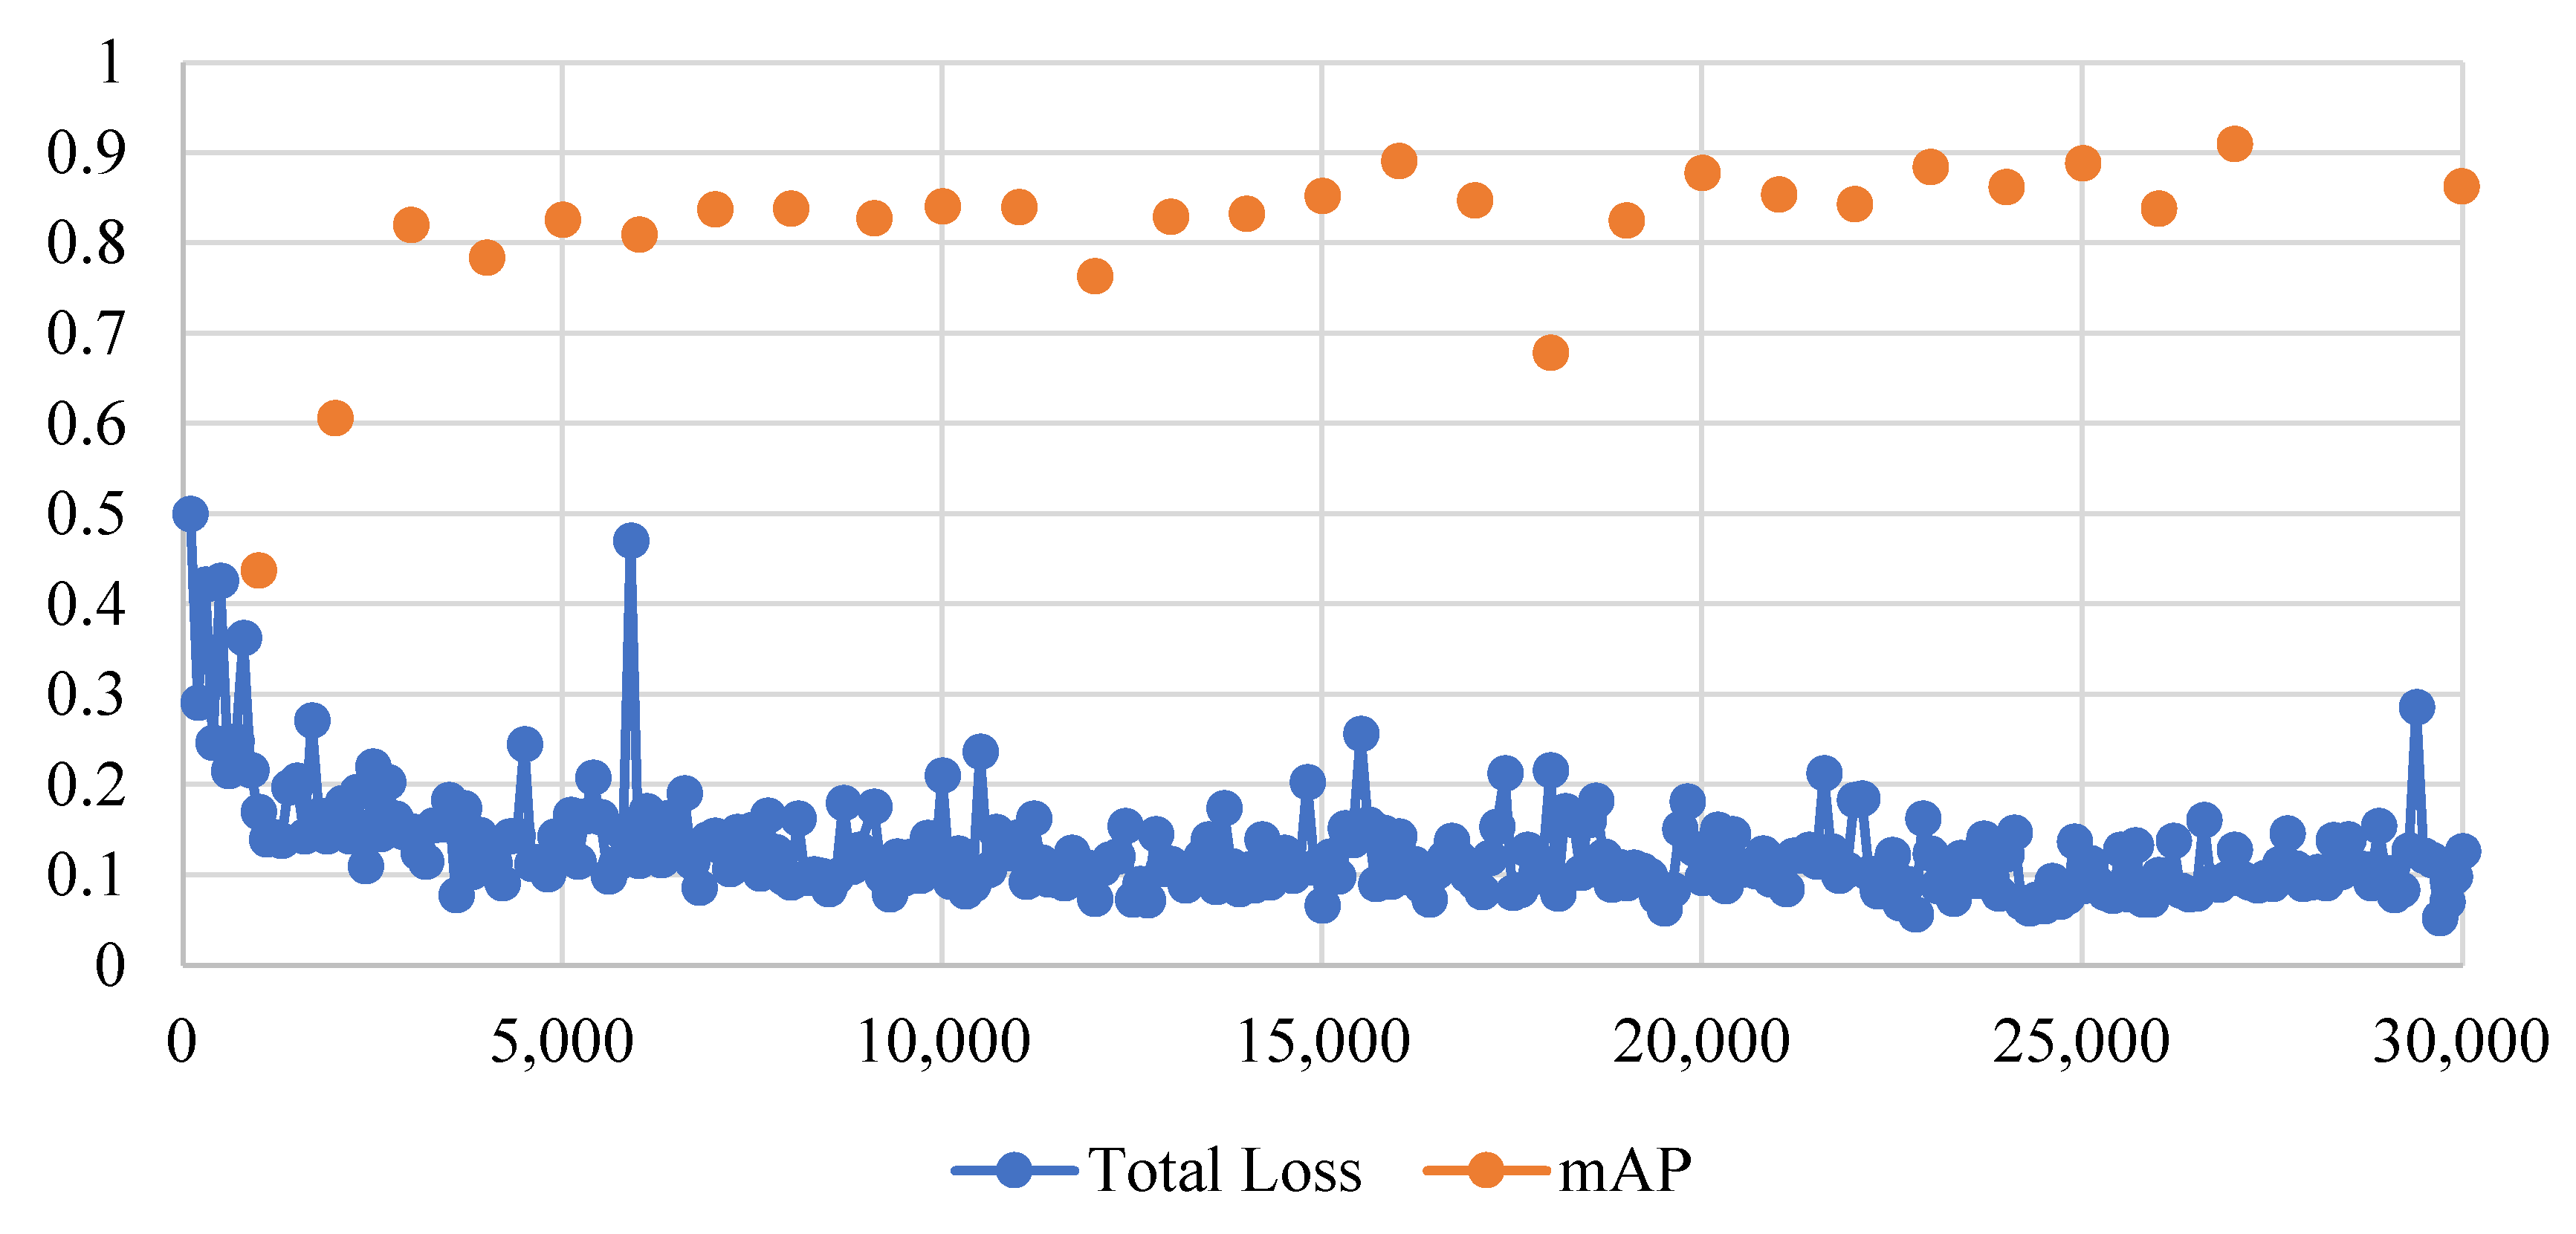
3.2.1. Training Results
3.2.2. Revalidation of the Expiration Date
4. Discussion
5. Conclusions
Author Contributions
Funding
Institutional Review Board Statement
Informed Consent Statement
Data Availability Statement
Conflicts of Interest
References
- Rotz, S.; Gravely, E.; Mosby, I.; Duncan, E.; Finnis, E.; Horgan, M.; LeBlanc, J.; Martin, R.; Neufeld, H.T.; Nixon, A.; et al. Automated pastures and the digital divide: How agricultural technologies are shaping labour and rural communities. J. Rural. Stud. 2019, 68, 112–122. [Google Scholar] [CrossRef]
- Benyam, A.A.; Soma, T.; Fraser, E. Digital agricultural technologies for food loss and waste prevention and reduction: Global trends, adoption opportunities and barriers. J. Clean. Prod. 2021, 323, 129099. [Google Scholar] [CrossRef]
- Redmon, J.; Divvala, S.; Girshick, R.; Farhadi, A. You only look once: Unified, real-time object detection. In Proceedings of the IEEE/CVF Conference on Computer Vision and Pattern Recognition (CVPR), Las Vegas, NV, USA, 27–30 June 2016; pp. 779–788. [Google Scholar]
- Wang, C.-Y.; Bochkovskiy, A.; Liao, H.-Y.M. YOLOv7: Trainable bag-of-freebies sets new state-of-the-art for real-time object detectors. arXiv 2022, arXiv:2207.02696. [Google Scholar]
- Alexey, B.; Wang, C.-Y.; Liao, H.-Y.M. Yolov4: Optimal speed and accuracy of object detection. arXiv 2020, arXiv:2004.10934. [Google Scholar]
- Lin, T.-Y.; Goyal, P.; Girshick, R.; He, K.; Dollar, P. Focal loss for dense object detection. In Proceedings of the IEEE International Conference on Computer Vision (ICCV), Venice, Italy, 22–29 October 2017; pp. 2980–2988. [Google Scholar]
- Liu, W.; Anguelov, D.; Erhan, D.; Szegedy, C.; Reed, S.; Fu, C.-Y.; Berg, A.C. SSD: Single shot multibox detector. In Proceedings of the European Conference on Computer Vision (ECCV), Amsterdam, The Netherlands, 8–16 October 2016; pp. 21–37. [Google Scholar]
- Girshick, R.; Donahue, J.; Darrell, T.; Malik, J. Rich feature hierarchies for accurate object detection and semantic segmentation. In Proceedings of the IEEE Conference on Computer Vision and Pattern Recognition (CVPR), Columbus, OH, USA, 23–28 June 2014; pp. 580–587. [Google Scholar]
- Girshick, R. Fast R-CNN. In Proceedings of the IEEE International Conference on Computer Vision (ICCV), Santiago, Chil, 7–13 December 2015; pp. 1440–1448. [Google Scholar]
- Ren, S.; He, K.; Girshick, R.; Sun, J. Faster R-CNN: Towards real-time object detection with region proposal networks. In Proceedings of the Advances in Neural Information Processing Systems (NIPS), Montreal, QC, Canada, 7–12 December 2015; pp. 91–99. [Google Scholar]
- Zhao, Z.-Q.; Zheng, P.; Xu, S.-T.; Wu, X. Object Detection With Deep Learning: A Review. IEEE Trans. Neural Netw. Learn. Syst. 2019, 30, 3212–3232. [Google Scholar] [CrossRef] [PubMed]
- Joseph, R.; Farhadi, A. YOLO9000: Better, faster, stronger. In Proceedings of the IEEE conference on computer vision and pattern recognition, Honolulu, HI, USA, 21–26 July 2017. [Google Scholar]
- Joseph, R.; Farhadi, A. Yolov3: An incremental improvement. arXiv 2018, arXiv:1804.02767. [Google Scholar]
- Jiang, P.; Ergu, D.; Liu, F.; Cai, Y.; Ma, B. A Review of Yolo Algorithm Developments. Procedia Comput. Sci. 2022, 199, 1066–1073. [Google Scholar] [CrossRef]
- Lawal, M.O. Tomato detection based on modified YOLOv3 framework. Sci. Rep. 2021, 11, 1447. [Google Scholar] [CrossRef]
- Gai, R.; Chen, N.; Yuan, H. A detection algorithm for cherry fruits based on the improved YOLO-v4 model. Neural Comput. Appl. 2021. [Google Scholar] [CrossRef]
- Kuznetsova, A.; Maleva, T.; Soloviev, V. YOLOv5 versus YOLOv3 for Apple Detection. In Cyber-Physical Systems: Modelling and Intelligent Control. Studies in Systems, Decision and Control; Kravets, A.G., Bolshakov, A.A., Shcherbakov, M., Eds.; Springer: Cham, Switzerland, 2021; Volume 338, pp. 349–358. [Google Scholar]
- Qi, J.; Liu, X.; Liu, K.; Xu, F.; Guo, H.; Tian, X.; Li, M.; Bao, Z.; Li, Y. An improved YOLOv5 model based on visual attention mechanism: Application to recognition of tomato virus disease. Comput. Electron. Agric. 2022, 194, 106780. [Google Scholar] [CrossRef]
- Fan, S.; Liang, X.; Huang, W.; Zhang, V.J.; Pang, Q.; He, X.; Li, L.; Zhang, C. Real-time defects detection for apple sorting using NIR cameras with pruning-based YOLOV4 network. Comput. Electron. Agric. 2022, 193, 106715. [Google Scholar] [CrossRef]
- Chen, C.; Liang, Y.; Zhou, L.; Tang, X.; Dai, M. An automatic inspection system for pest detection in granaries using YOLOv4. Comput. Electron. Agric. 2022, 201, 107302. [Google Scholar] [CrossRef]
- Li, B.; Ouyang, W.; Sheng, L.; Zeng, X.; Wang, X. GS3D: An efficient 3d object detection framework for autonomous driving. In Proceedings of the IEEE/CVF Conference on Computer Vision and Pattern Recognition (CVPR), Long Beach, CA, USA, 15–20 June 2019; pp. 1019–1028. [Google Scholar]
- Gupta, A.; Anpalagan, A.; Guan, L.; Khwaja, A.S. Deep learning for object detection and scene perception in self-driving cars: Survey, challenges, and open issues. Array 2021, 10, 100057. [Google Scholar] [CrossRef]
- Karaoguz, H.; Jensfelt, P. Object detection approach for robot grasp detection. In Proceedings of the IEEE International Conference on Robotics and Automation (ICRA), Montreal, QC, Canada, 20–24 May 2019; pp. 4953–4959. [Google Scholar]
- Parico, A.I.B.; Ahamed, T. Real Time Pear Fruit Detection and Counting Using YOLOv4 Models and Deep SORT. Sensors 2021, 21, 4803. [Google Scholar] [CrossRef]
- Zhang, Y.; Sun, P.; Jiang, Y.; Yu, D.; Yuan, Z.; Luo, P.; Liu, W.; Wang, X. BYTETrack: Multi-object tracking by associating every detection box. arXiv 2021, arXiv:2110.06864. [Google Scholar]
- Karoui, R.; Kemps, B.; Bamelis, F.; De Ketelaere, B.; Decuypere, E.; De Baerdemaeker, J. Methods to evaluate egg freshness in research and industry: A review. Eur. Food Res. Technol. 2006, 222, 727–732. [Google Scholar] [CrossRef]
- Schmilovitch, Z.; Hoffman, A.; Egozi, H.; Klein, E. Determination of egg freshness by NNIR spectroscopy. In Proceedings of the AgEn Conference, Budapest, Hungary, 30 June–4 July 2002. Paper number 02-AP-023. [Google Scholar]
- Romanoff, A.L.; Romanoff, A.J. Physicochemical properties. In The Avian Egg; John Wiley & Sons Inc.: New York, NY, USA, 1949. [Google Scholar]
- Burley, R.W. The albumen: Chemistry. In The Avian Egg: Chemistry and Biology; Wiley-Interscience: Hoboken, NJ, USA, 1989; pp. 65–128. [Google Scholar]
- Brasil, Y.L.; Cruz-Tirado, J.; Barbin, D.F. Fast online estimation of quail eggs freshness using portable NIR spectrometer and machine learning. Food Control 2022, 131, 108418. [Google Scholar] [CrossRef]
- Stadelman, W.J.; Newkirk, D.; Newby, L. Egg Science and Technology; CRC Press: Boca Raton, FL, USA, 2017. [Google Scholar]
- Haugh, R.R. The Haugh unit for measuring egg quality. United States Egg Poult. Mag. 1937, 43, 522–555. [Google Scholar]
- Dong, X.; Dong, J.; Peng, Y.; Tang, X. Comparative study of albumen pH and whole egg pH for the evaluation of egg freshness. Spectrosc. Lett. 2017, 50, 463–469. [Google Scholar] [CrossRef]
- Jiang, S.; Zhu, T.; Jia, D.; Yao, J.; Jiang, Y. Effect of egg freshness on their automatic orientation. J. Sci. Food Agric. 2018, 98, 2642–2650. [Google Scholar] [CrossRef]
- Kumbár, V.; Trnka, J.; Nedomová, Š.; Buchar, J. On the influence of storage duration on rheological properties of liquid egg products and response of eggs to impact loading–Japanese quail eggs. J. Food Eng. 2015, 166, 86–94. [Google Scholar] [CrossRef]
- Giunchi, A.; Berardinelli, A.; Ragni, L.; Fabbri, A.; Silaghi, F.A. Non-destructive freshness assessment of shell eggs using FT-NIR spectroscopy. J. Food Eng. 2008, 89, 142–148. [Google Scholar] [CrossRef]
- Liu, Y.; Ren, X.; Yu, H.; Cheng, Y.; Guo, Y.; Yao, W.; Xie, Y. Non-destructive and online egg freshness assessment from the eggshell based on Raman spectroscopy. Food Control 2020, 118, 107426. [Google Scholar] [CrossRef]
- Dutta, R.; Hines, E.L.; Gardner, J.W.; Udrea, D.D.; Boilot, P. Non-destructive egg freshness determination; an electronic nose-based approach. Meas. Sci. Technol. 2003, 14, 190–198. [Google Scholar] [CrossRef]
- Xiang, X.; Wang, Y.; Yu, Z.; Ma, M.; Zhu, Z.; Jin, Y. Non-destructive characterization of egg odor and fertilization status by SPME/GC-MS coupled with electronic nose. J. Sci. Food Agric. 2019, 99, 3264–3275. [Google Scholar] [CrossRef]
- Liu, M.; Pan, L.Q.; Tu, K.; Liu, P. Determination of egg freshness during shelf life with electronic nose. Nongye Gongcheng Xuebao/Trans. Chin. Soc. Agric. Eng. 2010, 26, 317–321. [Google Scholar]
- Tsarenko, P.P.; Karaseva, Z.H. Ways of improving egg quality. Poult. Abstr. 1986, 12, 129. [Google Scholar]
- Aboonajmi, M.; Setarehdan, S.; Akram, A.; Nishizu, T.; Kondo, N. Prediction of poultry egg freshness using ultrasound. Int. J. Food Prop. 2014, 17, 1889–1899. [Google Scholar] [CrossRef]
- Cattaneo, P.; Balzaretti, C.; Quaglia, F.; Di Giancamillo, M. Valutazione della freschezza delle uova in guscio con metodi chimici e fisici. Ing. Aliment. Conserve Anim. 1997, 13, 9–20. [Google Scholar]
- Harnsoongnoen, S.; Jaroensuk, N. The grades and freshness assessment of eggs based on density detection using machine vision and weighing sensor. Sci. Rep. 2021, 11, 16640. [Google Scholar] [CrossRef]
- Quattrocchi, A.; Freni, F.; Montanini, R.; Turrisi, S.; Zappa, E. Development, Validation and Preliminary Experiments of a Measuring Technique for Eggs Aging Estimation Based on Pulse Phase Thermography. Sensors 2022, 22, 3496. [Google Scholar] [CrossRef] [PubMed]
- EC. Commission Regulation No. 2295/2003 of December 2003 Introducing Detailed Rules for Implementing Council Regulation (EEC) No 1907/90 on Certain Marketing Standards for Eggs (Official Journal of the European Union L 340 of December 2003); EC: Brussels, Belgium, 2003. [Google Scholar]
- BRASIL Ministério da Agricultura, Pecuária e Abastecimento. Portaria n° 1, de 21 de Fevereiro de (1990); BRASIL Ministério da Agricultura, Pecuária e Abastecimento: Brasilia, Brasil, 1990. Available online: https://www.gov.br/agricultura/pt-br/assuntos/inspecao/produtos-animal/empresario/arquivos/Portaria11990ovos.pdf/view (accessed on 17 July 2022).
- Nakaguchi, V.M.; Ahamed, T. Development of an Early Embryo Detection Methodology for Quail Eggs Using a Thermal Micro Camera and the YOLO Deep Learning Algorithm. Sensors 2022, 22, 5820. [Google Scholar] [CrossRef] [PubMed]
- Rasband, W.S. ImageJ. U.S. National Institutes of Health: Bethesda, MD, USA, 1997–2018. Available online: https://imagej.nih.gov/ij/ (accessed on 20 July 2022).
- Ahmad, H.M.; Rahimi, A. Deep learning methods for object detection in smart manufacturing: A survey. J. Manuf. Syst. 2022, 64, 181–196. [Google Scholar] [CrossRef]
- YOLOv5. 2021. Available online: https://github.com/ultralytics/yolov5 (accessed on 12 August 2022).
- YOLOv6. 2022. Available online: https://github.com/meituan/YOLOv6 (accessed on 12 August 2022).
- Paszke, A.; Gross, S.; Massa, F.; Lerer, A.; Bradbury, J.; Chanan, G.; Killeen, T.; Lin, Z.; Gimelshein, N.; Antiga, L.; et al. PyTorch: An Imperative Style, High-Performance Deep Learning Library. In Advances in Neural Information Processing Systems 32; Curran Associates, Inc.: Red Hook, NY, USA, 2019; pp. 8024–8035. Available online: http://papers.neurips.cc/paper/9015-pytorch-an-imperative-style-high-performance-deep-learning-library.pdf (accessed on 12 August 2022).
- Lin, T.Y.; Dollár, P.; Girshick, R.; He, K.; Hariharan, B.; Belongie, S. Feature Pyramid Networks for Object Detection. In Proceedings of the IEEE Conference on Computer Vision and Pattern Recognition, Honolulu, HI, USA, 21–26 July 2017; pp. 2117–2125. Available online: https://arxiv.org/abs/1612.03144v2 (accessed on 12 August 2022).
- Liu, S.; Qi, L.; Qin, H.; Shi, J.; Jia, J. Path Aggregation Network for Instance Segmentation. In Proceedings of the IEEE Conference on Computer Vision and Pattern Recognition, Salt Lake City, UT, USA, 18–23 June 2018; pp. 8759–8768. Available online: https://arxiv.org/abs/1803.01534v4 (accessed on 13 August 2022).
- Upesh, N.; Hossein, E. Comparing YOLOv3, YOLOv4 and YOLOv5 for Autonomous Landing Spot Detection in Faulty UAVs. Sensors 2022, 22, 464. [Google Scholar] [CrossRef]
- Tan, M.; Pang, R.; Le, Q.V. Efficientdet: Scalable and efficient object detection. In Proceedings of the IEEE/CVF Conference on Computer Vision and Pattern Recognition, Seattle, WA, USA, 13–19 June 2020. [Google Scholar]
- Everingham, M.; Van Gool, L.; Williams, C.K.I.; Winn, J.; Zisserman, A. The Pascal Visual Object Classes (VOC) Challenge. Int. J. Comput. Vis. 2009, 88, 303–338. [Google Scholar] [CrossRef]
- Tan, W.; Zhang, Q.; Yang, L.; Tian, L.; Jia, J.; Lu, M.; Liu, X.; Duan, X. Actual time determination of egg freshness: A centroid rate based approach. Food Packag. Shelf Life 2020, 26, 100574. [Google Scholar] [CrossRef]
- Reijrink, I.A.M.; van Duijvendijk, L.A.G.; Meijerhof, R.; Kemp, B.; Brand, H.V.D. Influence of air composition during egg storage on egg characteristics, embryonic development, hatchability, and chick quality. Poult. Sci. 2010, 89, 1992–2000. [Google Scholar] [CrossRef]


| Model | Backbone | Neck | Head | Loss Function | Training Framework |
|---|---|---|---|---|---|
| YOLOv4 | CSPDarknet53 | PANet SPP block | YOLO layer | Binary cross entropy | Darknet |
| YOLOv5 | CSPDarknet53 | PANet Modified FPN | YOLO layer | Binary cross entropy and logits function | PyTorch |
| EfficientDet | EfficientNet | BiFPN | Box Prediction net | Focal loss | TensorFlow |
| Algorithm | Batch Size | Input Size | Momentum | Number of Iterations |
|---|---|---|---|---|
| YOLOv4 | 64 | 416 × 416 | 0.949 | 4000 batches |
| YOLOv5 | 16 | 416 × 416 | 0.937 | 60 epochs |
| EfficientDet | 4 | 512 × 512 | 0.899 | 30,000 steps |
| Metric | Height (mm) | 1st Day Pixel Length | 10th Day Pixel Length | Chamber Area 1st Day | Chamber Area 10th Day | Weight (g) 1st Day | Weight (g) 10th Day |
|---|---|---|---|---|---|---|---|
| Average | 30.993 | 147.678 | 141.122 | 40.464 | 93.763 | 9.902 | 9.282 |
| SD | 1.306 | 16.963 | 18.897 | 32.071 | 59.454 | 0.930 | 0.968 |
| Weight Difference (Mean) | Pixel Area Difference (Mean) | n Observations | Degrees of Freedom (n-2) | T-Statistic | Coefficient (r) | p Value |
|---|---|---|---|---|---|---|
| −0.620 | 53.300 | 148 | 146 | 17.47713 | −0.82256 | 1.3 × 10−37 |
| Model | Precision (P) | Recall (R) | F1 Score | mAP@0.50 |
|---|---|---|---|---|
| YOLOv4 | 0.99 | 0.99 | 0.99 | 99.24% |
| YOLOv5 | 0.99 | 0.99 | 0.99 | 99.5% |
| EfficientDet | 0.95 | 0.73 | 0.82 | 95.0% |
| Model | Total bbox | True Positive (TP) | True Negative (TN) | False-Positive (FP) | False Negative (FN) |
|---|---|---|---|---|---|
| YOLOv4 | 20 | 20 | 22 | 0 | 18 |
| YOLOv5 | 31 | 31 | 22 | 0 | 7 |
| EfficientDet | 29 | 29 | 22 | 0 | 9 |
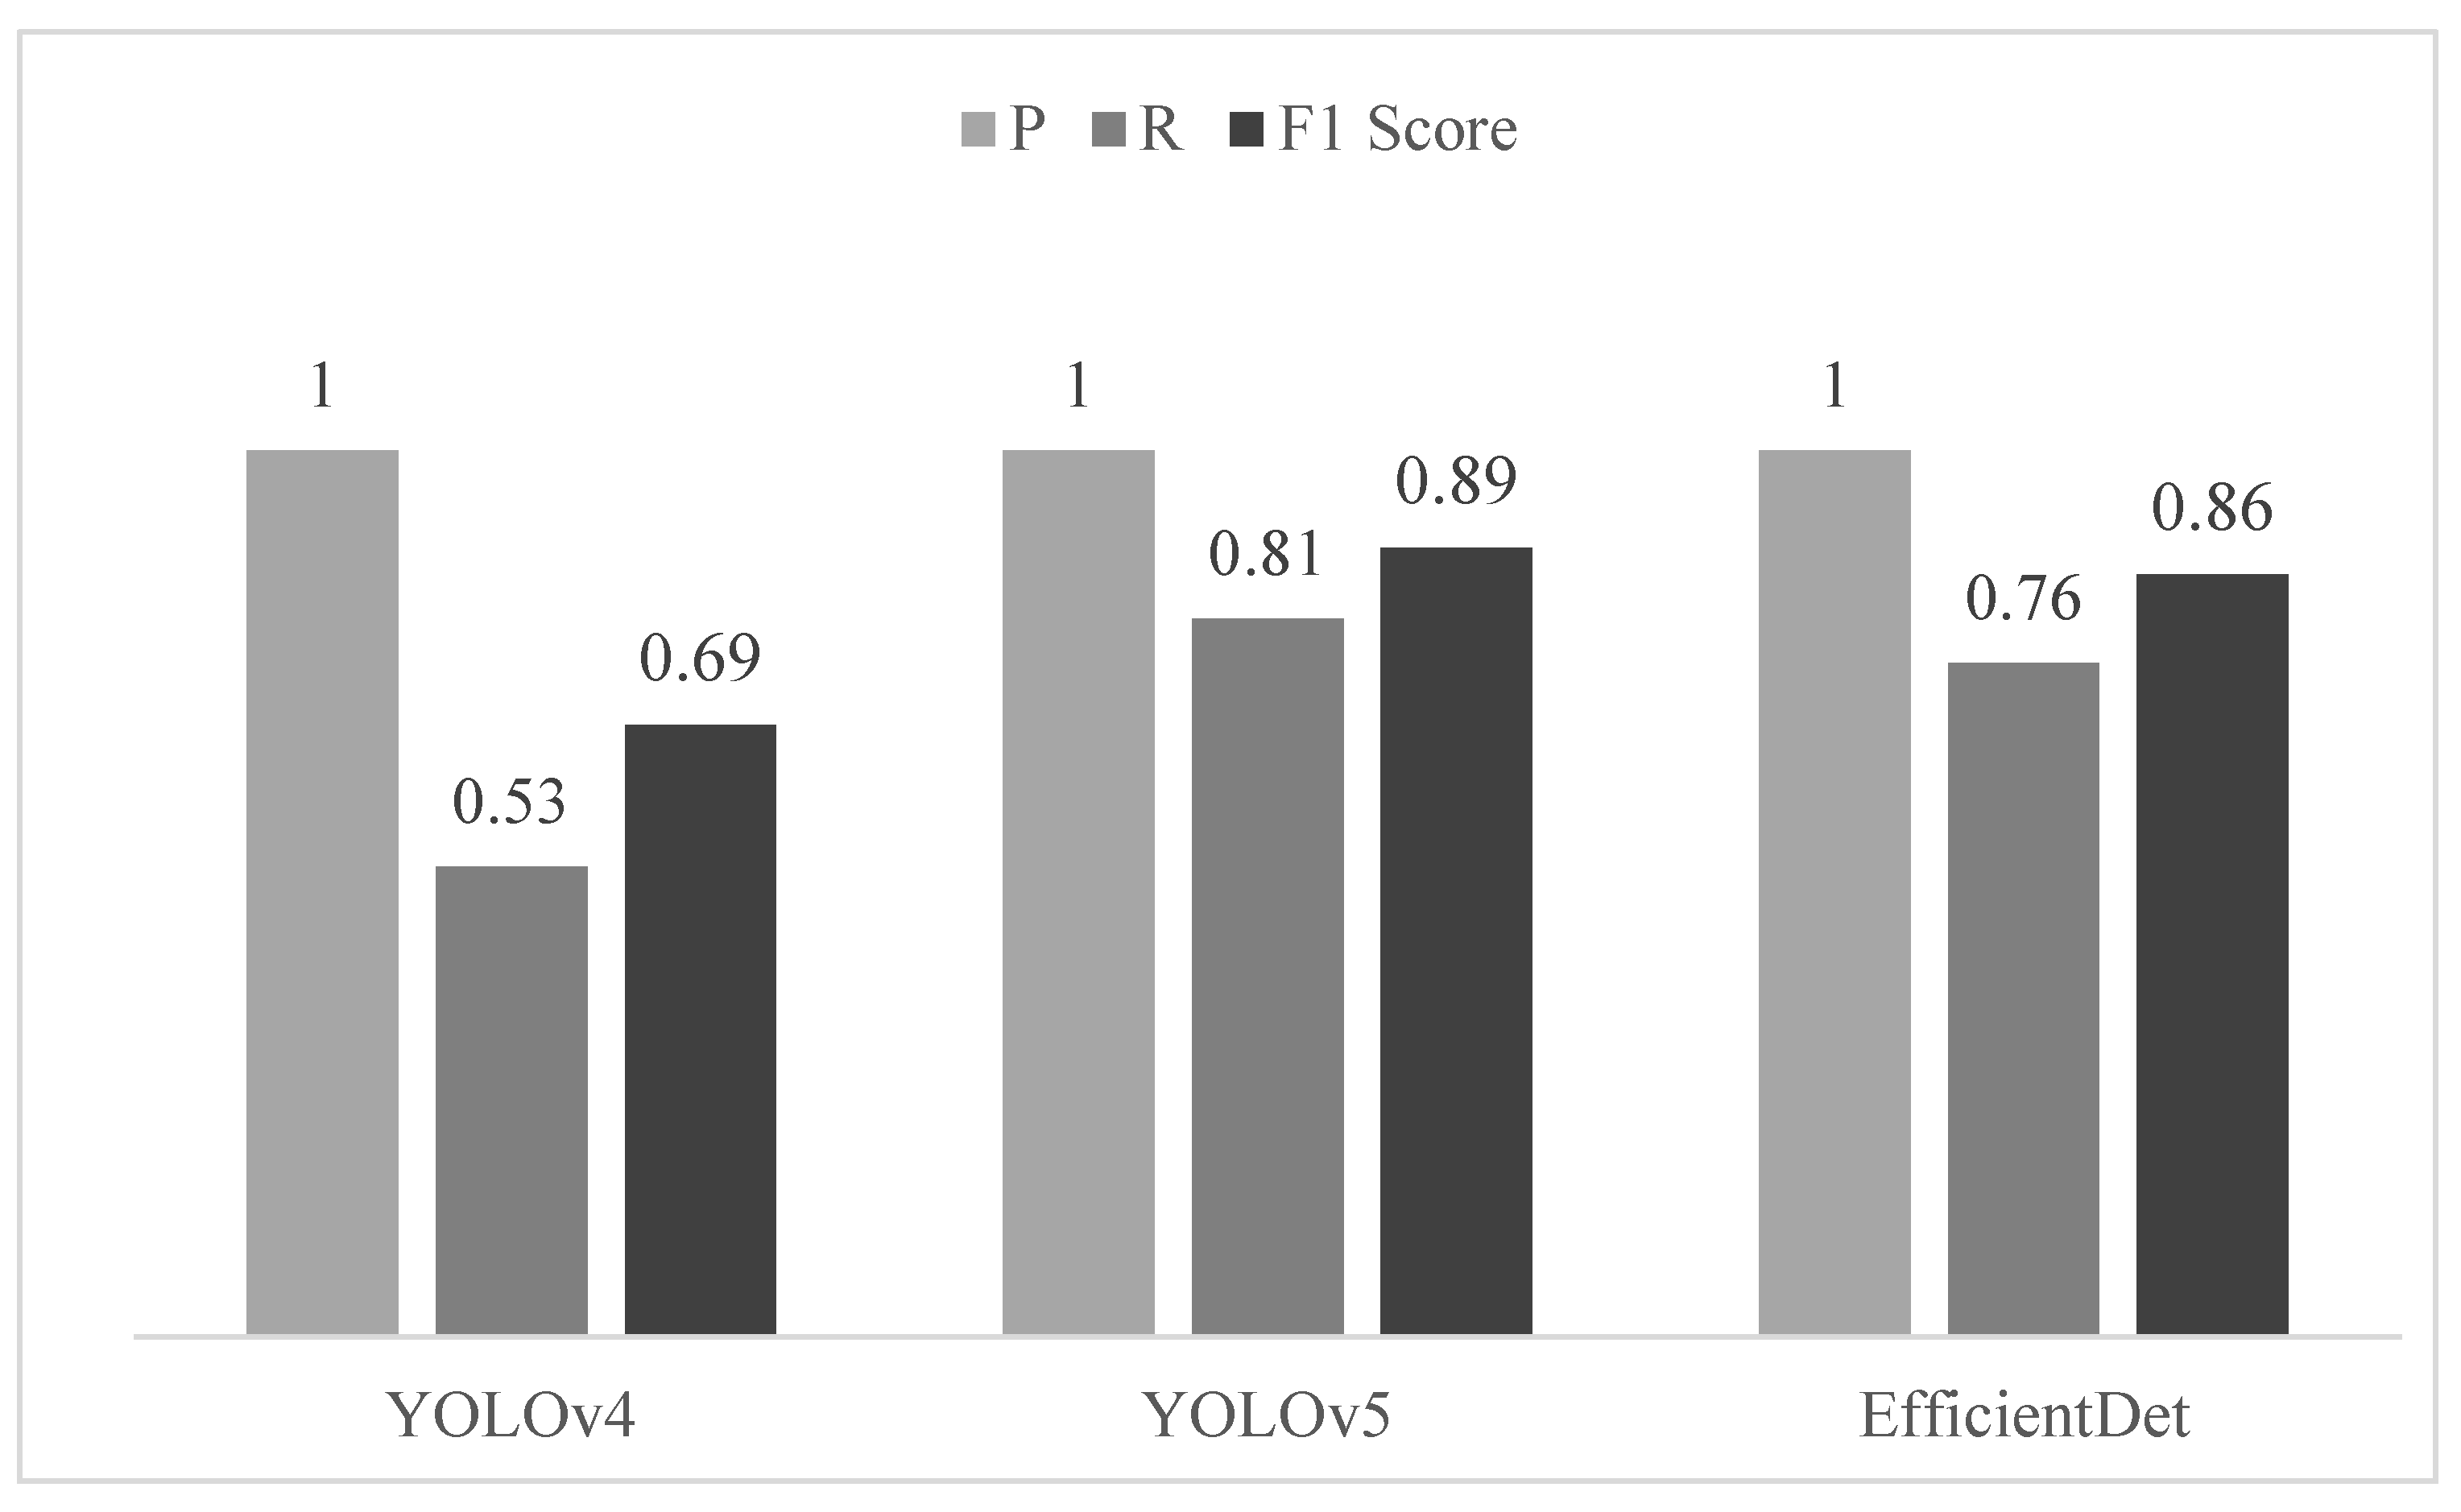
| Model | Precision (P) | Recall (R) | F1 Score |
|---|---|---|---|
| YOLOv4 | 1 | 0.53 | 0.69 |
| YOLOv5 | 1 | 0.81 | 0.89 |
| EfficientDet | 1 | 0.76 | 0.86 |
| Model | Total Eggs | Not Fresh (bbox) | DL Fresh (TN + FN) | True Negative (TN) | DL Revalidation | True Revalidation | Revalidation Error |
|---|---|---|---|---|---|---|---|
| YOLOv4 | 60 | 20 | 40 | 22 | 66.67% | 36.67% | 30.00% |
| YOLOv5 | 60 | 31 | 29 | 22 | 48.33% | 36.67% | 11.67% |
| EfficientDet | 60 | 29 | 31 | 22 | 51.67% | 36.67% | 15.00% |
Publisher’s Note: MDPI stays neutral with regard to jurisdictional claims in published maps and institutional affiliations. |
© 2022 by the authors. Licensee MDPI, Basel, Switzerland. This article is an open access article distributed under the terms and conditions of the Creative Commons Attribution (CC BY) license (https://creativecommons.org/licenses/by/4.0/).
Share and Cite
Nakaguchi, V.M.; Ahamed, T. Fast and Non-Destructive Quail Egg Freshness Assessment Using a Thermal Camera and Deep Learning-Based Air Cell Detection Algorithms for the Revalidation of the Expiration Date of Eggs. Sensors 2022, 22, 7703. https://doi.org/10.3390/s22207703
Nakaguchi VM, Ahamed T. Fast and Non-Destructive Quail Egg Freshness Assessment Using a Thermal Camera and Deep Learning-Based Air Cell Detection Algorithms for the Revalidation of the Expiration Date of Eggs. Sensors. 2022; 22(20):7703. https://doi.org/10.3390/s22207703
Chicago/Turabian StyleNakaguchi, Victor Massaki, and Tofael Ahamed. 2022. "Fast and Non-Destructive Quail Egg Freshness Assessment Using a Thermal Camera and Deep Learning-Based Air Cell Detection Algorithms for the Revalidation of the Expiration Date of Eggs" Sensors 22, no. 20: 7703. https://doi.org/10.3390/s22207703
APA StyleNakaguchi, V. M., & Ahamed, T. (2022). Fast and Non-Destructive Quail Egg Freshness Assessment Using a Thermal Camera and Deep Learning-Based Air Cell Detection Algorithms for the Revalidation of the Expiration Date of Eggs. Sensors, 22(20), 7703. https://doi.org/10.3390/s22207703