1. Introduction
As the population ages, the emergence of diseases such as lower extremity diseases or motor nerve dysfunction have increased leading to an increased rate of elderly adults falling on flat ground. Approximately 32% of community-dwelling elderly adults over 75 years of age will fall at least once during a one-year interval and 24% of these individuals will sustain serious injuries [
1,
2]. In the United Kingdom (UK), the medical costs related to falls are substantial; fall-related injuries in adults greater than 60 years have been reported to cost more than £981 million pounds per year [
3]. Total healthcare spending for elderly falls ranged from
$48 million in Alaska to
$4.4 billion in California. Medicare spending attributable to older adult falls ranged from
$22 million in Alaska to
$3 billion in Florida, as reported in 2014. The lifetime medical costs of fall-related injuries ranged from
$68 million in Vermont to
$2.8 billion in Florida [
3]. As such, falling has become a costly problem in the growing elderly population [
1,
2,
4].
For that reason, the detection and recognition of fall risk has been growing due to the implementation of safety measures [
5] in high-risk work environments, hospitals, and nursing homes [
6].
A person’s pattern of walking can be understood by gait analysis. Gait and balance functions decline through the course of disorders including stroke, dementia, Parkinson’s disease, arthritis, and others [
7,
8,
9]. Gait can serve as a marker of changes in physical status and fall risk [
10]. The gait of the human body refers to the behavioral characteristics of the lower limbs of the human body in the process of upright walking. A normal human gait cycle usually needs to meet the characteristics of natural, coordination of the legs, labor saving, and periodicity. Abnormal gait can develop before the human body falls. Numerous possibilities may cause an abnormal gait. In the field of medical rehabilitation, identification and evaluation of abnormal gait patterns significantly guide lower limb training regimens and flat ground falls prevention strategies.
By monitoring the gait patterns of elderly patients, proper preventive measures can be recommended to reduce the risk of flat ground falls. Human vision may not accurately recognize or quantify the changes in the gait pattern. Therefore, automatic gait recognition using computer vision has become a hot research topic in the biomechanics and healthcare literature in recent years [
10,
11,
12].
Computer-vision technology is used to acquire gait kinematics information, including angles, velocity, and acceleration of the joints based on Kinect skeletal tracking sequences [
12,
13]. The gait analysis involves many interdependent measures that can be difficult to interpret due to a vast amount of data and their inter-relations, and a significant amount of labor is required in off-line data analysis [
14]. This has led to the development of machine learning (ML) for data analysis, and ML has been used for gait analysis [
13,
14]. Dolatabadi et al. [
13] used two ML approaches, an instance-based discriminative classifier (k-nearest neighbor) and a dynamical generative classifier (Gaussian process latent variable model) to distinguish between healthy and pathological gaits with an accuracy of up to 96% when walking at a fast pace. Ortells et al. [
15] developed vision-based gait-impairment analysis to distinguish a normal gait from seven impaired gaits for aided diagnosis. Zakaria et al. [
16] classified Autism Spectrum Disorder (ASD) children’s gait from normal gait by a depth camera and found the accuracy of the support vector machine (SVM) classifier was 98.67% and the Naive Bayes classifier had an accuracy of 99.66%. Chen et al. [
17] and Xu et al. [
18] classified Parkinsonian gait classification using monocular video imaging techniques and kernel-based principal component analysis (PCA) [
17,
18]. These studies demonstrate the advancement of sensor technology and its capacity to collect kinematic and electrophysiological information during walking, which has greatly promoted the development of automated gait recognition technology. However, there remains a lack of real-time computer vision monitoring systems for geriatric gait monitoring for fall-risk warning or home-based remote monitoring. Computer vision using ML computing techniques for flat falls has not been fully understood nor investigated.
ML techniques have been studied for gaiting pattern recognition among different disorders. ML can be used for real-time signal processing and instant output command signals [
19,
20,
21]. The pathway includes collecting data for ML model training and then using it for real-time signal monitoring and the process for commanding signal output for control. Our long-term goal is to develop a real-time ML-based computer vision system for geriatric gait analysis that is capable of predicting flat ground fall risk. We plan to collect gait data among elderly patients with a flat ground fall history to build ML models. This study aimed to design a cost-effective gait-recognition system for the elderly population using different ML algorithms and identify the optimal ML method for building a computer camera monitoring system.
This paper proposed the design of a human gait recognition system using the Azure Kinect camera (Microsoft Inc., Redmond, Seattle, WA, USA). Compared with traditional motion capture equipment, the Kinect camera has the characteristics of easy integration, no need for large-scale data acquisition equipment, and a user-friendly experience. We hypothesized that different gait patterns can be classified and recognized using computer vision and ML techniques. Using the Kinect skeleton tracking technology, the spatial information of the key points of the human skeleton can be accurately obtained, processed through the algorithm, and converted into the joint angle during walking. Unlike other studies that only collect ankle joint information [
12], footstep information [
18], trunk tilt angle [
22], or data from a public database [
23], we collected all joint kinetic data available for ML processing. Moreover, previous studies detected the whole fall event [
12,
18,
22,
23,
24], while our study focused on detecting abnormal gaits (pelvic obliquity gait and knee hyperextension gait) aiming at the prevention of falls. Four automatic classification algorithms were used to classify human gait patterns, including Convolutional Neural Network (CNN), Support Vector Machine (SVM), Long Short-Time Memory (LSTM), and K-Nearest Neighbors (KNN) [
24,
25,
26,
27]. The purpose was to determine the optimal classifier for flat fall gait recognition.
2. Materials and Methods
2.1. Participants and Experimental Devices
Seven healthy subjects (aged 23 to 29 years), including 3 males and 4 females, were recruited in this study. None of the subjects had any history of neurological or musculoskeletal disorders. This study was approved by the Institutional Review Board (IRB) of Shanghai Jiao Tong University (I2022210I). All procedures were performed according to the Declaration of Helsinki. Each subject signed an informed consent form before the start of the experiment.
The equipment used in this study included an Azure Kinect DK integrated camera (Microsoft Inc., Redmond, Seattle, WA, USA), an h/p/cosmos treadmill, and a laptop. The Azure Kinect DK integrated camera was used to photograph and record the key point information of the subject’s angle during the experiment. The camera was placed on the lateral side of a participant aiming at the central axis of the frame. The whole body of a participant was captured for recording. Participants were video recorded during the gait task. These tasks allowed us to visually detect features of 3 gait patterns including normal gait (NG), pelvic obliquity (PO) gait (pelvic-hiking gait) [
28,
29], and knee hyperextension (HK) gait (trunk forward tilt gaits). The h/p/cosmos treadmill was used to control the experimenter’s gait walking speed, and the laptop was used to run software programs and ML algorithms. The software used for walking motion information acquisition included Visual Studio 2019 (Microsoft Inc., Redmond, Seattle, WA, USA), OpenCV (Version 3.4.10, OpenCV Team, Palo Alto, CA, USA), and MATLAB (version 2018, MathWorks, Natick, MA, USA). The ML algorithms were implemented using the PyCharm (Python version 3.7, Boston, MA 02210, USA) and PyTorch (version 1.11, San Francisco, CA, USA) software.
2.2. Experimental Procedures
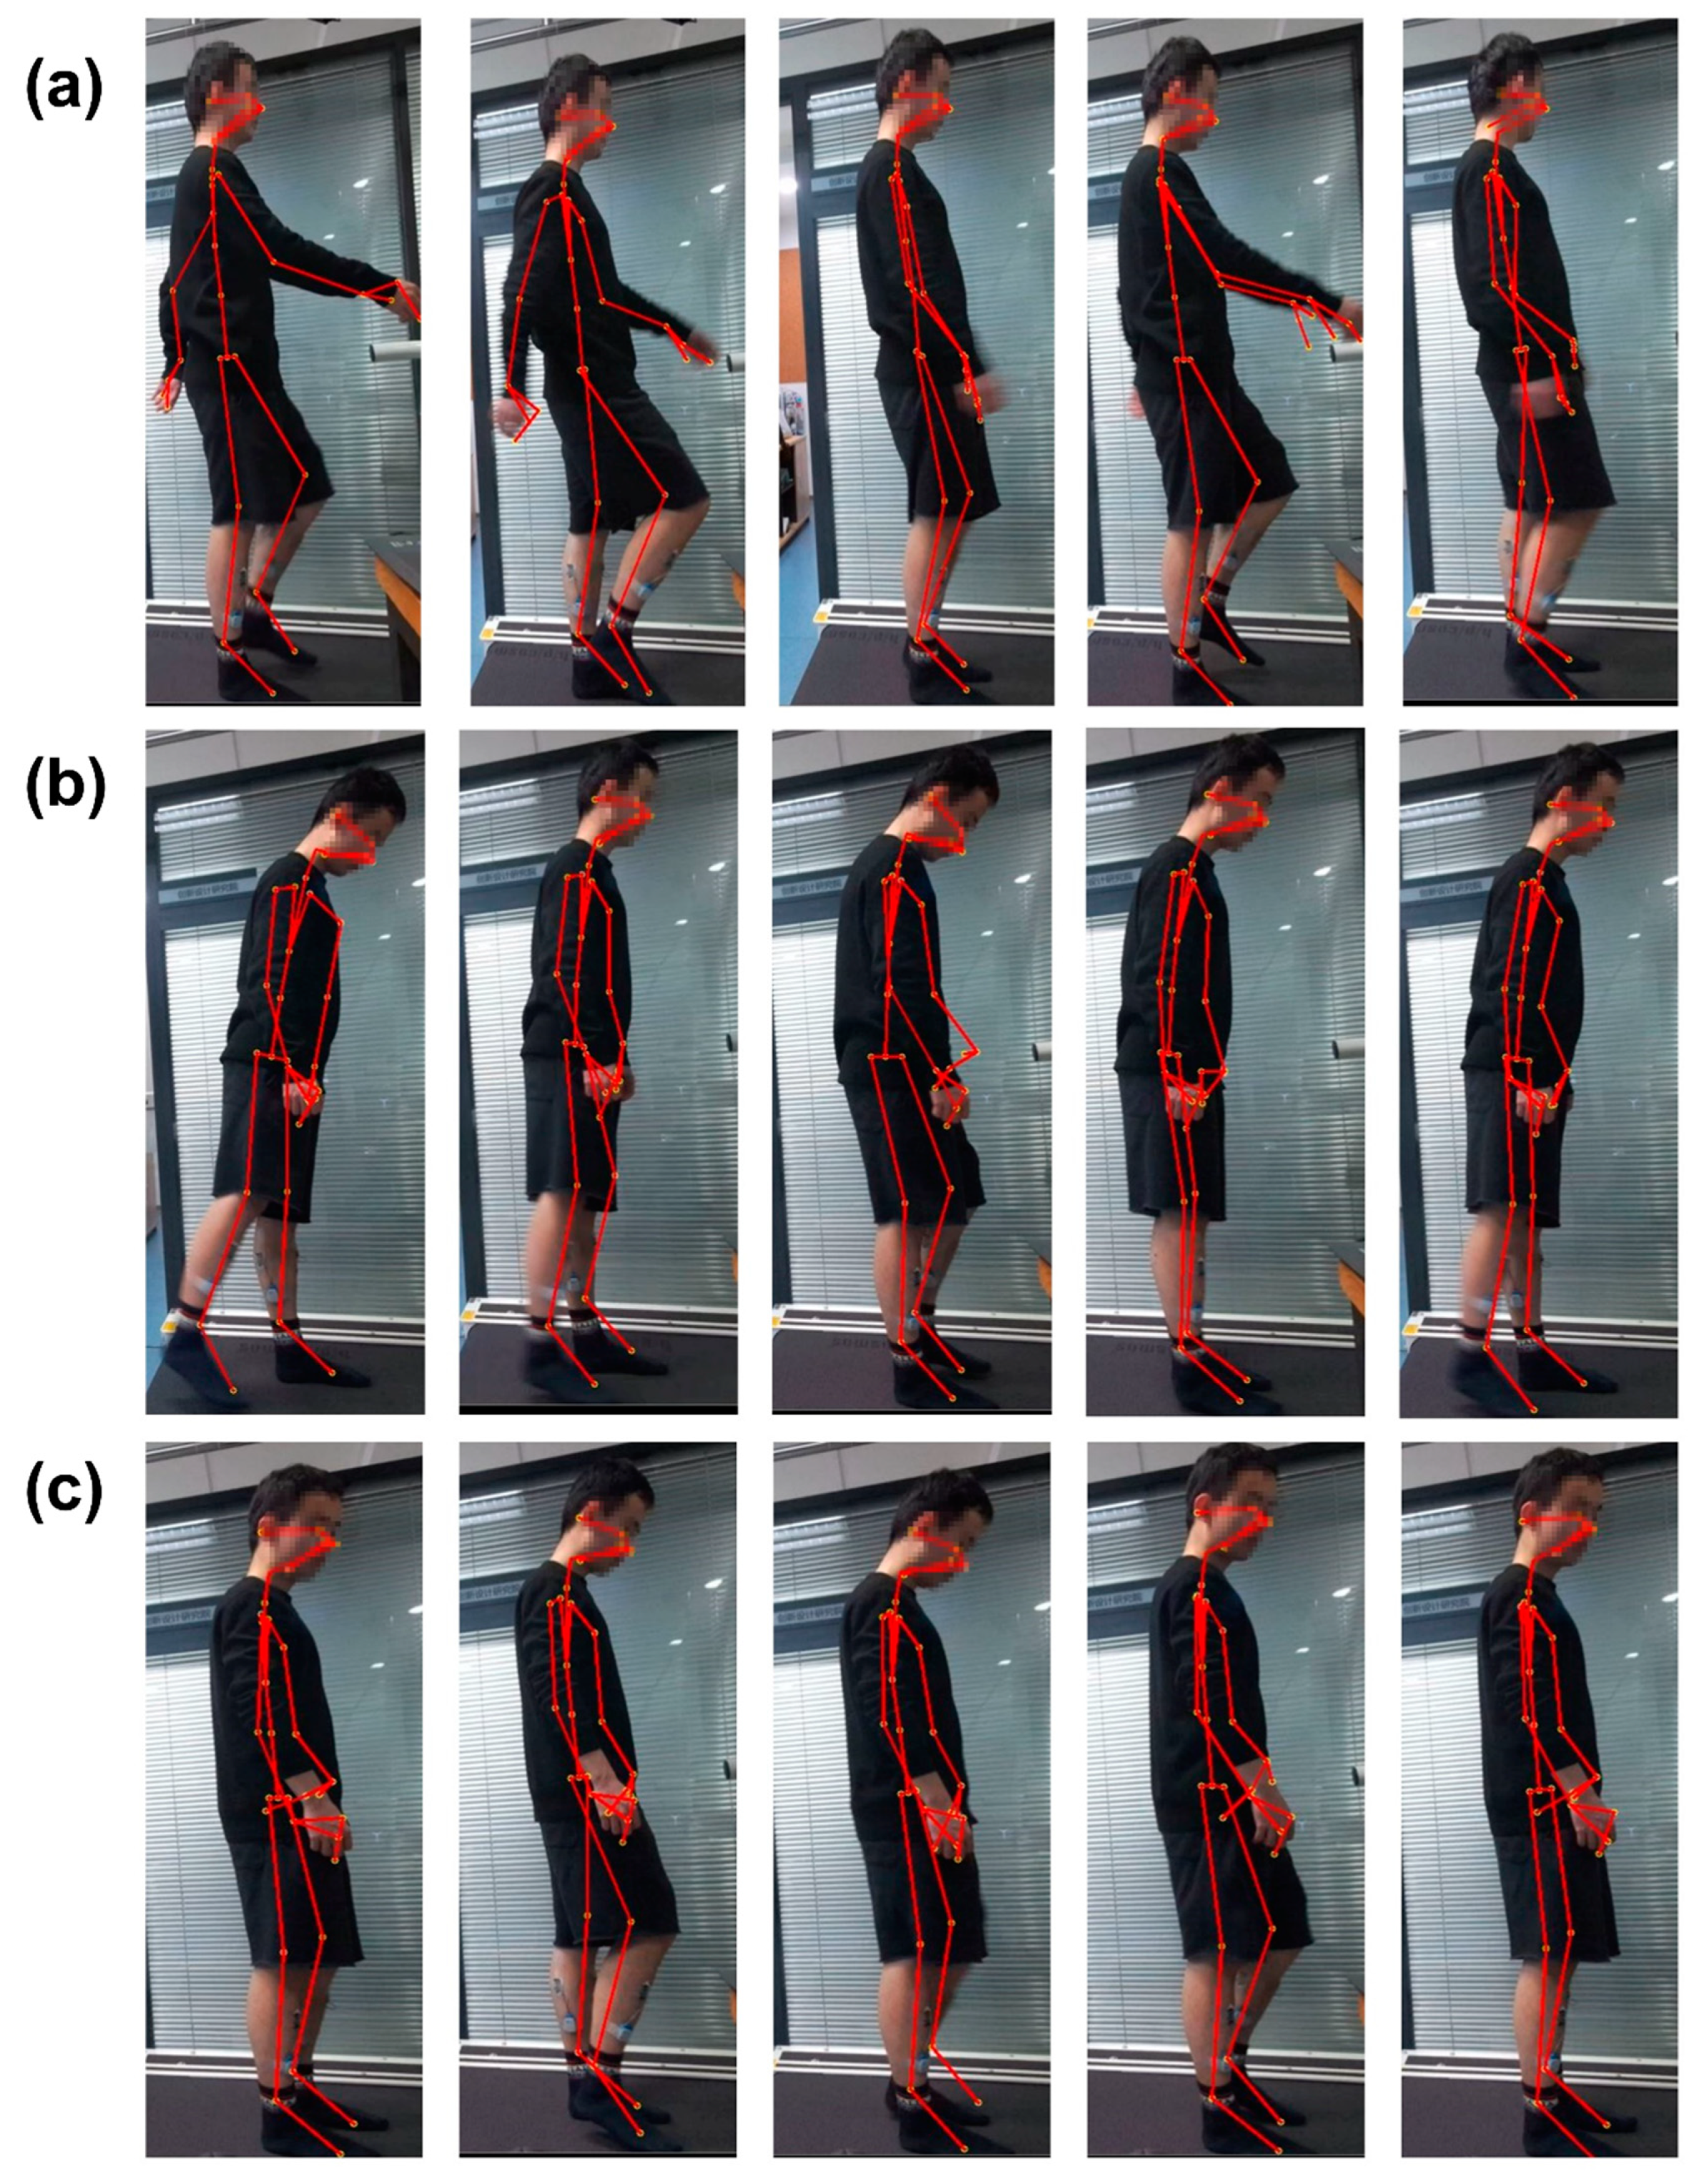
Before the start of the experiment, the participant was given instruction to perform 3 patterns of walking gait and allowed to practice on the treadmill for 3 min. Before the formal experiment, each subject conducted a testing experiment, including practicing 3 designated gaits (
Figure 1) to test equipment connectivity and system setup. During the experiment, the subjects were asked to look forward as much as possible and maintain a steady gait on the treadmill.
In this experiment, the subjects walked on the h/p/cosmos treadmill with the 3 different gait patterns shown in
Figure 1. The 3 types of gaits are normal gait (NG) during normal walking, abnormal gait patterns including pelvic obliquity (PO) gait, and knee hyperextension (KH) gait patterns of the right lower limb. The abnormal gaits were generated for the right lower limb only. Pelvic obliquity gait refers to first the torso being lifted to the left when walking, then lifting the pelvis and stepping out with the right leg. During the knee hyperextension gait, the trunk was tilted forward slightly while the right knee was lifted to step out during walking. These gait patterns occur at the critical moment of a fall and therefore can be used for fall detection [
30].
During the experiment, the speed of the treadmill was set to run at a constant speed of 0.1 m/s. A subject walked on the treadmill at the same speed for 1 min. For each subject, each gait pattern was recorded 5 times to obtain 5 sets of valid experimental datasets; a total of 15 sets of valid experimental datasets were obtained for offline data analysis.
2.3. Kinect Skeleton Tracking Technique
Microsoft Azure Kinect SDK (software development kit) camera and a human skeleton recognition and tracking software toolkit (Azure Kinect Body Tracking SDK) were used in this study. The subject’s motion was tracked in the camera’s depth image field of view with 32 joint point angle readings recorded and saved in the computer while tracking the target. The spatial coordinates and skeleton joint nodes of the upper limb and lower limb, spine, shoulder, and hip are shown in
Figure 2. In this study, the joint points of the lower limbs were extracted for gait pattern recognition. According to the joint points of the lower limbs, the angle of joint flexion and extension was calculated and then used as the featured value of gait recognition.
The skeleton nodes used in the calculation of the lower limb joint angle included right clavicle point A (Clavicle_Right), left clavicle point B (Clavicle_Left), pelvis point C (Pelvis), right hip joint point D (Hip_Right), left hip joint point E (Hip_Left), right knee point F (Knee_Right), left knee point G (Knee_Left), right ankle point H (Ankle_Right), left ankle point I (Ankle_Left) (
Figure 2).
The joint angles used in this experiment include the hip joint flexion and extension angle, hip joint abduction and adduction angle, and knee joint angle. Their definitions are defined as follows:
Hip joint flexion-extension angle: the angle between the thigh vector line (the line connecting D–F points) and trunk line (the line connecting A–D points) on the plane on which these two lines intersect for the right hip joint, and the angle between the E–G line and B–E line for the left hip joint.
Hip joint abduction-adduction angle: the angle between the thigh vector line (the line connecting D–F points) and the pelvic line (the line connecting C–D points) on the plane on which these two lines intersect for the right hip joint, and the angle between the E–G line and C–E line for the left hip joint.
Knee joint angle: the angle between the thigh vector line (the line connecting D–F points) and the leg vector line (the line connecting F–H points) on the plane on which these two lines intersect for the right knee joint, and the angle between the E–G line and G–I line for the left knee joint.
Taking the calculation of the right knee joint as an example, when the coordinates of joint point D were set as (
x1,
y1,
z1), joint point F as (
x2,
y2,
z2), and joint point H as (
x3,
y3,
z3); then the right thigh vector
was expressed as (
X1,
Y1,
Z1), and the right leg vector
as (
X2,
Y2,
Z2), in which
X1 = x1 − x2,
Y1 = y1 −
y2,
Z1 = z1 − z2,
X2 = x2 − x3,
Y2 = y2 − y3,
Z2 = z2 − z3. Thus, the right knee angle
was calculated using the following equation:
The definition and calculation of six joint angles used in this gait pattern recognition study are shown in
Table 1.
The joint angle calculation algorithms were implemented using Visual Studio software (Version 2019, Microsoft Inc., Redmond, Seattle, WA, USA) and C++ language. The frame rate (FPS) of the Kinect camera was set up as 5 fps, in which 5 images per second of the point of the skeleton node positions were captured and processed. The featured vector
Fθ was calculated using six lower limb joint angles of each image of the skeleton node frame. The featured
Fθ is expressed as the following equation:
Participant walking speed was set at 0.1 m/s by following the treadmill moving speed. Because a participant was able to complete at least one gait cycle of the walk within 3 s, a time window of 3 s was used to segment the recorded data into datasets. A total of 2100 sets ([60/3] × 5 × 3 × 7)((60 s/3 s of processing time window) × 5 times of walking on the treadmill per gait pattern × 3 gait patterns × 7 participants) of valid datasets were collected. Each dataset contained 90 (6 × 5 × 3) (6 joint angle readings × 5 frames per second (FPS) × 3 s of the time window for data processing) feature values and their corresponding gait labels of normal, pelvic obliquity gait, and knee hyperextension gait. The data segmentation was performed using MATLAB software.
2.4. Machine Learning-Based Classifiers
In this study, four classifiers were used to classify gait data, including the convolutional neural network (CNN), long short-term memory (LSTM) neural network, support vector machine (SVM), and K-nearest neighbors (KNN) classifier. CNN and LSTM algorithms were implemented using PyCharm and PyTorch. SVM and KNN algorithms were implemented using MATLAB and Toolbox.
2.4.1. Convolutional Neural Network (CNN) Classifier
The convolutional neural network with two 2-dimensional convolutional layers was used in this experiment. The CNN is a type of deep neural network classifier that has been used in image classification and recognition [
31,
32]. It can recognize features directly from the data instead of manually extracting features. Within the CNN structure in this study, the data was put through several layers with different tasks [
33,
34]. The input was imported into the convolution layer where a spatial filter was applied to the inputs in the form of a window of weights. This spatial filter moved vertically and horizontally throughout the inputs to generate the output of the convolution layer, which was rectified by a rectified linear unit (ReLU) and then exported into the pooling layer. The results of the pooling layer were put through a fully connected layer yielding the classification [
35,
36,
37,
38,
39,
40]. This approach has been used in medical applications where datasets are of a small size [
40], demonstrating success in medical image recognition [
41]. During the training phase, an epoch was defined as a full training cycle using the whole training set, and a mini-batch size was a subset of the training set used to update the weights and calculate the gradient descent loss function.
The structure of the proposed CNN is shown in
Figure 3. The input of the CNN was the gait angles derived from Kinect; two 2D-convolutional layers were used in the model, and the output of the model was the classification result of the gait pattern. In the first convolutional layer, the number of filters was 16, kernel size 5, padding 2, and stride 1. For the max pooling in the first layer, the kernel size was 2, padding 0, and stride 2. In the second layer, the number of filters was 32, kernel size 5, padding 2, and stride 1. For the max-pooling in the second layer, the kernel size was 2, padding 0, and stride 2.
The loss function of the model was the cross-entropy loss function, which can be calculated by the following formula:
where
x is the input, class is the index of the target, and
j is the number of classes.
The optimizer of the model was Adam. The training was completed after 500 epochs with a mini-batch size of 16 images when the learning rate was fixed and set to 0.001.
2.4.2. Support Vector Machine (SVM) Classifier
In this study, the support vector machine (SVM) model was applied as one of the classifiers and a Bayesian optimizer was used to optimize the model. SVM [
42] uses different and high dimensional features of the datasets to assign a label to a data point based on their location in the data space. SVM as a supervised learning algorithm has many applications [
18], such as face detection [
43] and bioinformatics [
44]. It is an optimal hyperplane in an N-dimensional space as a decision boundary to separate datasets into two or more classes. [
45]. In this study, we used SVM and the Bayesian optimizer to identify an optimal classifier for gait pattern recognition.
2.4.3. K-Nearest Neighbors (KNN) Classifier
In this paper, we used an automatically optimized KNN model; a Bayesian optimizer was selected as an optimizer and the distance measurement method was implemented using the Euclidean metric method.
KNN (K-nearest neighbors) is another supervised classification algorithm that has no explicit training phase [
46]. The principle of KNN predicts the category of a new value according to the category of the K points closest to it. When using KNN, many parameters need to be optimized, including the number of adjacent points, distance metrics, and distance weights. KNN classification is based on a distance metric between a data point to be classified and already known data points from a training set [
47,
48]. KNN assigns that label to a data point which is shared by the majority of the K nearest surrounding data points of the training set. The setting of the K value affects the accuracy of the model, so the K value in the proposed method varies in the optimization process, and the K value varies between 1–150.
2.4.4. Long Short-Term Memory (LSTM) Neural Network
LSTM is a special recurrent neural network (RNN) structure that can memorize long- and short-term information. Recurrent neural networks (RNNs) are a class of neural networks that are naturally suited to processing time-series data and other sequential data. The traditional RNN network usually produces long-term dependencies after multiple calculations of network nodes, whereas the LSTM network avoids this phenomenon through the design of the structure [
49,
50].
Because gait actions are often closely related to the moments before and after a certain moment, we used a bidirectional LSTM (Bi-LSTM) network for classification. The architecture of the proposed model was shown in
Figure 4. The model was composed of two Bi-LSTM layers and a fully connected (FC) layer. The bi-LSTM layers could process the input information both in forward and backward directions. The output of the current moment is not only affected by the previous state but may also be affected by the future state.
The loss function of the model was a cross-entropy loss function, which can be calculated by Formula (3). The optimizer of the model was Adam. The training was completed after 500 epochs with a mini-batch size of 20 images when the learning rate was fixed and set to 0.0005.
2.5. Statistical Analysis
One-way ANOVA with PostHoc LSD was used to determine the statistical difference of the average range of motion (ROM) of a joint between different gait patterns, as well as the average accuracy of gait pattern recognition between ML algorithms. A Pearson’s chi-square or Bonferroni correction test was performed to determine the difference in the accuracy of each gait pattern recognition among the four individual machine learning algorithms for different gait patterns. SPSS software (Version 28, IBM, Armonk, NY, USA) was used for statistical analysis. A p-value smaller than 0.05 was considered to be statistically significant.


 ,
, 


