
Muscle Oxygenation Measured with Near-Infrared Spectroscopy Following Different Intermittent Training Protocols in a World-Class Kayaker—A Case Study

 ,
, 


Abstract
:1. Introduction
2. Materials and Methods
2.1. Subject
2.2. Design
2.3. Protocols
2.3.1. RT
2.3.2. IT
2.3.3. SIT
2.4. Variables
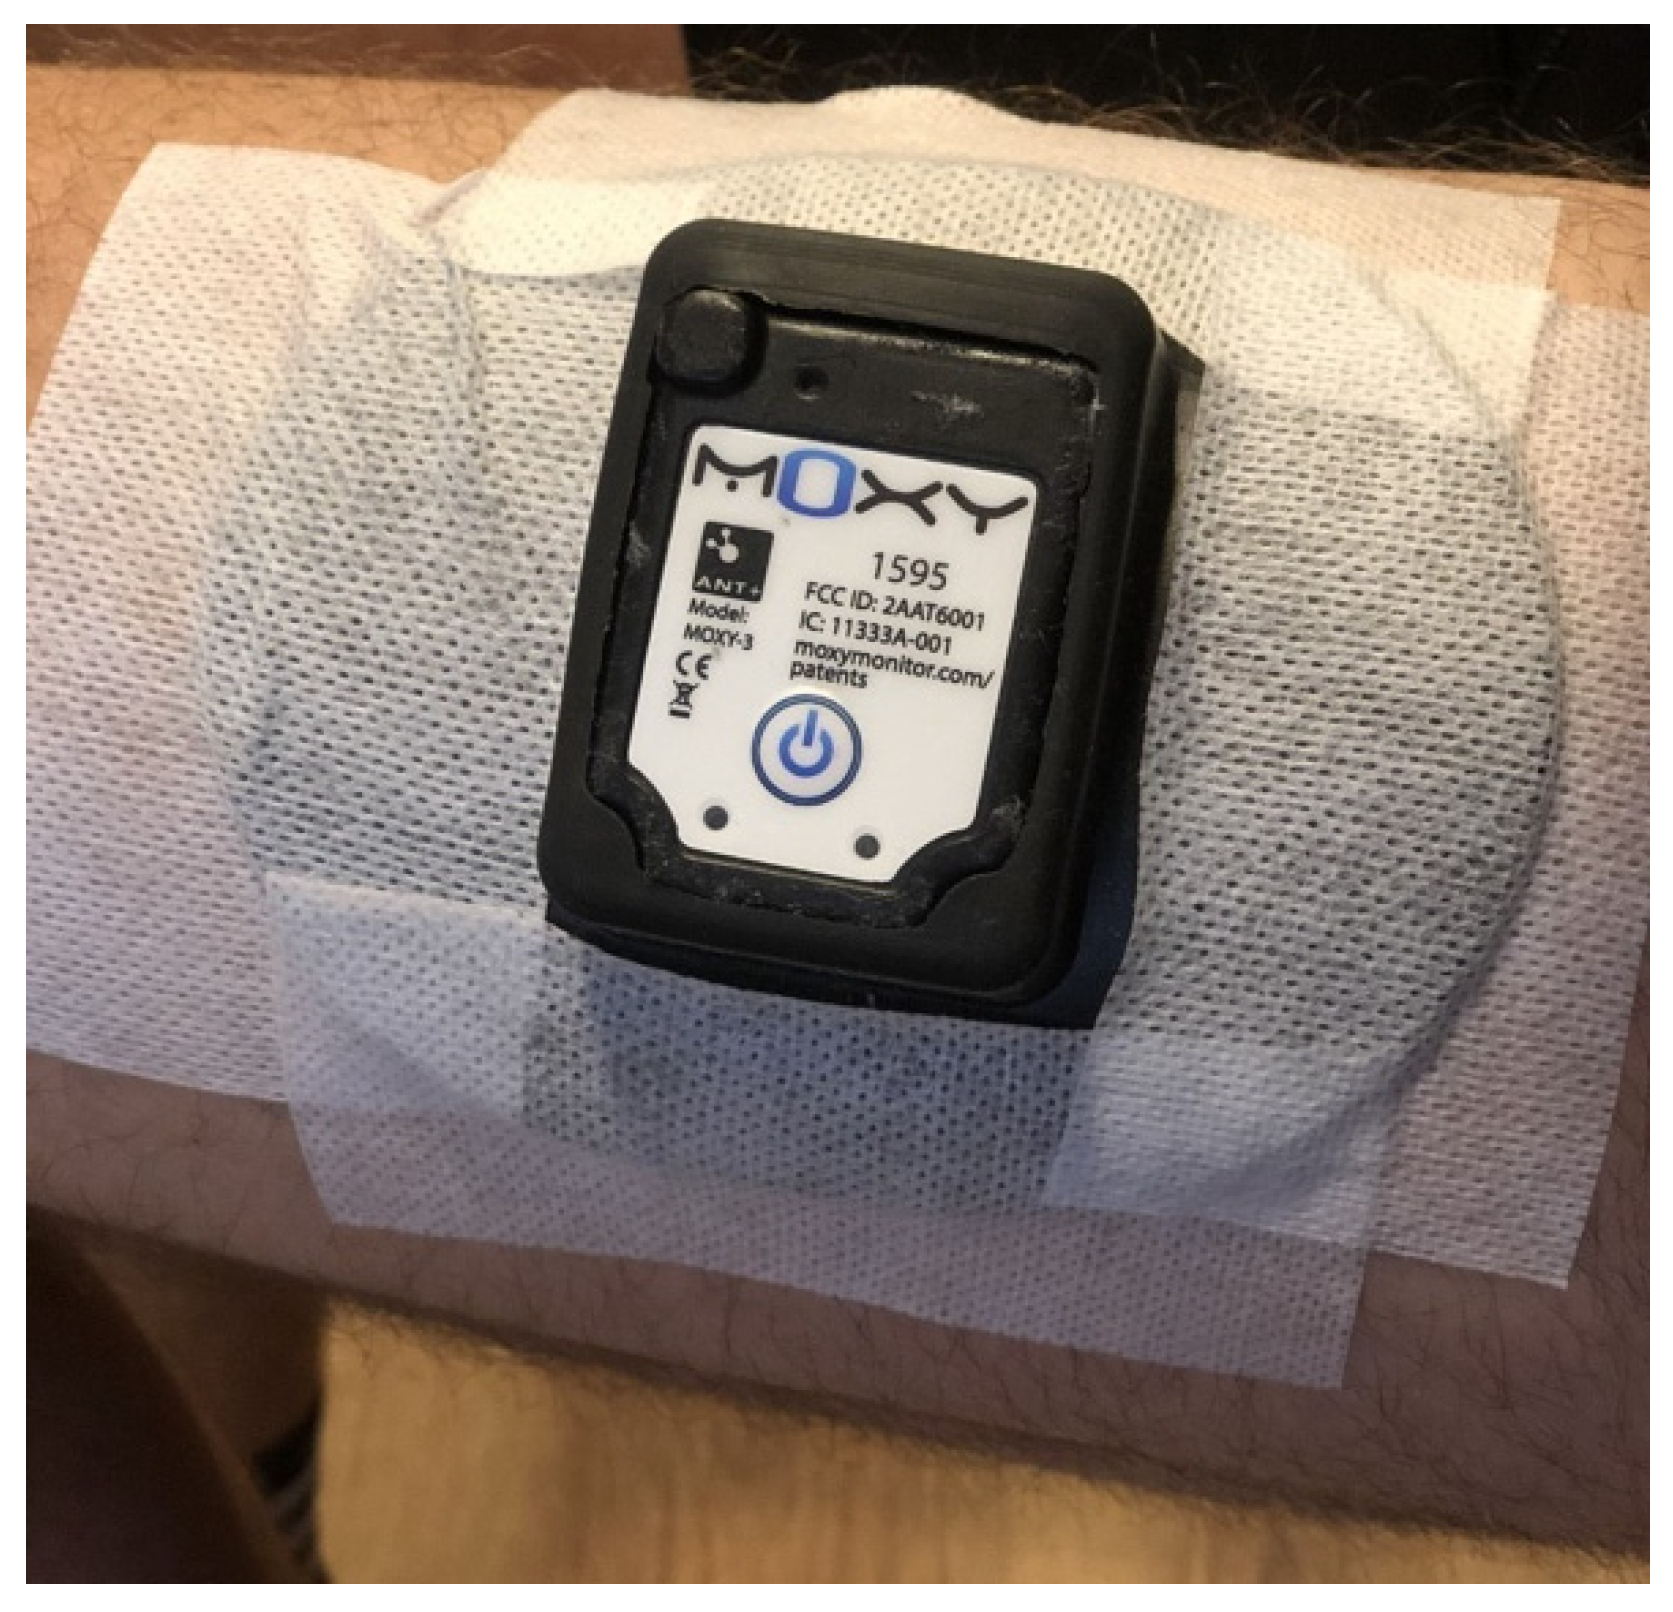
2.4.1. NIRS Values
2.4.2. Heart Rate Responses
2.4.3. Blood Lactate Concentration
2.5. Statistical Analysis
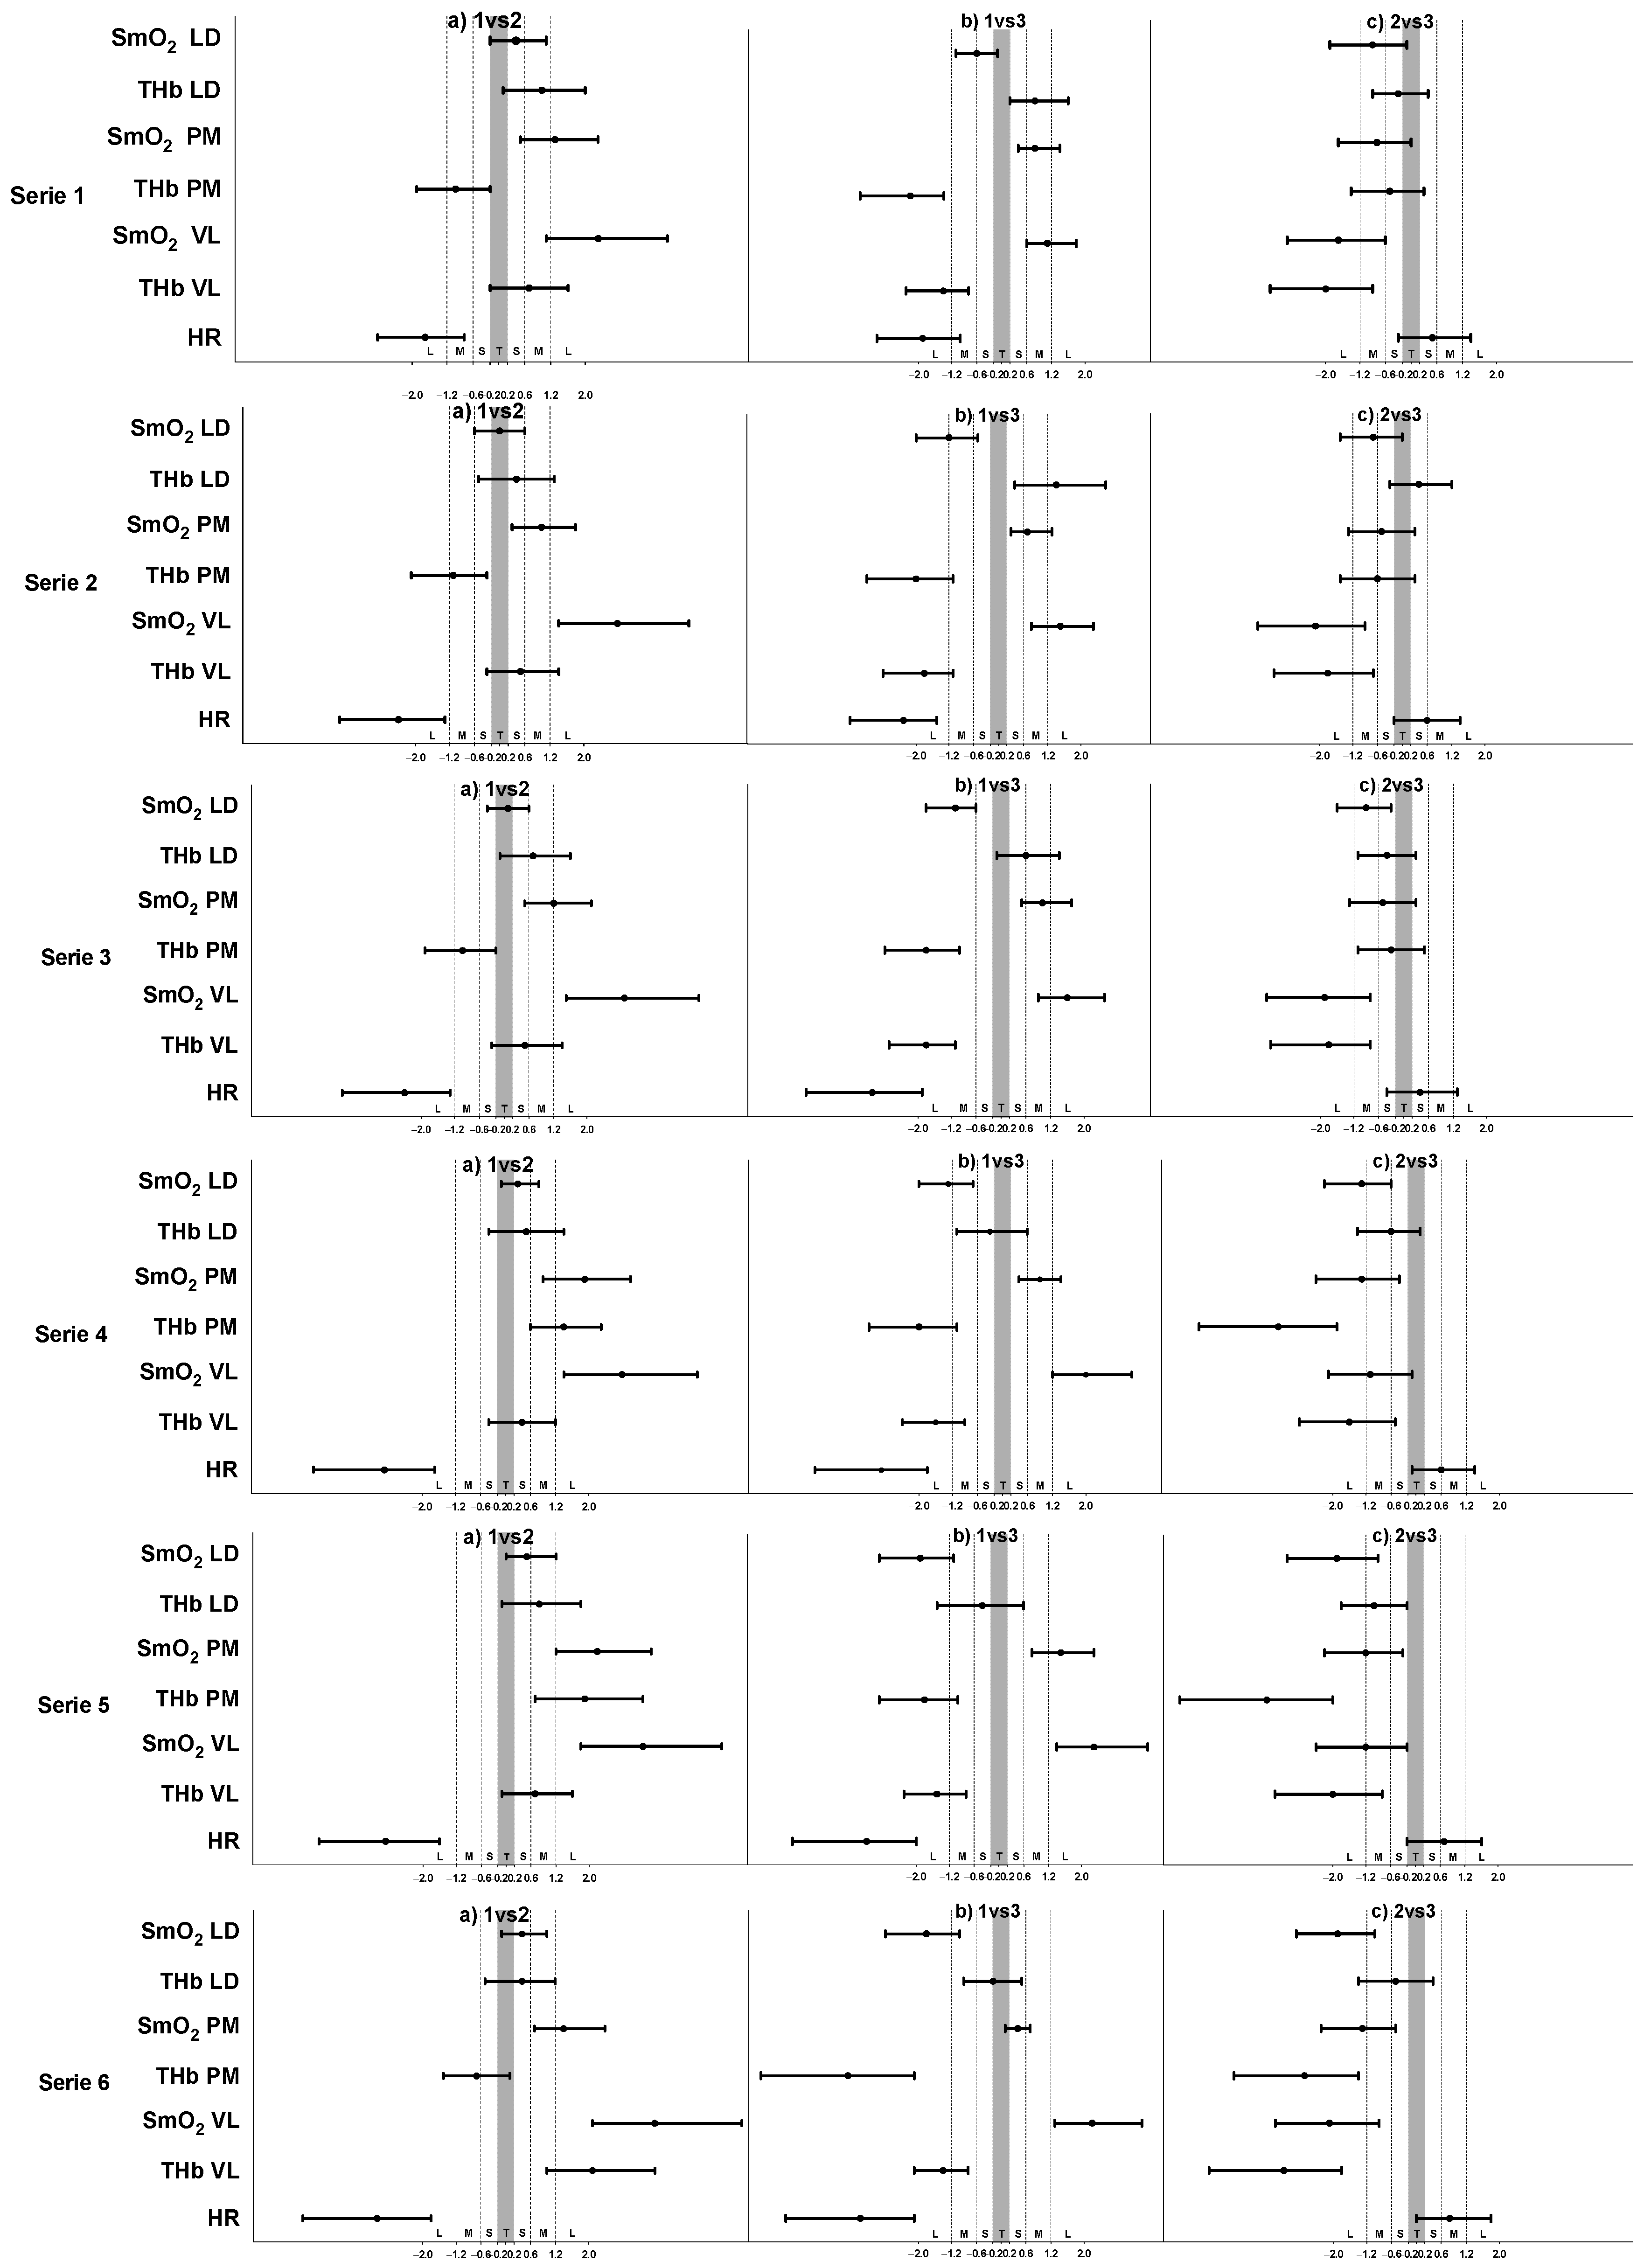
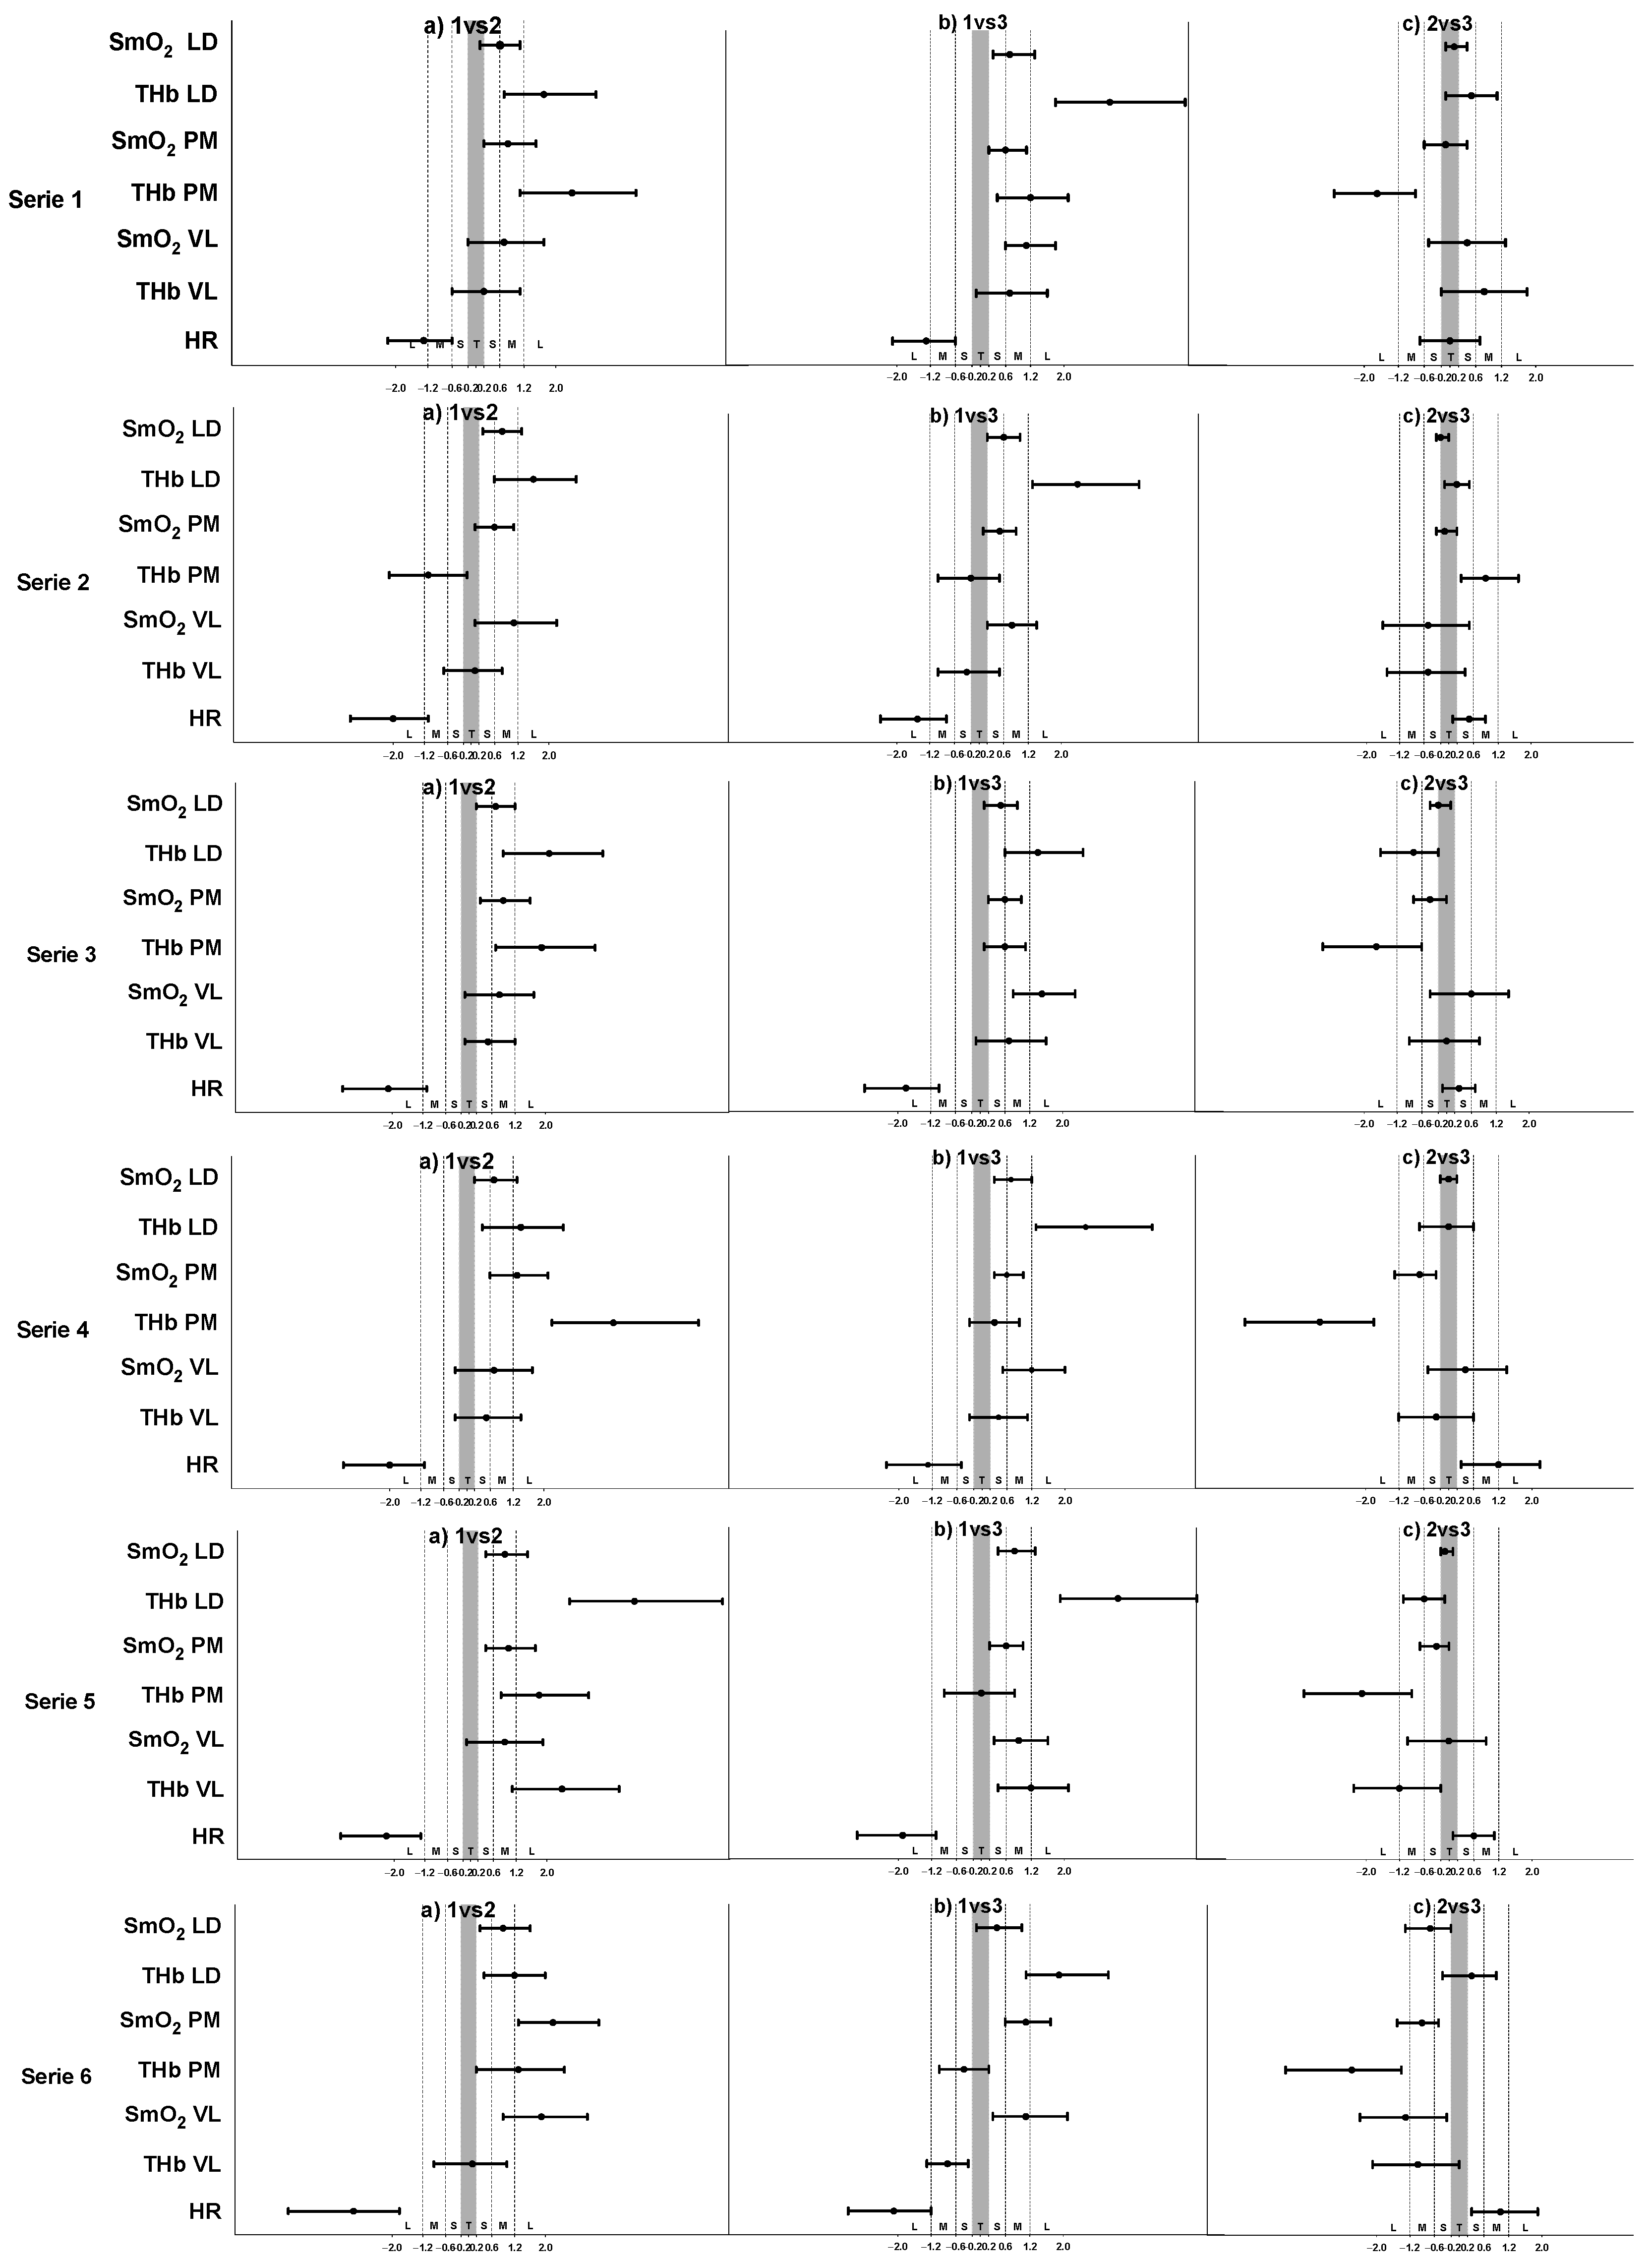
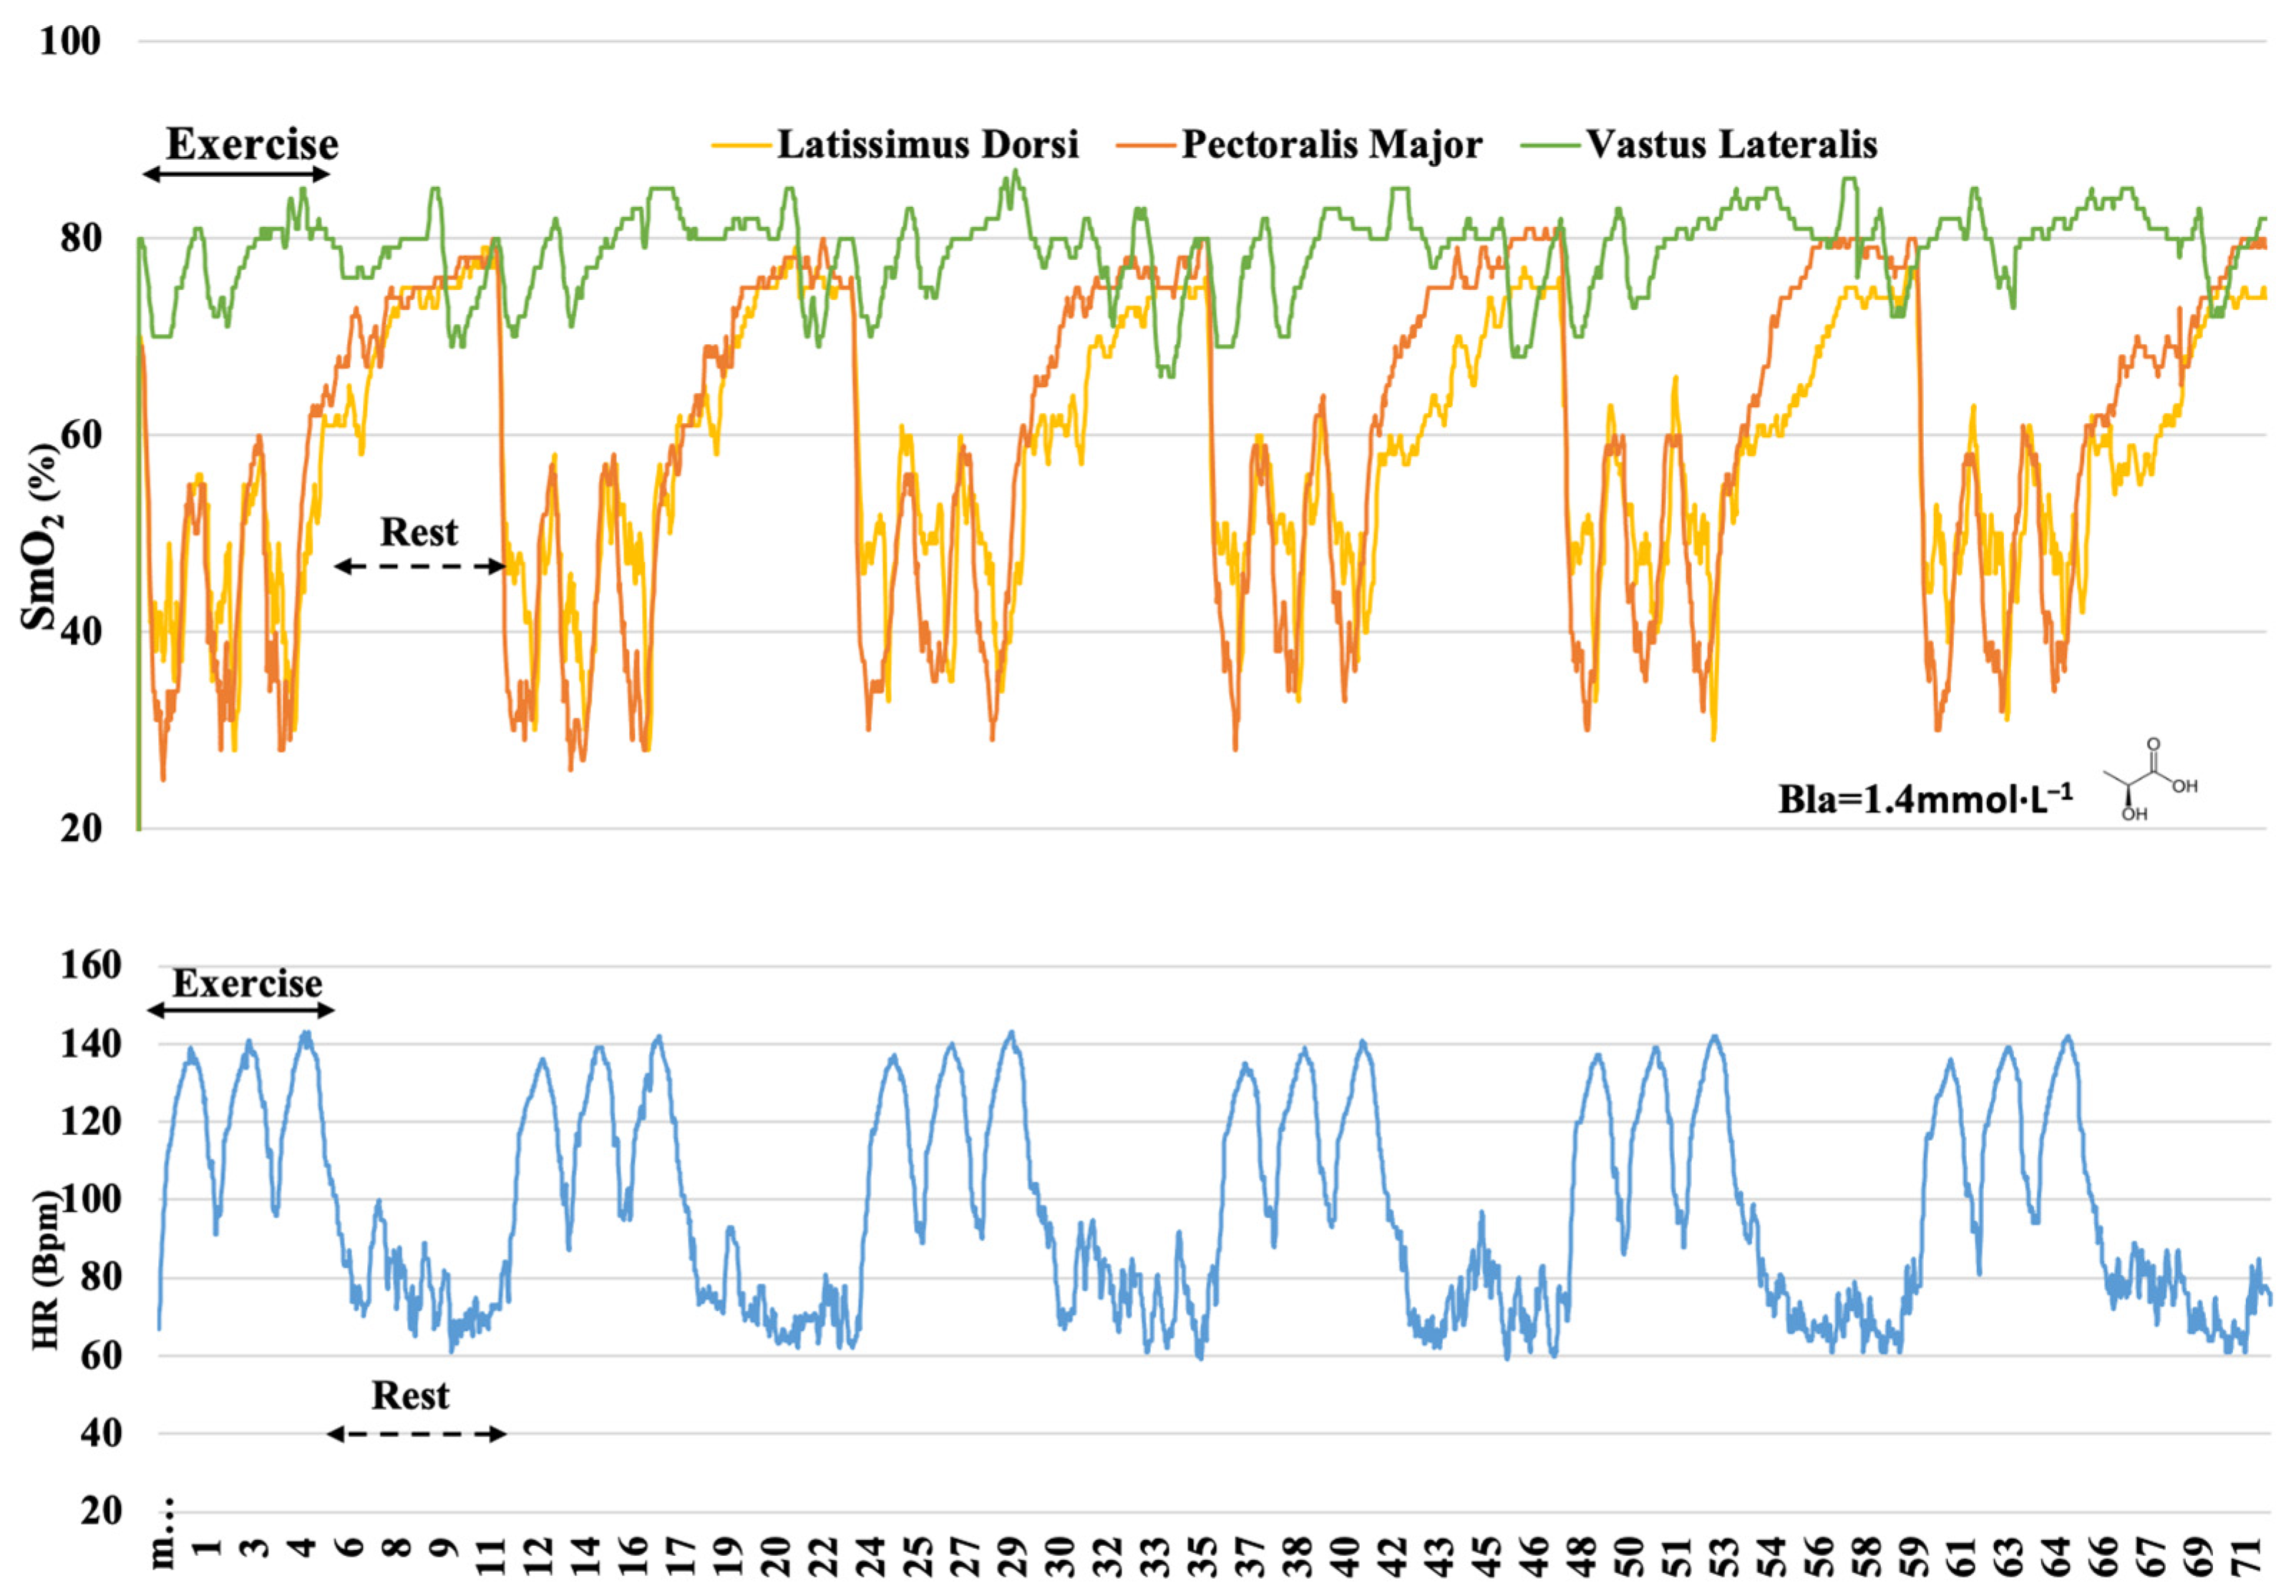
3. Results
4. Discussion
4.1. O2 Dynamics during Different Training
4.2. O2 Responses in Different Muscles
5. Conclusions
Author Contributions
Funding
Institutional Review Board Statement
Informed Consent Statement
Data Availability Statement
Conflicts of Interest
References
- Hamaoka, T. Muscle oxygenation monitoring using near-infrared spectroscopy. J. Phys. Fit. Sport 2013, 2, 203–207. [Google Scholar] [CrossRef] [Green Version]
- Perrey, S.; Ferrari, M. Muscle Oximetry in Sports Science: A Systematic Review. Sports Med. 2018, 48, 597–616. [Google Scholar] [CrossRef] [PubMed]
- Grassi, B.; Quaresima, V. Near-infrared spectroscopy and skeletal muscle oxidative function in vivo in health and disease: A review from an exercise physiology perspective. J. Biomed. Opt. 2016, 21, 091313. [Google Scholar] [CrossRef] [Green Version]
- Ferrari, M.; Muthalib, M.; Quaresima, V. The use of near-infrared spectroscopy in understanding skeletal muscle physiology: Recent developments. Philos. Trans. R. Soc. A 2011, 369, 4577–4590. [Google Scholar] [CrossRef] [PubMed]
- Hamaoka, T.; McCully, K.K.; Quaresima, V.; Yamamoto, K.; Chance, B. Near-infrared spectroscopy/imaging for monitoring muscle oxygenation and oxidative metabolism in healthy and diseased humans. J. Biomed. Opt. 2007, 12, 062105. [Google Scholar] [CrossRef]
- Poole, D.C.; Copp, S.W.; Ferguson, S.K.; Musch, T.I. Skeletal muscle capillary function: Contemporary observations and novel hypotheses. Exp. Physiol. 2013, 98, 1645–1658. [Google Scholar] [CrossRef] [Green Version]
- Mancini, D.M.; Bolinger, L.; Li, H.; Kendrick, K.; Chance, B.; Wilson, J.R. Validation of near-Infrared Spectroscopy in Humans. J. Appl. Physiol. 1994, 77, 2740–2747. [Google Scholar] [CrossRef]
- Austin, K.G.; Daigle, K.A.; Patterson, P.; Cowman, J.; Chelland, S.; Haymes, E.M. Reliability of near-infrared spectroscopy for determining muscle oxygen saturation during exercise. Res. Q. Exerc. Sport 2005, 76, 440–449. [Google Scholar] [CrossRef]
- Neary, J.P. Application of near infrared spectroscopy to exercise sports science. Can. J. Appl. Physiol. 2004, 29, 488–503. [Google Scholar] [CrossRef]
- Bhambhani, Y.N. Muscle oxygenation trends during dynamic exercise measured by near infrared spectroscopy. Can. J. Appl. Physiol. 2004, 29, 504–523. [Google Scholar] [CrossRef]
- Chance, B.; Dait, M.T.; Zhang, C.D.; Hamaoka, T.; Hagerman, F. Recovery from Exercise-Induced Desaturation in the Quadriceps Muscles of Elite Competitive Rowers. Am. J. Physiol. 1992, 262, C766–C775. [Google Scholar] [CrossRef] [PubMed]
- Borges, T.O.; Dascombe, B.; Bullock, N.; Coutts, A.J. Physiological Characteristics of Well-Trained Junior Sprint Kayak Athletes. Int. J. Sport Physiol. 2015, 10, 593–599. [Google Scholar] [CrossRef] [PubMed]
- Denis, R.; Bringard, A.; Perrey, S. Vastus lateralis oxygenation dynamics during maximal fatiguing concentric and eccentric isokinetic muscle actions. J. Electromyogr. Kinesiol. 2011, 21, 276–282. [Google Scholar] [CrossRef] [PubMed]
- Milanovic, Z.; Sporis, G.; Weston, M. Effectiveness of High-Intensity Interval Training (HIT) and Continuous Endurance Training for VO2max Improvements: A Systematic Review and Meta-Analysis of Controlled Trials. Sports Med. 2015, 45, 1469–1481. [Google Scholar] [CrossRef] [PubMed] [Green Version]
- Tonnessen, E.; Hisdal, J.; Ronnestad, B.R. Influence of Interval Training Frequency on Time-Trial Performance in Elite Endurance Athletes. Int. J. Environ. Res. Public Health 2020, 17, 3190. [Google Scholar] [CrossRef] [PubMed]
- Rozenek, R.; Funato, K.; Kubo, J.; Hoshikawa, M.; Matsuo, A. Physiological responses to interval training sessions at velocities associated with Vo(2)max. J. Strength Cond. Res. 2007, 21, 188–192. [Google Scholar]
- Coyle, E. Integration of the physiological factors determining endurance performance ability. Exerc. Sport Sci. Rev. 1995, 23, 25–63. [Google Scholar] [CrossRef]
- Hawley, J.A. Adaptations of skeletal muscle to prolonged, intense endurance training. Clin. Exp. Pharmacol. Physiol. 2002, 29, 218–222. [Google Scholar] [CrossRef] [Green Version]
- Reindell, H.; Roskman, H. Ein Beitrag zu den physiologischen Grundlagen des Intervalltrainings unter besonderer Berücksichtigung des Kreislaufes. Schweiz. Z. Sportmed. 1959, 7, 1–8. [Google Scholar]
- Seiler, S.; Tonessen, E. Intervals, thresholds and long slow distance: The role of intensity and duration in endurance training. Sport Sci. 2009, 13, 32–53. [Google Scholar]
- Daniels, J.; Scardina, N. Interval Training and Performance. Sports Med. 1984, 1, 327–334. [Google Scholar] [CrossRef] [PubMed]
- Gist, N.H.; Fedewa, M.V.; Dishman, R.K.; Cureton, K.J. Sprint Interval Training Effects on Aerobic Capacity: A Systematic Review and Meta-Analysis. Sports Med. 2014, 44, 269–279. [Google Scholar] [CrossRef]
- Burgomaster, K.A.; Hughes, S.C.; Heigenhauser, G.J.F.; Bradwell, S.N.; Gibala, M.J. Six sessions of sprint interval training increases muscle oxidative potential and cycle endurance capacity in humans. J. Appl. Physiol. 2005, 98, 1985–1990. [Google Scholar] [CrossRef] [PubMed]
- Clark, S.A.; Chen, Z.P.; Murphy, K.T.; Aughey, R.J.; McKenna, M.J.; Kemp, B.E.; Hawley, J.A. Intensified exercise training does not alter AMPK signaling in human skeletal muscle. Am. J. Physiol.-Endocrinol. Metab. 2004, 286, E737–E743. [Google Scholar] [CrossRef] [PubMed]
- Burgomaster, K.A.; Heigenhauser, G.J.F.; Gibala, M.J. Effect of short-term sprint interval training on human skeletal muscle carbohydrate metabolism during exercise and time-trial performance. J. Appl. Physiol. 2006, 100, 2041–2047. [Google Scholar] [CrossRef]
- Tesch, P.; Piehl, K.; Wilson, G.; Karlsson, J. Physiological Investigations of Swedish Elite Canoe Competitors. Med. Sci. Sports 1976, 8, 214–218. [Google Scholar] [CrossRef]
- Van Someren, K.A.; Phillips, G.R.W.; Palmer, G.S. Comparison of physiological responses to open water kayaking and kayak ergometry. Int. J. Sports Med. 2000, 21, 200–204. [Google Scholar] [CrossRef] [PubMed]
- Tesch, A. Physiological characteristics of elite kayak paddlers. Can. J. Appl. Sport Sci. 1983, 8, 87–91. [Google Scholar] [PubMed]
- Paquette, M.; Bieuzen, F.; Billaut, F. Muscle Oxygenation Rather Than VO2max as a Strong Predictor of Performance in Sprint Canoe-Kayak. Int. J. Sport Physiol. 2018, 13, 1299–1307. [Google Scholar] [CrossRef] [PubMed]
- Fleming, N.; Donne, B.; Fletcher, D.; Mahony, N. A biomechanical assessment of ergometer task specificity in elite flatwater kayakers. J. Sport Sci. Med. 2012, 11, 16–25. [Google Scholar]
- Esteve-Lanao, J.; San Juan, A.F.; Earnest, C.P.; Foster, C.; Lucia, A. How do endurance runners actually train? Relationship with competition performance. Med. Sci. Sport Exerc. 2005, 37, 496–504. [Google Scholar] [CrossRef] [PubMed] [Green Version]
- Hofmann, P.; Tschakert, G. Special Needs to Prescribe Exercise Intensity for Scientific Studies. Cardiol. Res. Pract. 2011, 2011, 209302. [Google Scholar] [CrossRef] [PubMed] [Green Version]
- Zapico, A.G.; Calderon, F.J.; Benito, P.J.; Gonzalez, C.B.; Parisi, A.; Pigozzi, F.; Di Salvo, V. Evolution of physiological and haematological parameters with training load in elite male road cyclists: A longitudinal study. J. Sport Med. Phys. Fit. 2007, 47, 191–196. [Google Scholar]
- Binder, R.K.; Wonisch, M.; Corra, U.; Cohen-Solal, A.; Vanhees, L.; Saner, H.; Schmid, J.P. Methodological approach to the first and second lactate threshold in incremental cardiopulmonary exercise testing. Eur. J. Prev. Cardiol. 2008, 15, 726–734. [Google Scholar] [CrossRef] [PubMed]
- Seiler, K.S.; Kjerland, G.O. Quantifying training intensity distribution in elite endurance athletes: Is there evidence for an “optimal” distribution? Scand. J. Med. Sci. Sports 2006, 16, 49–56. [Google Scholar] [CrossRef] [PubMed]
- Paquette, M.; Bieuzen, F.; Billaut, F. Sustained Muscle Deoxygenation vs. Sustained High VO2 During High-Intensity Interval Training in Sprint Canoe-Kayak. Front. Sports Act. Living 2019, 1, 6. [Google Scholar] [CrossRef] [Green Version]
- Tanner, R.; Gore, C. Physiological Tests for Elite Athletes, 2nd ed.; Human Kinetics: Champaign, IL, USA, 2012; p. 560. [Google Scholar]
- Billat, L.V. Interval training for performance: A scientific and empirical practice—Special recommendations for middle- and long-distance running, part I: Aerobic interval training. Sports Med. 2001, 31, 13–31. [Google Scholar] [CrossRef]
- Rodriguez, R.F.; Townsend, N.E.; Aughey, R.J.; Billaut, F. Influence of averaging method on muscle deoxygenation interpretation during repeated-sprint exercise. Scand. J. Med. Sci. Sports 2018, 28, 2263–2271. [Google Scholar] [CrossRef]
- Paquette, M.; Bieuzen, F.; Billaut, F. Effect of a 3-Weeks Training Camp on Muscle Oxygenation, VO2 and Performance in Elite Sprint Kayakers. Front. Sports Act. Living 2020, 2, 47. [Google Scholar] [CrossRef]
- Hopkins, W.G.; Marshall, S.W.; Batterham, A.M.; Hanin, J. Progressive Statistics for Studies in Sports Medicine and Exercise Science. Med. Sci. Sport Exerc. 2009, 41, 3–12. [Google Scholar] [CrossRef] [Green Version]
- Bassett, D.R.; Howley, E.T. Limiting factors for maximum oxygen uptake and determinants of endurance performance. Med. Sci. Sport Exerc. 2000, 32, 70–84. [Google Scholar] [CrossRef] [PubMed]
- Buchheit, M.; Laursen, P.B. High-Intensity Interval Training, Solutions to the Programming Puzzle Part I: Cardiopulmonary Emphasis. Sports Med. 2013, 43, 313–338. [Google Scholar] [CrossRef] [PubMed]
- Hesford, C.M.; Laing, S.; Cardinale, M.; Cooper, C.E. Effect of Race Distance on Muscle Oxygenation in Short-Track Speed Skating. Med. Sci. Sport Exerc. 2013, 45, 83–92. [Google Scholar] [CrossRef]
- Hargreaves, M.; Spriet, L.L. Skeletal muscle energy metabolism during exercise. Nat. Metab. 2020, 2, 990. [Google Scholar] [CrossRef]
- Astrand, I.; Astrand, P.O.; Christensen, E.H.; Hedman, R. Intermittent Muscular Work. Acta Physiol. Scand. 1960, 48, 448–453. [Google Scholar] [CrossRef]
- Dupont, G.; McCall, A.; Prieur, F.; Millet, G.P.; Berthoin, S. Faster oxygen uptake kinetics during recovery is related to better repeated sprinting ability. Eur. J. Appl. Physiol. 2010, 110, 627–634. [Google Scholar] [CrossRef]
- Kime, R.; Hamaoka, T.; Sako, T.; Murakami, M.; Homma, T.; Katsumura, T.; Chance, B. Delayed reoxygenation after maximal isometric handgrip exercise in high oxidative capacity muscle. Eur. J. Appl. Physiol. 2003, 89, 34–41. [Google Scholar] [CrossRef] [PubMed]
- Glaister, M. Multiple sprint work-Physiological responses, mechanisms of fatigue and the influence of aerobic fitness. Sports Med. 2005, 35, 757–777. [Google Scholar] [CrossRef]
- Ahmaidi, S.; Granier, P.; Taoutaou, Z.; Mercier, J.; Dubouchaud, H.; Prefaut, C. Effects of active recovery on plasma lactate and anaerobic power following repeated intensive exercise. Med. Sci. Sport Exerc. 1996, 28, 450–456. [Google Scholar] [CrossRef]
- Gorostiaga, E.M.; Asiain, X.; Izquierdo, M.; Postigo, A.; Aguado, R.; Alonso, J.M.; Ibanez, J. Vertical jump performance and blood ammonia and lactate levels during typical training sessions in elite 400-m runners. J. Strength Cond. Res. 2010, 24, 1138–1149. [Google Scholar] [CrossRef] [Green Version]
- Zoladz, J.A.; Gladden, L.B.; Hogan, M.C.; Nieckarz, Z.; Grassi, B. Progressive recruitment of muscle fibers is not necessary for the slow component of (V)over-dot(O2) kinetics. J. Appl. Physiol. 2008, 105, 575–580. [Google Scholar] [CrossRef] [PubMed] [Green Version]
- Secher, N.H.; Volianitis, S. Are the arms and legs in competition for cardiac output? Med. Sci. Sport Exerc. 2006, 38, 1797–1803. [Google Scholar] [CrossRef] [PubMed]
- Shiroishi, K.; Kime, R.; Osada, T.; Murase, N.; Shimomura, K.; Katsumura, T. Decreased Muscle Oxygenation and Increased Arterial Blood Flow in the Non-Exercising Limb During Leg Exercise. Adv. Exp. Med. Biol. 2010, 662, 379–384. [Google Scholar] [PubMed]
- Quaresima, V.; Lepanto, R.; Ferrari, M. The use of near infrared spectroscopy in sports medicine. J. Sport Med. Phys. Fit. 2003, 43, 1–13. [Google Scholar]
- Van Someren, K.A.; Oliver, J.E. The efficacy of ergometry determined heart rates for flatwater kayak training. Int. J. Sports Med. 2002, 23, 28–32. [Google Scholar] [CrossRef] [PubMed]

| VO2max (L·min−1) | 5.1 |
| VO2max (mL·kg−1·min−1) | 57.5 |
| HR (beat·min−1) at CIL | 180.0 |
| Power (W) at CIL | 300.0 |
| VO2 (L·min−1) at VT2 | 3.8 |
| VO2 (mL·kg−1·min−1) at VT2 | 43.0 |
| HR (beat·min−1) at VT2 | 165.0 |
| Power (W) at VT2 | 200.0 |
| Duration | 15′ | 6 Bouts | |
|---|---|---|---|
| RT | Warm-Up | S-6′ | 6′ |
 |  | PR | |
| 5′-160 W + 1,30′PR + 3,30′-3X(10″300 W + 1′PR) + 5′PR | I-200 W | ||
| IT | Warm-Up | S-60″ + 60″ | 6′ |
 |  | PR | |
| 5′-160 W + 1,30′PR + 3,30′-3X(10″300 W + 1′PR) + 5′PR | I-200 W + 40 W | ||
| Warm-Up | S-10″ + 30″ | 6′ | |
| SIT |  |  | PR |
| 5′-160 W + 1,30′PR + 3,30′-3X(10″300 W + 1′PR) + 5′PR | I-300 W + 40 W | ||
| Bouts | Variables | Intermittent Training Protocol | Difference in Means (Row; ±95% CL) | |||||
|---|---|---|---|---|---|---|---|---|
| RT | IT | SIT | (a) | (b) | (c) | p | ||
| Mean ± SD | Mean ± SD | Mean ± SD | ||||||
| SmO2 (%) LD | 43.4 ± 4.8 | 46.1 ± 6.8 | 40.5 ± 4.1 | 2.7 [−1.1, 6.6] | −2.9 [−5, −0.8] | −5.6 [−10.4, −0.9] | <0.05 | |
| tHb (AU) LD | 13.2 ± 0 | 13.3 ± 0.1 | 13.2 ± 0.1 | 0.1 [0, 0.2] | 0.1 [0, 0.1] | 0 [−0.1, 0] | <0.05 | |
| SmO2 (%) PM | 30.7 ± 8.9 | 44.2 ± 10.0 | 37.0 ± 5.0 | 13.5 [6.2, 20.9] | 6.3 [3.4, 9.2] | −7.2 [−14.1, −0.3] | <0.01 | |
| 1 | tHb (AU) PM | 13.2 ± 0 | 13.2 ± 0.1 | 13.1 ± 0 | 0 [−0.1, 0] | −0.1 [−0.1, −0.1] | 0 [−0.1, 0] | <0.01 |
| SmO2 (%) VL | 64.8 ± 5.7 | 77.3 ± 4.0 | 70.4 ± 3.6 | 12.4 [7.3, 17.6] | 5.6 [3.8, 7.4] | −6.8 [−10.5, −3.1] | <0.001 | |
| tHb (AU) VL | 12.4 ± 0.1 | 12.4 ± 0.1 | 12.3 ± 0 | 0.1 [0, 0.1] | −0.1 [−0.1, −0.1] | −0.1 [−0.2, −0.1] | <0.01 | |
| HR (Bpm) | 144.7 ± 11.4 | 122.2 ± 13.3 | 127.7 ± 3.9 | −22.5 [−31.5, −13.5] | −17.0 [−22.8, −11.2] | 5.5 [−3, 13.9] | <0.001 | |
| SmO2 (%) LD | 47.3 ± 3.8 | 47.2 ± 7.9 | 42.5 ± 3.8 | −0.1 [−4.4, 4.3] | −4.8 [−6.8, −2.7] | −4.7 [−9.4, 0] | <0.05 | |
| tHb (AU) LD | 13.2 ± 0.1 | 13.3 ± 0.2 | 13.3 ± 0.1 | 0.1 [−0.1, 0.2] | 0.1 [0, 0.2] | 0.1 [0, 0.2] | >0.05 | |
| SmO2 (%) PM | 32.5 ± 8.6 | 42.6 ± 10.6 | 38.2 ± 5.3 | 10.1 [3.3, 16.9] | 5.7 [2.4, 8.9] | −4.4 [−11.5, 2.7] | <0.05 | |
| 2 | tHb (AU) PM | 13.2 ± 0 | 13.2 ± 0 | 13.1 ± 0 | −0.1 [−0.1, 0] | −0.1 [−0.1, −0.1] | 0 [−0.1, 0] | <0.001 |
| SmO2 (%) VL | 63.6 ± 5.7 | 78.4 ± 4.1 | 70.6 ± 2.8 | 14.8 [9.5, 20.1] | 7 [4.7, 9.2] | −7.8 [−11.3, −4.4] | <0.001 | |
| tHb (AU) VL | 12.4 ± 0.1 | 12.4 ± 0.1 | 12.3 ± 0 | 0 [0, 0.1] | −0.1 [−0.1, −0.1] | −0.1 [−0.2, −0.1] | <0.01 | |
| HR (Bpm) | 151.3 ± 11.4 | 120.4 ± 12.8 | 127.0 ± 7.4 | −30.9 [−40.8, −21.0] | −24.3 [−27.1, −21.5] | 6.6 [−2.5, 15.8] | <0.001 | |
| SmO2 (%) LD | 48.8 ± 3.3 | 49.4 ± 6.9 | 43.9 ± 47 | 0.7 [−2.3, 3.7] | −4.8 [−6.3, −3.3] | −5.5 [−8.8, −2.2] | <0.001 | |
| tHb (AU) LD | 13.3 ± 0.1 | 13.4 ± 0.2 | 13.4 ± 0.1 | 0.1 [0, 0.3] | 0.1 [0, 0.1] | −0.1 [−0.2, 0.1] | >0,.05 | |
| SmO2 (%) PM | 34.0 ± 8.3 | 45.2 ± 9.1 | 41.5 ± 4.5 | 11.2 [5.2, 17.2] | 7.5 [4.4, 10.5] | −3.7 [−10.0, 2.5] | <0.01 | |
| 3 | tHb (AU) PM | 13.2 ± 0 | 13.2 ± 0 | 13.2 ± 0 | 0 [−0.1, 0] | −0.1 [−0.1, 0] | 0 [0, 0] | <0.01 |
| SmO2 (%) VL | 62.4 ± 6.3 | 78.9 ± 4.0 | 71.2 ± 3.5 | 16.6 [10.8, 22.3] | 8.8 [6.7, 11.0] | −7.7 [−11.7, −3.8] | <0.001 | |
| tHb (AU) VL | 12.4 ± 0.1 | 12.4 ± 0.1 | 12.3 ± 0 | 0 [0, 0.1] | −0.1 [−0.1, −0.1] | −0.1 [−0.2, −0.1] | <0.01 | |
| HR (Bpm) | 154.6 ± 11.3 | 120.9 ± 14.2 | 125.8 ± 5.0 | −33.7 [−44.2, −23.2] | −28.8 [−33.4, −24.3] | 4.9 [−5.1, 14.9] | <0.001 | |
| SmO2 (%) LD | 49.1 ± 4.1 | 50.8 ± 5.7 | 43.8 ± 3.8 | 1.7 [−0.8, 4.2] | −5.3 [−7.1, −3.5] | −7.0 [−9.9, −4.1] | <0.001 | |
| tHb (AU) LD | 13.4 ± 0.1 | 13.5 ± 0.2 | 13.3 ± 0.1 | 0.1 [−0.1, 0.2] | 0 [−0.1, 0.1] | −0.1 [−0.2, 0] | >0.05 | |
| SmO2 (%) PM | 29.6 ± 9.4 | 48.6 ± 9.7 | 36.9 ± 6.2 | 19.0 [12.2, 25.7] | 7.3 [4.2, 10.4] | −11.7 [−18.6, −4.7] | <0.001 | |
| 4 | tHb (AU) PM | 13.2 ± 0 | 13.3 ± 0 | 13.1 ± 0 | 0.1 [0, 0.1] | −0.1 [−0.1, 0] | −0,.1 [−0.1, −0.1] | <0.001 |
| SmO2 (%) VL | 61.0 ± 6.2 | 77.4 ± 4.5 | 72.5 ± 4.1 | 16.4 [10.7, 22.0] | 11.5 [9.7, 13.3] | −4.9 [−9.3, −0.5] | <0.001 | |
| tHb (AU) VL | 12.4 ± 0 | 12.4 ± 0.1 | 12.3 ± 0.1 | 0 [0, 0.1] | −0.1 [−0.1, −0.1] | −0.1 [−0.2, 0] | <0.01 | |
| HR (Bpm) | 158.0 ± 10.9 | 118.8 ± 14.0 | 126.2 ± 9.3 | −39.2 [−48.7, −29.7] | −31.7 [−34.5, −28.9] | 7.5 [−1.8, 16.7] | <0.001 | |
| SmO2 (%) LD | 48.0 ± 3.4 | 50.9 ± 6.1 | 39.9 ± 4.6 | 2.9 [−0.2, 5.9] | −8.2 [−10.1, −6.2] | −11.0 [−15.1, −7.0] | <0.001 | |
| tHb (AU) LD | 13.3 ± 0.1 | 13.5 ± 0.2 | 13.3 ± 0.1 | 0.1 [0, 0.3] | 0 [−0.1, 0] | −0.2 [−0.3, 0] | <0.05 | |
| SmO2 (%) PM | 26.3 ± 8.1 | 47.6 ± 9.6 | 37.6 ± 6.1 | 21.3 [15.5, 27.1] | 11.2 [8.5, 13.9] | −10.1 [−17.2, −2.9] | <0.001 | |
| 5 | tHb (AU) PM | 13.2 ± 0 | 13.2 ± 0 | 13.1 ± 0 | 0.1 [0, 0.1] | −0.1 [−0.1, 0] | −0.1 [−0.1, −0.1] | <0.001 |
| SmO2 (%) VL | 60.4 ± 6.3 | 78.4 ± 3.7 | 73.3 ± 3.9 | 18.0 [12.6, 23.4] | 13.0 [11.1, 14.8] | −5.0 [−9.2, −0.9] | <0.001 | |
| tHb (AU) VL | 12.4 ± 0 | 12.4 ± 0.1 | 12.3 ± 0.1 | 0 [0, 0.1] | −0.1 [−0.1, −0.1] | −0.1 [−0.2, −0.1] | <0.001 | |
| HR (Bpm) | 159.8 ± 11.2 | 119.5 ± 14.7 | 127.9 ± 6.3 | −40.3 [−50.8, −29.7] | −31.9 [−35.6, −28.1] | 8.4 [−2.1, 19.0] | <0.001 | |
| SmO2 (%) LD | 47.9 ± 3.6 | 50.0 ± 5.3 | 40.9 ± 3.8 | 2.2 [−0.4, 4.7] | −7.0 [−8.6, −5.4] | −9.2 [−11.7, −6.6] | <0.001 | |
| tHb (AU) LD | 13.3 ± 0.1 | 13.3 ± 0.2 | 13.3 ± 0.1 | 0.1 [−0.1, 0.2] | 0 [−0.1, 0] | −0.1 [−0.2, 0.1] | >0.05 | |
| SmO2 (%) PM | 33.2 ± 8.0 | 46.9 ± 9.6 | 36.1 ± 5.6 | 13.7 [8.0, 19.4] | 2.9 [0.6, 5.1] | −10.8 [−17.1, −4.6] | <0.001 | |
| 6 | tHb (AU) PM | 13.2 ± 0 | 13.2 ± 0 | 13.1 ± 0 | 0 [−0.1, 0] | −0.1 [−0.1, −0.1] | −0.1 [−0.1, −0.1] | <0.001 |
| SmO2 (%) VL | 61.2 ± 6.6 | 80.4 ± 2.3 | 73.6 ± 3.7 | 19.2 [14.4, 24.1] | 12.5 [10.3, 14.7] | −6.8 [−9.7, −3.8] | <0.001 | |
| tHb (AU) VL | 12.4 ± 0.1 | 12.5 ± 0.1 | 12.3 ± 0.1 | 0.1 [0.1, 0.2] | −0.1 [−0.1, −0.1] | −0.2 [−0.3, −0.2] | <0.001 | |
| HR (Bpm) | 161.8 ± 10.7 | 119.4 ± 14.4 | 129.4 ± 6.3 | −42.4 [−52.5, −32.3] | −32.4 [−36.0, −28.8] | 10.0 [−0.1, 20.0] | <0.001 | |
| Bouts | Variables | Intermittent Training Protocol | Difference in Means (Row; ±95% CL) | |||||
|---|---|---|---|---|---|---|---|---|
| RT | IT | SIT | (a) | (b) | (c) | p | ||
| Mean ± SD | Mean ± SD | Mean ± SD | ||||||
| SmO2 (%) LD | 65.7 ± 7.4 | 70.2 ± 6.9 | 71.2 ± 6.7 | 4.5 [1.0, 8.0] | 5.5 [2.5, 8.5] | 1.0 [−0.7, 2.7] | <0.01 | |
| tHb (AU) LD | 13.1 ± 0 | 13.2 ± 0.1 | 13.2 ± 0 | 0.1 [0, 0.1] | 0.1 [0.1, 0.2] | 0 [0, 0.1] | <0.001 | |
| SmO2 (%) PM | 64.7 ± 12.1 | 72.7 ± 4.7 | 72.0 ± 9.7 | 8.0 [2.7, 13.3] | 7.4 [2.6, 12.1] | −0.7 [−4.6, 3.3] | <0.01 | |
| 1 | tHb (AU) PM | 13.0 ± 0 | 13.1 ± 0 | 13.0 ± 0 | 0.1 [0.1, 0.2] | 0.1 [0, 0.1] | −0.1 [−0.1, 0] | <0.001 |
| SmO2 (%) VL | 74.9 ± 3.4 | 77.4 ± 3.5 | 78.6 ± 2.8 | 2.6 [−1.0, 6.1] | 3.8 [2.5, 5.1] | 1.2 [−2.0, 4.4] | <0.05 | |
| tHb (AU) VL | 12.4 ± 0.1 | 12.4 ± 0 | 12.4 ± 0 | 0 [0, 0.1] | 0.1 [0, 0.1] | 0 [0, 0.1] | >0.05 | |
| HR (Bpm) | 95.6 ± 16.7 | 77.7 ± 7.4 | 77.6 ± 8.4 | −17.9 [−25.8, −10.0] | −18.0 [−25.7, −10.4] | −0.2 [−6.5, 6.1] | <0.001 | |
| SmO2 (%) LD | 64.5 ± 7.0 | 70.3 ± 6.8 | 69.0 ± 7.8 | 5.8 [3.0, 8.6] | 4.6 [2.0, 7.2] | −1.2 [−2.6, 0.2] | <0.001 | |
| tHb (AU) LD | 13.1 ± 0 | 13.2 ± 0.1 | 13.2 ± 0.1 | 0.1 [0.1, 0.2] | 0.1 [0.1, 0.2] | 0 [0, 0] | <0.001 | |
| SmO2 (%) PM | 65.9 ± 11.5 | 72.0 ± 6.5 | 71.4 ± 9.2 | 6.1 [1.5, 10.6] | 5.5 [2.0, 9.0] | −0.6 [−2.7, 1.6] | <0.01 | |
| 2 | tHb (AU) PM | 13.1 ± 0 | 13.0 ± 0 | 13.1 ± 0 | 0 [−0.1, 0] | 0 [0, 0] | 0 [0, 0.1] | <0.05 |
| SmO2 (%) VL | 74.8 ± 4.3 | 79.5 ± 3.6 | 77.8 ± 2.6 | 4.7 [0.7, 8.7] | 3.0 [1.0, 5.0] | −1.7 [−5.2, 1.7] | <0.05 | |
| tHb (AU) VL | 12.4 ± 0.1 | 12.4 ± 0.1 | 12.4 ± 0 | 0 [−0.1, 0.1] | 0 [−0.1, 0] | 0 [−0.1, 0] | >0.05 | |
| HR (Bpm) | 101.6 ± 18.1 | 73.1 ± 6.2 | 77.5 ± 10.8 | −28.5 [−37.0, −20.0] | −24.1 [−30.3, −17.9] | 4.4 [0.6, 8.1] | <0.001 | |
| SmO2 (%) LD | 63.6 ± 7.0 | 68.4 ± 6.3 | 67.3 ± 7.3 | 4.8 [1.6, 8.0] | 3.7 [1.1, 6.3] | −1.1 [−2.8, 0.5] | <0.01 | |
| tHb (AU) LD | 13.1 ± 0.1 | 13.3 ± 0.1 | 13.2 ± 0 | 0.1 [0.1, 0.2] | 0.1 [0, 0.1] | 0 [−0.1, 0] | <0.001 | |
| SmO2 (%) PM | 64.7 ± 11.7 | 73.5 ± 4.6 | 70.8 ± 8.1 | 8.8 [4.0, 13.7] | 6.1 [2.0, 10.1] | −2.8 [−5.3, −0.2] | <0.001 | |
| 3 | tHb (AU) PM | 13.0 ± 0.1 | 13.1 ± 0.1 | 13.1 ± 0 | 0.1 [0, 0.2] | 0 [0, 0] | −0.1 [−0.1, 0] | <0.01 |
| SmO2 (%) VL | 73.4 ± 4.4 | 77.0 ± 4.3 | 79.0 ± 2.4 | 3.5 [−0.6, 7.6] | 5.6 [4.1, 7.1] | 2.1 [−1.5, 5.6] | <0.05 | |
| tHb (AU) VL | 12.4 ± 0 | 12.4 ± 0.1 | 12.4 ± 0 | 0 [0, 0.1] | 0 [0, 0.1] | 0 [−0.1, 0.1] | >0.05 | |
| HR (Bpm) | 107.1 ± 17.4 | 77.2 ± 7.8 | 79,9 ± 10.7 | −29.9 [−38.9, −20.9] | −27.2 [−34.7, −19.7] | 2.7 [−1.5, 6.9] | <0001 | |
| SmO2 (%) LD | 62.5 ± 6.3 | 67.5 ± 6.9 | 67.4 ± 7.0 | 4.9 [1.8, 8.0] | 4.8 [2.5, 7.2] | −0.1 [−1.6, 1.4] | <0.001 | |
| tHb (AU) LD | 13.1 ± 0.1 | 13.2 ± 0.1 | 13.2 ± 0 | 0.1 [0, 0.2] | 0.1 [0.1, 0.2] | 0 [−0.1, 0] | <0.001 | |
| SmO2 (%) PM | 62.5 ± 12.1 | 75.3 ± 4.9 | 69.4 ± 9.7 | 12.8 [7.8, 17.8] | 6.8 [3.6, 10.0] | −6.0 [−9.2, −2.7] | <0.001 | |
| 4 | tHb (AU) PM | 13.0 ± 0.1 | 13.2 ± 0 | 13.0 ± 0 | 0.2 [0.1, 0.2] | 0 [0, 0] | −0.2 [−0.2, −0.2] | <0.001 |
| SmO2 (%) VL | 74.9 ± 5.2 | 78.5 ± 4.4 | 80.0 ± 2.0 | 3.5 [−1.5, 8.5] | 5.1 [2.9, 7.3] | 1.5 [−2.0, 5.0] | <0.05 | |
| tHb (AU) VL | 12.4 ± 0 | 12.4 ± 0.1 | 12.4 ± 0 | 0 [0, 0.1] | 0 [0, 0] | 0 [−0.1, 0] | >0.05 | |
| HR (Bpm) | 104.4 ± 18.6 | 74.0 ± 7.5 | 84.1 ± 8.3 | −30.4 [−39.8, −21.1] | −20.3 [−30.6, −10.0] | 10.1 [3.4, 16.9] | <0.001 | |
| SmO2 (%) LD | 60.5 ± 8.2 | 68.0 ± 6.7 | 67.3 ± 8.1 | 7.4 [4.3, 10.5] | 6.8 [4.2, 9.3] | −0.7 [−1.9, 0.6] | <0.001 | |
| tHb (AU) LD | 13.1 ± 0 | 13.2 ± 0 | 13.2 ± 0 | 0.2 [0.1, 0.2] | 0.1 [0.1, 0.2] | 0 [0, 0] | <0.001 | |
| SmO2 (%) PM | 63.5 ± 13.4 | 74.7 ± 6.5 | 71.4 ± 10.6 | 11.2 [6.2, 16.2] | 7.9 [4.0, 11.8] | −3.3 [−6.2, −0.4] | <0.001 | |
| 5 | tHb (AU) PM | 13.1 ± 0 | 13.1 ± 0 | 13.1 ± 0 | 0.1 [0, 0.1] | 0 [0, 0] | −0.1 [−0.1, 0] | <0.001 |
| SmO2 (%) VL | 76.5 ± 5.9 | 81.0 ± 3.6 | 80.8 ± 2.3 | 4.5 [−0.7, 9.6] | 4.4 [1.8, 6.9] | −0.1 [−3.3, 3.0] | >0.05 | |
| tHb (AU) VL | 12.4 ± 0 | 12.5 ± 0.1 | 12.4 ± 0 | 0.1 [0.1, 0.2] | 0 [0, 0.1] | −0.1 [−0.1, 0] | <0.001 | |
| HR (Bpm) | 107.7 ± 19.4 | 72.5 ± 8.3 | 77.3 ± 7.7 | −35.2 [−43.2, −27.1] | −30.4 [−38.8, −22.0] | 4.8 [1.1, 8.4] | <0.001 | |
| SmO2 (%) LD | 58.3 ± 7.2 | 65.4 ± 7.6 | 61.0 ± 4.0 | 7.2 [2.5, 11.9] | 2.7 [−0.5, 5.9] | −4.5 [−7.7, −1.2] | <0.01 | |
| tHb (AU) LD | 13.1 ± 0.1 | 13.2 ± 0.1 | 13.2 ± 0 | 0.1 [0, 0.1] | 0.1 [0.1, 0.1] | 0 [0, 0.1] | <0.001 | |
| SmO2 (%) PM | 54.3 ± 7.9 | 70.8 ± 6.1 | 63.5 ± 8.2 | 16.5 [13.4, 19.7] | 9.2 [6.2, 12.3] | −7.3 [−9.7, −4.9] | <0.001 | |
| 6 | tHb (AU) PM | 13.0 ± 0.1 | 13.1 ± 0 | 13.0 ± 0 | 0.1 [0, 0.2] | 0 [−0.1, 0] | −0.1 [−0.1, −0.1] | <0.01 |
| SmO2 (%) VL | 71.1 ± 5.5 | 80.4 ± 3.5 | 76.3 ± 2.4 | 9.3 [5.7, 13.0] | 5.2 [1.4, 8.9] | −4.2 [−7.2, −1.2] | <0.01 | |
| tHb (AU) VL | 12.5 ± 0.1 | 12.5 ± 0 | 12.4 ± 0.1 | 0 [−0.1, 0.1] | −0.1 [−0.1, 0] | −0.1 [−0.1, 0] | >0.05 | |
| HR (Bpm) | 116.4 ± 16.6 | 75.4 ± 6.7 | 85.3 ± 10.7 | −41.1 [−49.0, −33.2] | −31.2 [−38.5, −23.8] | 9.9 [3.5, 16.3] | <0.001 | |
| Bouts | Variables | Intermittent Training Protocol | ||
|---|---|---|---|---|
| RT | IT | SIT | ||
| 1 | Δ SmO2 (%) LD | −44.36 | −38.48 | −49.53 |
| Δ tHb (AU) LD | 0.18 | 0.46 | 0.56 | |
| Δ SmO2 (%) PM | −58.74 | −36.71 | −45.25 | |
| Δ tHb (AU) PM | 0.27 | 0.37 | 0.23 | |
| Δ SmO2 (%) VL | −13.30 | −2.24 | −4.13 | |
| Δ tHb (AU) VL | 0.21 | 0.29 | 0.01 | |
| 2 | Δ SmO2 (%) LD | −47.65 | −38.48 | −50.80 |
| Δ tHb (AU) LD | 0.46 | 0.60 | 1.10 | |
| Δ SmO2 (%) PM | −54.04 | −35.46 | −42.93 | |
| Δ tHb (AU) PM | 0.29 | 0.31 | 0.25 | |
| Δ SmO2 (%) VL | −15.96 | −2.24 | −6.51 | |
| Δ tHb (AU) VL | 0.21 | 0.33 | 0.06 | |
| 3 | Δ SmO2 (%) LD | −48.38 | −33.87 | −50.17 |
| Δ tHb (AU) LD | 0.77 | 0.85 | 0.76 | |
| Δ SmO2 (%) PM | −48.39 | −31.71 | −40.25 | |
| Δ tHb (AU) PM | 0.32 | 0.28 | 0.26 | |
| Δ SmO2 (%) VL | −17.21 | −2.29 | −9.00 | |
| Δ tHb (AU) VL | 0.21 | 0.37 | 0.09 | |
| 4 | Δ SmO2 (%) LD | −43.87 | −32.99 | −44.91 |
| Δ tHb (AU) LD | 1.02 | 0.78 | 0.59 | |
| Δ SmO2 (%) PM | −63.33 | −32.56 | −45.82 | |
| Δ tHb (AU) PM | 0.28 | 0.41 | 0.24 | |
| Δ SmO2 (%) VL | −18.46 | −3.41 | −6.51 | |
| Δ tHb (AU) VL | 0.19 | 0.20 | 0.14 | |
| 5 | Δ SmO2 (%) LD | −44.04 | −38.18 | −52.17 |
| Δ tHb (AU) LD | 0.42 | 0.85 | 0.71 | |
| Δ SmO2 (%) PM | −60.83 | −30.46 | −43.46 | |
| Δ tHb (AU) PM | 0.27 | 0.34 | 0.21 | |
| Δ SmO2 (%) VL | −20.96 | −2.21 | −2.94 | |
| Δ tHb (AU) VL | 0.19 | 0.22 | 0.11 | |
| 6 | Δ SmO2 (%) LD | −45.20 | −36.53 | −51.66 |
| Δ tHb (AU) LD | 0.44 | 0.69 | 0.83 | |
| Δ SmO2 (%) PM | −56.86 | −30.46 | −48.31 | |
| Δ tHb (AU) PM | 0.33 | 0.36 | 0.18 | |
| Δ SmO2 (%) VL | −19.47 | −2.19 | −2.98 | |
| Δ tHb (AU) VL | 0.22 | 0.42 | 0.14 | |
Publisher’s Note: MDPI stays neutral with regard to jurisdictional claims in published maps and institutional affiliations. |
© 2022 by the authors. Licensee MDPI, Basel, Switzerland. This article is an open access article distributed under the terms and conditions of the Creative Commons Attribution (CC BY) license (https://creativecommons.org/licenses/by/4.0/).
Share and Cite
Paulauskas, R.; Nekriošius, R.; Dadelienė, R.; Sousa, A.; Figueira, B. Muscle Oxygenation Measured with Near-Infrared Spectroscopy Following Different Intermittent Training Protocols in a World-Class Kayaker—A Case Study. Sensors 2022, 22, 8238. https://doi.org/10.3390/s22218238
Paulauskas R, Nekriošius R, Dadelienė R, Sousa A, Figueira B. Muscle Oxygenation Measured with Near-Infrared Spectroscopy Following Different Intermittent Training Protocols in a World-Class Kayaker—A Case Study. Sensors. 2022; 22(21):8238. https://doi.org/10.3390/s22218238
Chicago/Turabian StylePaulauskas, Rūtenis, Ričardas Nekriošius, Rūta Dadelienė, Ana Sousa, and Bruno Figueira. 2022. "Muscle Oxygenation Measured with Near-Infrared Spectroscopy Following Different Intermittent Training Protocols in a World-Class Kayaker—A Case Study" Sensors 22, no. 21: 8238. https://doi.org/10.3390/s22218238