2.2. Environment Simulation: Seepage Model
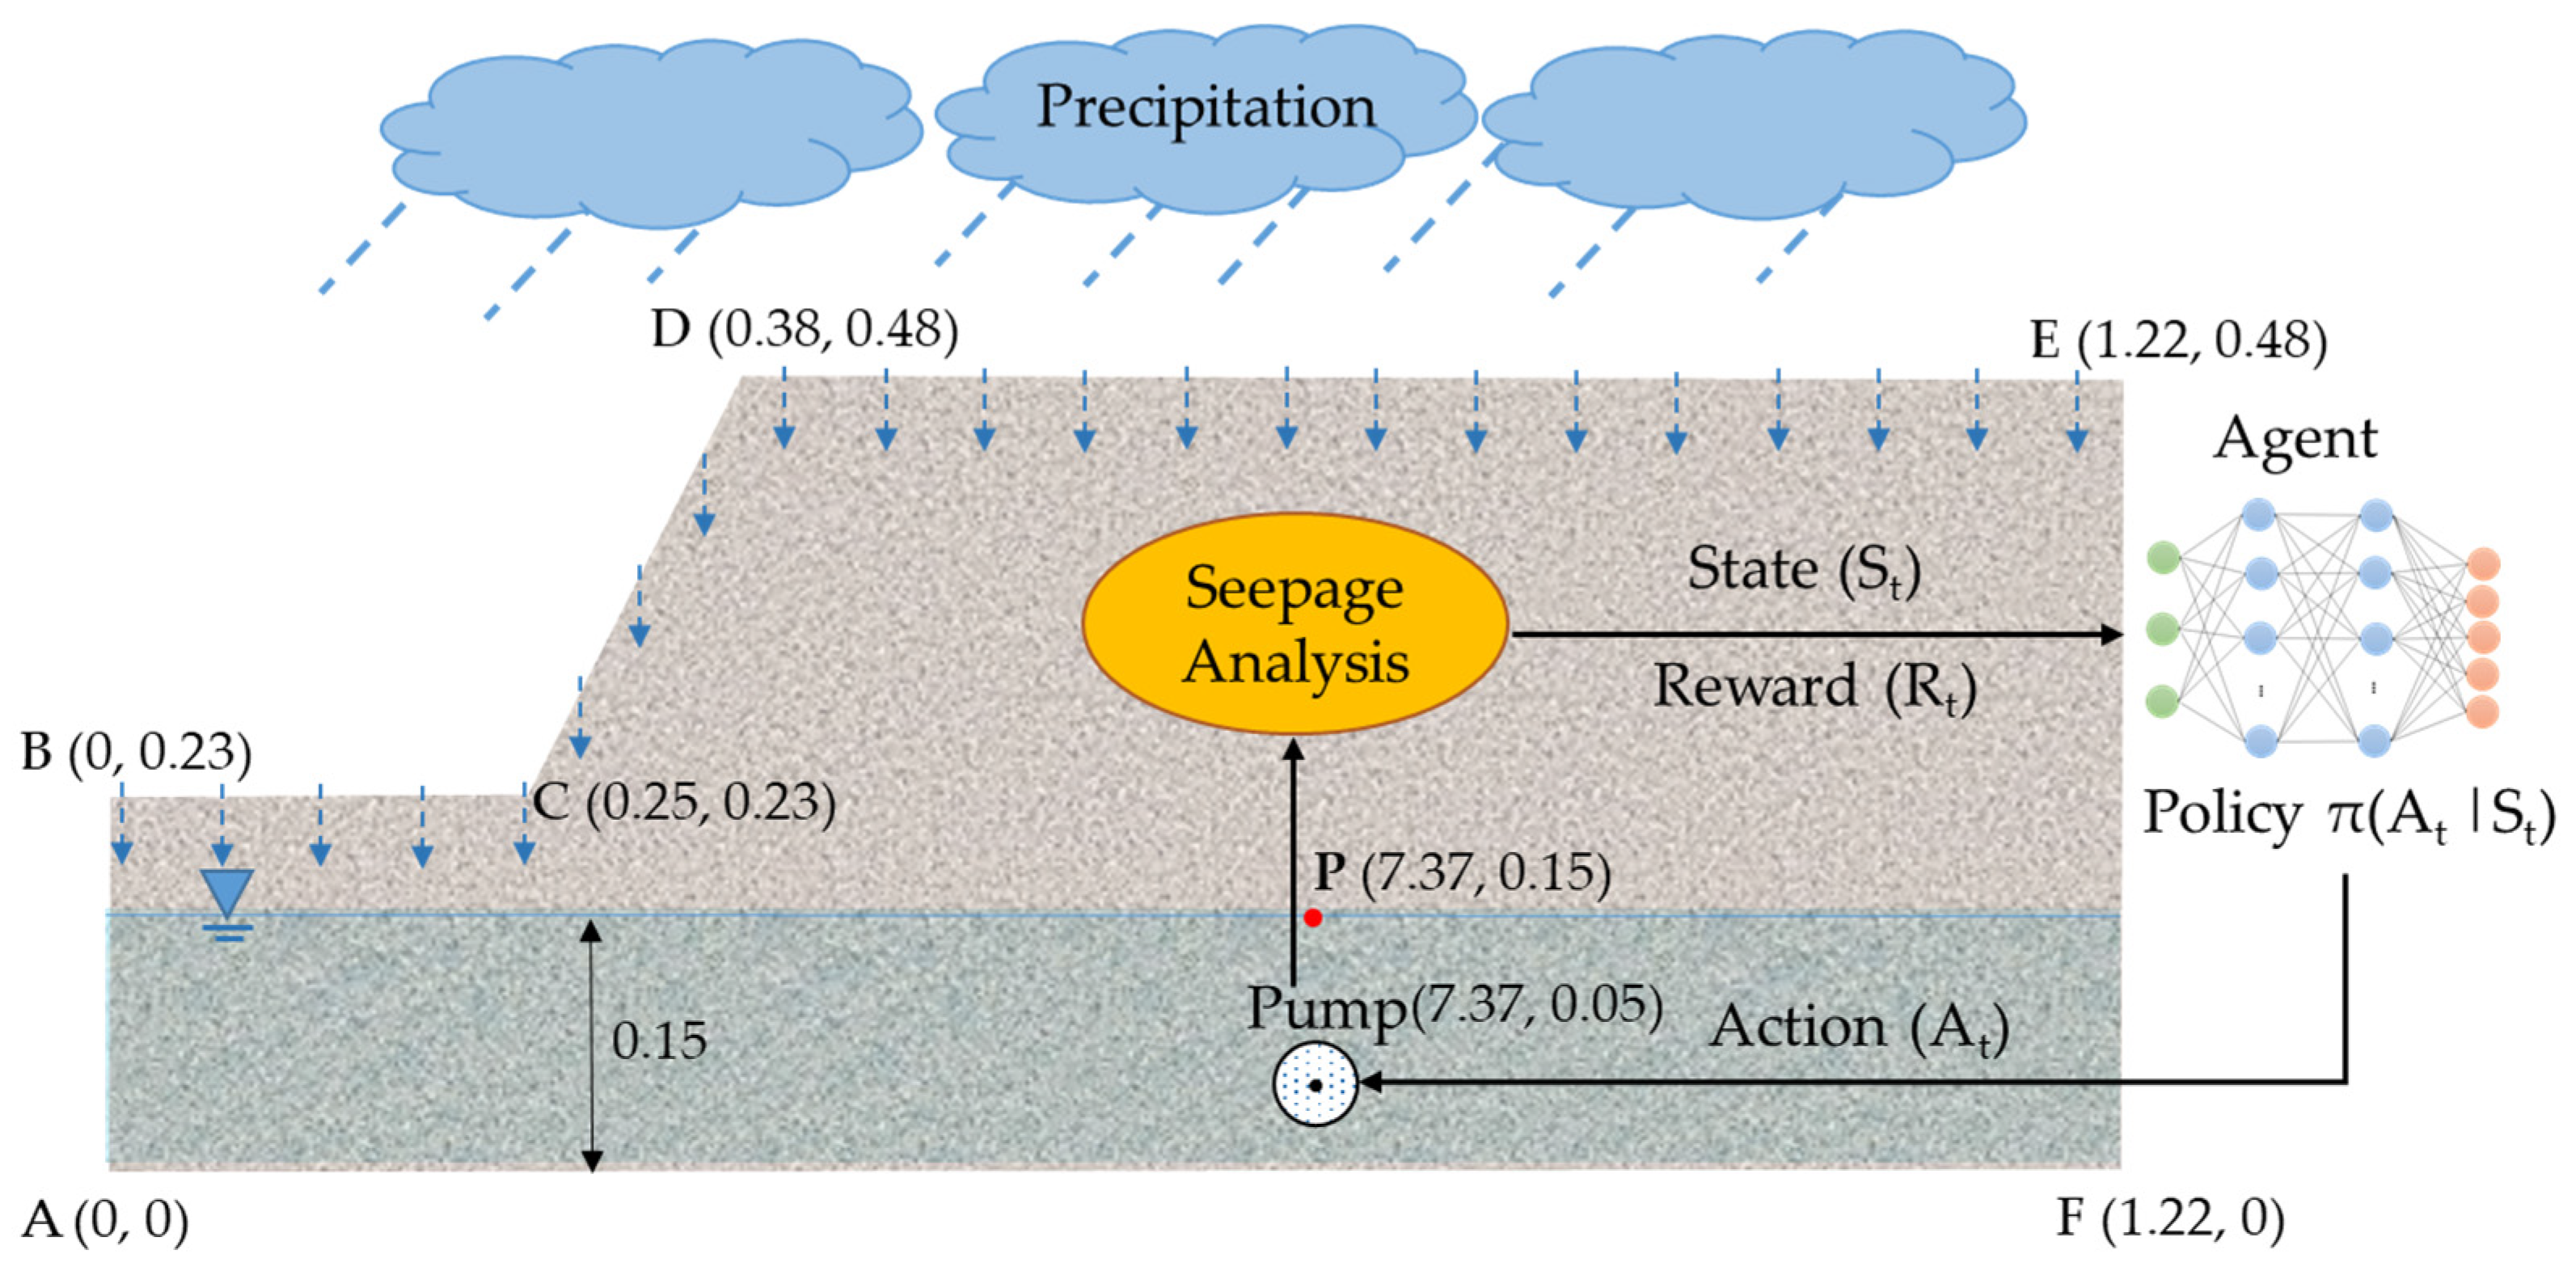
A seepage model was employed to simulate the geosystem (i.e., a slope equipped with a pump and subjected to rainfall events). To update the agent in the state
, a transient seepage analysis was conducted with the model to determine the water head at point “P” for the given rain intensity at time
. The seepage analysis was carried out using DOLFIN [
48], the Python interface of FEniCS [
49]. FEniCS is an open-source library for solving partial differential equations (PDEs). In our previous study [
50], a similar seepage model was seamlessly coupled with a slope stability analysis to investigate the influence of the water level fluctuation in the reservoir on the stability of silty and sandy slopes. The computational framework of the seepage model was validated using another finite element PDE solver, FlexPDE [
50]. The present seepage model, however, differs in the boundary conditions, soil properties, and slope geometry. The governing equation for the saturated–unsaturated transient seepage analysis in this study is given in Equation (1).
where
[m] is the pressure head,
[m] is the elevation head, and
[m/s] is the sink term representing the pump’s outflux.
The definitions of the terms
and
depend on the soil’s degree of saturation. In a saturated flow,
and
were replaced with
(specific storage of saturated flow) and
(saturated hydraulic conductivity), respectively.
and
were determined based on the type of soil and were assumed to be constant during the transient seepage analysis. In an unsaturated flow,
and
were substituted by
(specific moisture content) and
, where
is the relative hydraulic conductivity. The specific moisture content for the unsaturated flow is the derivative of volumetric water content (
) with respect to the water head (
),
where
[−] is the soil porosity and
is the effective saturation degree.
was derived from the van Genuchten equation [
8,
51],
where
and
[Pa] are fitting parameters that can be obtained from the soil–water characteristic curve (SWCC).
[Pa] is the matric suction and is calculated as follows:
where
[N/m
3] is the unit weight of water.
The relative hydraulic conductivity quantifies how the hydraulic conductivity changes with the degree of saturation. The widely adopted van Genuchten equation was used for
[
51]:
Table 1 presents the input parameters adopted for the seepage model. These parameters were obtained based on a combination of lab tests and published ranges of values for similar soils from the literature.
The geometry of the geosystem used in the analyses is shown in
Figure 1. In fact, the physical counterpart of this lab-scale geosystem will serve as a real-world environment in future studies for testing the proposed methodology in this study. The lab-scale geosystem was located in an acrylic tank to control the influx and outflux in the system. Accordingly, the no-flux boundary condition was assigned to the bottom (“AF”), left (“AB”), and right (“FE”) sides of the slope.
The only influx into the geosystem is the rain infiltrating across the slope’s top surfaces (“BC”, “CD”, and “DE”):
where
[m/s] is the rain intensity [m/s]. Four different rainfall events, as shown in
Figure 2, were considered to train the agent. The rainfall events were designed based on three parameters: (1) rainfall duration, (2) total rainfall depth, and (3) rain intensity distribution pattern. For rain intensity distribution patterns, German guidelines, Deutschen Verbandes für Wasserwirtschaft und Kulturbau (DVWK), recommend four possible intensity distribution patterns for rainfall events, as displayed in
Figure 2 [
52]. Accordingly, rainfall events with various durations (15, 20, 25 min), total rainfall depths (25 mm, 30 mm, 32 mm, and 35 mm), and patterns (constant, normal, descending, and ascending) were used in the seepage model.
Figure 2a is a 15-min event with a constant rain intensity and a total rainfall depth of 25 mm.
Figure 2b is a 15-min event with a maximum intensity in the middle of the event and a total rainfall depth of 32 mm.
Figure 2c is a 20-min event with a maximum intensity at the beginning of the event and a total rainfall depth of 30 mm.
Figure 2d is a 25-min event with a maximum intensity at the end of the event and a total rainfall depth of 35 mm. For simplicity, these events will be referred to as “15 min-constant”, “15 min-normal”, “20 min-descending”, and “25 min-ascending”, respectively. It is noted that the water ponding was not considered in the seepage analysis since the rain intensity in all four events was smaller than the saturated hydraulic conductivity (i.e., soil infiltration capacity).
The pump was modeled as a sinkhole in the analyses. Thus, an outflux boundary condition was set to the pump’s boundary. The pump’s outflux is the discharge per unit area per unit time [m
3/m
2s or m/s].
where
[m
3/s] is the maximum capacity of the pump and
[m] is the radius of the sinkhole for the pump.
[–] takes a value between 0 and 1 depending on the action taken by the agent to regulate the pump’s flow rate. Five discontinuous actions were defined for the agent to set the pump’s capacity to 0%, 25%, 50%, 75%, and 100% of the maximum capacity.
Table 2 presents the values of
,
, and
adopted for the five actions.
Figure 3 shows the flowchart of the developed Python code for the seepage model. The input parameters for this model are unsaturated soil characteristics (
), saturated soil parameters (
), the geometry of the slope and pump, the location of point “P”, rain intensities for the rainfall event (
), and time variables (
).
is the duration of the rainfall event and
is the time step for solving the PDE (i.e., the governing equation). The time step was considered 1 min. In the next step, the computational domain of the slope was defined and a mesh with 3-node Lagrangian elements was generated. Next, the subdomains, the initial water level, the initial observations (i.e., initial water head and rain intensity at
t = 0, 1 min), and the auxiliary equations (
) were defined. In order to solve the PDE, the equation was reformulated as a finite element variational problem. Boundary conditions were then applied to the subdomains, as demonstrated in Equations (6)–(8). For each time step, the boundary conditions for the slope’s surface (“BC”, “CD”, and “DE” in
Figure 1) and the pump were updated based on the rain intensity and the action taken by the agent. Subsequently, the PDE was solved to obtain the water head at point “P”. The result was used to calculate the reward and update the agent on the next state. The details about the reward function and conditions for terminating the seepage analysis will be explained in
Section 2.4.
2.3. Agent: Deep Q-Network
The Deep Q-Network (DQN) is a widely accepted algorithm for sequential decision-making in systems with high-dimensional states. DQN was introduced in 2015 by combining the Q-learning algorithm and deep neural networks (DNNs), which showed human-level performance in playing Atari games [
34]. Recent DQN studies also demonstrated great success in controlling complex systems in a variety of disciplines. Successful examples of DQN applications include real-time control of stormwater systems [
42], carbon storage reservoir management [
43], stock market forecasting [
53], managing health care system [
54], control of agricultural irrigation [
55], and crop yield prediction for sustainable agrarian applications [
56]. DQN is the ideal option for automated decision-making in the geosystem because it has shown excellent performance in systems with high-dimensional states.
DQN is a value-based algorithm. This means that, for the given state, DQN assigns a state–action value (i.e.,
), to each possible action as follows [
34]:
where
is the immediate reward in response to the action
taken in the state
,
is the maximum
Q-value in the next state
after taking the (optimum) action
,
is the learning rate of the agent, and
is the discount factor. The learning rate is a hyperparameter between 0 and 1 (
), which determines the step size of the update for
Q-values. The condition
overlooks the knowledge from new actions and does not update the
Q-value, while
considers the most recent information and ignores the acquired knowledge from the past. The discount factor takes a fixed value between 0 and 1 (
) to adjust the contribution of long-term rewards from future states and actions. In fact,
merely considers the immediate reward for the action
and ignores the future outcomes of the chosen actions, while
evaluates actions equally based on their immediate reward and potential future rewards [
46].
The
Q-values are initialized with random values because the agent does not have any knowledge about the environment. When the agent starts to take action, the
Q-values are continuously updated using Equation (9) until converging to an optimal policy. As the state and action space size increase, a neural network helps to approximate the
Q-values, leading to DQN.
Figure 4 demonstrates the architecture of the DQN model for the current study and the interactions between the environment (i.e., the seepage model) and the agent (i.e., the neural network).
In the DQN model shown in
Figure 4, the agent takes an action based on the
-greedy policy. The
-greedy policy helps the agent to strike a balance between exploitation and exploration [
57,
58]. Exploitation is a strategy in which the agent greedily chooses the most effective previously discovered action, whereas exploration allows the agent to explore its environment by taking random actions that may occasionally return even higher rewards [
42]. Based on this policy, the agent randomly chooses an action with the probability of
or takes a known action associated with the maximum
Q-value with the probability of
(see Equation (10)). At the beginning of the training, it is common to set
to a high value (e.g., 1) to enable the agent to explore the environment for rewarding actions. This parameter is gradually reduced to a lower value (e.g., 0.01) to transition to an exploitation strategy as the agent converges to an optimal control policy [
42,
43].
As shown in
Figure 4 for the DQN model, two separate neural networks with the same architecture were trained simultaneously to stabilize the learning process [
34]. The first network is the prediction network used to approximate the
. The second network is the target network used to calculate the target
Q-values (i.e., future rewards),
. The input layer of each neural network contains three neurons to receive observations from the environment. Two fully connected hidden layers were defined, with 25 neurons for each layer. Then, the output layer with five neurons was specified for
Q-values of five possible actions. Mnih et al. also introduced the experience replay (or replay buffer) to improve the learning stability [
34]. The experience replay stores the agent’s most recent experience as a tuple of (
,
,
,
). During the training, the agent samples a batch of data from the experience replay and calculates the loss of the neural network, and then updates the prediction network weights. The loss function is the squared difference between the target
Q-value and the predicted
Q-value:
It is noted that both prediction and target networks were initialized with the same weights. The weights for the prediction network were updated every iteration, whereas the weights for the target network were updated every N iterations (e.g., every 50 iterations) to stabilize the training. The target network simply duplicates the weights of the prediction network every N iterations. For this study, after trying various values (15, 45, 60, and 75) of target network update frequency (or N), the value of 60 was selected.
2.4. Reward Function
The performance of the DRL agent is highly dependent on the received rewards during the training [
38]. A thorough and explicit reward function can assist the agent in rapidly discovering the optimal policy and achieving the goal of the system. However, outlining such a reward function is not a simple task. In this study, the reward function was defined in such a way as to incentivize the agent to adopt a control policy that keeps the water level close to the target level. The reward function for the geosystem (Equation (12)) was constructed using the absolute value of the water head at point “P” at the next time step (i.e.,
), and the difference between the water head values at point “P” at the current and next time steps (i.e.,
). The positive and negative values of the water head at point “P” represent the water levels above and below point “P”, respectively. The absolute value of the water head represents the distance between the current and the target water level.
The cumulative reward for an episode can help to evaluate the selection of actions for a rainfall event. An episode is a period in which the agent takes action in response to a rainfall event. An episode may last the same amount of time as a rainfall event. In addition to the episode duration, in this study, an episode was terminated when there was an overflow or complete discharge in the slope. The overflow would happen when the water height above point “P” exceeds 0.33 m, and the complete discharge would occur when the water level is more than 0.13 m below the target level. Terminating an episode due to an overflow and a complete discharge leads to a lower cumulative reward, so the agent would attempt to avoid these situations by refining the adopted policy. Such settings can benefit both the geosystem and the pump by enhancing the safety and efficiency of the system.
The geosystem’s goal was to keep the water level as close as possible to the target level. It is noted that the geosystem was initially set to the target level. By starting the precipitation, the water level gradually increased and the agent began taking action. The agent received a positive score for reducing the distance to the target level (i.e., ). The reward function assigned a higher reward to actions that led to lower absolute values of water head at point “P” (i.e., ). The agent also earned a positive score when the pump utilized its full capacity to remove water from the slope; however, it could not reduce the distance from the target level. The maximum possible reward value that the agent could receive for each action was 100, which happened when the water head at point “P” was exactly zero. By contrast, the agent received a negative score when the water level moved away from the target level. The maximum negative score assigned to the agent was approximately −15, which happened when the water level approached the overflow level.


