
Development of a LoRaWAN IoT Node with Ion-Selective Electrode Soil Nitrate Sensors for Precision Agriculture
 , , and
Abstract
:1. Introduction
2. Nitrate Sensor Development
2.1. Ion-Selective Electrode Soil Nitrate Sensors
2.2. Overview of the Nitrate Soil Sensor Approach
2.3. Manufacture of the Nitrate Sensors and Reference Electrodes
2.4. Nitrate Analysis Technique
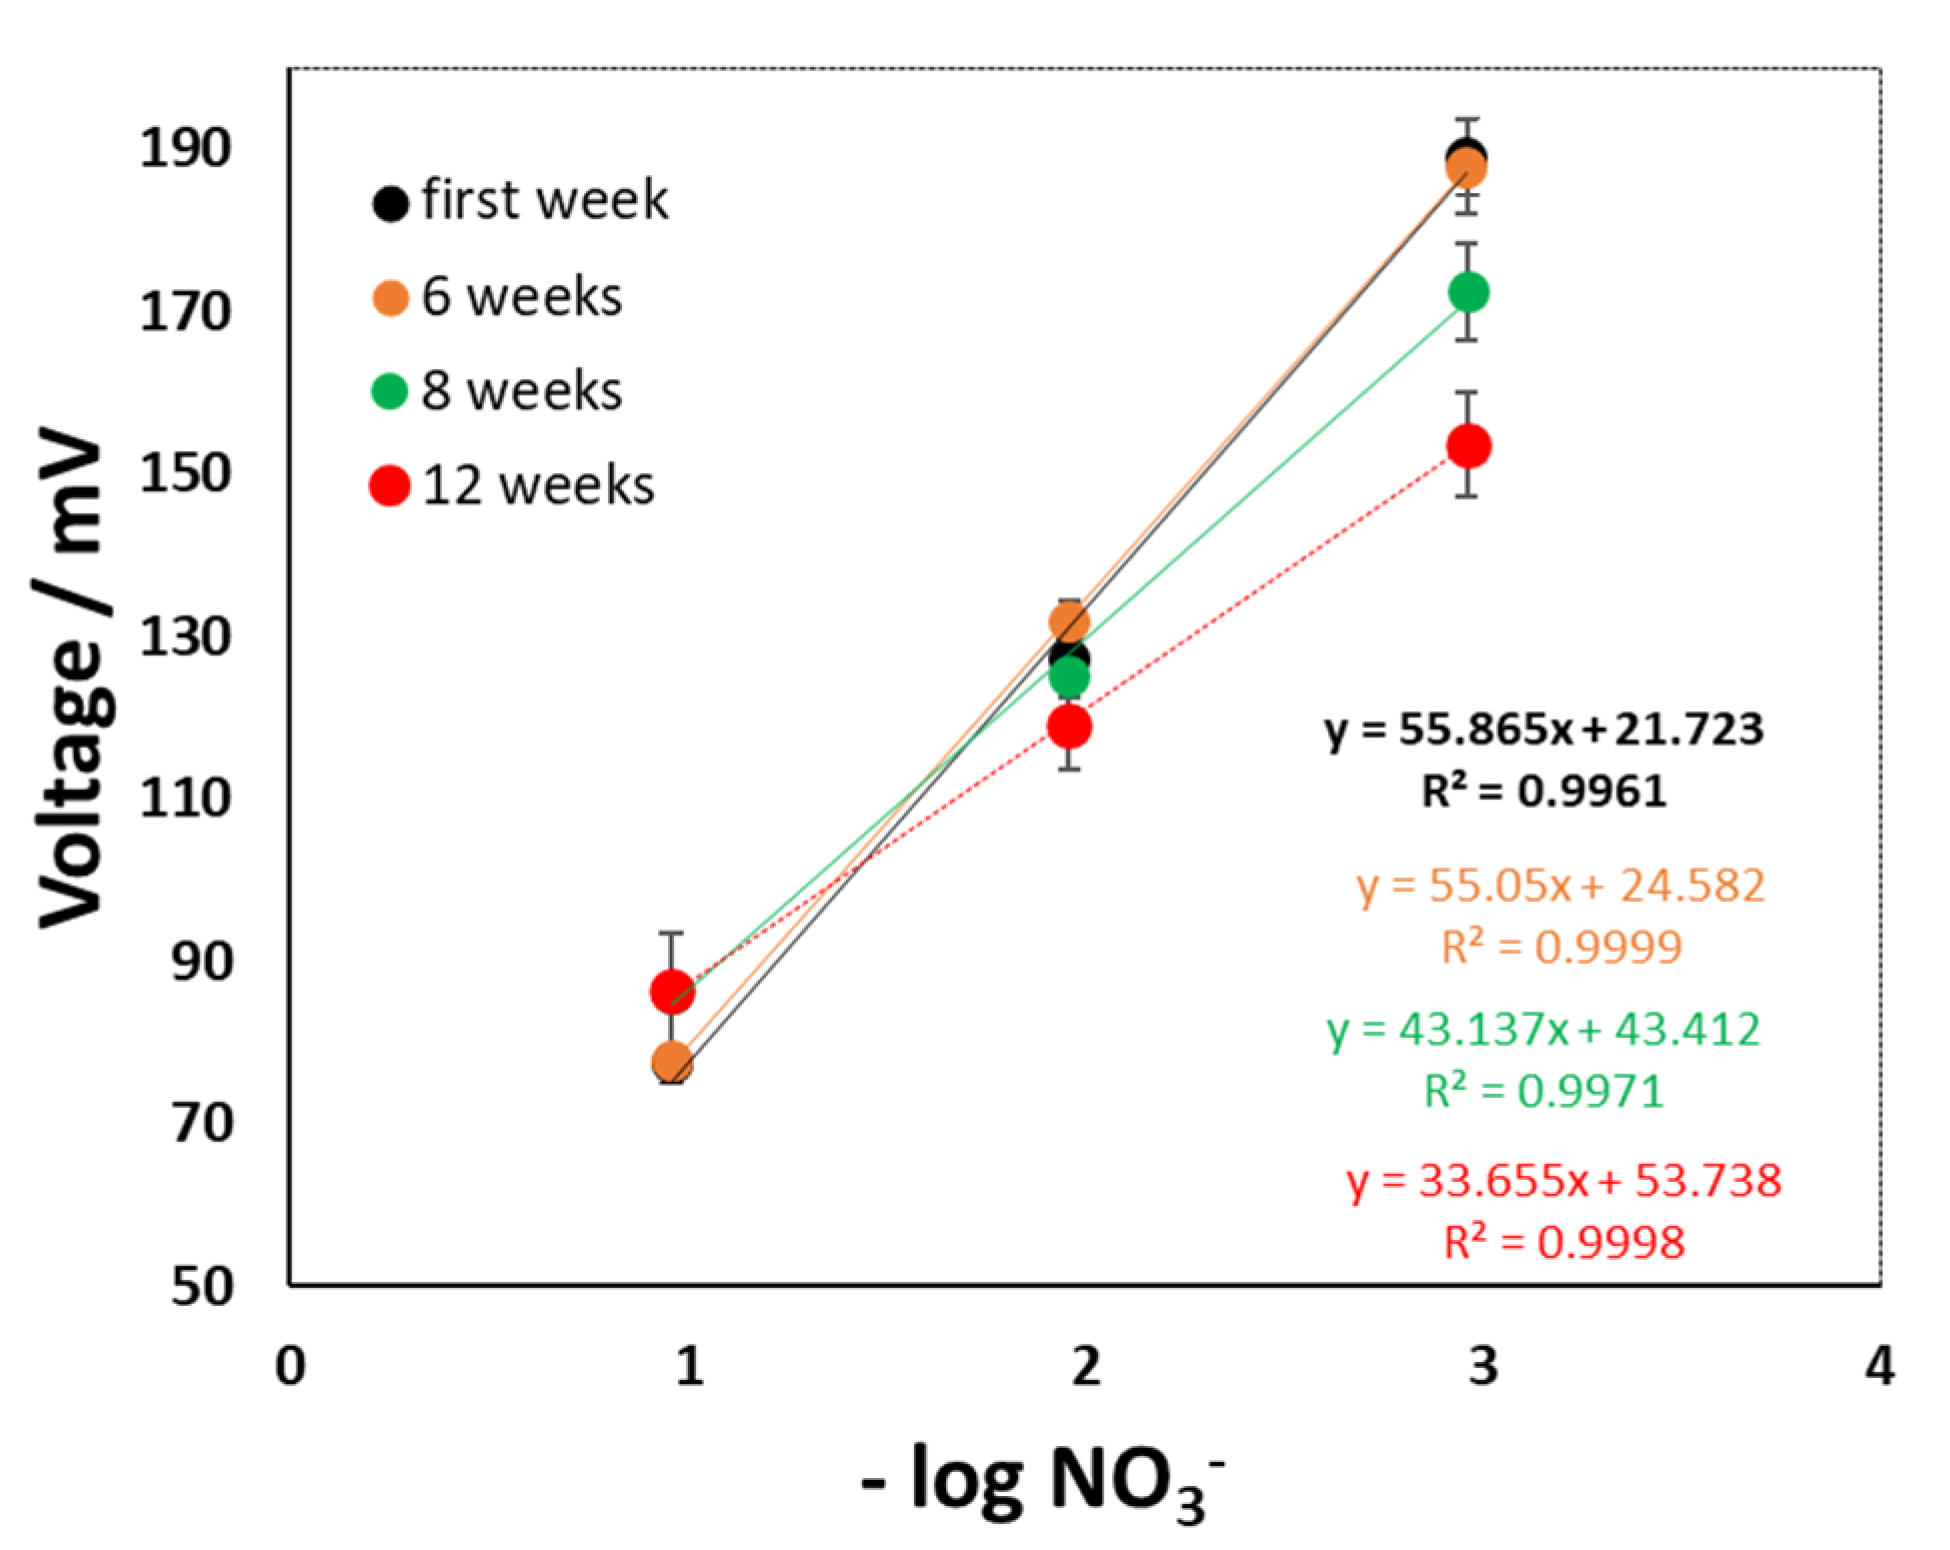
2.5. Methodology Used to Calibrate the Sensors
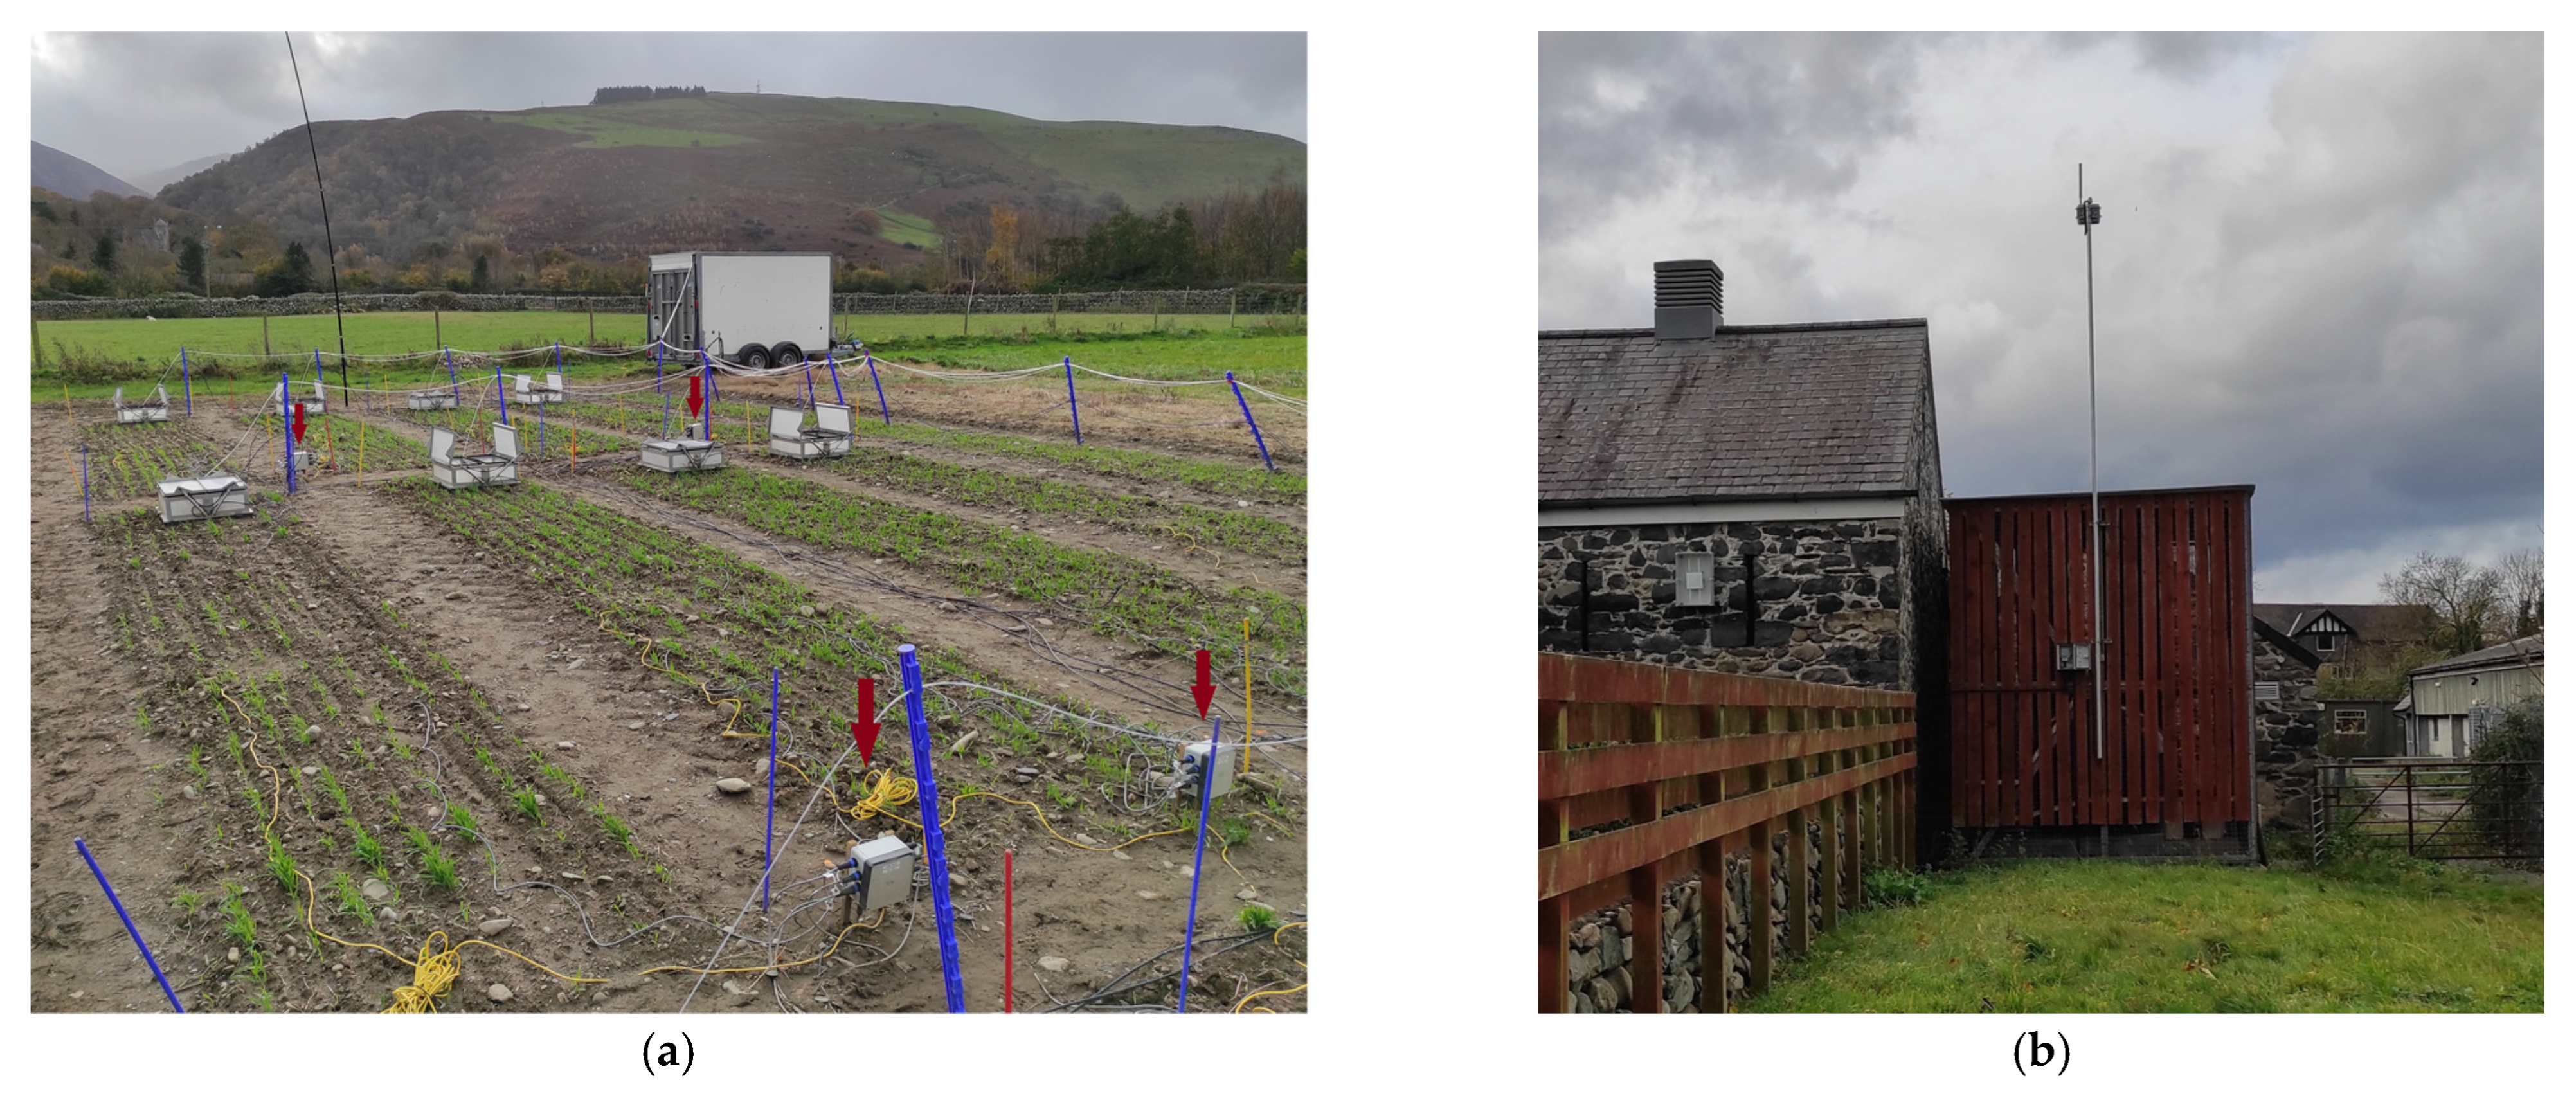
2.6. Field Testing
3. Wireless Networking of Soil Sensors
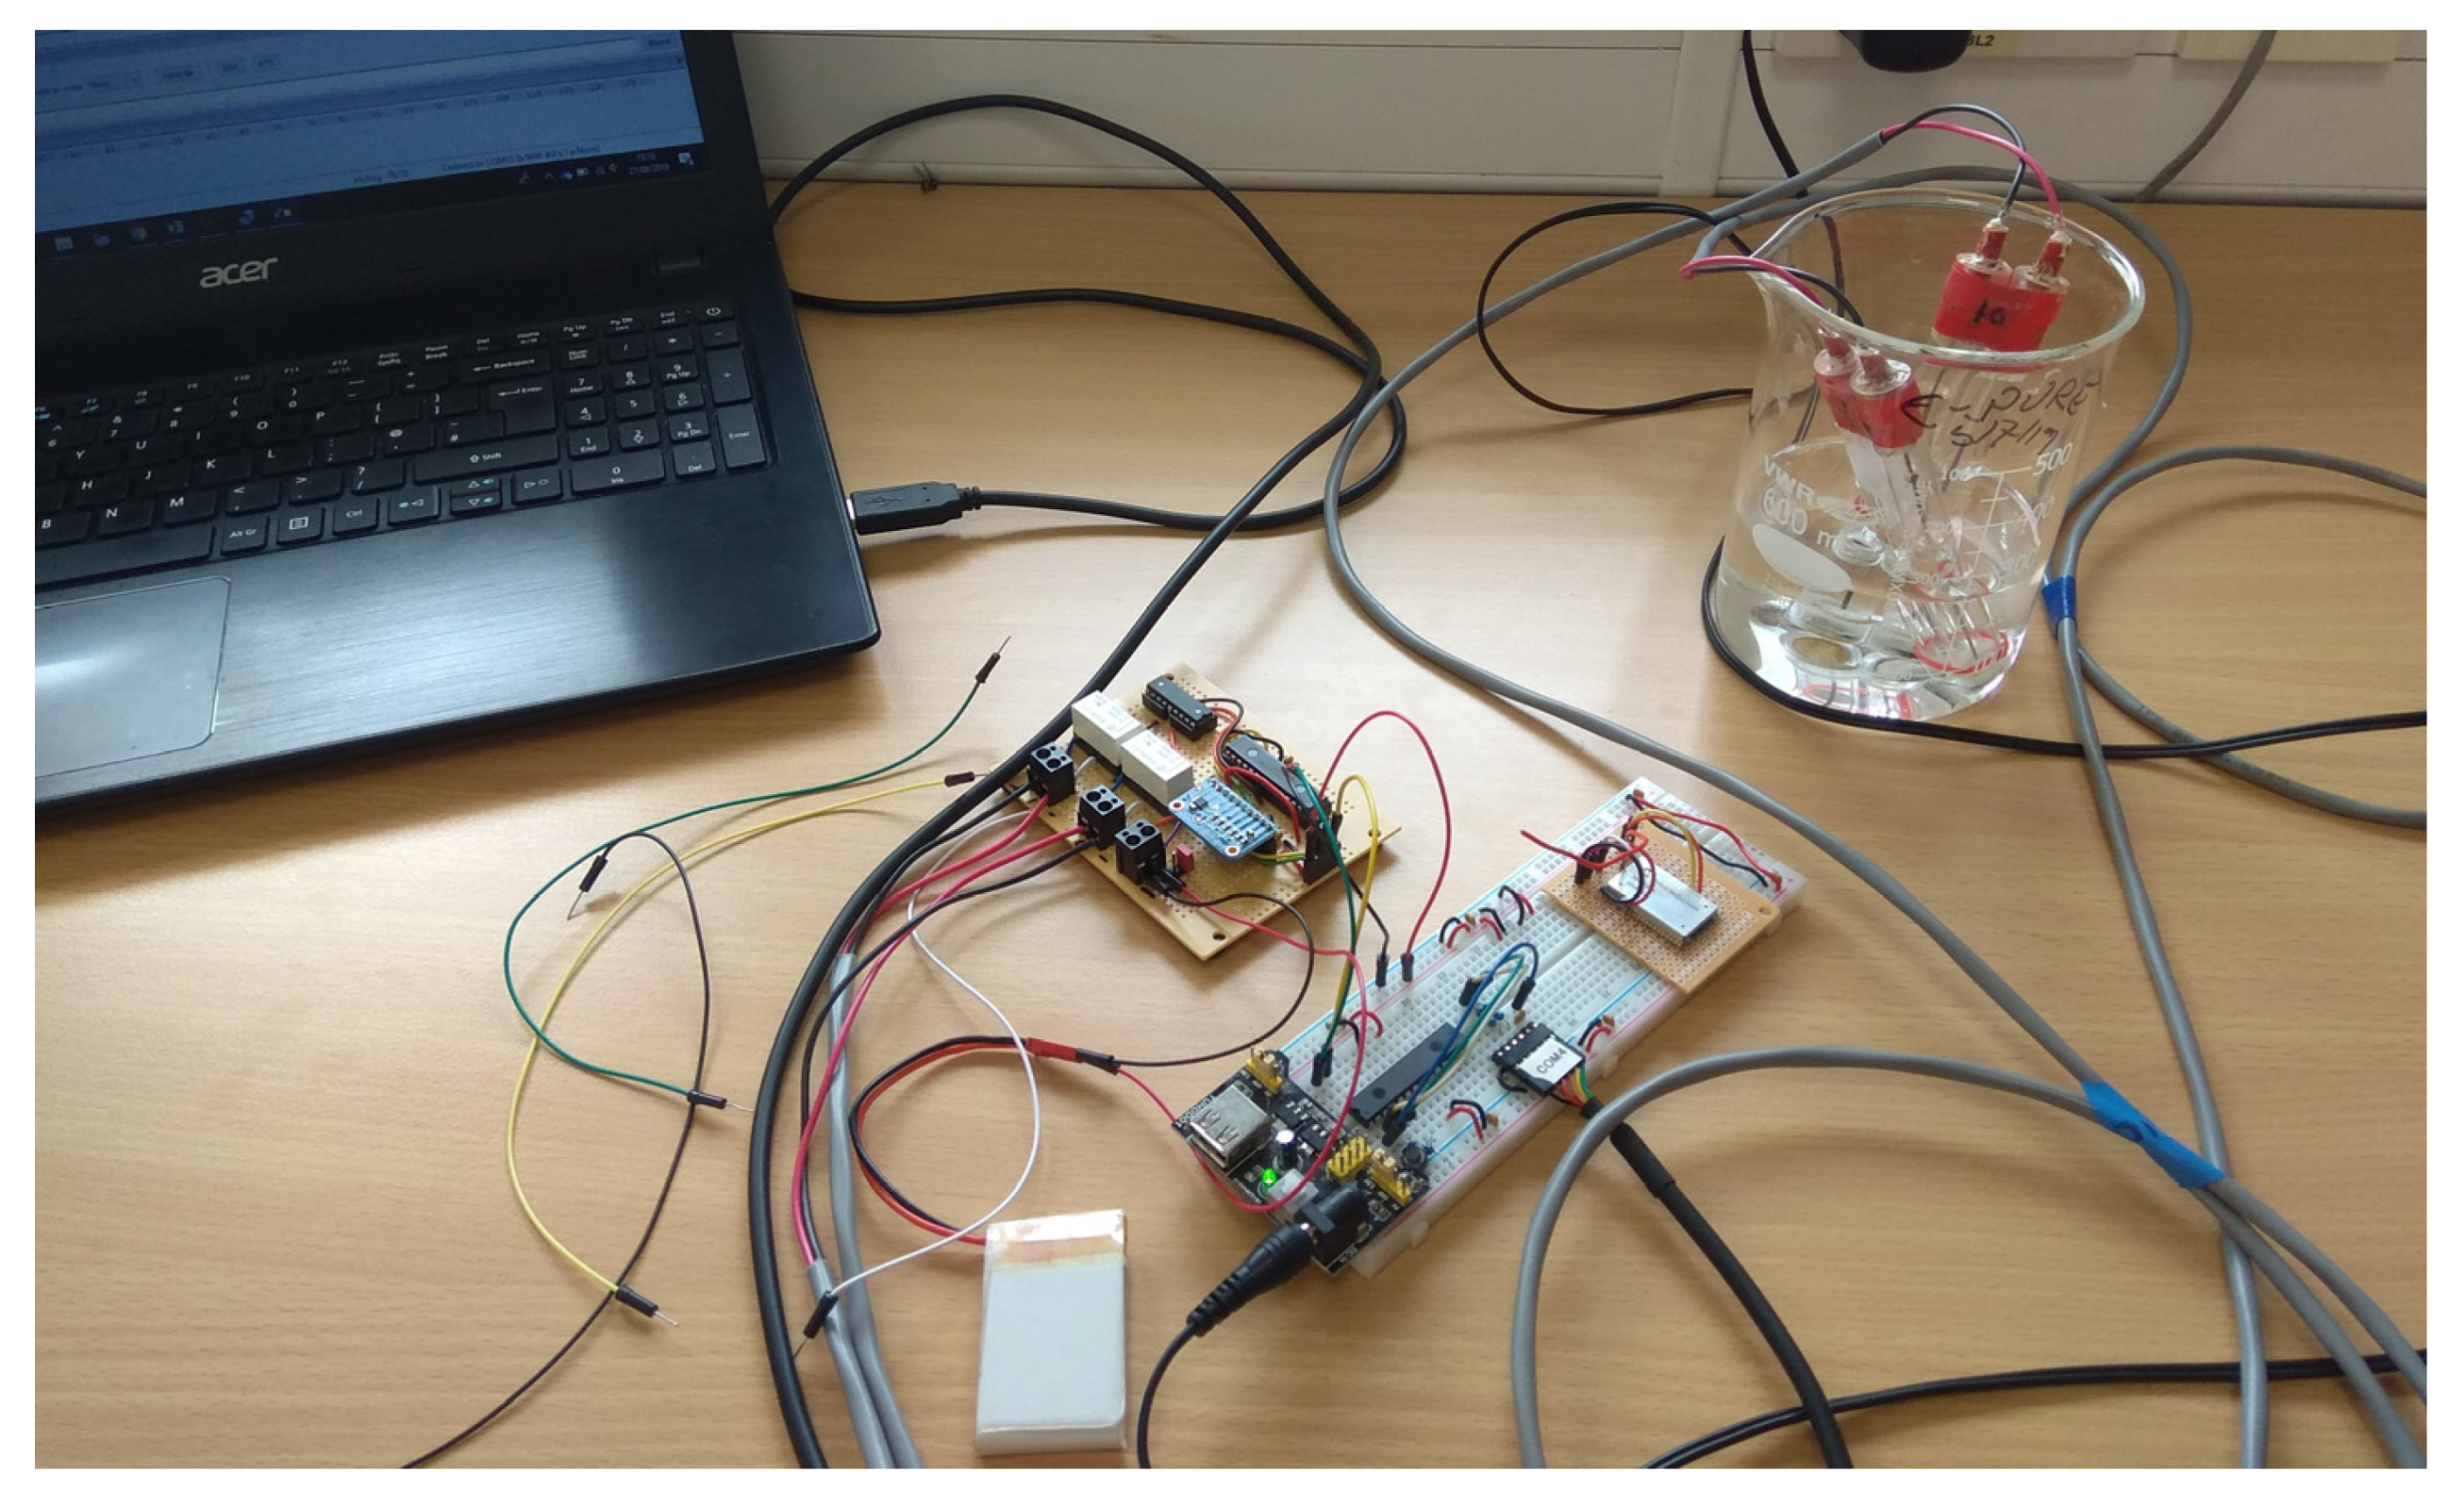
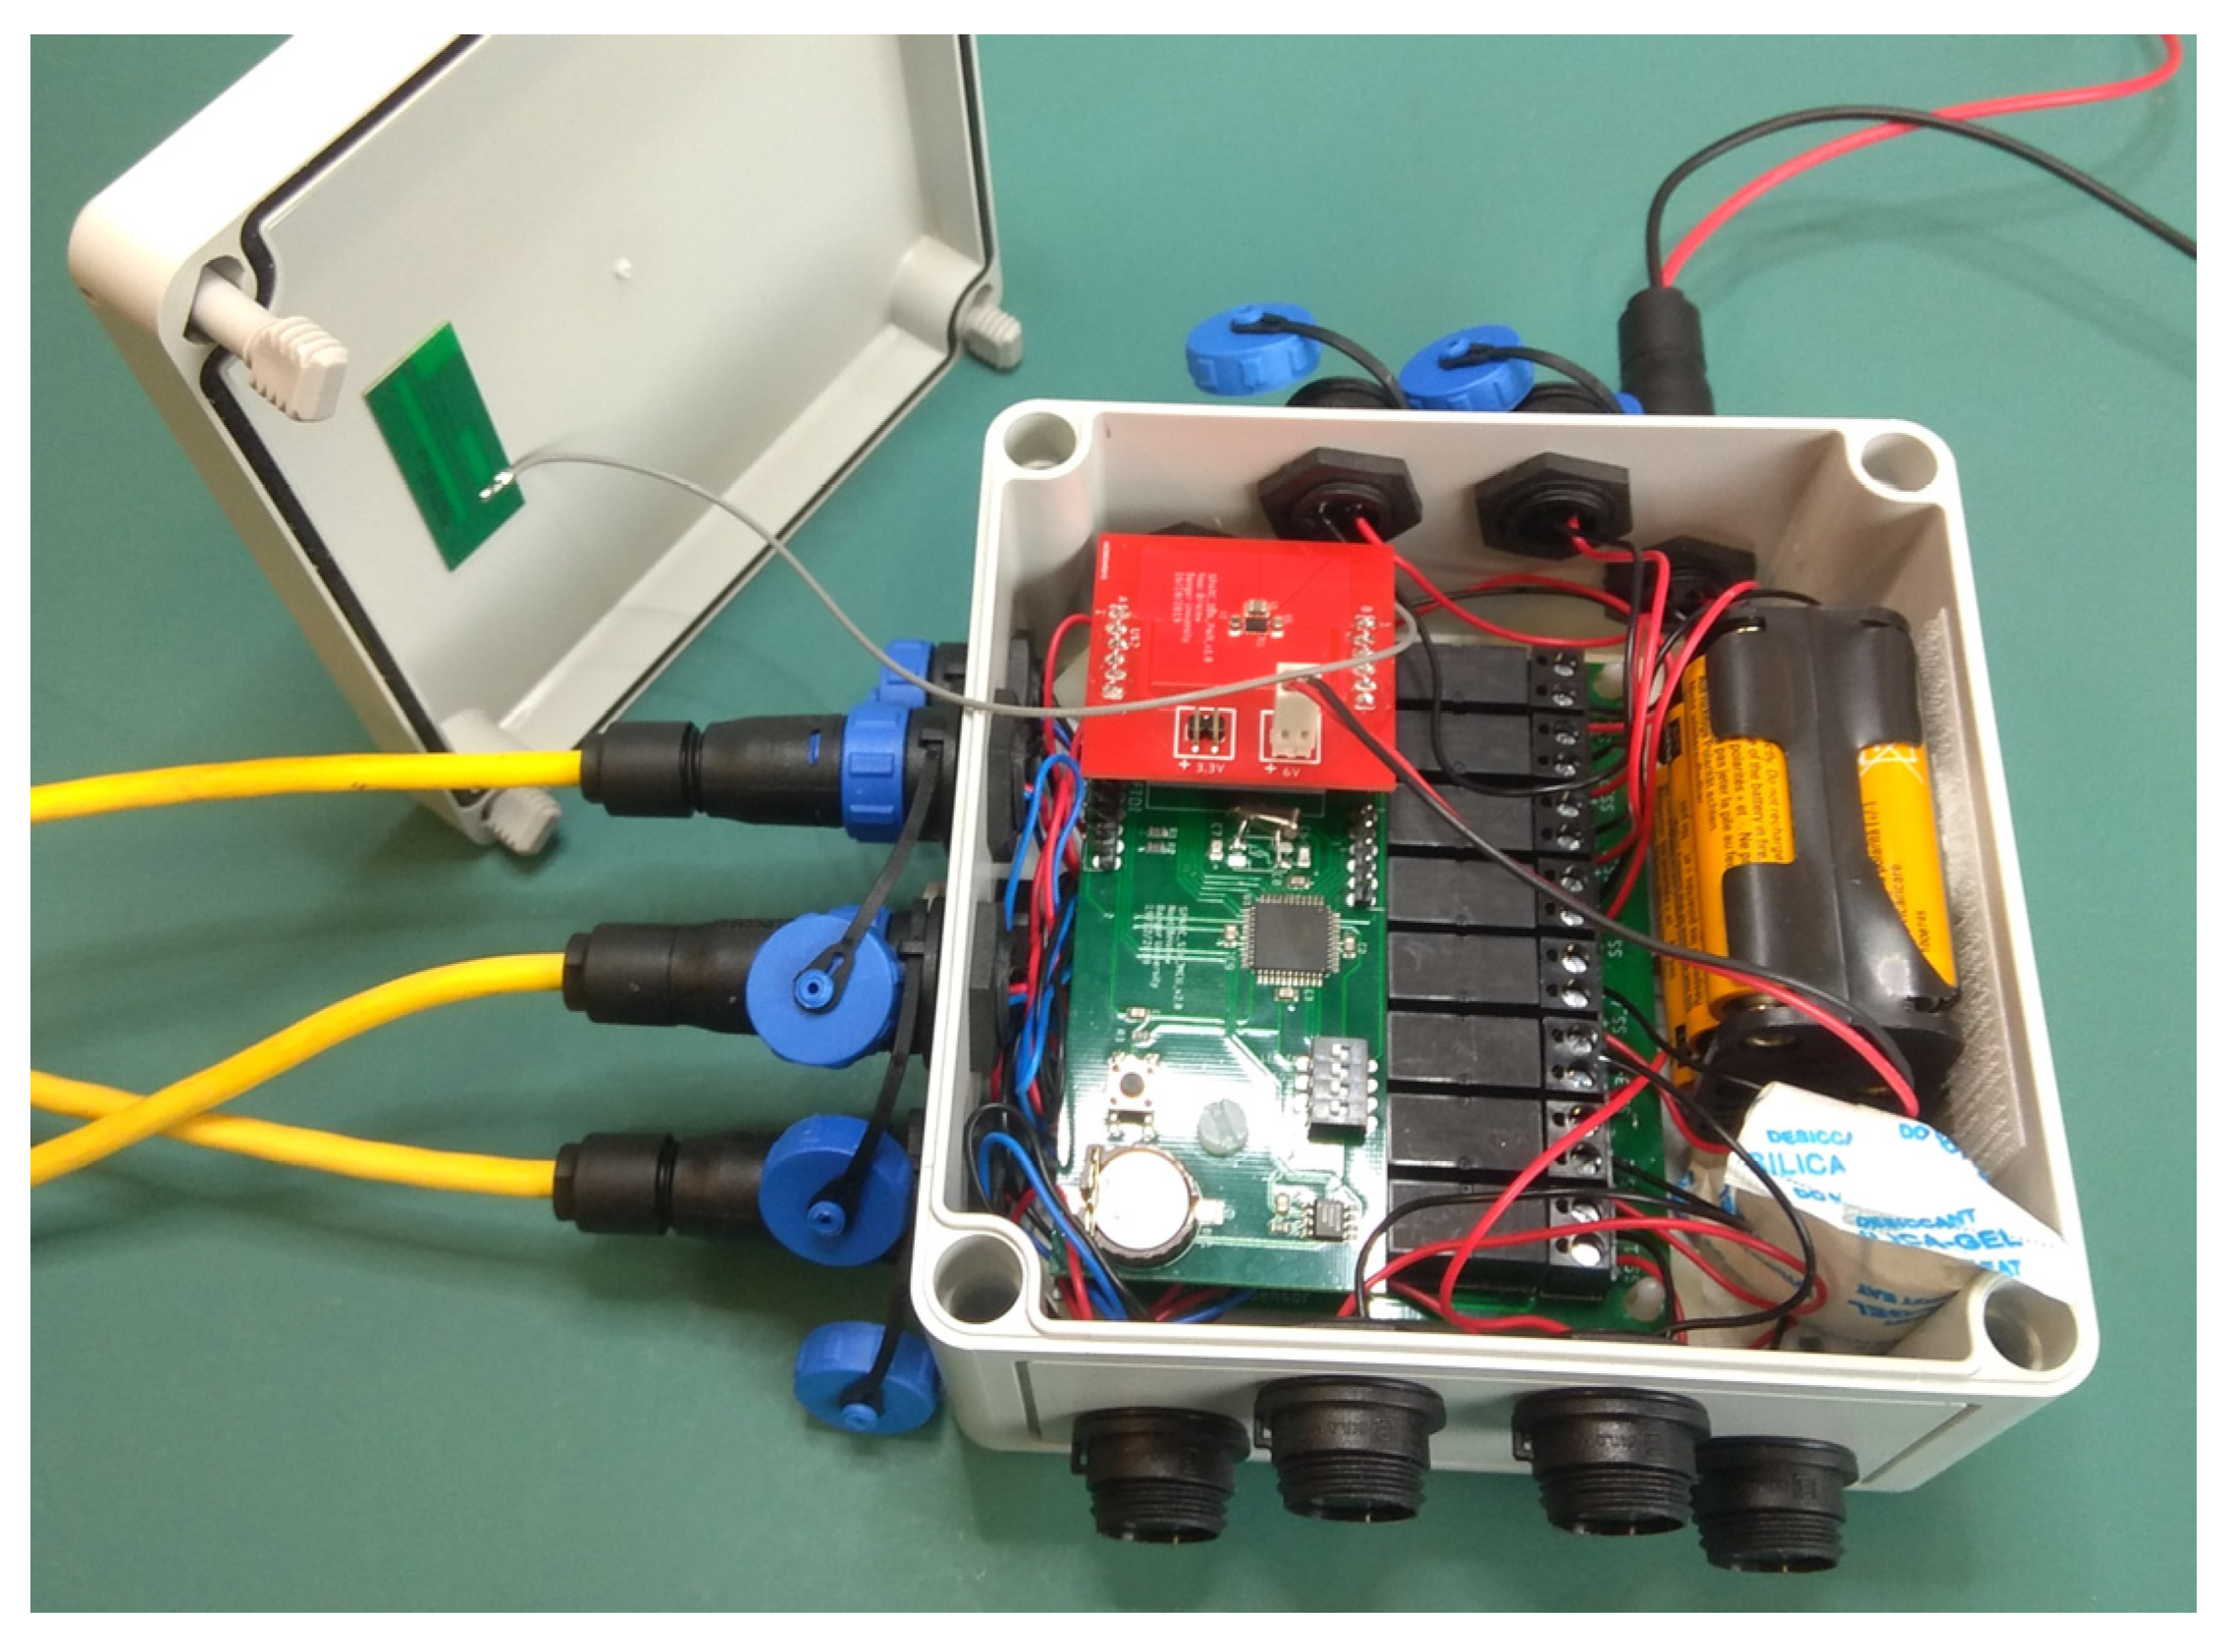
3.1. IoT Soil Sensor Node Design
- ATmega644PA—microcontroller (MCU)
- DS3231M—precision real-time clock (RTC)
- MCP23017—16-channel I2C I/O expander
- ULN2803—8-channel Darlington transistor array
- TPS27081—high-side load switch
- TPS62745—ultra-low IQ step-down DC-DC converter
- ADS1115—16-bit analog-to-digital converter (ADC)
- RN2483A—LoRaWAN radio module
- 8× soil NO3− ISE sensors—multiplexed by relays
- 4× Acclima TDT soil moisture sensors—SDI-12 bus
3.2. Wireless Communications
3.3. Power Requirements
4. Wireless Node Operation
4.1. Node Initialisation
4.2. Measurement Cycle
5. Data Processing
6. Deployment
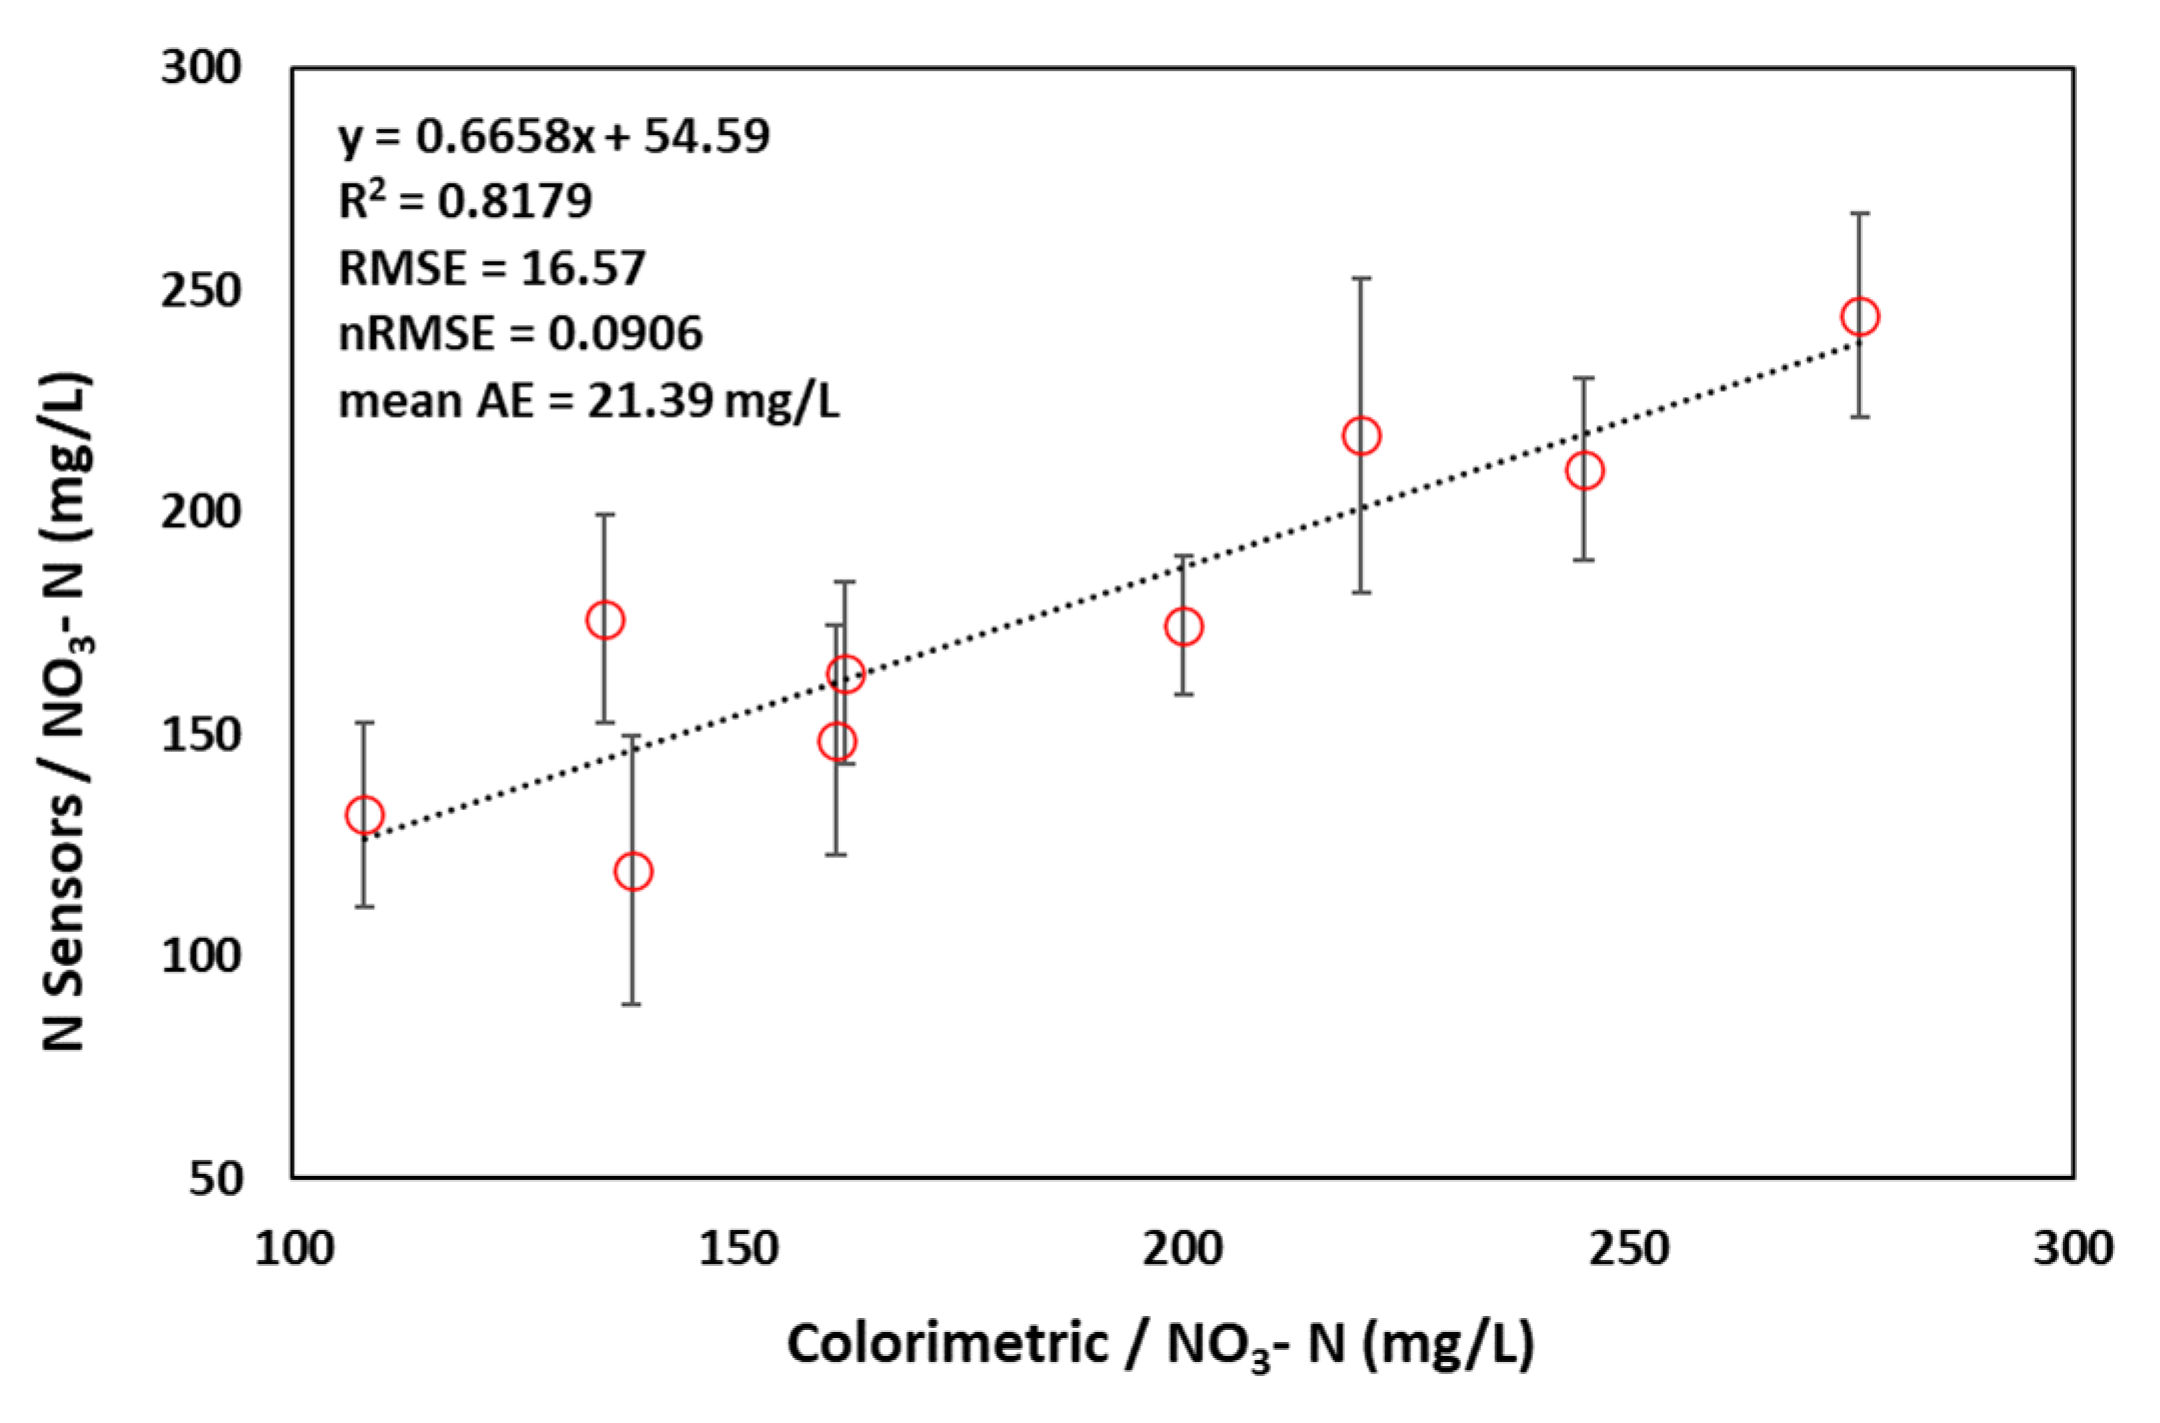
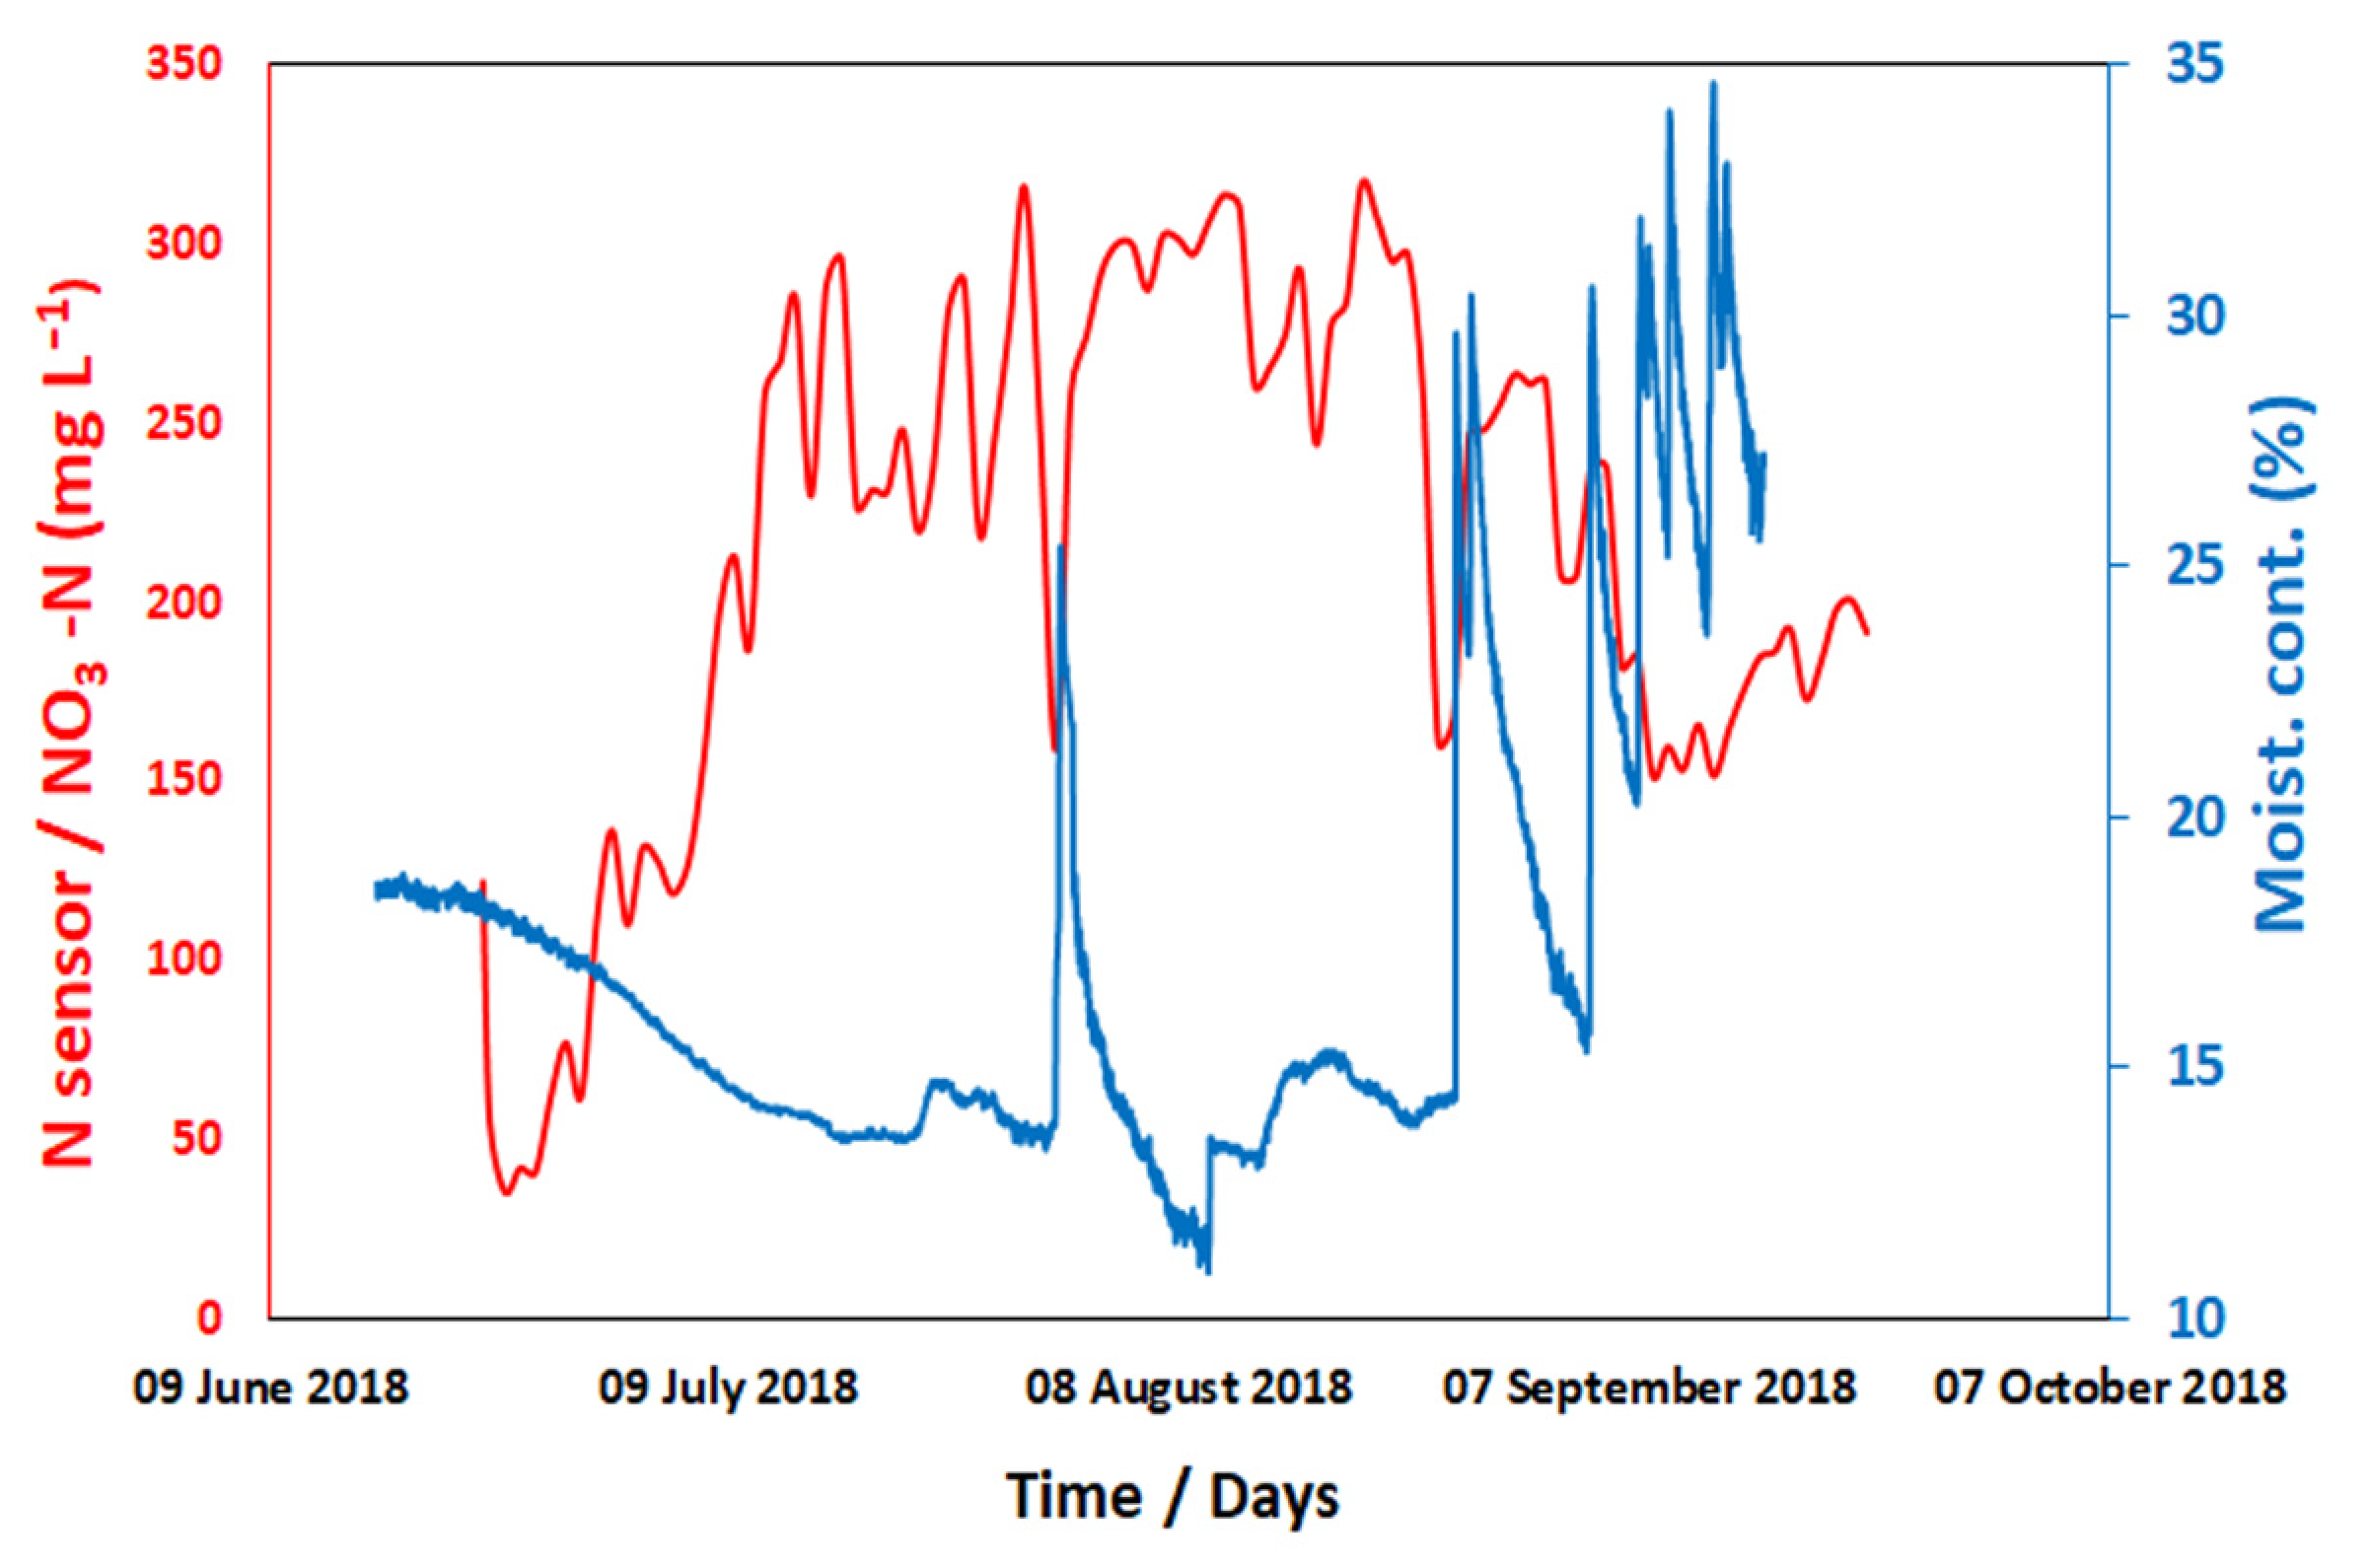
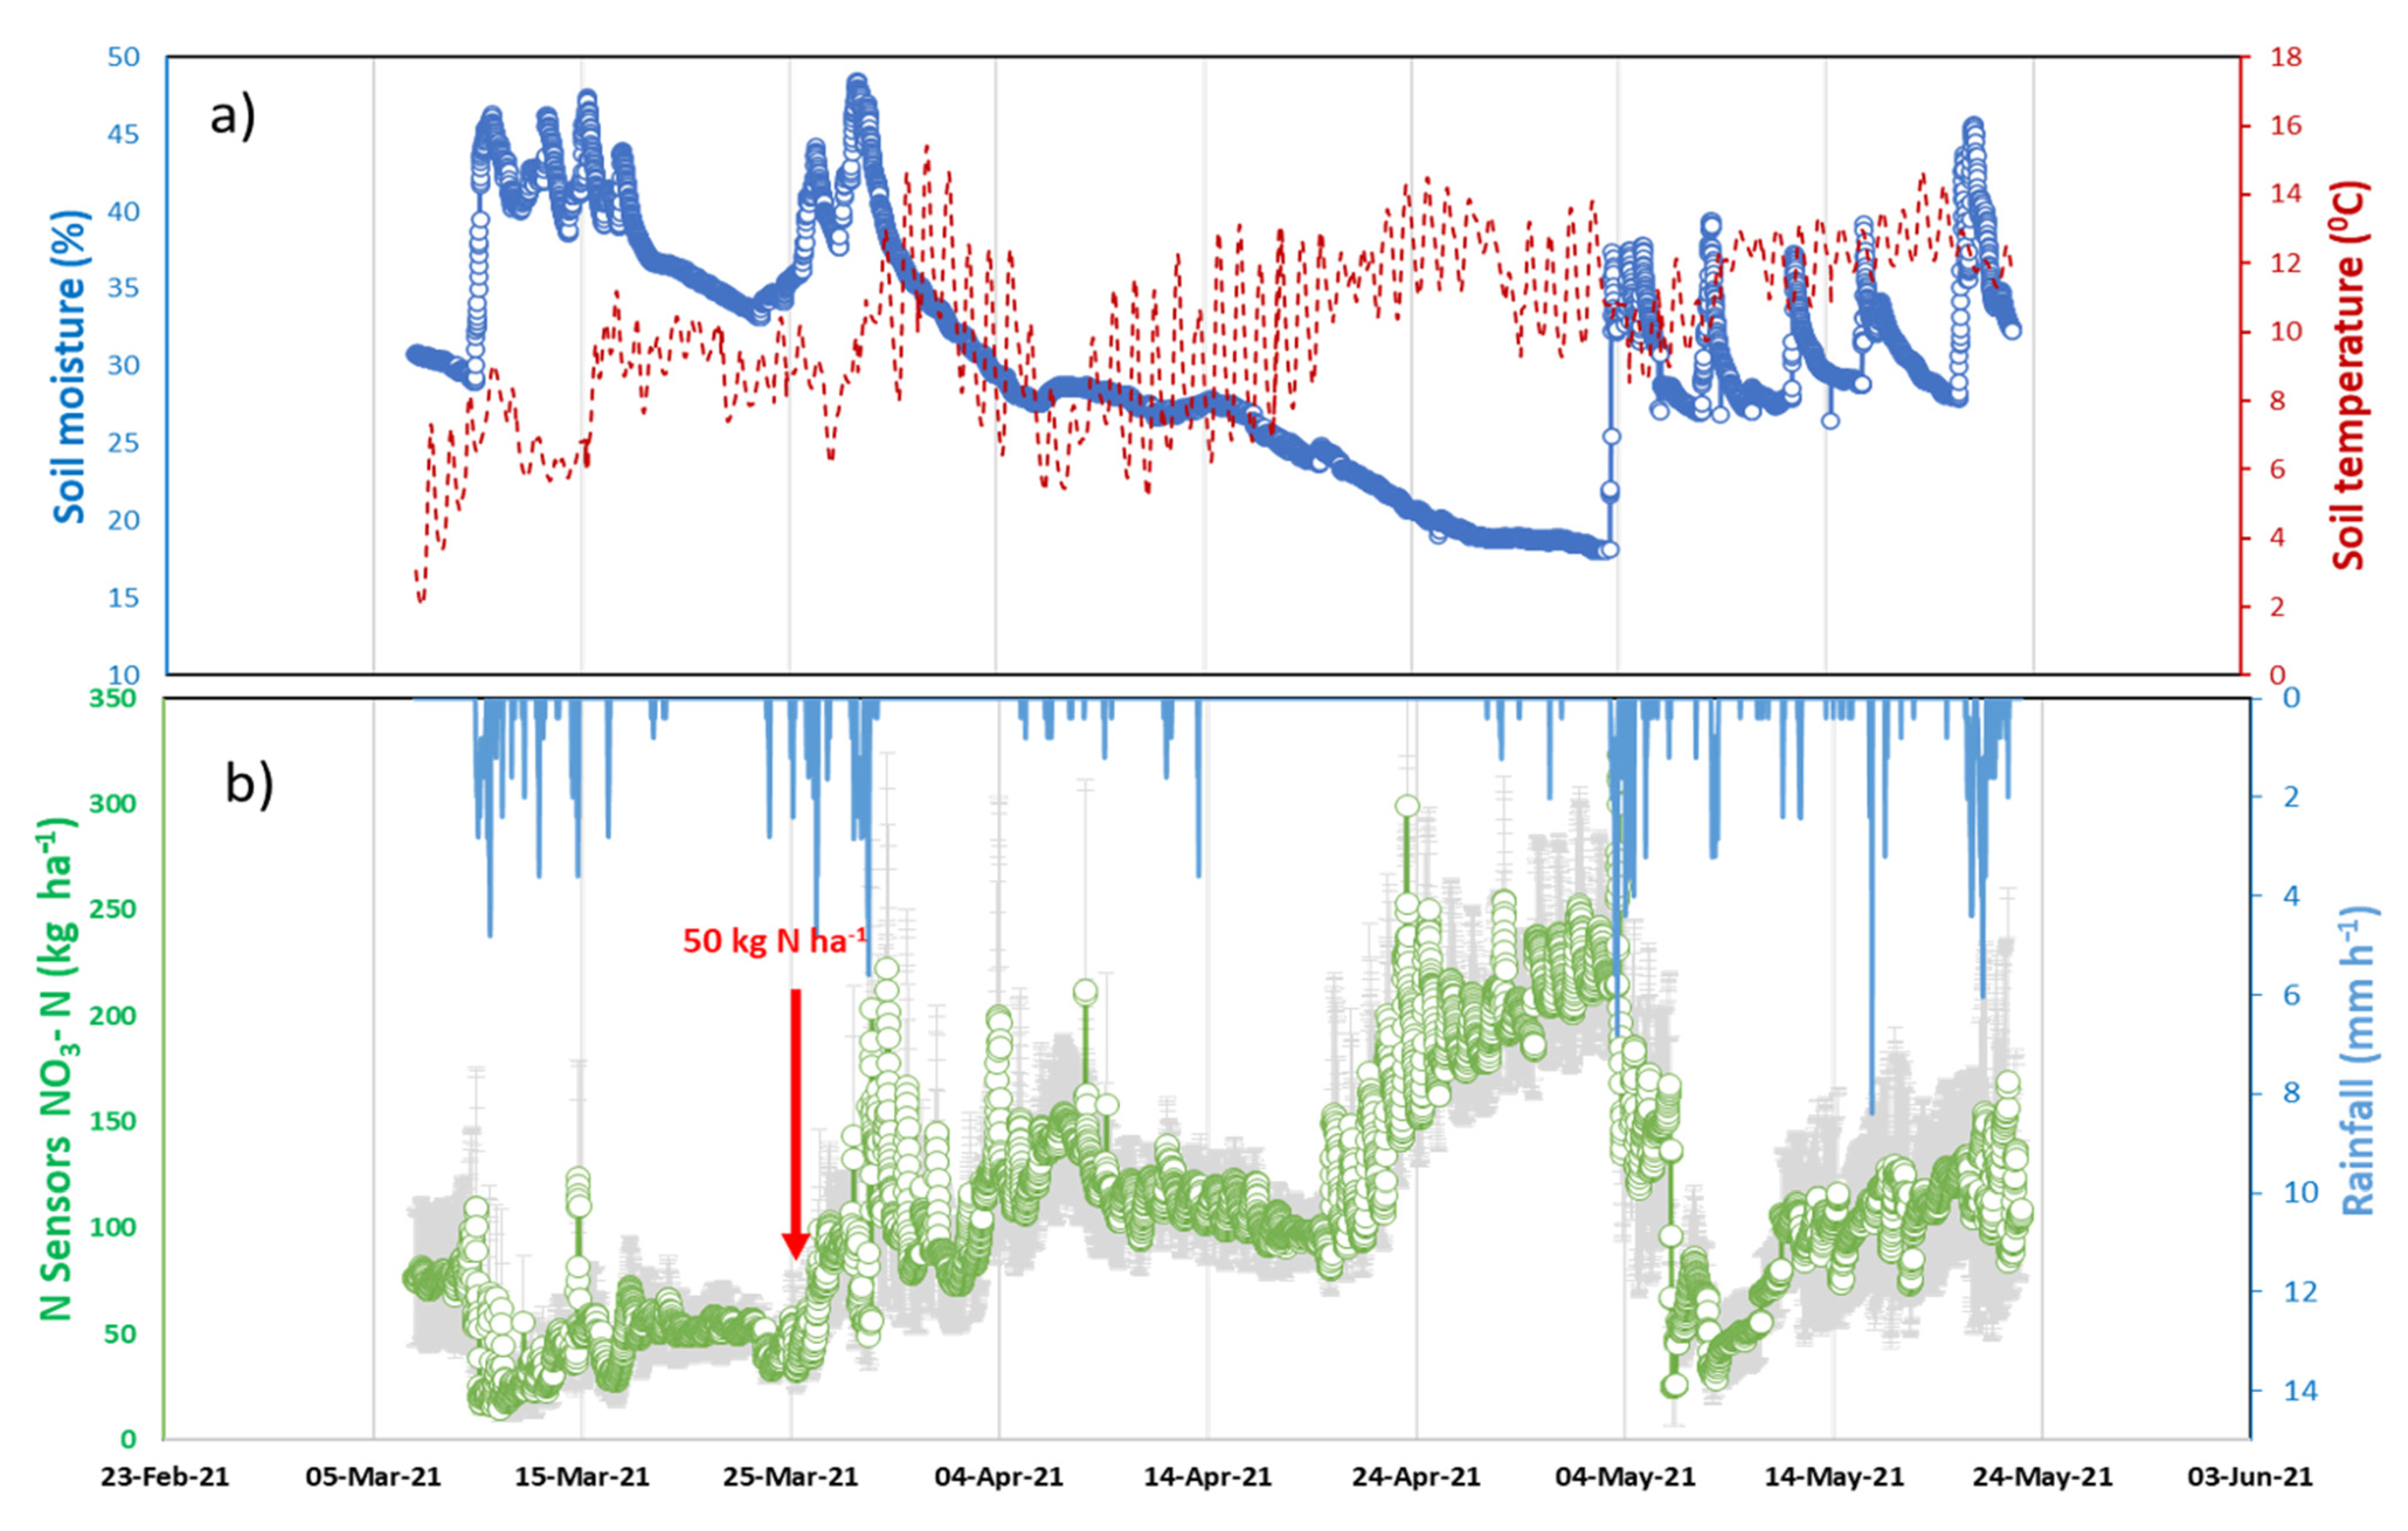
7. Results
8. Discussion
9. Conclusions
Supplementary Materials
Author Contributions
Funding
Institutional Review Board Statement
Data Availability Statement
Conflicts of Interest
References
- Sutton, M.A.; Oenema, O.; Erisman, J.W.; Leip, A.; van Grinsven, H.; Winiwarter, W. Too Much of a Good Thing. Nature 2011, 472, 159–161. [Google Scholar] [CrossRef] [Green Version]
- Cao, Q.; Miao, Y.; Li, F.; Gao, X.; Liu, B.; Lu, D.; Chen, X. Developing a New Crop Circle Active Canopy Sensor-Based Precision Nitrogen Management Strategy for Winter Wheat in North China Plain. Precis. Agric. 2017, 18, 2–18. [Google Scholar] [CrossRef]
- Adamchuk, V.I.; Hummel, J.W.; Morgan, M.T.; Upadhyaya, S.K. On-the-Go Soil Sensors for Precision Agriculture. Comput. Electron. Agric. 2004, 44, 71–91. [Google Scholar] [CrossRef] [Green Version]
- Shankar, T.; Malik, G.C.; Banerjee, M.; Dutta, S.; Praharaj, S.; Lalichetti, S.; Mohanty, S.; Bhattacharyay, D.; Maitra, S.; Gaber, A.; et al. Prediction of the Effect of Nutrients on Plant Parameters of Rice by Artificial Neural Network. Agronomy 2022, 12, 2123. [Google Scholar] [CrossRef]
- Ehsani, M.R.; Upadhyaya, S.K.; Slaughter, D.; Shafii, S.; Pelletier, M. A NIR Technique for Rapid Determination of Soil Mineral Nitrogen. Precis. Agric. 1999, 1, 219–236. [Google Scholar] [CrossRef]
- Zhu, Y.; Chen, Y.; Ali, M.A.; Dong, L.; Wang, X.; Archontoulis, S.V.; Schnable, J.C.; Castellano, M.J. Continuous in Situ Soil Nitrate Sensors: The Importance of High-Resolution Measurements across Time and a Comparison with Salt Extraction-Based Methods. Soil Sci. Soc. Am. J. 2021, 85, 677–690. [Google Scholar] [CrossRef]
- Joly, M.; Marlet, M.; Durieu, C.; Bene, C.; Launay, J.; Temple-Boyer, P. Study of Chemical Field Effect Transistors for the Detection of Ammonium and Nitrate Ions in Liquid and Soil Phases. Sens. Actuators B Chem. 2022, 351, 130949. [Google Scholar] [CrossRef]
- Jiang, H.; Liu, X.; Xu, Y.; Li, Y.; Tong, J.; Bian, C. Rapid Detection System for Soil Nitrate Based on Palladium-Gold Modified Ultramicro Interdigital Electrode Chip. Chin. J. Anal. Chem. 2021, 21, 1342–1349. [Google Scholar]
- Argento, F.; Liebisch, F.; Simmler, M.; Ringger, C.; Hatt, M.; Walter, A.; Anken, T. Linking Soil N Dynamics and Plant N Uptake by Means of Sensor Support. Eur. J. Agron. 2022, 134, 126462. [Google Scholar] [CrossRef]
- Gao, B.; Walhof, A.C.; Laird, D.A.; Toor, F.; Prineas, J.P. Analytical Evaluation of Mobile in Situ Soil Nitrate Infrared Sensor Designs for Precision Agriculture. IEEE Sens. J. 2021, 21, 20200–20209. [Google Scholar] [CrossRef]
- Kuzyakov, Y.; Xu, X. Competition between Roots and Microorganisms for Nitrogen: Mechanisms and Ecological Relevance. New Phytol. 2013, 198, 656–669. [Google Scholar] [CrossRef]
- Abaas, E.; Hill, P.W.; Roberts, P.; Murphy, D.v.; Jones, D.L. Microbial Activity Differentially Regulates the Vertical Mobility of Nitrogen Compounds in Soil. Soil Biol. Biochem. 2012, 53, 120–123. [Google Scholar] [CrossRef]
- Hernández-Morales, C.A.; Luna-Rivera, J.M.; Perez-Jimenez, R. Design and Deployment of a Practical IoT-Based Monitoring System for Protected Cultivations. Comput. Commun. 2022, 186, 51–64. [Google Scholar] [CrossRef]
- Citoni, B.; Fioranelli, F.; Imran, M.A.; Abbasi, Q.H. Internet of Things and LoRaWAN-Enabled Future Smart Farming. IEEE Internet Things Mag. 2020, 2, 14–19. [Google Scholar] [CrossRef] [Green Version]
- Mekki, K.; Bajic, E.; Chaxel, F.; Meyer, F. A Comparative Study of LPWAN Technologies for Large-Scale IoT Deployment. ICT Express 2019, 5, 1–7. [Google Scholar] [CrossRef]
- Valente, A.; Silva, S.; Duarte, D.; Pinto, F.C.; Soares, S. Low-Cost Lorawan Node for Agro-Intelligence Iot. Electronics 2020, 9, 987. [Google Scholar] [CrossRef]
- Jones, D.L.; Chadwick, D.R.; Rengaraj, S.; Di, W.; Williams, A.P.; Hill, P.W.; Miller, A.J.; Lark, R.M.; Rosolem, C.A.; Damin, V.; et al. Can In-Situ Soil Nitrate Measurements Improve Nitrogen-Use Efficiency in Agricultural Systems? In Proceedings of the International Fertiliser Society, Prague, Czech Republic, 8 May 2018. [Google Scholar]
- Ross, J.W. Calcium-Selective Electrode with Liquid Ion Exchanger. Science (1979) 1967, 156, 1378–1379. [Google Scholar] [CrossRef] [PubMed]
- Le Goff, T.; Braven, J.; Ebdon, L.; Scholefield, D. Automatic Continuous River Monitoring of Nitrate Using a Novel Ion-Selective Electrode. J. Environ. Monit. 2003, 5, 353–358. [Google Scholar] [CrossRef]
- Hansen, E.H.; Ghose, A.K.; Ruzicka, J. Flow Injection Analysis of Environmental Samples for Nitrate Using an Ion-Selective Electrode. Analyst 1977, 102, 705–713. [Google Scholar] [CrossRef]
- NICO. Technical Specifications for the Nitrate Ion-Selective Electrode (ELIT 8021); NICO2000 Ltd.: Harrow, Middlesex, UK, 2000. [Google Scholar]
- Vernier Nitrate. Ion-Selective Electrode; Vernier Software & Technology Inc.: Beaverton, OR, USA, 2012. [Google Scholar]
- Adsett, J.F.; Zoerb., G.C. Automated Field Monitoring of Soil Nitrate Levels. In Proceedings of the Proceedings of the ASAE Symposium on Automated Agriculture for the 21st Century, Chicago, IL, USA, 16–17 December 1991; American Society of Agricultural Engineers: St. Joseph, MI, USA; pp. 326–335. [Google Scholar]
- Adsett, J.F.; Thottan, J.A.; Sibley, K.J. Development of an Automated On-the-Go Soil Nitrate Monitoring System. Appl. Eng. Agric. 1999, 15, 351–356. [Google Scholar] [CrossRef]
- Sibley, K.J.; Brewster, G.R.; Astatkie, T.; Adsett, J.F.; Struik, P.C. In-Field Measurement of Soil Nitrate Using an Ion-Selective Electrode. In Advances in Measurement Systems; Sharma, K., Ed.; InTech: Rijeka, Croatia, 2010. [Google Scholar]
- Sibley, K.J.; Astatkie, T.; Brewster, G.; Struik, P.C.; Adsett, J.F.; Pruski, K. Field-Scale Validation of an Automated Soil Nitrate Extraction and Measurement System. Precis. Agric. 2009, 10, 162–174. [Google Scholar] [CrossRef]
- Miller, A.J.; Zhen, R.G. Measurement of Intracellular Nitrate Concentrations in Chara Using Nitrate-Selective Microelectrodes. Planta 1991, 184, 47–52. [Google Scholar] [CrossRef] [PubMed]
- Kim, H.-J.; Hummel, J.W.; Birrell, S.J. Evaluation of Ion-Selective Membranes for Real-Time Soil Nutrient Sensing. In Proceedings of the 2003 ASAE Annual Meeting, Las Vegas, NV, USA, 27–30 July 2003; American Society of Agricultural and Biological Engineers: St. Joseph, MI, USA, 2003; Volume 7. [Google Scholar]
- Hook, P.B.; Burke, I.C. Evaluation of Methods for Estimating Net Nitrogen Mineralization in a Semiarid Grassland. Soil Sci. Soc. Am. J. 1995, 59, 831–837. [Google Scholar] [CrossRef]
- Rousk, J.; Jones, D.L. Loss of Low Molecular Weight Dissolved Organic Carbon (DOC) and Nitrogen (DON) in H2O and 0.5M K2SO4 Soil Extracts. Soil Biol. Biochem. 2010, 42, 2331–2335. [Google Scholar] [CrossRef]
- Jones, D.L.; Shannon, D.; Murphy, D.v.; Farrar, J. Role of Dissolved Organic Nitrogen (DON) in Soil N Cycling in Grassland Soils. Soil Biol. Biochem. 2004, 36, 749–756. [Google Scholar] [CrossRef]
- LoRa Alliance. LoRaWANTM 1.0.3 Specification. 2018. Available online: https://lora-alliance.org/resource_hub/lorawan-specification-v1-0-3/ (accessed on 11 January 2022).
- Microchip Inc. RN2483: Low-Power Long Range LoRa Technology Transceiver Module—Datasheet, DS50002346D. 2019. Available online: http://ww1.microchip.com/downloads/en/DeviceDoc/RN2483-Low-Power-Long-Range-LoRa-Technology-Transceiver-Module-Data-Sheet-DS50002346D.pdf (accessed on 11 January 2022).
- Adelantado, F.; Vilajosana, X.; Tuset-Peiro, P.; Martinez, B.; Melia-Segui, J.; Watteyne, T. Understanding the Limits of LoRaWAN. IEEE Commun. Mag. 2017, 55, 34–40. [Google Scholar] [CrossRef]
- Blenn, N.; Kuipers, F. LoRaWAN in the Wild: Measurements from The Things Network. arXiv 2017, arXiv:1706.03086. [Google Scholar]
- Field Facilities at Henfaes Research Centre. Available online: https://www.bangor.ac.uk/natural-sciences/research/environment-natural-resources-and-geography/facilities/henfaes.php.en (accessed on 31 August 2022).
- Multi-Tech Systems Inc. MultiTech Conduit® IP67 Base Station—Datasheet, 860002223. 2022. Available online: https://www.multitech.com/documents/publications/data-sheets/86002223.pdf (accessed on 11 January 2022).


Publisher’s Note: MDPI stays neutral with regard to jurisdictional claims in published maps and institutional affiliations. |
© 2022 by the authors. Licensee MDPI, Basel, Switzerland. This article is an open access article distributed under the terms and conditions of the Creative Commons Attribution (CC BY) license (https://creativecommons.org/licenses/by/4.0/).
Share and Cite
Bristow, N.; Rengaraj, S.; Chadwick, D.R.; Kettle, J.; Jones, D.L. Development of a LoRaWAN IoT Node with Ion-Selective Electrode Soil Nitrate Sensors for Precision Agriculture. Sensors 2022, 22, 9100. https://doi.org/10.3390/s22239100
Bristow N, Rengaraj S, Chadwick DR, Kettle J, Jones DL. Development of a LoRaWAN IoT Node with Ion-Selective Electrode Soil Nitrate Sensors for Precision Agriculture. Sensors. 2022; 22(23):9100. https://doi.org/10.3390/s22239100
Chicago/Turabian StyleBristow, Noel, Saravanan Rengaraj, David R. Chadwick, Jeff Kettle, and Davey L. Jones. 2022. "Development of a LoRaWAN IoT Node with Ion-Selective Electrode Soil Nitrate Sensors for Precision Agriculture" Sensors 22, no. 23: 9100. https://doi.org/10.3390/s22239100