1. Introduction
In many industries, such as distillery, juice processing, maple and corn syrup production, the outcome always relies on a solution with sugar (sucrose, glucose, fructose, etc.) as the major solute. Similarly, in brewing and wine making, the final fermented product is dependent on the starting sugar content of the must and the way it changes during fermentation. Therefore, it is essential to monitor the sugar content in these industries, preferably in a continuous manner [
1]. Dissolved sugar in beverages is indicated in terms of Brix, Baume, or Oechsle. However, Brix is the commonly used unit in the process industry. It indicates the number of dissolved solids in a liquid measured via its specific gravity (SG) [
2]. One degree Brix is 1 g of sucrose in 100 g of solution (1 °Bx = 1% sugar) [
3]. Brix can be measured using sample-based measurement or in-line measurement. There is a linear relationship between SG and density, hence Brix measurement can be done through one of these two quantities [
4]. SG or density can be measured using various methods, such as hydrometer principle [
5], optical methods based on refractive index [
1] or infrared absorbance, near-infrared spectroscopy, X-ray absorption, ultrasonic method [
6], fibre Bragg grating [
7], mass flow of liquid based on Coriolis principle [
8], differential pressure measurement [
9], or biosensing [
10].
Hydrometer is the most commonly used, hand-held, and economical device to measure SG. However, it includes a manual measurement process that can cause an incorrect reading of the meniscus. In addition, temperature compensation is required in the final reading as its operation is temperature dependent [
11,
12,
13]. These constraints are overcome by a refractometer, which works on the principle of refraction of light. Both analogue and digital versions of refractometer are available but analogue type is generally a cost-effective option. Since analogue refractometers are not very accurate due to subjective reading, digital and benchtop refractometers are the preferred versions in the industry despite being expensive compared to their analogue counterparts [
4]. Electronic tongue is another modern portable and cost-effective solution that provides a quick Brix measurement; however, its low selectivity is a major issue [
14,
15,
16]. Surface plasmon resonance (SPR)-based sensors and chromatography are also among the sample-based methods used for Brix measurement. In summary, sample-based methods are manual, time-consuming, and most importantly cannot be the solution of choice for continuous monitoring [
4].
Several in-line or continuous monitoring Brix sensors have also been developed. Among them, vis/NIR spectroscopy is a widely used method, especially in wineries, as it can allow the additional benefit of composition analysis [
17,
18]. It is possible to monitor the concentration and evolution of phenolic compounds during wine fermentation [
19]. Ultrasonic velocity measurements have also been demonstrated as a successful method for real-time measurement as density and sound velocity relate linearly [
20,
21]. In the ultrasonic method, automation can be easily implemented, leading to a complete analyser [
22]. Measurement of liquid density via the Coriolis principle is another method for in-line real-time monitoring of liquid sugar levels. The liquid is made to pass through oscillating tubes; the mass flow rate of the liquid affects the oscillation of the tubes, and this is used to calculate the liquid density [
23]. However, the applied static pressure causes inaccuracies in measuring the liquid density.
There are commercially available in-line measurement sensors, such as Liquiphant M vibrating fork, Fermetrol probe, Micro-LDS, and Tilt hydrometer [
24]. Liquiphant M vibrating fork utilises the density measurement principle. In Fermetrol probe, a semipermeable water-responsive polymer is used to find out the osmotic potential caused by the concentration of sugar in the must. Micro-LDS is based on the Coriolis effect. However, these methods are expensive solutions normally only suitable for larger industries. Sensor cleaning is another problem during and after fermentation. In biosensors, enzyme stability highly affects parameters such as accuracy, reproducibility, and operational lifetime. Tilt hydrometer is an economical free-floating digital hydrometer. However, it is specifically designed for home brewing and is not suitable for large industries [
4].
In this paper, we present a low-cost liquid Brix measurement sensor based on the differential pressure measurement principle. The sensor is intended for continuous measurement of Brix to monitor processes such as wine fermentation, brewing, etc. The use of differential pressure for level [
9] and density measurement [
25] of liquids is well known, however a systematic design and testing approach has not been demonstrated in relation to the Brix measurements. In the proposed technique, two pressure sensors are applied to measure the differential pressure, which is used to compute specific gravity and then the Brix value of the liquid. The rest of the paper describes the measurement principle, sensor design, experimental setup, and results from the two different experiments.
2. Methodology
2.1. Principle of Measurement
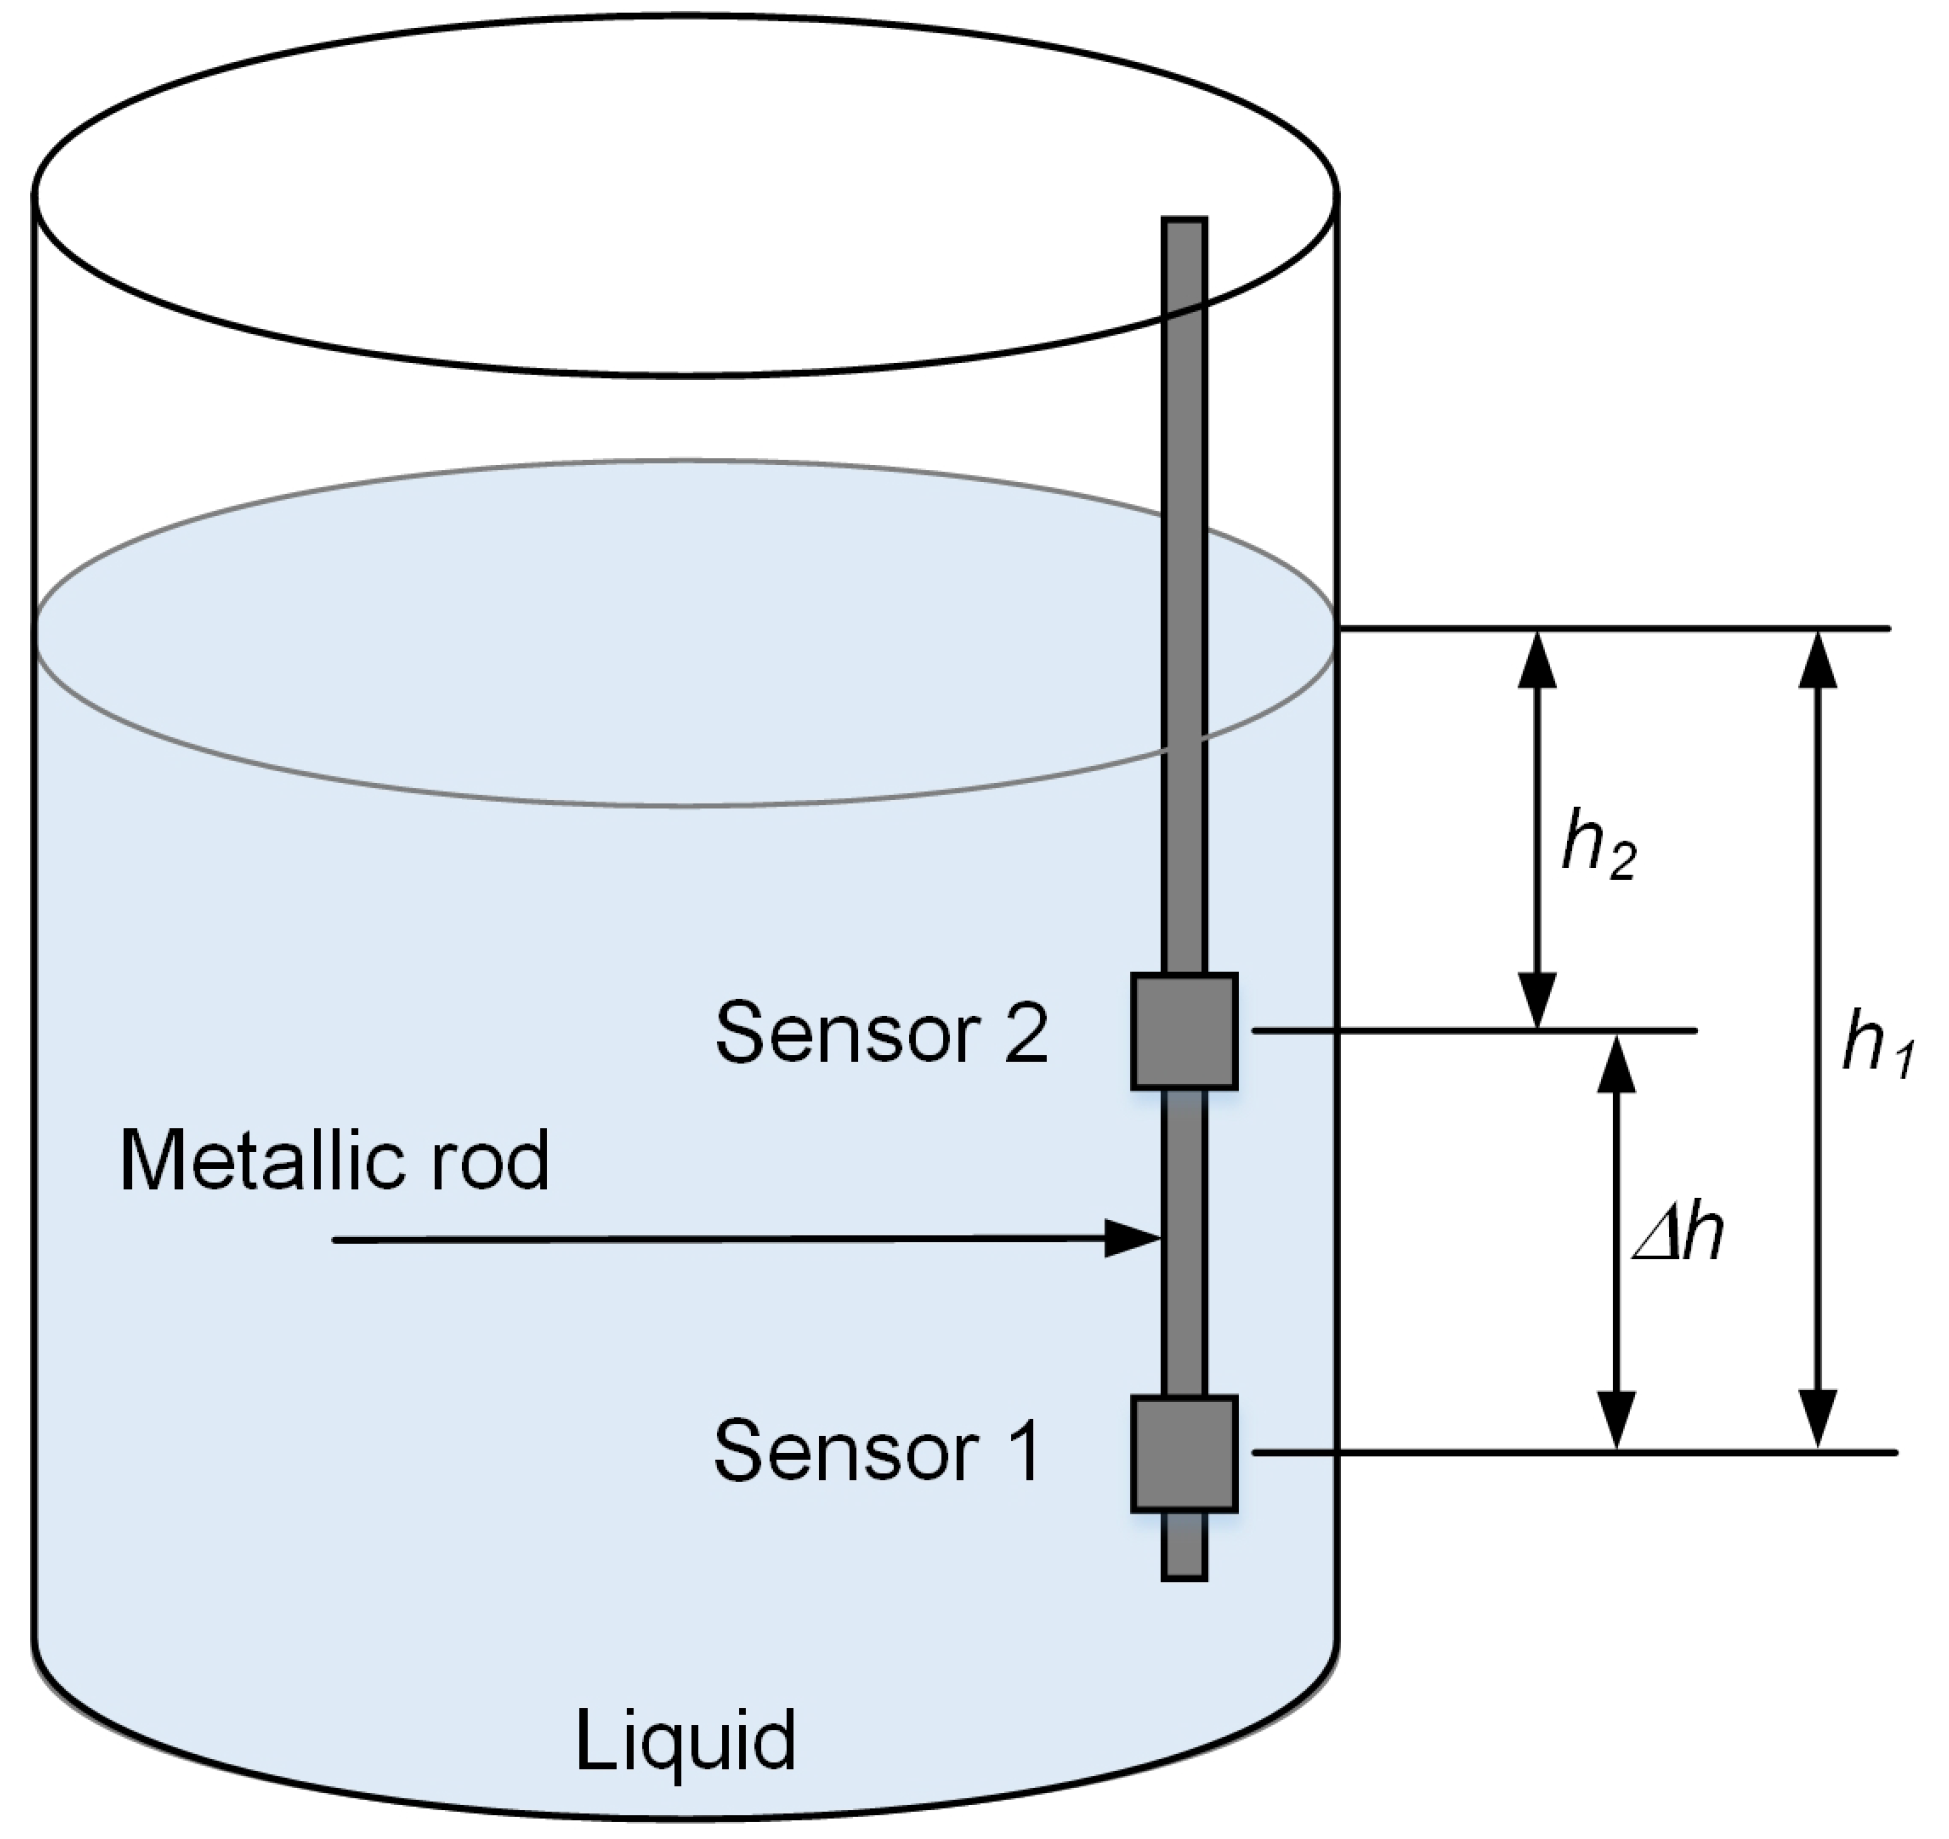
A schematic illustration of the differential pressure measurement in a liquid tank is shown in
Figure 1. The relationship between pressure and density of the liquid is given by
where
P is the pressure,
is the density of the liquid,
g is the acceleration of gravity with a value of 9.8 m/s
2, and
h is is the level of the liquid in the container. Equation (
1) indicates that the pressure at any point inside the liquid is directly proportional to the density of the liquid.
If two pressure sensors are used in the system, as shown in
Figure 1, the pressures measured by the sensors can be represented by
and
where
P1 and
P2 are the pressures measured by sensor 1 and sensor 2, respectively. The depths of sensor 1 and sensor 2 are
h1 and
h2.
The differential pressure between two sensors can be calculated as
where
P denotes the differential pressure, and
h denotes the distance between two sensors. Thus, the density of the liquid can be determined by calculating the differential pressure as
The density value from Equation (
5) is used to calculate the specific gravity of the liquid as follows:
where SG is the specific gravity of the liquid,
is the density of the liquid, and
w is the density of the water, which is 1000 kg/m
3 at 4 °C.
Finally, the following formula is used to calculate the Brix value [
26].
2.2. Pressure Sensor Selection
Pressure sensor selection is the most important step when designing the proposed Brix sensor. The major criteria considered while selecting the pressure sensor are the pressure range, measurement resolution, output interface, and packaging type. The pressure range is dependent upon the depth at which the sensors are immersed in the testing tank. In the process industry, tank height can vary from 1 m up to 5 m. Hence, a pressure sensor with a range of 0 to 25 psi is desired if the sensors are immersed in the tank for the full depth. However, this is not required for Brix measurement as the sugar content is uniform in the whole tank and measurements at any depth are representative of the solution’s Brix value. This means a pressure sensor with a smaller range can be used in the proposed method of measurement.
To obtain the accuracy of ± 0.1 °Bx, the preferred resolution of the pressure sensor needs to be 0.001 psi. This is determined by calculating the pressure at a fixed depth for 0 °Bx and 0.1 °Bx. For example, at 2 m depth, the pressure is 2.8447 psi at 0 °B if the density of the liquid is 1000 g/L and the acceleration of gravity is 9.80665 ms−2. However, at 0.1 °Bx the density changes to 1000.39 g/L, producing a pressure of 2.8458 psi. The difference of pressures (2.8458–2.8447) is 0.0011.
The output interface and packaging type of the pressure sensor are important as they relate to how the sensors are interfaced with the measurement electronics and mounted inside the housing. Sensors with analogue or digital interfaces are available and can be used; however, an analogue sensor requires analogue to digital conversion (ADC) and other signal conditioning for interfacing with a microcontroller. The packaging type can be flush mount or port type, but flush mount is preferred as it is less susceptible to residue build up and clogging. Furthermore, the sensor should be suitable for liquid media and temperature-compensated, with an operating temperature range up to 80 °C.
Table 1 lists the sensors shortlisted according to the selection criteria.
Sensor MPRLS0025PA00001A is a port type sensor with digital output. In real life application, residues/ material can be stuck in the port, which can cause fouling of the sensor, and cleaning of the sensor will become challenging. Some additional packaging may be required to avoid this problem. Hence, preference is given to the TE connectivity sensors. The output of the sensor 86-015G-C is analogue voltage, which requires additional signal conditioning circuitry (e.g., amplification and analogue to digital conversion). On the other hand, 86BSD015PG provides digital output directly in response to the applied pressure. Due to the digital signal output, flush mount, and lower cost compared to 86-015G-C, 86BSD015PG is selected.
2.3. Sensor Design
Figure 2a shows the schematic of the Brix sensor used in the sugar monitoring experiments in the lab. It includes two piezoresistive silicon pressure sensors (86BSD015PG) and a custom-built sensor mount made of aluminium. The distance between the pressure sensors is kept constant at 250 mm, which produces the pressure difference, meeting the resolution requirements. The pressure sensors are placed inside the housings for the sensors, as shown. The data cable of each sensor passes through the hollow rod of the mount and is connected to the microcontroller (see
Figure 3).
Table 2 shows the major technical specifications of the piezoresistive silicon pressure sensor used in the Brix sensor. The pressure sensor provides a 14-bit digital output and is designed for o-ring mounting.
Figure 2b illustrates the schematic of the Brix sensor used in fermentation monitoring. This sensor includes four piezoresistive silicon pressure sensors (86BSD015PG) to allow for the calculation of differential pressure at different inter sensor distances (250 mm, 500 mm, and 750 mm) in the fermentation experiment and to confirm that differential pressure is independent of the distance between the sensors. The material of the sensor mount is stainless steel, which is ideal for food grade applications.
The block diagram of the measuring circuit is shown in
Figure 3a. It includes pressure sensors, an SD card reader, and an Arduino Nano microcontroller board. The pressure sensors output data on I
2C port is directly connected to the I
2C bus of the Arduino board. The SD card is used to store the sensor’s output and it is connected to the SPI bus of the Arduino board.
Figure 3b shows the actual prototype of the board used for the measurements.
The pressure read from the sensors is processed in the microcontroller to calculate the density and Brix value of the liquid. The data is stored on the SD card in the CSV format. The flow chart in
Figure 4 shows the sequence of steps involved in the whole measurement process.
2.4. Linearization
In general, pressure sensors measure stress over a surface area (diaphragm) that is not totally uniform over the measurement range of the sensors and leads to non-linear output. Therefore, least squares regression is selected and implemented in the embedded algorithm to improve the linearity.
To obtain the best fit of the line, the following linear polynomial is used
where
y represents the theoretical value of the sensor,
x is the actual value of the sensor,
a is the gradient, and
b is an intercept of the linear polynomial.
The least squares regression minimizes the error between the each theoretical data and calibration data. Therefore, the partial derivatives of a and b are zero and are expressed as [
9]
and
where
N is the number of points,
,
,
,
.
From the sensors’ actual values, the sensors’ linear polynomials are calculated, as shown in
Table 3.
4. Conclusions
Continuous in-line Brix monitoring is important in many industries, but a suitable and low-cost method does not exist. The available sample-based methods for measuring the liquid Brix value are manual, time-consuming, and most importantly cannot be the solution for continuous monitoring. On the other hand, existing in-line measurement methods are expensive or too cumbersome to use.
The Brix sensor we have presented is based on the measurement of differential pressure in the liquid. The sensor is fully automatic due to the use of an embedded microcontroller. The Brix sensor uses two pressure sensors for differential pressure measurement. Hence, the key element of the Brix sensor is the linearity and accuracy of the pressure sensors. The least-squares regression model is used to provide the linear compensation of the proposed Brix sensor. The experimental results suggest that the SG and Brix measurement in an open tank is feasible and accurate. It is independent of the liquid level in the tank. The linearization caused an improvement in the accuracy of the SG value. The results of the proposed sensor in sugar monitoring experiment are compared with a commercially available Tilt hydrometer. The proposed sensor shows the SG value more accurately than the Tilt hydrometer. The Brix value of the sensor shows some offset that exists due to the offset present in the pressure sensors.
To show the industrial application of the proposed Brix sensor, it was tested in a real fermentation experiment. The sensor successfully monitored the changing levels of Brix over a period of seven days. Multiple pressure sensors were mounted on the mounting rod to study the effect of the distance between the sensors on the resulting Brix values. It was found that the measurements were independent of the distance between the sensors used for the differential pressure calculation.This is significantly important as it allows the proposed sensor to be used as long as it is fully immersed in the liquid.
Problems such as residue build up and sensor failure due to liquid ingress were found and need to be remedied for application of the proposed sensor in actual industrial applications. Nevertheless, the sensor has proven to be a successful design and a low-cost method of monitoring Brix in liquid solutions. We assumed a homogeneous temperature in the experimental tank due to its small size. However, in future, we aim to include the temperature compensation and focus on removing the offset with the help of software algorithms. Additionally, the interface electronics will be modified to include IoT features in the sensor.


