
Remote Heart Rate Prediction in Virtual Reality Head-Mounted Displays Using Machine Learning Techniques

 , , , , ,
  , , , ,
  and
and 
Abstract
1. Introduction
2. Background
2.1. Datasets
2.2. EVM-CNN Technique
2.3. Meta-rPPG Technique
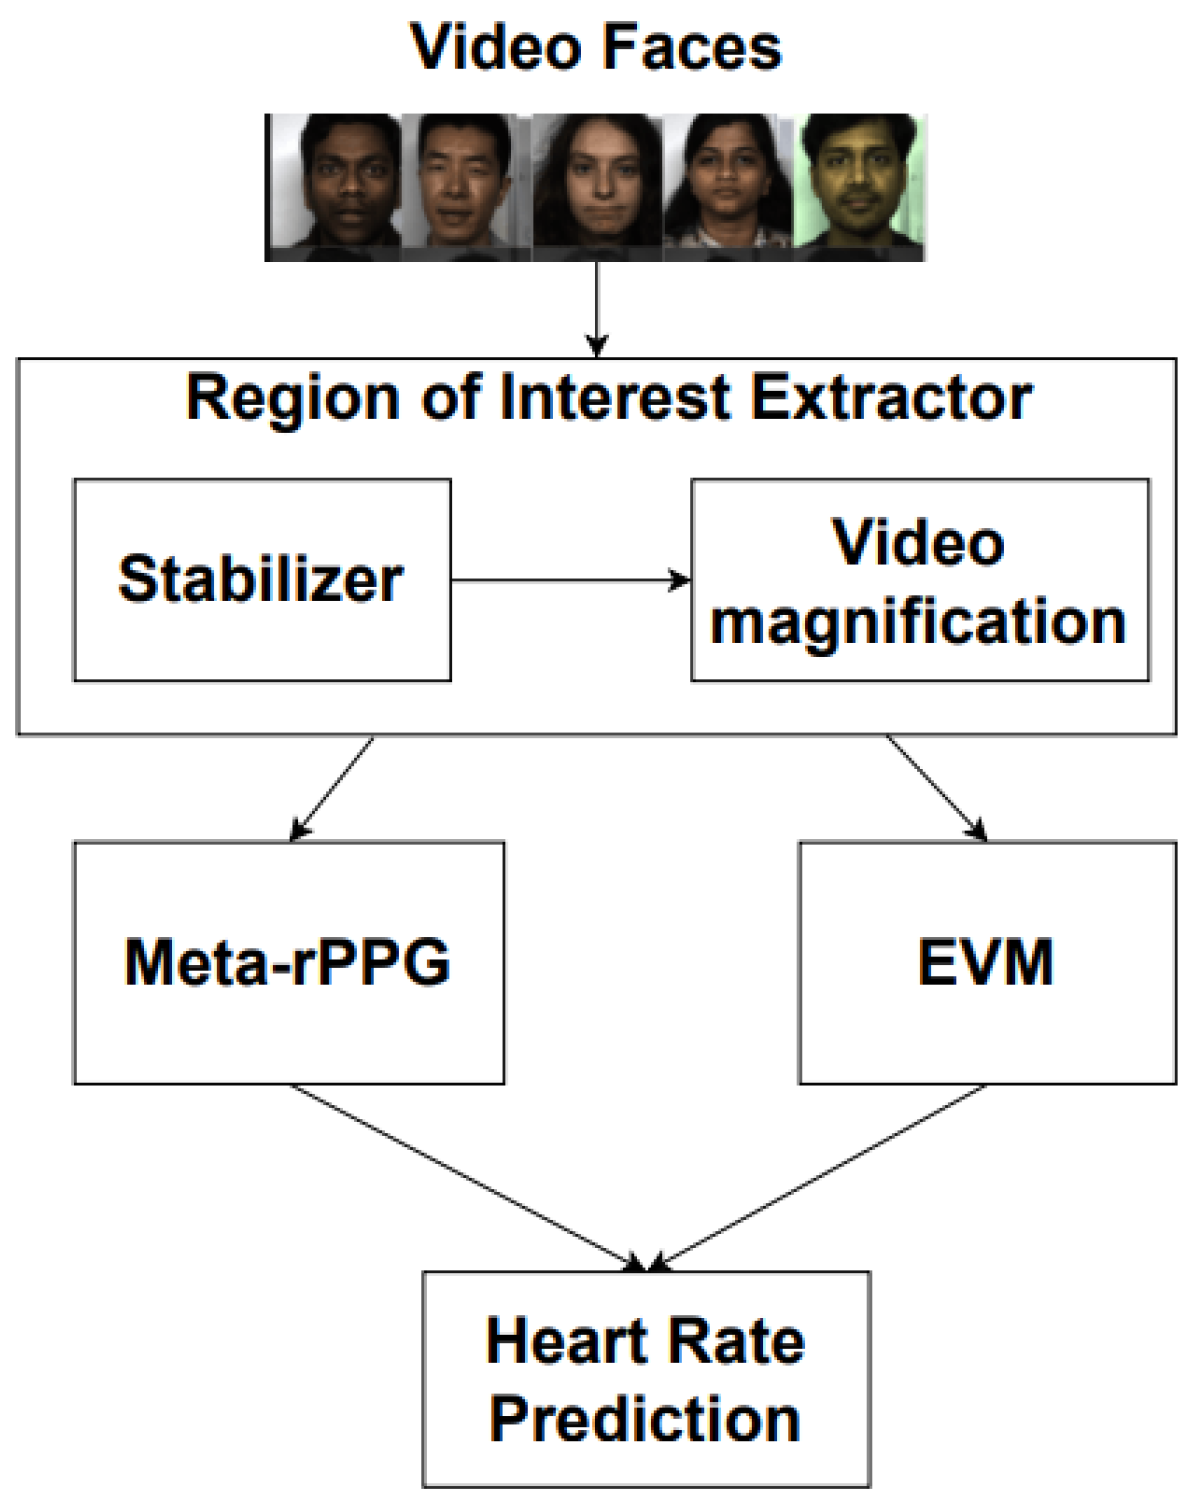
3. Materials and Methods
3.1. Region of Interest Extractor
3.2. Adaptation of Techniques from Related Work to Work with the Regions of Interest
4. Results and Discussions
4.1. Region of Interest Extractor
4.2. Adaptation of State-of-the-Art Techniques
5. Conclusions
Author Contributions
Funding
Acknowledgments
Conflicts of Interest
Abbreviations
| ML | Machine Learning |
| HMD | Head-Mounted Display |
| ROI | Region of Interest |
| FFT | Fast Fourier Transform |
| CNN | Convolutional Neural Network |
| RMSE | Root Mean Square Error |
| MAPE | Mean Absolute Percentage Error |
| LSTM | Long Short-Term Memory |
| SVM | Support Vector Machine |
| BPM | Beat Per Minute |
| PPG | PhotoPlethysmoGraphy |
| rPPG | Remote PhotoPlethysmoGraphy |
| EVM | Eulerian Video Magnification |
| ME | Mean Error |
| SD | Standard Deviation |
| Pearson’s correlation |
References
- Rahman, H.; Ahmed, M.U.; Barua, S.; Begum, S. Non-contact-based driver’s cognitive load classification using physiological and vehicular parameters. Biomed. Signal Process. Control 2020, 55, 101634. [Google Scholar] [CrossRef]
- Schneider, C.; Hanakam, F.; Wiewelhove, T.; Döweling, A.; Kellmann, M.; Meyer, T.; Pfeiffer, M.; Ferrauti, A. Heart rate monitoring in team sports—A conceptual framework for contextualizing heart rate measures for training and recovery prescription. Front. Physiol. 2018, 9, 639. [Google Scholar] [CrossRef] [PubMed]
- Sharma, R.; Goel, D.; Srivastav, M.; Dhasmana, R. Differences in Heart Rate and Galvanic Skin Response among Nurses Working in Critical and Non-Critical Care Units. J. Clin. Diagn. Res. 2018, 12, 9–12. [Google Scholar] [CrossRef]
- Bertilsson, J.; Niehorster, D.C.; Fredriksson, P.; Dahl, M.; Granér, S.; Fredriksson, O.; Mårtensson, J.; Magnusson, M.; Fransson, P.A.; Nyström, M. Towards systematic and objective evaluation of police officer performance in stressful situations. Police Pract. Res. 2020, 21, 655–669. [Google Scholar] [CrossRef]
- Siddharth, S.; Trivedi, M.M. On Assessing Driver Awareness of Situational Criticalities: Multi-modal Bio-Sensing and Vision-Based Analysis, Evaluations, and Insights. Brain Sci. 2020, 10, 46. [Google Scholar] [CrossRef]
- Yu, W.; Ding, S.; Yue, Z.; Yang, S. Emotion Recognition from Facial Expressions and Contactless Heart Rate Using Knowledge Graph. In Proceedings of the 2020 IEEE International Conference on Knowledge Graph (ICKG), Nanjing, China, 9–11 August 2020; pp. 64–69. [Google Scholar] [CrossRef]
- Young, H.A.; Benton, D. Heart-rate variability: A biomarker to study the influence of nutrition on physiological and psychological health? Behav. Pharmacol. 2018, 29, 140. [Google Scholar] [CrossRef]
- Colasante, T.; Malti, T. Resting heart rate, guilt, and sympathy: A developmental psychophysiological study of physical aggression. Psychophysiology 2017, 54, 1770–1781. [Google Scholar]
- Huang, B.; Chang, C.M.; Lin, C.L.; Chen, W.; Juang, C.F.; Wu, X. Visual Heart Rate Estimation from Facial Video Based on CNN. In Proceedings of the 2020 15th IEEE Conference on Industrial Electronics and Applications (ICIEA), Virtual, 9–13 November 2020; pp. 1658–1662. [Google Scholar]
- Hsu, G.; Ambikapathi, A.; Chen, M. Deep learning with time-frequency representation for pulse estimation from facial videos. In Proceedings of the 2017 IEEE International Joint Conference on Biometrics (IJCB), Denver, CO, USA, 1–4 October 2017; pp. 383–389. [Google Scholar] [CrossRef]
- Hsu, G.S.J.; Xie, R.C.; Ambikapathi, A.; Chou, K.J. A deep learning framework for heart rate estimation from facial videos. Neurocomputing 2020, 417, 155–166. [Google Scholar] [CrossRef]
- Allen, J. Photoplethysmography and its application in clinical physiological measurement. Physiol. Meas. 2007, 28, R1–R39. [Google Scholar] [CrossRef]
- Du, G.; Long, S.; Yuan, H. Non-Contact Emotion Recognition Combining Heart Rate and Facial Expression for Interactive Gaming Environments. IEEE Access 2020, 8, 11896–11906. [Google Scholar] [CrossRef]
- Szankin, M.; Kwasniewska, A.; Sirlapu, T.; Wang, M.; Ruminski, J.; Nicolas, R.; Bartscherer, M. Long Distance Vital Signs Monitoring with Person Identification for Smart Home Solutions. In Proceedings of the 2018 40th Annual International Conference of the IEEE Engineering in Medicine and Biology Society (EMBC), Honolulu, HI, USA, 18–21 July 2018; Volume 2018, pp. 1558–1561. [Google Scholar] [CrossRef]
- Song, R.; Zhang, S.; Li, C.; Zhang, Y.; Cheng, J.; Chen, X. Heart rate estimation from facial videos using a spatiotemporal representation with convolutional neural networks. IEEE Trans. Instrum. Meas. 2020, 69, 7411–7421. [Google Scholar] [CrossRef]
- Martis, R.J.; Acharya, U.R.; Adeli, H. Current methods in electrocardiogram characterization. Comput. Biol. Med. 2014, 48, 133–149. [Google Scholar] [CrossRef] [PubMed]
- Scherpf, M.; Ernst, H.; Malberg, H.; Schmidt, M. DeepPerfusion: Camera-based Blood Volume Pulse Extraction Using a 3D Convolutional Neural Network. In Proceedings of the 2020 Computing in Cardiology, Rimini, Italy, 13–16 September 2020; pp. 1–4. [Google Scholar] [CrossRef]
- Pagano, T.P.; Santos, V.R.; Bonfim, Y.d.S.; Paranhos, J.V.D.; Ortega, L.L.; Sá, P.H.M.; Nascimento, L.F.S.; Winkler, I.; Nascimento, E.G.S. Machine Learning Models and Videos of Facial Regions for Estimating Heart Rate: A Review on Patents, Datasets, and Literature. Electronics 2022, 11, 1473. [Google Scholar] [CrossRef]
- Wang, C.; Pun, T.; Chanel, G. A Comparative Survey of Methods for Remote Heart Rate Detection from Frontal Face Videos. Front. Bioeng. Biotechnol. 2018, 6, 33. [Google Scholar] [CrossRef] [PubMed]
- Goodfellow, I.; Bengio, Y.; Courville, A.; Bengio, Y. Deep Learning; MIT Press: Cambridge, MA, USA, 2016; Volume 1. [Google Scholar]
- Lampropoulos, G.; Keramopoulos, E.; Diamantaras, K. Enhancing the functionality of augmented reality using deep learning, semantic web and knowledge graphs: A review. Vis. Inform. 2020, 4, 32–42. [Google Scholar] [CrossRef]
- Hung, T.N.K.; Le, N.Q.K.; Le, N.H.; Van Tuan, L.; Nguyen, T.P.; Thi, C.; Kang, J.H. An AI-based Prediction Model for Drug-drug Interactions in Osteoporosis and Paget’s Diseases from SMILES. Mol. Inform. 2022, 41, 2100264. [Google Scholar] [CrossRef] [PubMed]
- Lam, L.H.T.; Do, D.T.; Diep, D.T.N.; Nguyet, D.L.N.; Truong, Q.D.; Tri, T.T.; Thanh, H.N.; Le, N.Q.K. Molecular subtype classification of low-grade gliomas using magnetic resonance imaging-based radiomics and machine learning. NMR Biomed. 2022, 35, e4792. [Google Scholar] [CrossRef]
- Furtado, A.; Andrade, L.; Frias, D.; Maia, T.; Badaró, R.; Nascimento, E.G.S. Deep Learning Applied to Chest Radiograph Classification—A COVID-19 Pneumonia Experience. Appl. Sci. 2022, 12, 3712. [Google Scholar] [CrossRef]
- Furtado, A.; da Purificação, C.A.C.; Badaró, R.; Nascimento, E.G.S. A Light Deep Learning Algorithm for CT Diagnosis of COVID-19 Pneumonia. Diagnostics 2022, 12, 1527. [Google Scholar] [CrossRef]
- Qiu, Y.; Liu, Y.; Arteaga-Falconi, J.; Dong, H.; Saddik, A.E. EVM-CNN: Real-Time Contactless Heart Rate Estimation from Facial Video. IEEE Trans. Multimed. 2019, 21, 1778–1787. [Google Scholar] [CrossRef]
- Lee, E.; Chen, E.; Lee, C.Y. Meta-rPPG: Remote Heart Rate Estimation Using a Transductive Meta-Learner. In Proceedings of the European Conference on Computer Vision (ECCV), Glasgow, UK, 23–28 August 2020. [Google Scholar]
- Pagano, T.P.; Santos, V.R.; Bonfim, Y.d.S.; Paranhos, J.V.D.; Ortega, L.L.; Sá, P.H.M.; Nascimento, L.F.S.; Winkler, I.; Nascimento, E.G.S. Remote Heart Machine Learning. 2021. Available online: https://github.com/CRIA-CIMATEC/hpvialab/tree/main/remote-heart-machine-learning (accessed on 26 October 2022).
- Nowara, E.M.; Marks, T.K.; Mansour, H.; Veeraraghavan, A. Near-Infrared Imaging Photoplethysmography during Driving. IEEE Trans. Intell. Transp. Syst. 2020, 23, 3589–3600. [Google Scholar] [CrossRef]
- Bobbia, S.; Macwan, R.; Benezeth, Y.; Mansouri, A.; Dubois, J. Unsupervised skin tissue segmentation for remote photoplethysmography. Pattern Recognit. Lett. 2019, 124, 82–90. [Google Scholar] [CrossRef]
- Oh, T.H.; Jaroensri, R.; Kim, C.; Elgharib, M.; Durand, F.; Freeman, W.T.; Matusik, W. Learning-Based Video Motion Magnification. In Proceedings of the Computer Vision—ECCV 2018; Ferrari, V., Hebert, M., Sminchisescu, C., Weiss, Y., Eds.; Springer International Publishing: Cham, Switzerland, 2018; pp. 663–679. [Google Scholar]
- Montero, A.S.; Lang, J.; Laganière, R. Scalable Kernel Correlation Filter with Sparse Feature Integration. In Proceedings of the 2015 IEEE International Conference on Computer Vision Workshop (ICCVW), Santiago, Chile, 7–13 December 2015; pp. 587–594. [Google Scholar] [CrossRef]


| Input Size | Type/Stride | Filter Shape |
|---|---|---|
| 25 × 25 × 3 | Conv/s1 | 5 × 5 × 3 × 96 |
| 23 × 23 × 96 | DwConv/s1 | 3 × 3 × 96 dw |
| 21 × 21 × 96 | PwConv/s1 | 1 × 1 × 96 × 96 |
| 21 × 21 × 96 | DwConv/s2 | 3 × 3 × 96 dw |
| 11 × 11 × 96 | PwConv/s1 | 1 × 1 × 96 × 96 |
| 11 × 11 × 96 | DwConv/s2 | 3 × 3 × 96 dw |
| 6 × 6 × 96 | PwConv/s1 | 1 × 1 × 96 × 128 |
| 6 × 6 × 128 | DwConv/s2 | 3 × 3 × 128 dw |
| 3 × 3 × 128 | PwConv/s1 | 1 × 1 × 128 × 128 |
| 3 × 3 × 128 | DwConv/s2 | 3 × 3 × 128 dw |
| 2 × 2 × 128 | PwConv/s1 | 1 × 1 × 128 × 128 |
| 2 × 2 × 128 | AvePool/s1 | Pool 2 × 2 |
| 1 × 1 × 192 | FC/s1 | 128 × 192 |
| 1 × 1 × 192 | Dropout/s1 | ratio 0.6 |
| 1 × 1 × 192 | FC/s1 | 192 × 1 |
| 1 × 1 × 1 | Eu/s1 | Regression |
| Module | Layer | Output Size | Kernel Size | Spatial | Temporal |
|---|---|---|---|---|---|
| Convolutional Encoder | Conv2DBlock | 60 × 32 × 32 × 32 | 3 × 3 | ✓ | |
| Conv2DBlock | 60 × 48 × 16 × 16 | 3 × 3 | ✓ | ||
| Conv2DBlock | 60 × 64 × 8 × 8 | 3 × 3 | ✓ | ||
| Conv2DBlock | 60 × 80 × 4 × 4 | 3 × 3 | ✓ | ||
| Conv2DBlock | 60 × 120 × 2 × 2 | 3 × 3 | ✓ | ||
| AvgPool | 60 × 120 | 2 × 2 | ✓ | ||
| rPPG Estimator | Bidirectional LSTM | 60 × 120 | - | ✓ | ✓ |
| Linear | 60 × 80 | - | ✓ | ||
| Ordinal | 60 × 40 | - | ✓ | ||
| Synthetic Gradient Generator | Conv1DBlock | 40 × 120 | 3 × 3 | ✓ | ✓ |
| Conv1DBlock | 20 × 120 | 3 × 3 | ✓ | ✓ | |
| Conv1DBlock | 40 × 120 | 3 × 3 | ✓ | ✓ | |
| Conv1DBlock | 60 × 120 | 3 × 3 | ✓ | ✓ |
| Technique | Dataset | ME | Standard Dev. | RMSE | MAPE | |
|---|---|---|---|---|---|---|
| EVM | MR-NIRP-INDOOR | −8.96 | 1.98 | 9.68 | 11.46 | 0.34 |
| EVM | UBFC-rPPG | 2.63 | 8.16 | 15.26 | 14.28 | 0.18 |
| EVM with PPG | UBFC-rPPG | 8.16 | 9.12 | 11.14 | 9.74 | 0.52 |
| Technique | Dataset | ME | Standard Dev. | RMSE | MAPE | |
|---|---|---|---|---|---|---|
| Meta-rPPG | MR-NIRP-INDOOR | 196.81 | 97.16 | 228.69 | 406.01 | −0.14 |
| Meta-rPPG | UBFC-rPPG | 8.93 | 9.34 | 12.35 | 9.56 | 0.59 |
| Meta-rPPG scalable | UBFC-rPPG | 0.26 | 4.49 | 1.7 | 1.13 | 0.92 |
| Meta-rPPG scalable | UBFC-rPPG VM | 18.55 | 13.67 | 23.23 | 21.54 | 0.35 |
| Meta-rPPG scalable | UBFC-rPPG SVM | 7.38 | 8.9 | 11.22 | 9.29 | 0.37 |
| Meta-rPPG scalable | UBFC-rPPG GrayScale | 27.65 | 12.75 | 30.48 | 30.97 | 0.74 |
| Technique | Dataset | Standard Dev. | MAE | RMSE | |
|---|---|---|---|---|---|
| Meta-rPPG (inductive) | UBFC-rPPG | 14.17 | 13.23 | 14.63 | 0.35 |
| Meta-rPPG (proto only) | UBFC-rPPG | 9.17 | 7.82 | 9.37 | 0.48 |
| Meta-rPPG (synth only) | UBFC-rPPG | 11.92 | 9.11 | 11.55 | 0.42 |
| Meta-rPPG (proto+synth) | UBFC-rPPG | 7.12 | 5.97 | 7.42 | 0.53 |
Publisher’s Note: MDPI stays neutral with regard to jurisdictional claims in published maps and institutional affiliations. |
© 2022 by the authors. Licensee MDPI, Basel, Switzerland. This article is an open access article distributed under the terms and conditions of the Creative Commons Attribution (CC BY) license (https://creativecommons.org/licenses/by/4.0/).
Share and Cite
Pagano, T.P.; dos Santos, L.L.; Santos, V.R.; Sá, P.H.M.; Bonfim, Y.d.S.; Paranhos, J.V.D.; Ortega, L.L.; Nascimento, L.F.S.; Santos, A.; Rönnau, M.M.; et al. Remote Heart Rate Prediction in Virtual Reality Head-Mounted Displays Using Machine Learning Techniques. Sensors 2022, 22, 9486. https://doi.org/10.3390/s22239486
Pagano TP, dos Santos LL, Santos VR, Sá PHM, Bonfim YdS, Paranhos JVD, Ortega LL, Nascimento LFS, Santos A, Rönnau MM, et al. Remote Heart Rate Prediction in Virtual Reality Head-Mounted Displays Using Machine Learning Techniques. Sensors. 2022; 22(23):9486. https://doi.org/10.3390/s22239486
Chicago/Turabian StylePagano, Tiago Palma, Lucas Lisboa dos Santos, Victor Rocha Santos, Paulo H. Miranda Sá, Yasmin da Silva Bonfim, José Vinicius Dantas Paranhos, Lucas Lemos Ortega, Lian F. Santana Nascimento, Alexandre Santos, Maikel Maciel Rönnau, and et al. 2022. "Remote Heart Rate Prediction in Virtual Reality Head-Mounted Displays Using Machine Learning Techniques" Sensors 22, no. 23: 9486. https://doi.org/10.3390/s22239486
APA StylePagano, T. P., dos Santos, L. L., Santos, V. R., Sá, P. H. M., Bonfim, Y. d. S., Paranhos, J. V. D., Ortega, L. L., Nascimento, L. F. S., Santos, A., Rönnau, M. M., Winkler, I., & Nascimento, E. G. S. (2022). Remote Heart Rate Prediction in Virtual Reality Head-Mounted Displays Using Machine Learning Techniques. Sensors, 22(23), 9486. https://doi.org/10.3390/s22239486