
Development of Impurity-Detection System for Tracked Rice Combine Harvester Based on DEM and Mask R-CNN

Abstract
:1. Introduction
2. Materials and Methods
2.1. Impurity-Detection Method for Rice Combine Harvester
2.2. Structure Analysis of Infusion-Type Sampling Device
2.2.1. Light Irradiation
2.2.2. Light Irradiation
2.2.3. The Gap between the Deflector and the Conveyor Belt
2.3. Grain Transport Analysis Based on DEM
2.3.1. DEM Model
2.3.2. Simulation Design and Validation
2.4. Impurity Recognition Algorithm Based on Mask R-CNN
2.4.1. Overall Methodology
2.4.2. Image Annotation and Dataset Production
2.4.3. Impurity Feature Extraction Network
2.4.4. Generation of RoIs and RoIAlign
2.4.5. Target Detection and Instance Segmentation
2.4.6. Precision and Recall
2.5. Impurity Rate Transformation Model
2.6. Bench Test
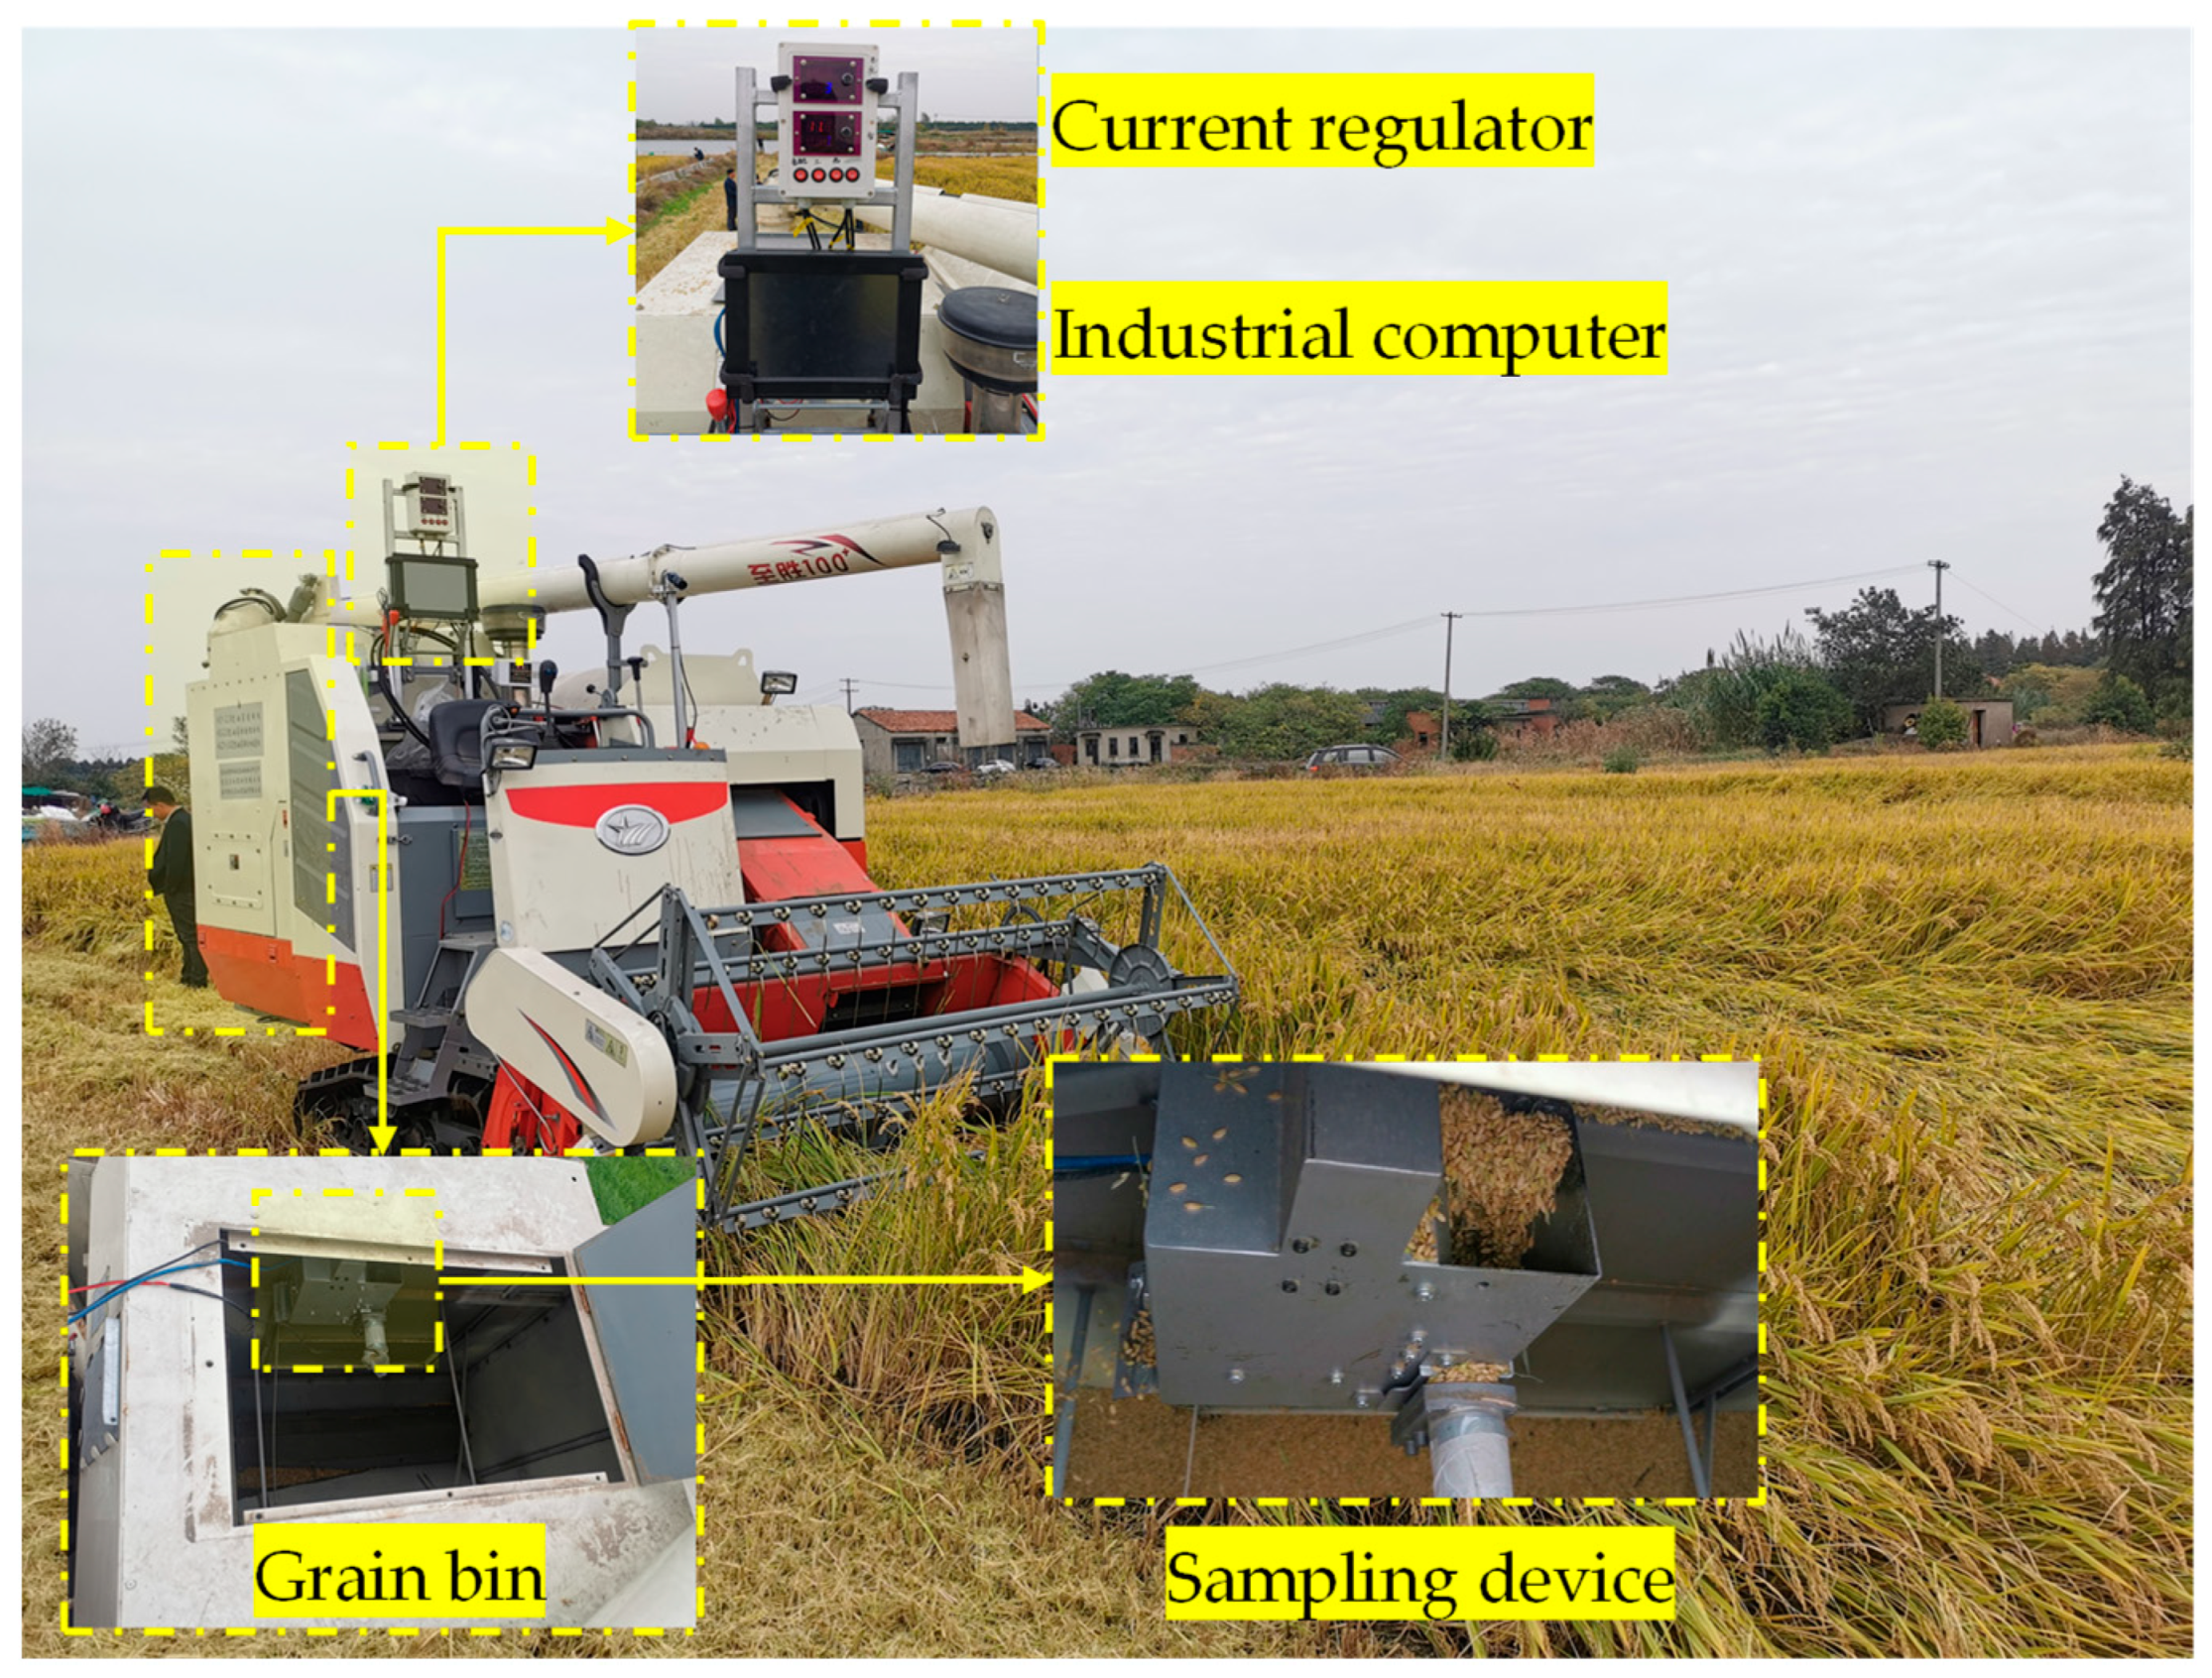
2.7. Field Test
3. Result and Discussion
3.1. Effect of Light Irradiation
3.2. Effect of the Deflector Gap
3.2.1. Effect on Impurity Visualization
3.2.2. Effect on the Grain Distribution
3.2.3. Effect on the Grain Mass Flow Rate
3.2.4. Simulation Validation
3.3. Impurity Segmentation
3.4. Pixel Density Calibration
3.5. Bench Test
3.6. Field Test
4. Conclusions
- (1)
- To reduce the obstruction of impurity, an infusion-type sampling device was developed. The image lightness distribution under different light irradiations was investigated. The results show that the image under the central-ring LED had the smallest most uniform brightness distribution and is the superior light source. The variation coefficient of brightness was 0.271. According to the DEM simulation of the grain transportation process, the effect of the deflector gap on impurity visualization, grain passibility, and mass flow rate was analyzed. The deflector gap is determined to be 12.5~15.0 mm, which reduces the impurity obscuration and ensures the passibility of the grain.
- (2)
- To overcome the misidentification caused by color and morphology proximity, the impurity recognition algorithm based on Mask R-CNN was proposed. The test set experiment showed that the precision rate, recall rate, average precision, and comprehensive evaluation indicator were 92.49%, 88.63%, 81.47%, and 90.52%. The pixel densities of rice and impurities were obtained by calibration tests and least-squares fitting. The fitting equation R-square for rice and impurity was 0.9949 and 0.8604, respectively. The correction factor of impurity rate was used to correct pixel density variation caused by variety and moisture content.
- (3)
- The bench test results show that the designed system has a good detection accuracy of 91.15~97.26% for the five varieties. The results’ relative error was in a range of 5.71~11.72% between the impurity-detection system and manual method in field conditions.
Author Contributions
Funding
Institutional Review Board Statement
Informed Consent Statement
Data Availability Statement
Acknowledgments
Conflicts of Interest
References
- Qiu, Z.M.; Shi, G.X.; Zhao, B.; Jin, X.; Zhou, L.M. Combine harvester remote monitoring system based on multi-source information fusion. Comput. Electron. Agric. 2021, 194, 106771. [Google Scholar] [CrossRef]
- Chai, X.Y.; Xu, L.Z.; Sun, Y.X.; Liang, Z.W.; Lu, E.; Li, Y.M. Development of a cleaning fan for a rice combine harvester using computational fluid dynamics and response surface methodology to optimise outlet airflow distribution. Biosyst. Eng. 2020, 192, 232–244. [Google Scholar]
- Wei, C.C.; Xu, L.Z.; Wang, J.T.; Li, Y.M. Inertial force balance and ADAMS simulation of the oscillating sieve and return pan of a rice combine harvester. Int. J. Agric. Biol. Eng. 2018, 11, 129–137. [Google Scholar] [CrossRef]
- Li, Q.L.; Song, Y.Y.; Yao, C.J.; Li, W.B.; Yue, Y.C. Intelligent Design and Optimization System for Cleaning Device of Rice and Wheat Combine Harvester. Trans. Chin. Soc. Agric. Mach. 2021, 52, 92–101. [Google Scholar]
- Badretdinov, I.; Mudarisov, S.; Lukmanov, R.; Permyakov, V.; Ibragimov, R. Mathematical modeling and research of the work of the grain combine harvester cleaning system. Comput. Electron. Agric. 2019, 165, 104966. [Google Scholar] [CrossRef]
- Xu, L.Z.; Li, Y.; Chai, X.Y.; Wang, G.M.; Liang, Z.W.; Li, Y.M.; Li, B.J. Numerical simulation of gas–solid two-phase flow to predict the cleaning performance of rice combine harvesters. Biosyst. Eng. 2020, 190, 11–24. [Google Scholar] [CrossRef]
- Wang, H.H.; Li, Y.M.; Xu, L.Z.; Ma, Z. Simulation and experiment of air flow field in the cleaning device of ratooning rice combine harvesters. Trans. Chin. Soc. Agric. Eng. 2020, 36, 84–92. [Google Scholar]
- Mariyono, J. Productivity growth of Indonesian rice production: Sources and efforts to improve performance. Int. J. Product. Perfor. 2018, 67, 1792–1815. [Google Scholar] [CrossRef]
- Piron, A.; Leemans, V.; Kleynen, O.; Lebeau, F.; Destain, M. Selection of the most efficient wavelength bands for discriminating weeds from crop. Comput. Electron. Agric. 2008, 62, 141–148. [Google Scholar] [CrossRef] [Green Version]
- Zhang, Z.T.; Hang, Z.T.; Wang, H.F.; Karnieli, A.; Chen, J.Y.; Han, W.T. Inversion of Soil Moisture Content from Hyperspectra Based on Ridge Regression. Trans. Chin. Soc. Agric. Mach. 2018, 49, 240–248. [Google Scholar]
- Chen, M.; Xu, J.S.; Jin, C.Q.; Zhang, G.Y.; Ni, Y.L. Inversion model of soybean impurity rate based on hyperspectral. J. Chin. Agric. Univ. 2019, 24, 160–167. [Google Scholar]
- Yu, C.C.; Zhou, L.; Wang, X.; Wu, J.Z.; Liu, Q. Hyperspectral Detection of Unsound Kernels of Wheat Based on Convolutional Neural Network. Food Sci. 2017, 38, 283–287. [Google Scholar]
- Wallays, C.; Missotten, B.; Baerdemaeker, J.D.; Saeys, W. Hyperspectral waveband selection for on-line measurement of grain cleanness. Biosyst. Eng. 2009, 104, 1–7. [Google Scholar]
- Chen, M.; Ni, Y.L.; Jin, C.Q.; Xu, J.S.; Yuan, W.S. High spectral inversion of wheat impurities rate for grain combine harvester. Trans. Chin. Soc. Agric. Eng. 2019, 35, 22–29. [Google Scholar]
- Jahari, M.; Yamamoto, K.; Miyamoto, M.; Kondo, N.; Ogawa, Y.; Suzuki, T. Double lighting machine vision system to monitor harvested paddy grain quality during head-feeding combine harvester operation. Machines 2015, 3, 352–363. [Google Scholar]
- Mahirah, J.; Yamamoto, K.; Miyamoto, M.; Kondo, N.; Ogawa, Y.; Suzuki, T.; Habaragamuwa, H.; Ahmad, U. Monitoring harvested paddy during combine harvesting using a machine vision-double lighting system. Appl. Eng. Agric. 2017, 10, 140–149. [Google Scholar] [CrossRef]
- Pourreza, A.; Pourreza, H.; Abbaspour, M.; Sadrniaa, H. Identification of nine Iranian wheat seed varieties by text ural analysis with image processing. Comput. Electron. Agric. 2012, 83, 102–108. [Google Scholar] [CrossRef]
- Kayabasi, A.; Sabanci, K.; Yigit, E.; Toktas, A.; Yildiz, B. Image processing based ann with bayesian regularization learning algorithm for classification of wheat grains. In Proceedings of the IEEE 10th International Conference on Electrical and Electronics Engineering (ELECO), Bursa, Turkey, 30 November–2 December 2017; pp. 1166–1170. [Google Scholar]
- Chen, J.; Lian, Y.; Li, Y.M.; Wang, Y.H.; Liu, X.Y.; Gu, Y. Design of sampling device for rice grain impurity sensor in grain-bin of combine harvester. Trans. Chin. Soc. Agric. Eng. 2019, 35, 18–25. [Google Scholar]
- Chen, J.; Lian, Y.; Zou, R.; Zhang, S.; Ning, X.B.; Han, M.N. Real-time grain breakage sensing for rice combine harvesters using machine vision technology. Int. J. Agric. Biol. Eng. 2020, 13, 194–199. [Google Scholar] [CrossRef]
- Chen, J.; Gu, Y.; Lian, Y.; Han, M.N. Online recognition method of impurities and broken paddy grains based on machine vision. Trans. Chin. Soc. Agric. Eng. 2018, 34, 187–194. [Google Scholar]
- Momin, M.A.; Yamamoto, K.; Miyamoto, M.; Kondo, N.; Grift, T. Machine vision based soybean quality evaluation. Comput. Electron. Agric. 2017, 140, 452–460. [Google Scholar] [CrossRef]
- Sun, Z.B.; Feng, W.Q.; Zhao, Q.; Huang, L.D. Brightness preserving image enhancement based on a gradient and intensity histogram. J. Electron. Imaging 2015, 24, 053006. [Google Scholar] [CrossRef]
- Jia, F.G.; Han, Y.L.; Liu, Y.C.; Cao, Y.P.; Shi, Y.F.; Yao, L.N.; Wang, H. Simulation prediction method of repose angle for rice particle materials. Trans. Chin. Soc. Agric. Eng. 2014, 30, 254–260. [Google Scholar]
- Jia, H.L.; Deng, J.Y.; Deng, Y.L.; Chen, T.Y.; Wang, G.; Sun, Z.J.; Guo, H. Contact parameter analysis and calibration in discrete element simulation of rice straw. Int. J. Agric. Biol. Eng. 2021, 14, 72–81. [Google Scholar] [CrossRef]
- Horabik, J.; Marek, M. Parameters and contact models for DEM simulations of agricultural granular materials: A review. Biosyst. Eng. 2016, 147, 206–225. [Google Scholar] [CrossRef]
- Liang, Z.W.; Xu, L.Z.; Baerdemaeker, J.D.; LI, Y.M.; Saeys, W. Optimisation of a multi-duct cleaning device for rice combine harvesters utilising CFD and experiments. Biosyst. Eng. 2020, 190, 25–40. [Google Scholar]
- He, K.M.; Gkioxari, G.; Dollar, P.; Girshick, R. Mask R-CNN. In Proceedings of the IEEE International Conference on Computer Vision (ICCV), 2017, Venice, Italy, 22–29 October 2017; pp. 2961–2969. [Google Scholar]
- Russell, B.C.; Torralba, A.; Murphy, K.P.; Freeman, W.T. LabelMe: A database and web-based tool for image annotation. Int. J. Comput. Vis. 2008, 77, 157–173. [Google Scholar] [CrossRef]
- Chen, M.; Ni, Y.L.; Jin, C.Q.; Xu, J.S.; Zhang, G.Y. Online Monitoring Method of Mechanized Soybean Harvest Quality Based on Machine Vision. Trans. Chin. Soc. Agric. Mach. 2021, 52, 91–98. [Google Scholar]


| Material | Density (kg/m3) | Poisson’s Ratio | Shear Modulus (MPa) |
|---|---|---|---|
| Rice | 1350 | 0.3 | 180 |
| Impurity | 198 | 0.4 | 48 |
| Belt | 2500 | 0.49 | 2 |
| Shell | 7800 | 0.33 | 80,000 |
| Types | Collision Recovery Coefficient | Static Friction Coefficient | Dynamic Friction Coefficient |
|---|---|---|---|
| Rice-rice | 0.19 | 0.81 | 0.05 |
| Rice-impurity | 0.17 | 0.80 | 0.03 |
| Rice-belt | 0.42 | 0.50 | 0.01 |
| Rice-shell | 0.52 | 0.45 | 0.01 |
| Impurity-belt | 0.09 | 0.60 | 0.02 |
| Impurity-shell | 0.10 | 0.66 | 0.02 |
| Impurity-impurity | 0.23 | 0.44 | 0.07 |
| Layer Name | Output Size | Convolution Kernel |
|---|---|---|
| Conv1 | 112 × 112 | 7 × 7, 64, stride 2 3 × 3 max pool, stride 2 |
| Conv2_x | 56 × 56 | × 3, stride 2 |
| Conv3_x | 28 × 28 | × 4, stride 2 |
| Conv4_x | 14 × 14 | × 23, stride 2 |
| Conv5_x | 7 × 7 | × 3, stride 2 |
| V Value Indicator | Light Irradiation | ||
|---|---|---|---|
| Single-Sided-Strip LED | Double-Sided Strip LED | Central Ring LED | |
| Percentage in the range of [0.30, 0.70] | 83.5% | 86.6% | 91.2% |
| Percentage in the range of [0.25, 0.75] | 92.0% | 93.8% | 96.2% |
| Percentage in the range of [0.20, 0.80] | 96.6% | 97.5% | 98.6% |
| Coefficient of variation | 0.311 | 0.301 | 0.271 |
| Varieties | Rice Mass (kg) | Moisture (%) | Impurity Mass (kg) | Correction Factor of Impurity Rate k | Actual Impurity Rate (%) | Detection Impurity Rate (%) | Detection Accuracy (%) |
|---|---|---|---|---|---|---|---|
| Lindao 20 | 11.55 | 22.7 | 0.32 | 0.968 | 2.8 | 2.64 | 94.33 |
| Nanjing 40 | 9.83 | 28.7 | 0.41 | 0.912 | 4.2 | 4.34 | 96.72 |
| Taijing 1105 | 12.21 | 25.5 | 0.41 | 0.936 | 3.3 | 3.53 | 92.91 |
| Ningjing 5 | 10.98 | 26.9 | 0.31 | 0.950 | 2.8 | 2.88 | 97.26 |
| Liangyou 106 | 11.58 | 24.8 | 0.42 | 1.075 | 3.6 | 3.28 | 91.15 |
| Test No. | Forward Speed (m/s) | Grain Mass m1 (kg) | Grain Mass without Impurity m2 (kg) | Impurity Rate of Manual Detection (%) | Impurity Rate of System Detection (%) | Detection Error (%) |
|---|---|---|---|---|---|---|
| 1 | 0.53 | 3.079 | 3.01 | 2.25 | 2.40 | 8.13 |
| 2 | 0.71 | 3.293 | 3.22 | 2.44 | 2.24 | −9.46 |
| 3 | 0.89 | 2.606 | 2.55 | 1.96 | 2.08 | 6.95 |
| 4 | 1.15 | 3.279 | 3.23 | 1.57 | 1.50 | −5.71 |
| 5 | 1.33 | 2.797 | 2.74 | 2.11 | 1.88 | −11.72 |
Publisher’s Note: MDPI stays neutral with regard to jurisdictional claims in published maps and institutional affiliations. |
© 2022 by the authors. Licensee MDPI, Basel, Switzerland. This article is an open access article distributed under the terms and conditions of the Creative Commons Attribution (CC BY) license (https://creativecommons.org/licenses/by/4.0/).
Share and Cite
Guan, Z.; Li, H.; Chen, X.; Mu, S.; Jiang, T.; Zhang, M.; Wu, C. Development of Impurity-Detection System for Tracked Rice Combine Harvester Based on DEM and Mask R-CNN. Sensors 2022, 22, 9550. https://doi.org/10.3390/s22239550
Guan Z, Li H, Chen X, Mu S, Jiang T, Zhang M, Wu C. Development of Impurity-Detection System for Tracked Rice Combine Harvester Based on DEM and Mask R-CNN. Sensors. 2022; 22(23):9550. https://doi.org/10.3390/s22239550
Chicago/Turabian StyleGuan, Zhuohuai, Haitong Li, Xu Chen, Senlin Mu, Tao Jiang, Min Zhang, and Chongyou Wu. 2022. "Development of Impurity-Detection System for Tracked Rice Combine Harvester Based on DEM and Mask R-CNN" Sensors 22, no. 23: 9550. https://doi.org/10.3390/s22239550