
Potentiometric Hydrogen Sensor with 3D-Printed BaCe0.6Zr0.3Y0.1O3-α Electrolyte for High-Temperature Applications


Abstract
:1. Introduction
2. Materials and Methods
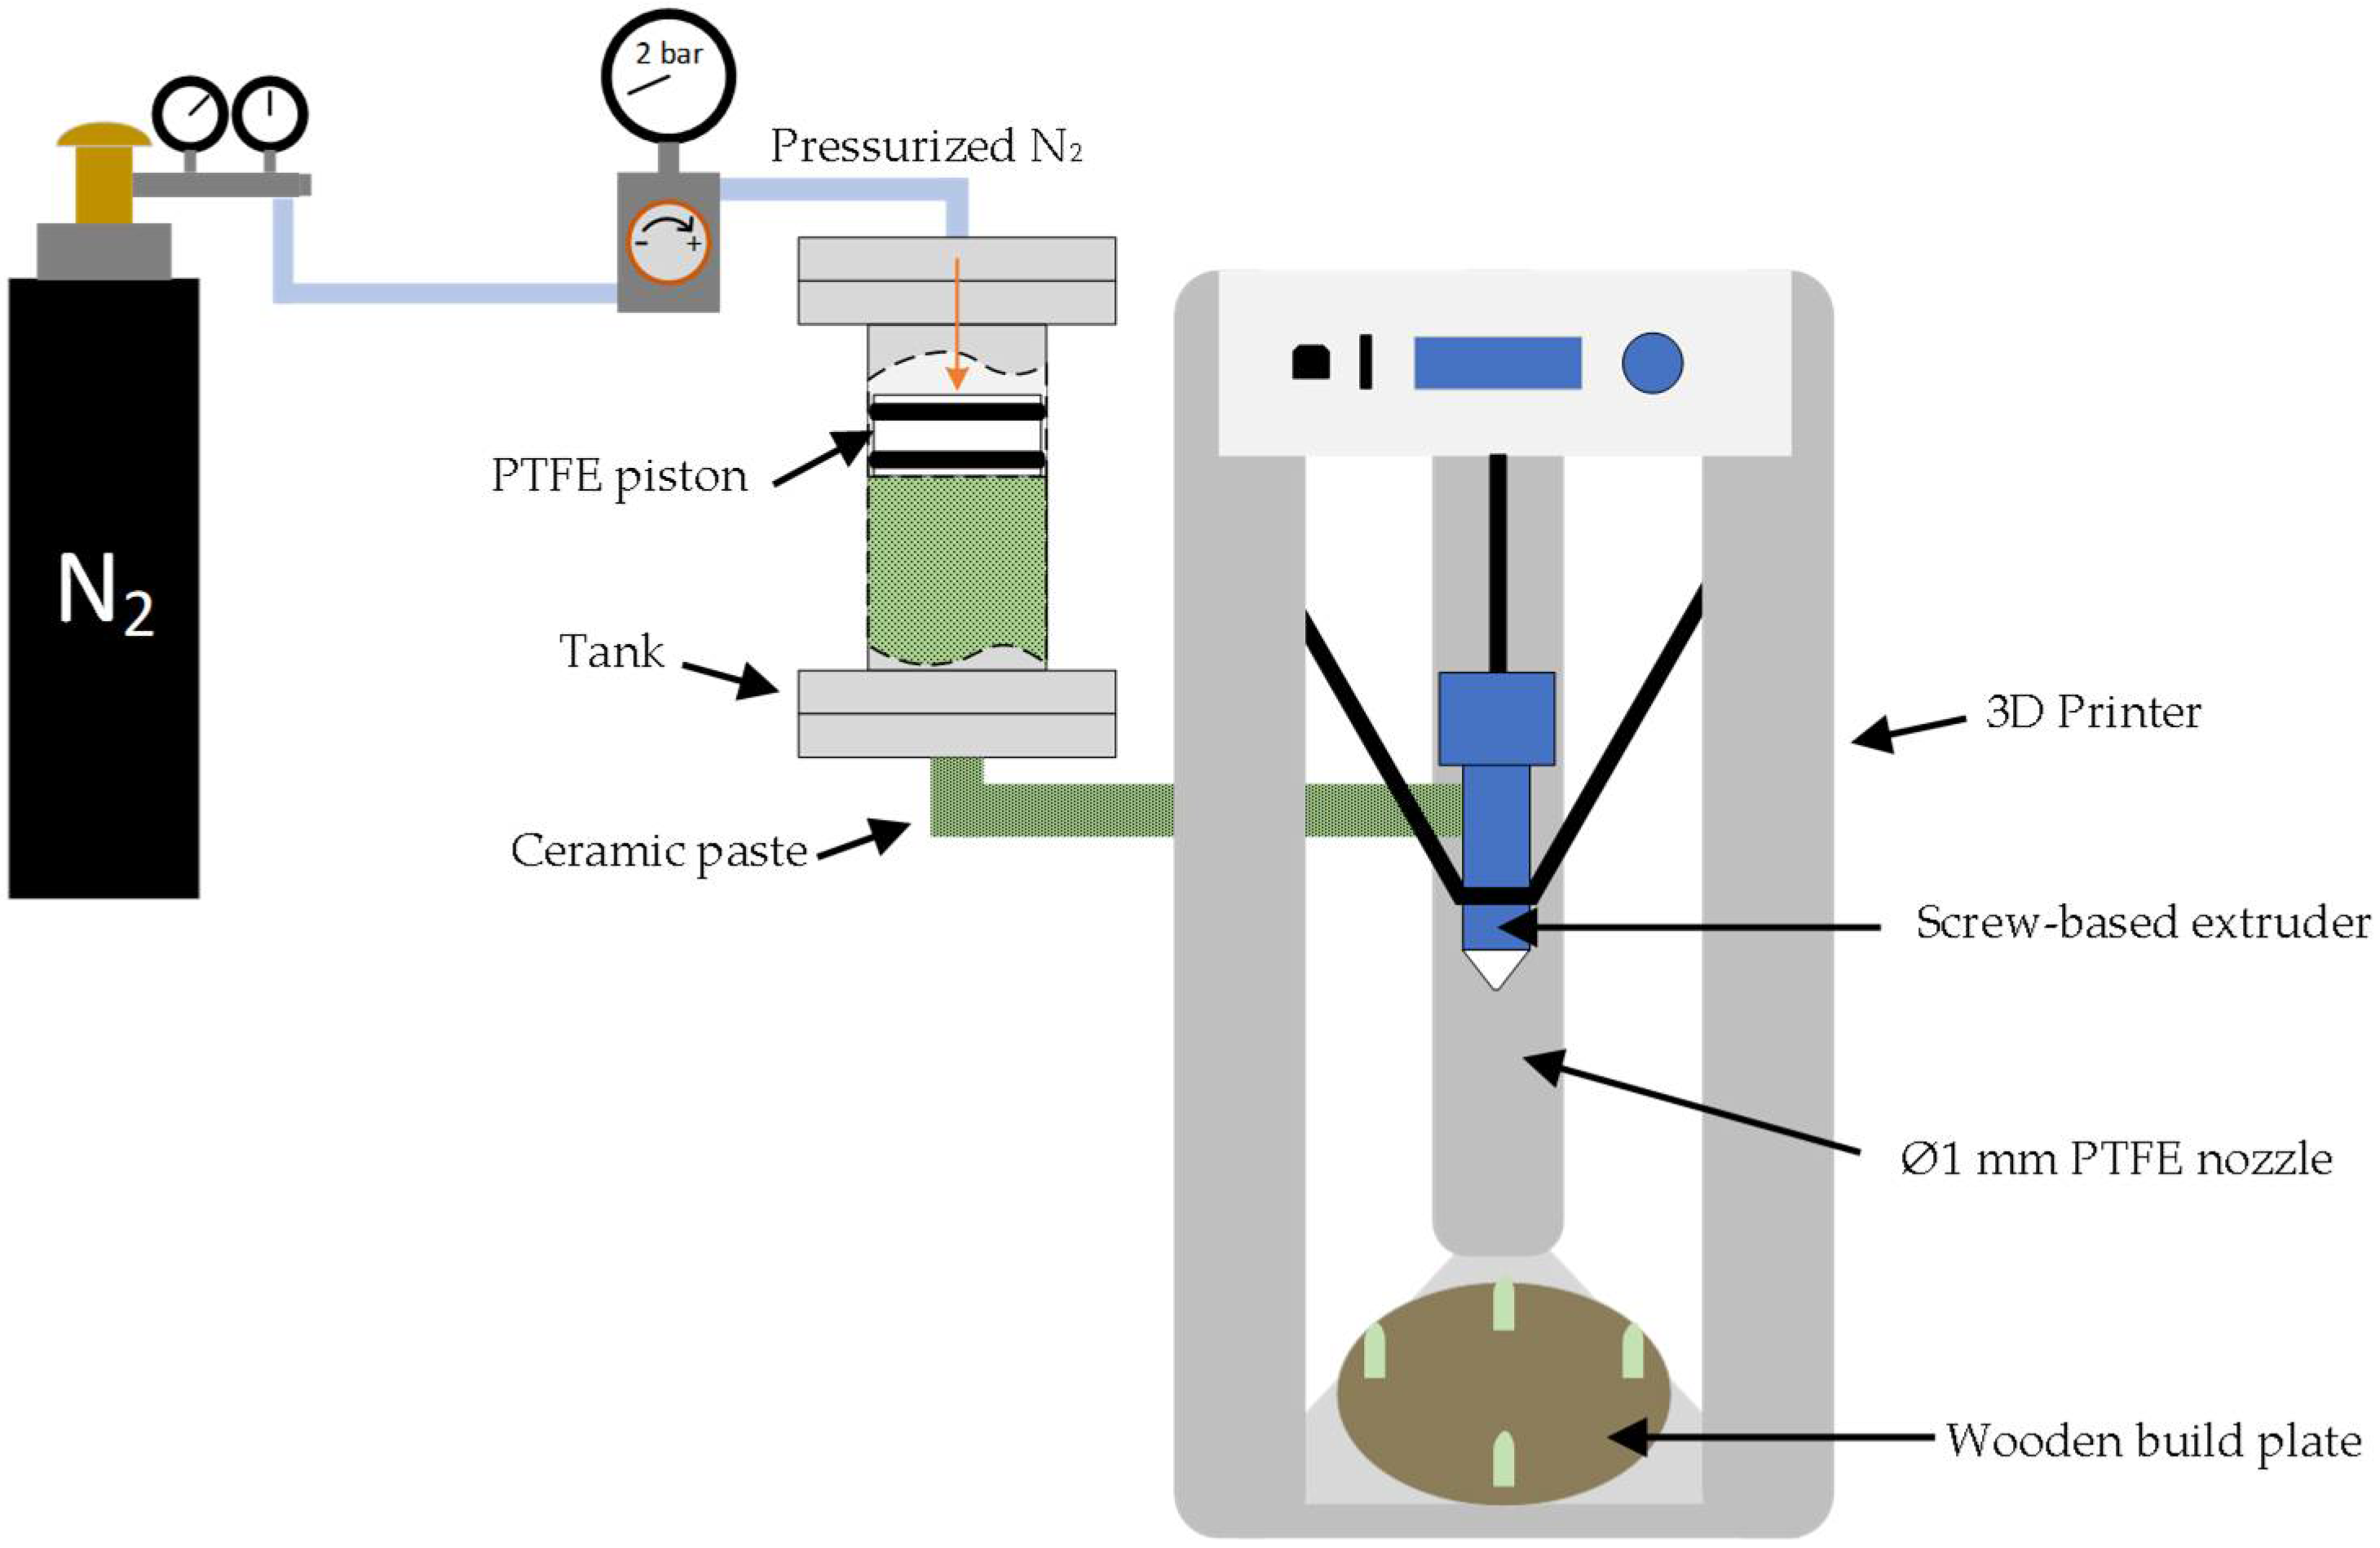
2.1. Shaping with 3D Printing
2.2. Sintering and Characterization of the Solid-State Electrolytes
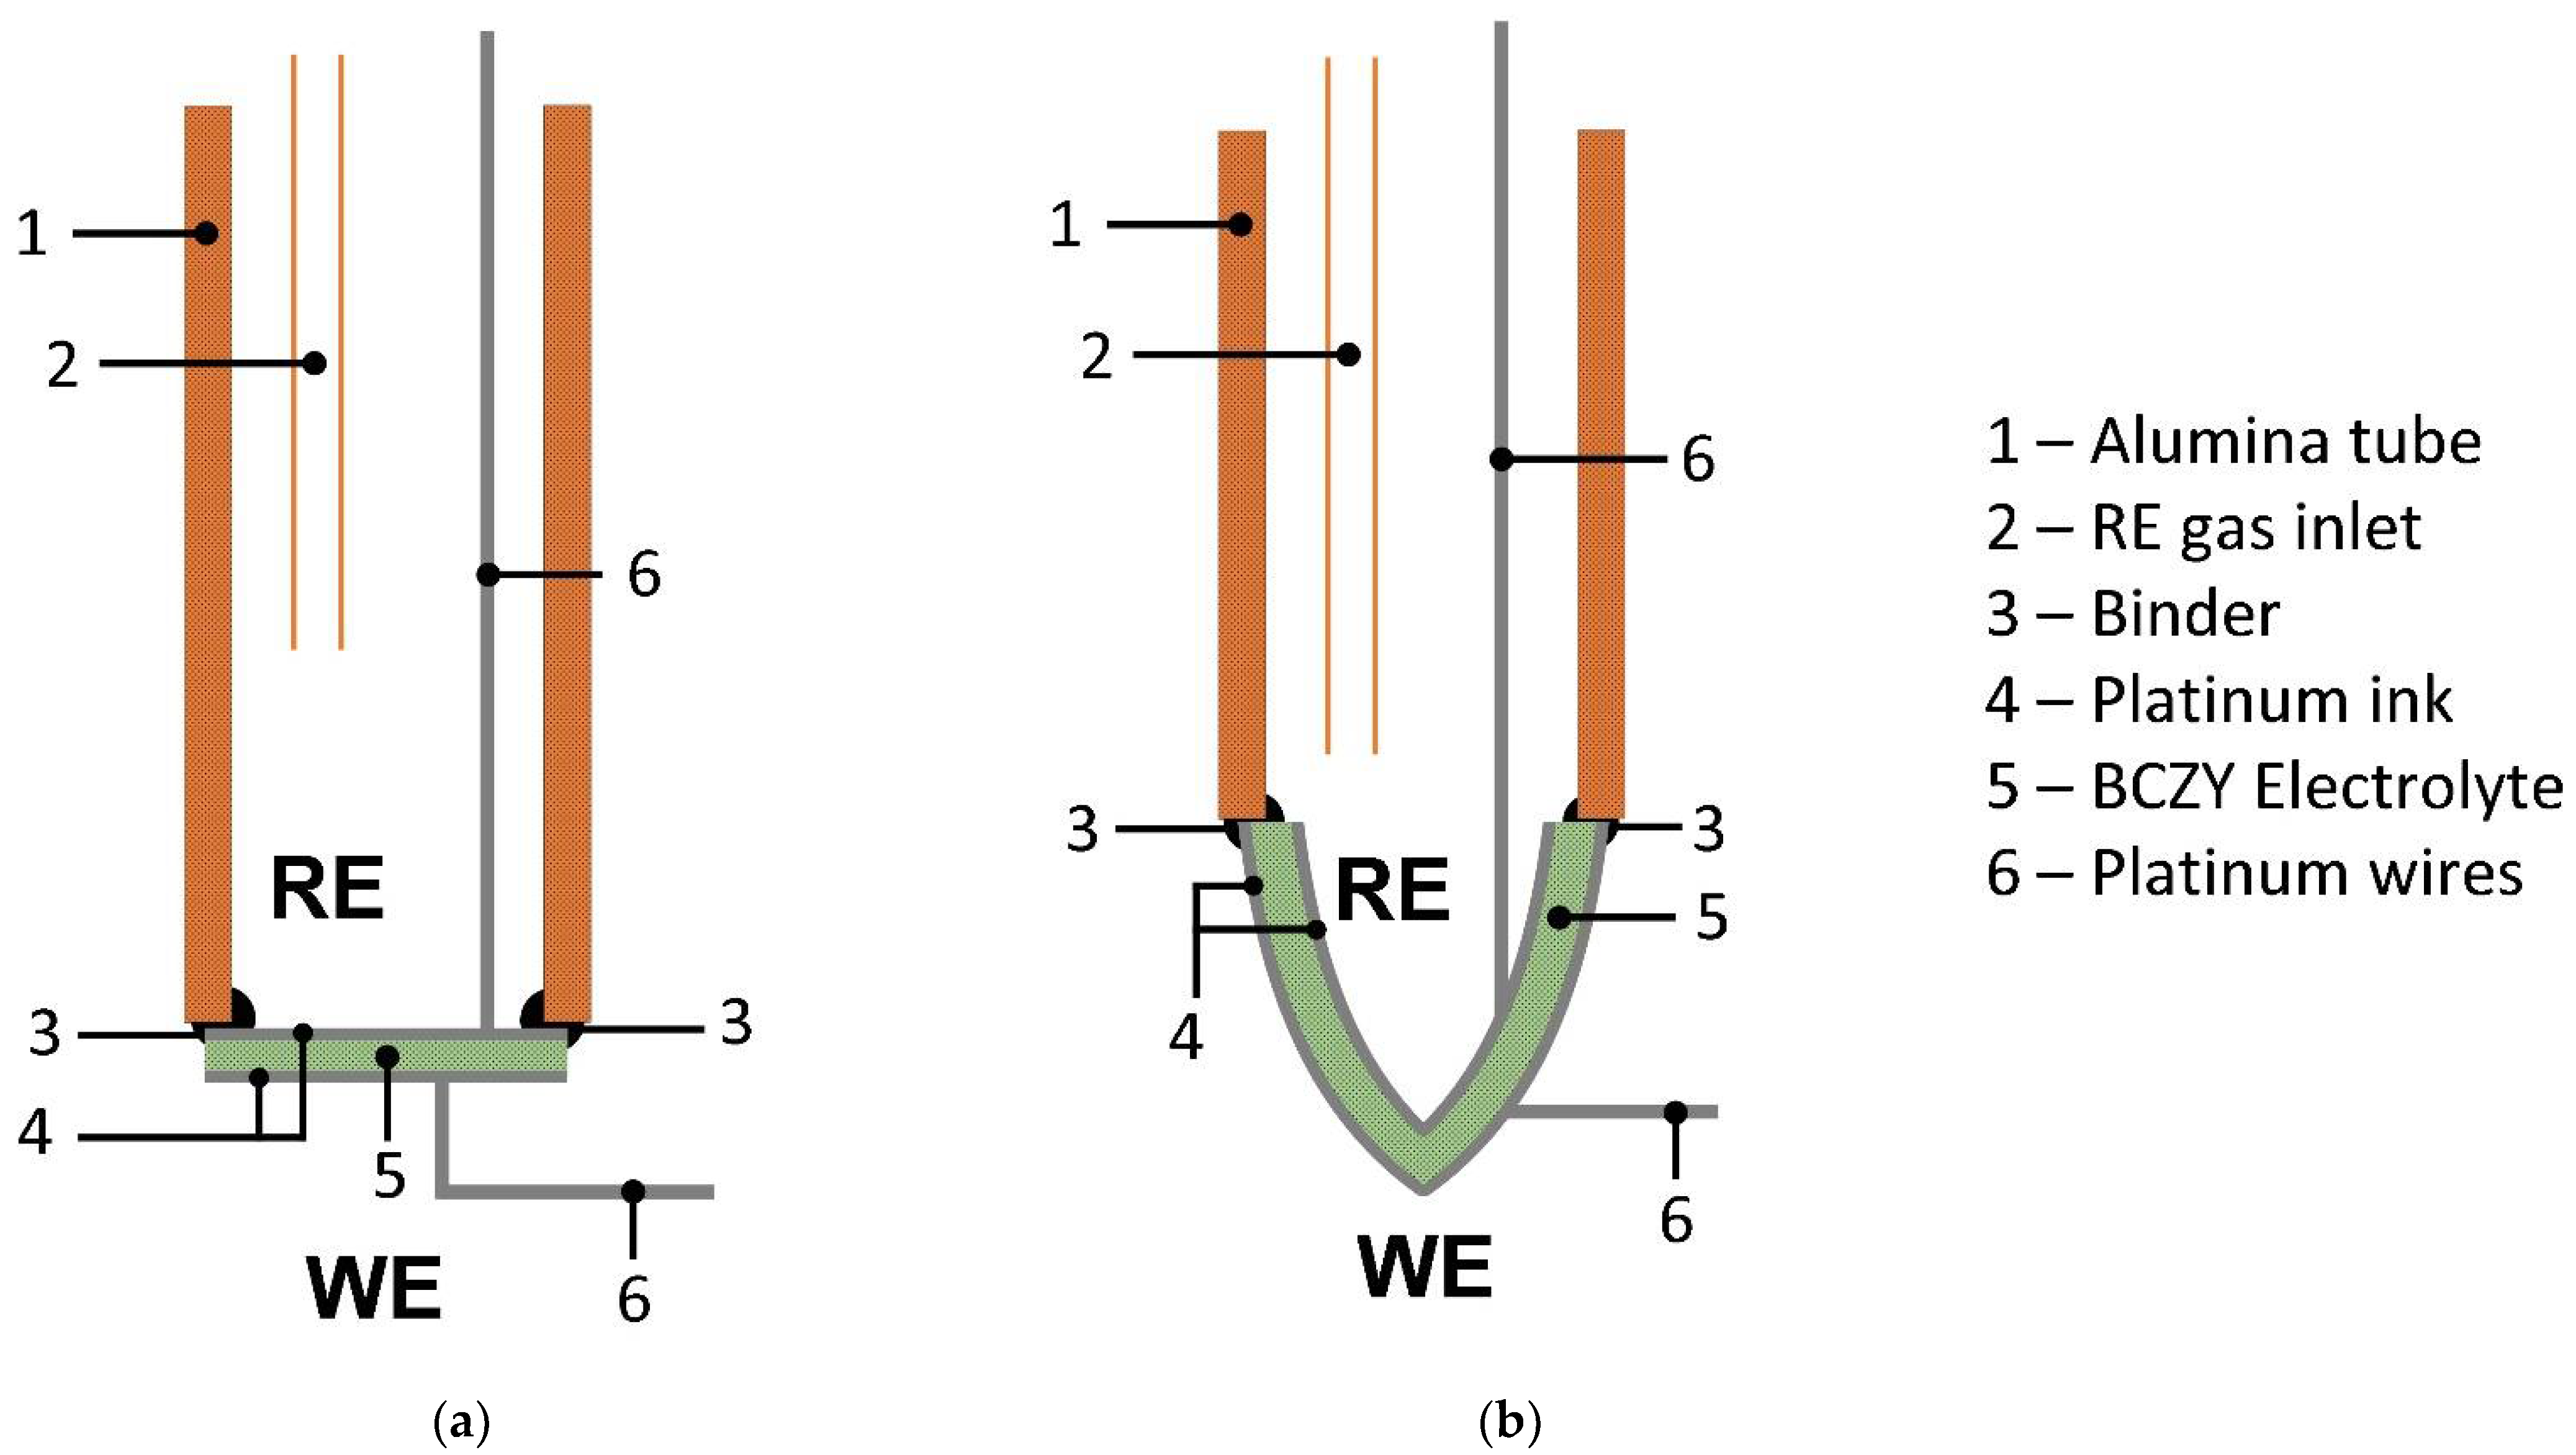
2.3. Potentiometric Sensor Construction
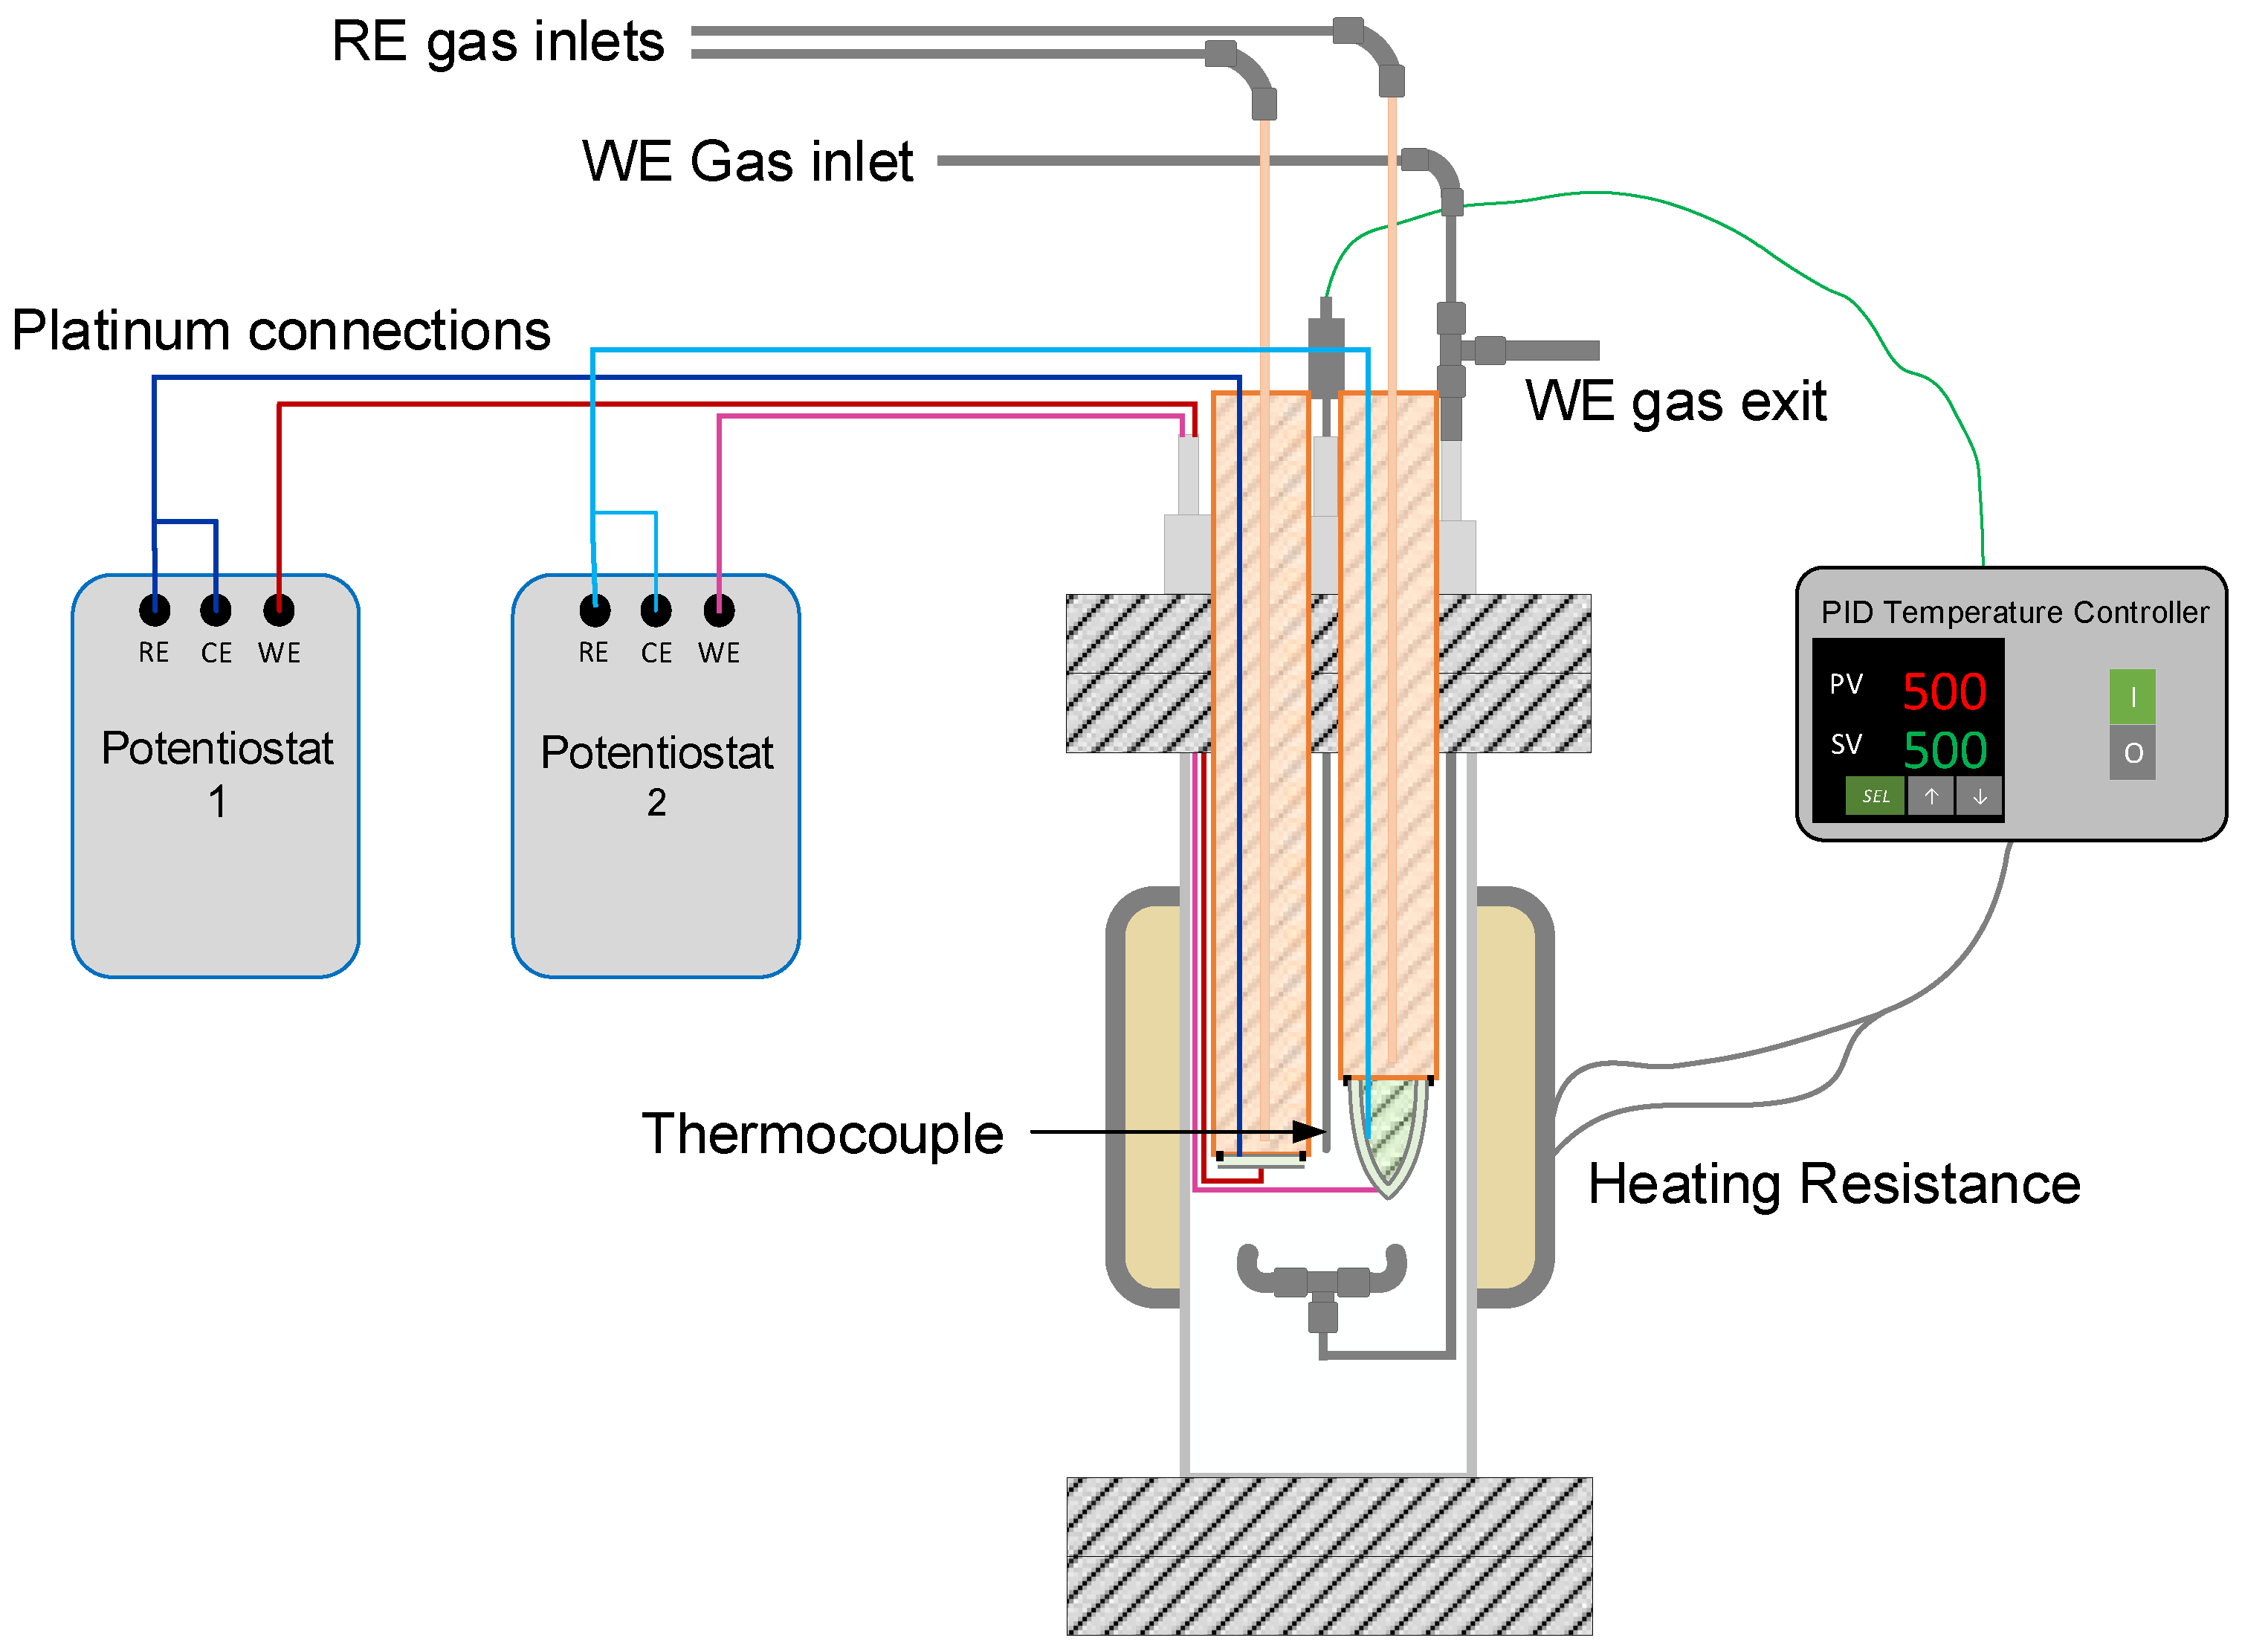
2.4. Electrochemical Measurements
3. Results and Discussion
3.1. Characterization of the Electrolytes
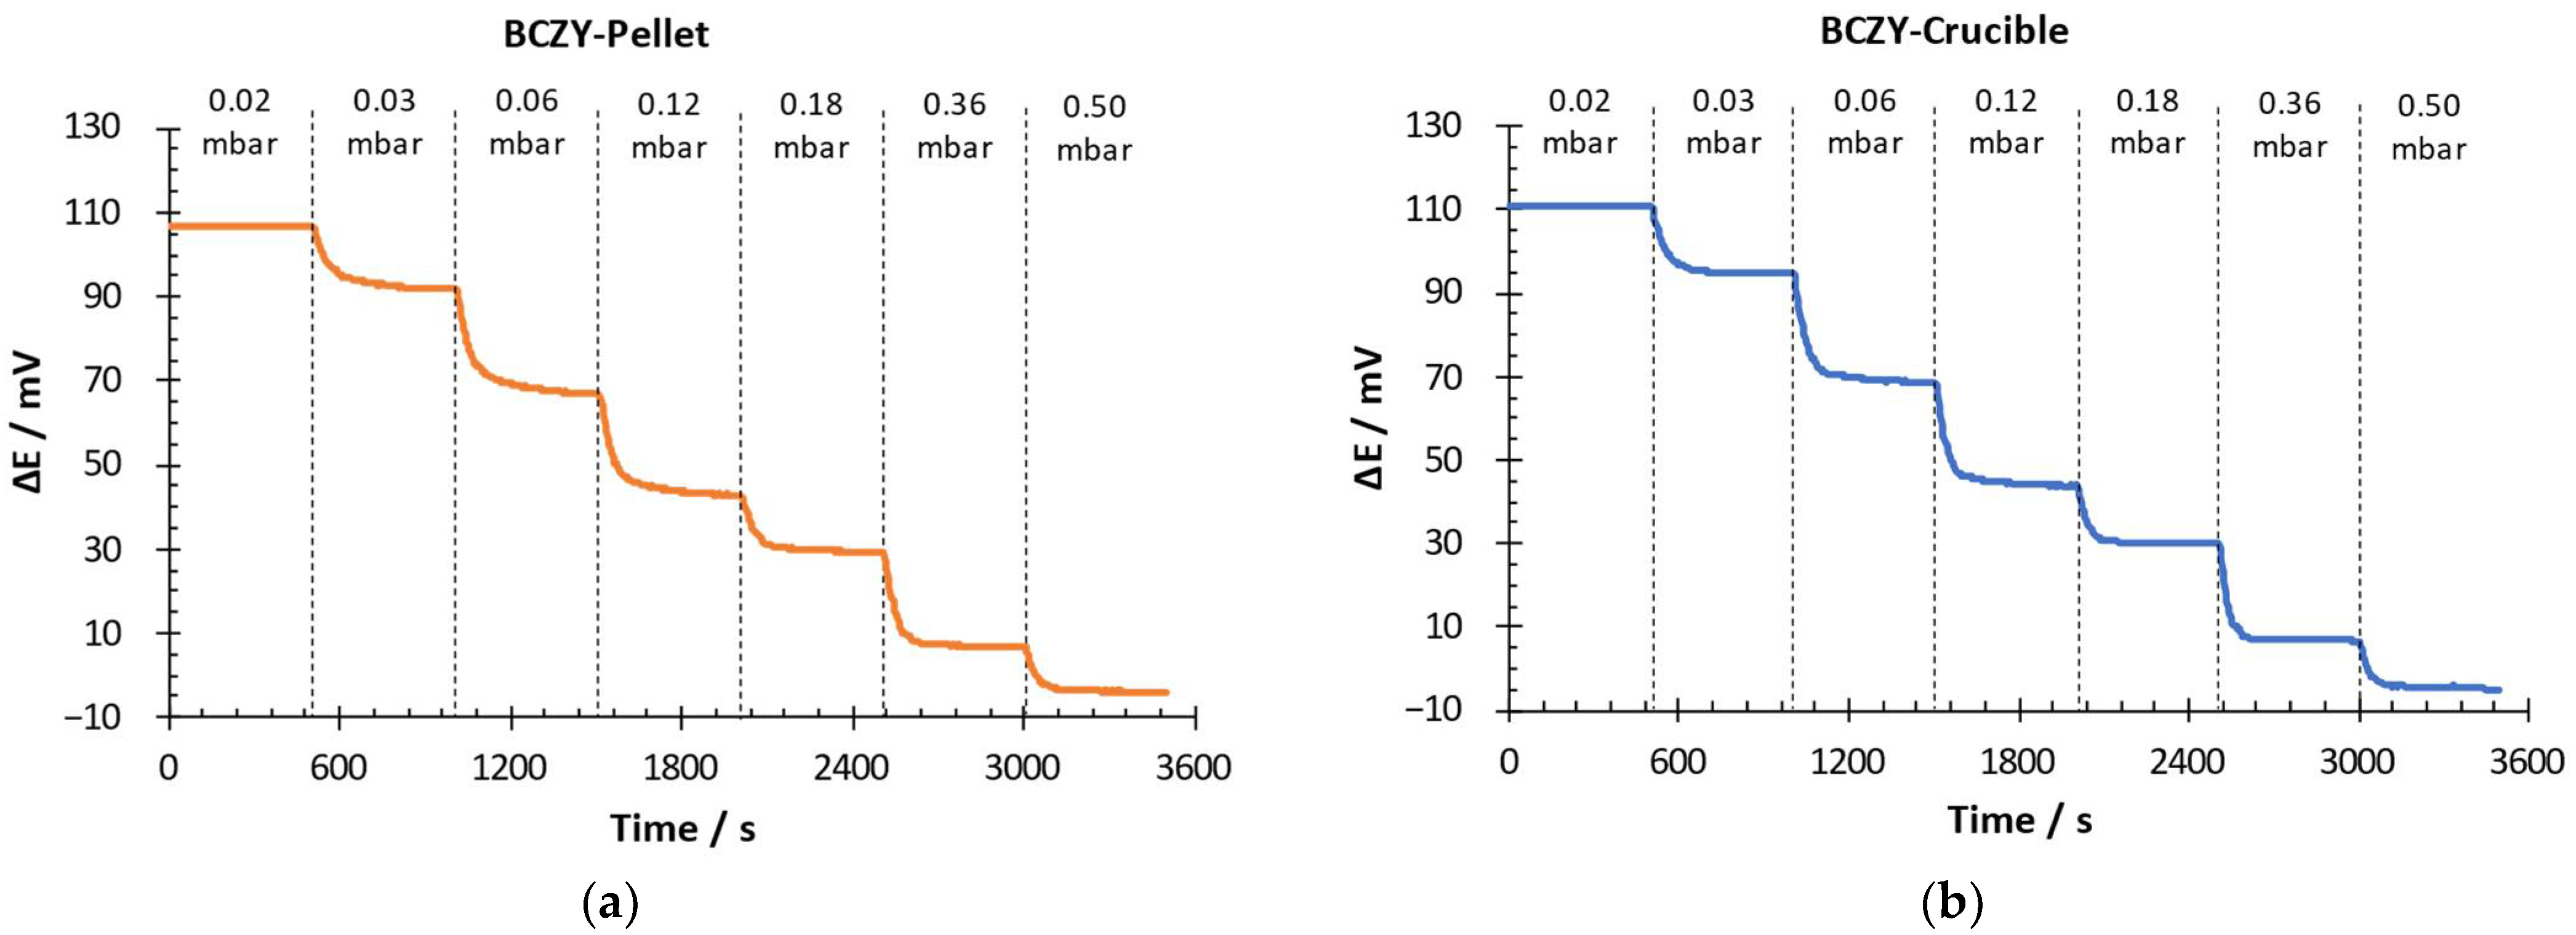
3.2. Sensors’ Performance
3.3. Response Time, Recovery Time and Accuracy
4. Conclusions
Supplementary Materials
Author Contributions
Funding
Institutional Review Board Statement
Informed Consent Statement
Data Availability Statement
Acknowledgments
Conflicts of Interest
References
- Singh, S.; Jain, S.; PS, V.; Tiwari, A.K.; Nouni, M.R.; Pandey, J.K.; Goel, S. Hydrogen: A Sustainable Fuel for Future of the Transport Sector. Renew. Sustain. Energy Rev. 2015, 51, 623–633. [Google Scholar] [CrossRef]
- Reddy, S.N.; Nanda, S.; Vo, D.-V.N.; Nguyen, T.D.; Nguyen, V.-H.; Abdullah, B.; Nguyen-Tri, P. Hydrogen: Fuel of the near Future. In New Dimensions in Production and Utilization of Hydrogen; Elsevier: Amsterdam, The Netherlands, 2020; pp. 1–20. [Google Scholar]
- Rievaj, V.; Gaňa, J.; Synák, F. Is Hydrogen the Fuel of the Future? Transp. Res. Procedia 2019, 40, 469–474. [Google Scholar] [CrossRef]
- Møller, K.T.; Jensen, T.R.; Akiba, E.; Li, H. Hydrogen—A Sustainable Energy Carrier. Prog. Nat. Sci.: Mater. Int. 2017, 27, 34–40. [Google Scholar] [CrossRef]
- Zhang, X.; Chan, S.H.; Li, G.; Ho, H.K.; Li, J.; Feng, Z. A Review of Integration Strategies for Solid Oxide Fuel Cells. J Power Sources 2010, 195, 685–702. [Google Scholar] [CrossRef]
- Yamamoto, O. Solid Oxide Fuel Cells: Fundamental Aspects and Prospects. Electrochim. Acta 2000, 45, 2423–2435. [Google Scholar] [CrossRef]
- Schultz, A.M.; Brown, T.D.; Buric, M.P.; Lee, S.; Gerdes, K.; Ohodnicki, P.R. High Temperature Fiber-Optic Evanescent Wave Hydrogen Sensors Using La-Doped SrTiO3 for SOFC Applications. Sens. Actuators B: Chem. 2015, 221, 1307–1313. [Google Scholar] [CrossRef] [Green Version]
- ITER. Available online: https://www.iter.org (accessed on 9 June 2022).
- Tanabe, T. (Ed.) Tanabe Tritium: Fuel of Fusion Reactors; Springer: Tokyo, Japan, 2017; ISBN 978-4-431-56458-4. [Google Scholar]
- Giancarli, L.; Chuyanov, V.; Abdou, M.; Akiba, M.; Hong, B.G.; Lässer, R.; Pan, C.; Strebkov, Y. Breeding Blanket Modules Testing in ITER: An International Program on the Way to DEMO. Fusion Eng. Des. 2006, 81, 393–405. [Google Scholar] [CrossRef]
- Zdrachek, E.; Bakker, E. Potentiometric Sensing. Anal. Chem. 2019, 91, 2–26. [Google Scholar] [CrossRef] [Green Version]
- Ren, Q.; Cao, Y.-Q.; Arulraj, D.; Liu, C.; Wu, D.; Li, W.-M.; Li, A.-D. Review—Resistive-Type Hydrogen Sensors Based on Zinc Oxide Nanostructures. J. Electrochem. Soc. 2020, 167, 067528. [Google Scholar] [CrossRef]
- Hübert, T.; Boon-Brett, L.; Black, G.; Banach, U. Hydrogen Sensors—A Review. Sens. Actuators B. Chem. 2011, 157, 329–352. [Google Scholar] [CrossRef]
- Okuyama, Y.; Kurita, N.; Yamada, A.; Takami, H.; Ohshima, T.; Katahira, K.; Fukatsu, N. A New Type of Hydrogen Sensor for Molten Metals Usable up to 1600 K. Electrochim Acta 2009, 55, 470–474. [Google Scholar] [CrossRef]
- Iwahara, H.; Esaka, T.; Uchida, H.; Maeda, N. Proton Conduction in Sintered Oxides and Its Application to Steam Electrolysis for Hydrogen Production. Solid State Ion. 1981, 3–4, 359–363. [Google Scholar] [CrossRef]
- Matsumoto, H.; Shimura, T.; Iwahara, H.; Higuchi, T.; Yashiro, K.; Kaimai, A.; Kawada, T.; Mizusaki, J. Hydrogen Separation Using Proton-Conducting Perovskites. J. Alloy Compd. 2006, 408–412, 456–462. [Google Scholar] [CrossRef]
- Ricote, S.; Caboche, G.; Estournes, C.; Bonanos, N. Synthesis, Sintering, and Electrical Properties of BaCe0.9−xZrxY0.1O3−δ. J. Nanomater. 2008, 2008, 1–5. [Google Scholar] [CrossRef] [Green Version]
- Hinojo, A.; Soriano, I.; Abellà, J.; Colominas, S. Evaluation of High-Temperature Hydrogen Sensors Based on BaCe0.6Zr0.3Y0.1O3-α and Sr(Ce0.9Zr0.1)0.95Yb0.05O3-α Perovskites for Industrial Applications. Sensors 2020, 20, 7258. [Google Scholar] [CrossRef] [PubMed]
- Lujan, E.; Hinojo, A.; Colominas, S.; Abellà, J. High Temperature Potentiometric Hydrogen Sensor Based on BaCe0.6Zr0.3Y0.1O3-α-ZnO. Sens. Actuators B. Chem. 2023, 375, 132952. [Google Scholar] [CrossRef]
- Zhang, Y.; Zeng, F.; Yu, C.; Wu, C.; Ding, W.; Lu, X. Fabrication and Characterization of Dense BaCo0.7Fe0.2Nb0.1O3−δ Tubular Membrane by Slip Casting Techniques. Ceram. Int. 2015, 41, 1401–1411. [Google Scholar] [CrossRef]
- Meshalkin, V.P.; Belyakov, A.V. Methods Used for the Compaction and Molding of Ceramic Matrix Composites Reinforced with Carbon Nanotubes. Processes 2020, 8, 1004. [Google Scholar] [CrossRef]
- Biswas, P.; Mamatha, S.; Naskar, S.; Rao, Y.S.; Johnson, R.; Padmanabham, G. 3D Extrusion Printing of Magnesium Aluminate Spinel Ceramic Parts Using Thermally Induced Gelation of Methyl Cellulose. J. Alloy Compd. 2019, 770, 419–423. [Google Scholar] [CrossRef]
- Harrer, W.; Schwentenwein, M.; Lube, T.; Danzer, R. Fractography of Zirconia-Specimens Made Using Additive Manufacturing (LCM) Technology. J. Eur. Ceram. Soc. 2017, 37, 4331–4338. [Google Scholar] [CrossRef]
- Dehurtevent, M.; Robberecht, L.; Hornez, J.-C.; Thuault, A.; Deveaux, E.; Béhin, P. Stereolithography: A New Method for Processing Dental Ceramics by Additive Computer-Aided Manufacturing. Dent. Mater. 2017, 33, 477–485. [Google Scholar] [CrossRef] [PubMed]
- Ren, X.; Shao, H.; Lin, T.; Zheng, H. 3D Gel-Printing—An Additive Manufacturing Method for Producing Complex Shape Parts. Mater. Des. 2016, 101, 80–87. [Google Scholar] [CrossRef]
- Li, L.; Post, B.; Kunc, V.; Elliott, A.M.; Paranthaman, M.P. Additive Manufacturing of Near-Net-Shape Bonded Magnets: Prospects and Challenges. Scr. Mater. 2017, 135, 100–104. [Google Scholar] [CrossRef]
- Nikodemski, S.; Tong, J.; Duan, C.; O’Hayre, R. Ionic Transport Modification in Proton Conducting BaCe0.6Zr0.3Y0.1O3−δ with Transition Metal Oxide Dopants. Solid State Ion. 2016, 294, 37–42. [Google Scholar] [CrossRef] [Green Version]
- Ricote, S.; Caboche, G.; Heintz, O. Synthesis and Proton Incorporation in BaCe0.92xZrxY0.1O3-d. J. Appl. Electrochem. 2009, 39, 553–557. [Google Scholar] [CrossRef]
- Ricote, S.; Kee, R.J.; Coors, W.G. Slip Casting and Solid-State Reactive Sintering of BCZY(BaCexZr0.9−xY0.1O3−d)-NiO/BCZY Half-Cells. Membr. (Basel) 2022, 12, 242. [Google Scholar] [CrossRef]
- Rafique, M.; Safdar, N.; Irshad, M.; Usman, M.; Akhtar, M.; Saleem, M.W.; Abbas, M.M.; Ashour, A.; Soudagar, M.E. Influence of Low Sintering Temperature on BaCe0.2Zr0.6Y0.2O3−δ IT-SOFC Perovskite Electrolyte Synthesized by Co-Precipitation Method. Materials 2022, 15, 3585. [Google Scholar] [CrossRef]
- Lee, K.-R.; Tseng, C.-J.; Jang, S.-C.; Lin, J.-C.; Wang, K.-W.; Chang, J.-K.; Chen, T.-C.; Lee, S.-W. Fabrication of Anode-Supported Thin BCZY Electrolyte Protonic Fuel Cells Using NiO Sintering Aid. Int. J. Hydrogen Energy 2019, 44, 23784–23792. [Google Scholar] [CrossRef]
- Xia, C.; Mi, Y.; Wang, B.; Lin, B.; Chen, G.; Zhu, B. Shaping Triple-Conducting Semiconductor BaCo0.4Fe0.4Zr0.1Y0.1O3-δ into an Electrolyte for Low-Temperature Solid Oxide Fuel Cells. Nat. Commun. 2019, 10, 1707. [Google Scholar] [CrossRef] [Green Version]
- Beyribey, B.; Kim, H.; Persky, J. Electrochemical Characterization of BaCe0·7Zr0·1Y0·16Zn0·04O3-δ Electrolyte Synthesized by Combustion Spray Pyrolysis. Ceram Int 2021, 47, 1976–1979. [Google Scholar] [CrossRef]
- Tong, J.; Clark, D.; Hoban, M.; O’Hayre, R. Cost-Effective Solid-State Reactive Sintering Method for High Conductivity Proton Conducting Yttrium-Doped Barium Zirconium Ceramics. Solid State Ion. 2010, 181, 496–503. [Google Scholar] [CrossRef]
- Miller, J.N.; Miller, J.C.; Miller, R.D. Statistics and Chemometrics for Analytical Chemistry, Seventh ed.; Pearson Educational Limited: Harlow, UK, 2018; ISBN 9781292186719. [Google Scholar]
- Maccà, C. Response Time of Ion-Selective Electrodes. Anal. Chim. Acta 2004, 512, 183–190. [Google Scholar] [CrossRef]
- Budetić, M.; Samardžić, M.; Bubnjar, K.; Dandić, A.; Živković, P.; Széchenyi, A.; Kiss, L. A New Sensor for Direct Potentiometric Determination of Thiabendazole in Fruit Peels Using the Gran Method. Food Chem. 2022, 392, 133290. [Google Scholar] [CrossRef] [PubMed]
- Isildak, Ö.; Özbek, O. Application of Potentiometric Sensors in Real Samples. Crit. Rev. Anal. Chem. 2021, 51, 218–231. [Google Scholar] [CrossRef] [PubMed]
- Sedlák, P.; Kuberský, P. The Effect of the Orientation Towards Analyte Flow on Electrochemical Sensor Performance and Current Fluctuations. Sensors 2020, 20, 1038. [Google Scholar] [CrossRef] [PubMed] [Green Version]
- Li, Y.; Li, X.; Tang, Z.; Wang, J.; Yu, J.; Tang, Z. Potentiometric Hydrogen Sensors Based on Yttria-Stabilized Zirconia Electrolyte (YSZ) and CdWO4 Interface. Sens. Actuators B. Chem. 2016, 223, 365–371. [Google Scholar] [CrossRef]
- Zhang, H.; Li, Z.; Yi, J.; Zhang, H.; Zhang, Z. Potentiometric Hydrogen Sensing of Ordered SnO2 Thin Films. Sens. Actuators B. Chem. 2020, 321, 128505. [Google Scholar] [CrossRef]
- Li, Y.; Li, X.; Tang, Z.; Tang, Z.; Yu, J.; Wang, J. Hydrogen Sensing of the Mixed-Potential-Type MnWO4/YSZ/Pt Sensor. Sens. Actuators B. Chem. 2015, 206, 176–180. [Google Scholar] [CrossRef]
- Kalyakin, A.; Volkov, A.; Lyagaeva, J.; Medvedev, D.; Demin, A.; Tsiakaras, P. Combined Amperometric and Potentiometric Hydrogen Sensors Based on BaCe0.7Zr0.1Y0.2O3−δ Proton-Conducting Ceramic. Sens. Actuators B. Chem. 2016, 231, 175–182. [Google Scholar] [CrossRef]
- Katahira, K.; Kohchi, Y.; Shimura, T.; Iwahara, H. Protonic Conduction in Zr-Substituted BaCeO3. Solid State Ion. 2000, 138, 91–98. [Google Scholar] [CrossRef]


| BCZY-Pellet | BCZY-Crucibles | |
|---|---|---|
| Layer height | 0.5 mm | |
| Print speed | 100 mm/s | |
| Tank pressure | 2 bar | |
| Thickness | 1.2 mm | |
| Printing pattern | Zig-zag | Spiralize contour |
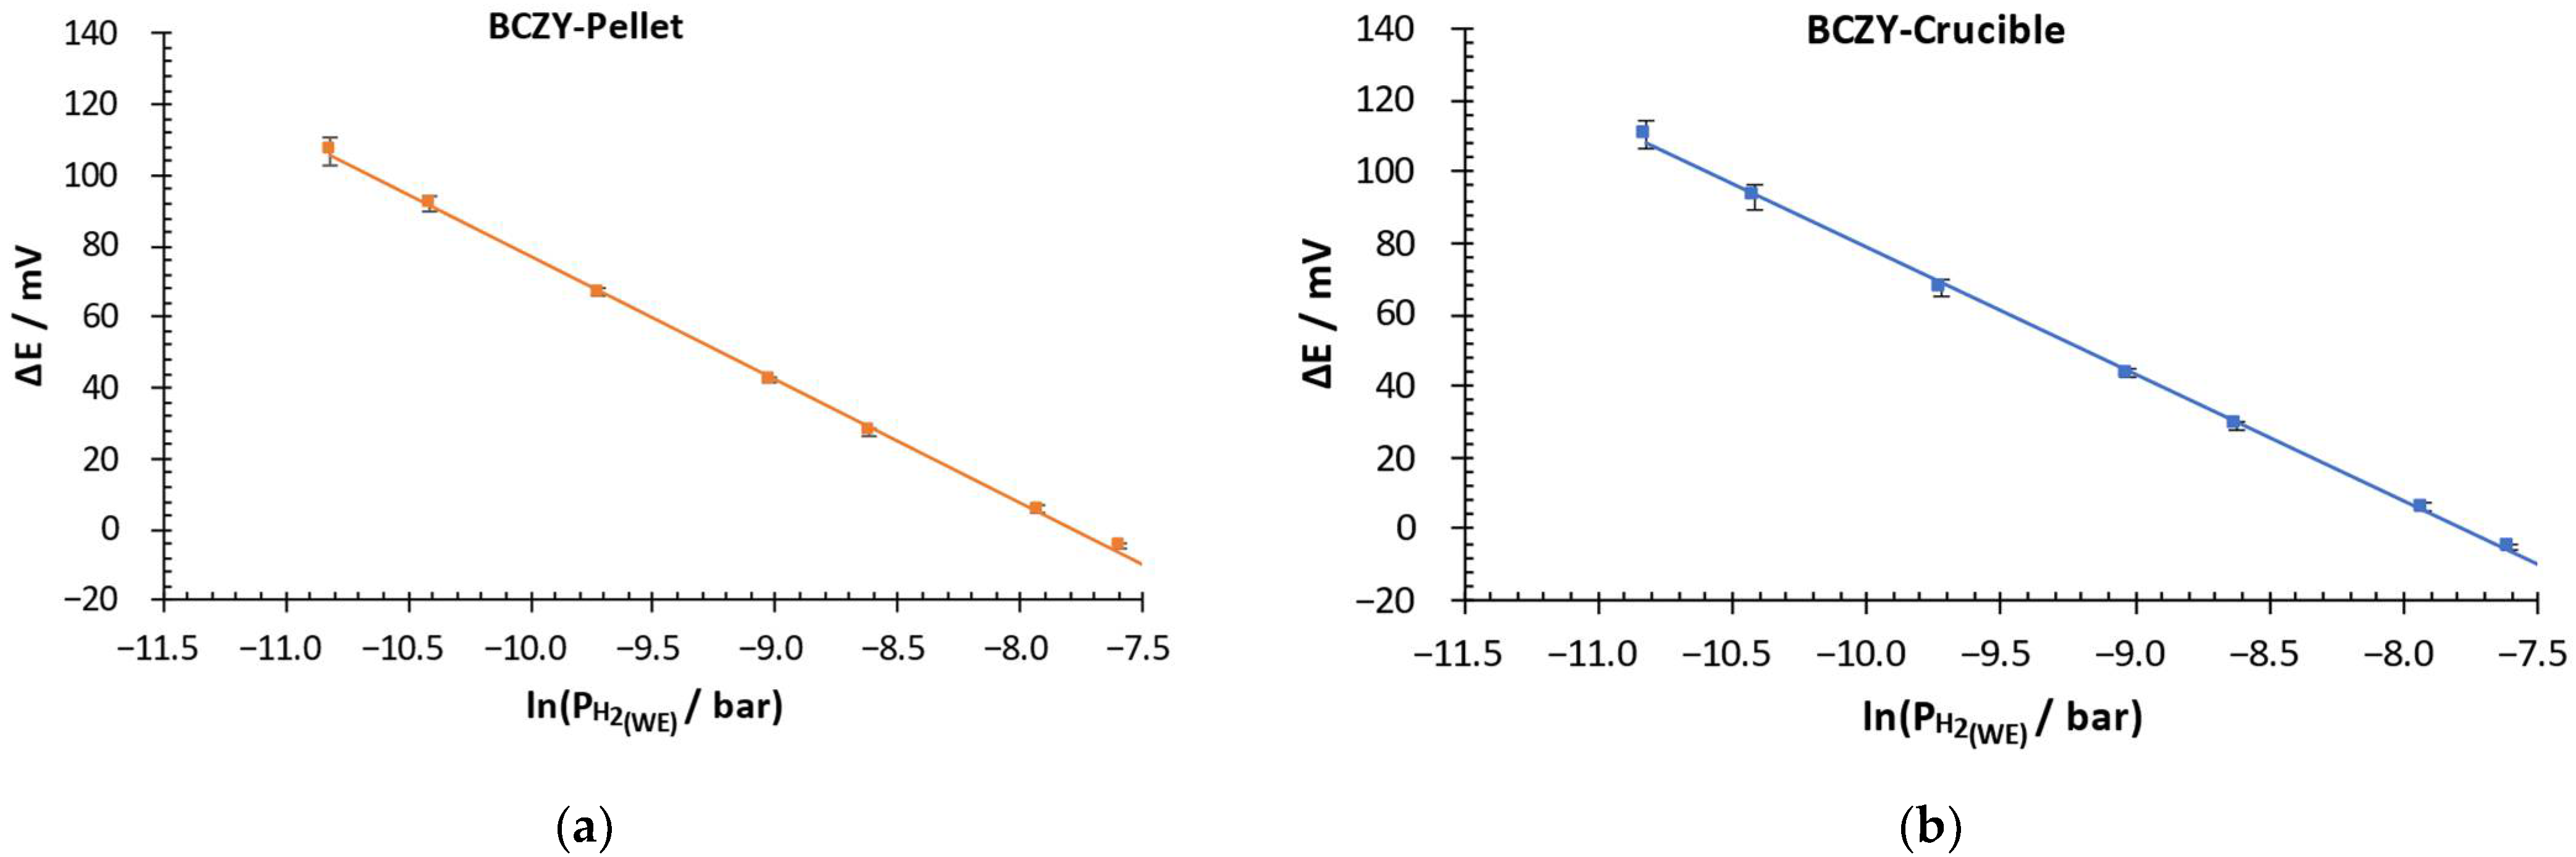
| Sensor | Calibration Curve | Uncertainty/mV | Correlation Coefficient/R2 | Slope Deviation/% | Y-Intercept Deviation/% | LOD/mbar |
|---|---|---|---|---|---|---|
| BCZY-Pellet | ΔE (mV) = −34.82·ln(PH2 *)−270.84 | ± 1.6 | 0.9992 | +4.6 | +17.8 | 1.6·10−3 |
| BCZY-Crucible | ΔE (mV) = −35.57·ln(PH2 *)−276.83 | ± 1.5 | 0.9989 | +6.8 | +20.3 | 1.7·10−3 |
| Nernst ** | ΔE (mV) = −33.30·ln(PH2 *)−230.06 | - | - | - | - | - |
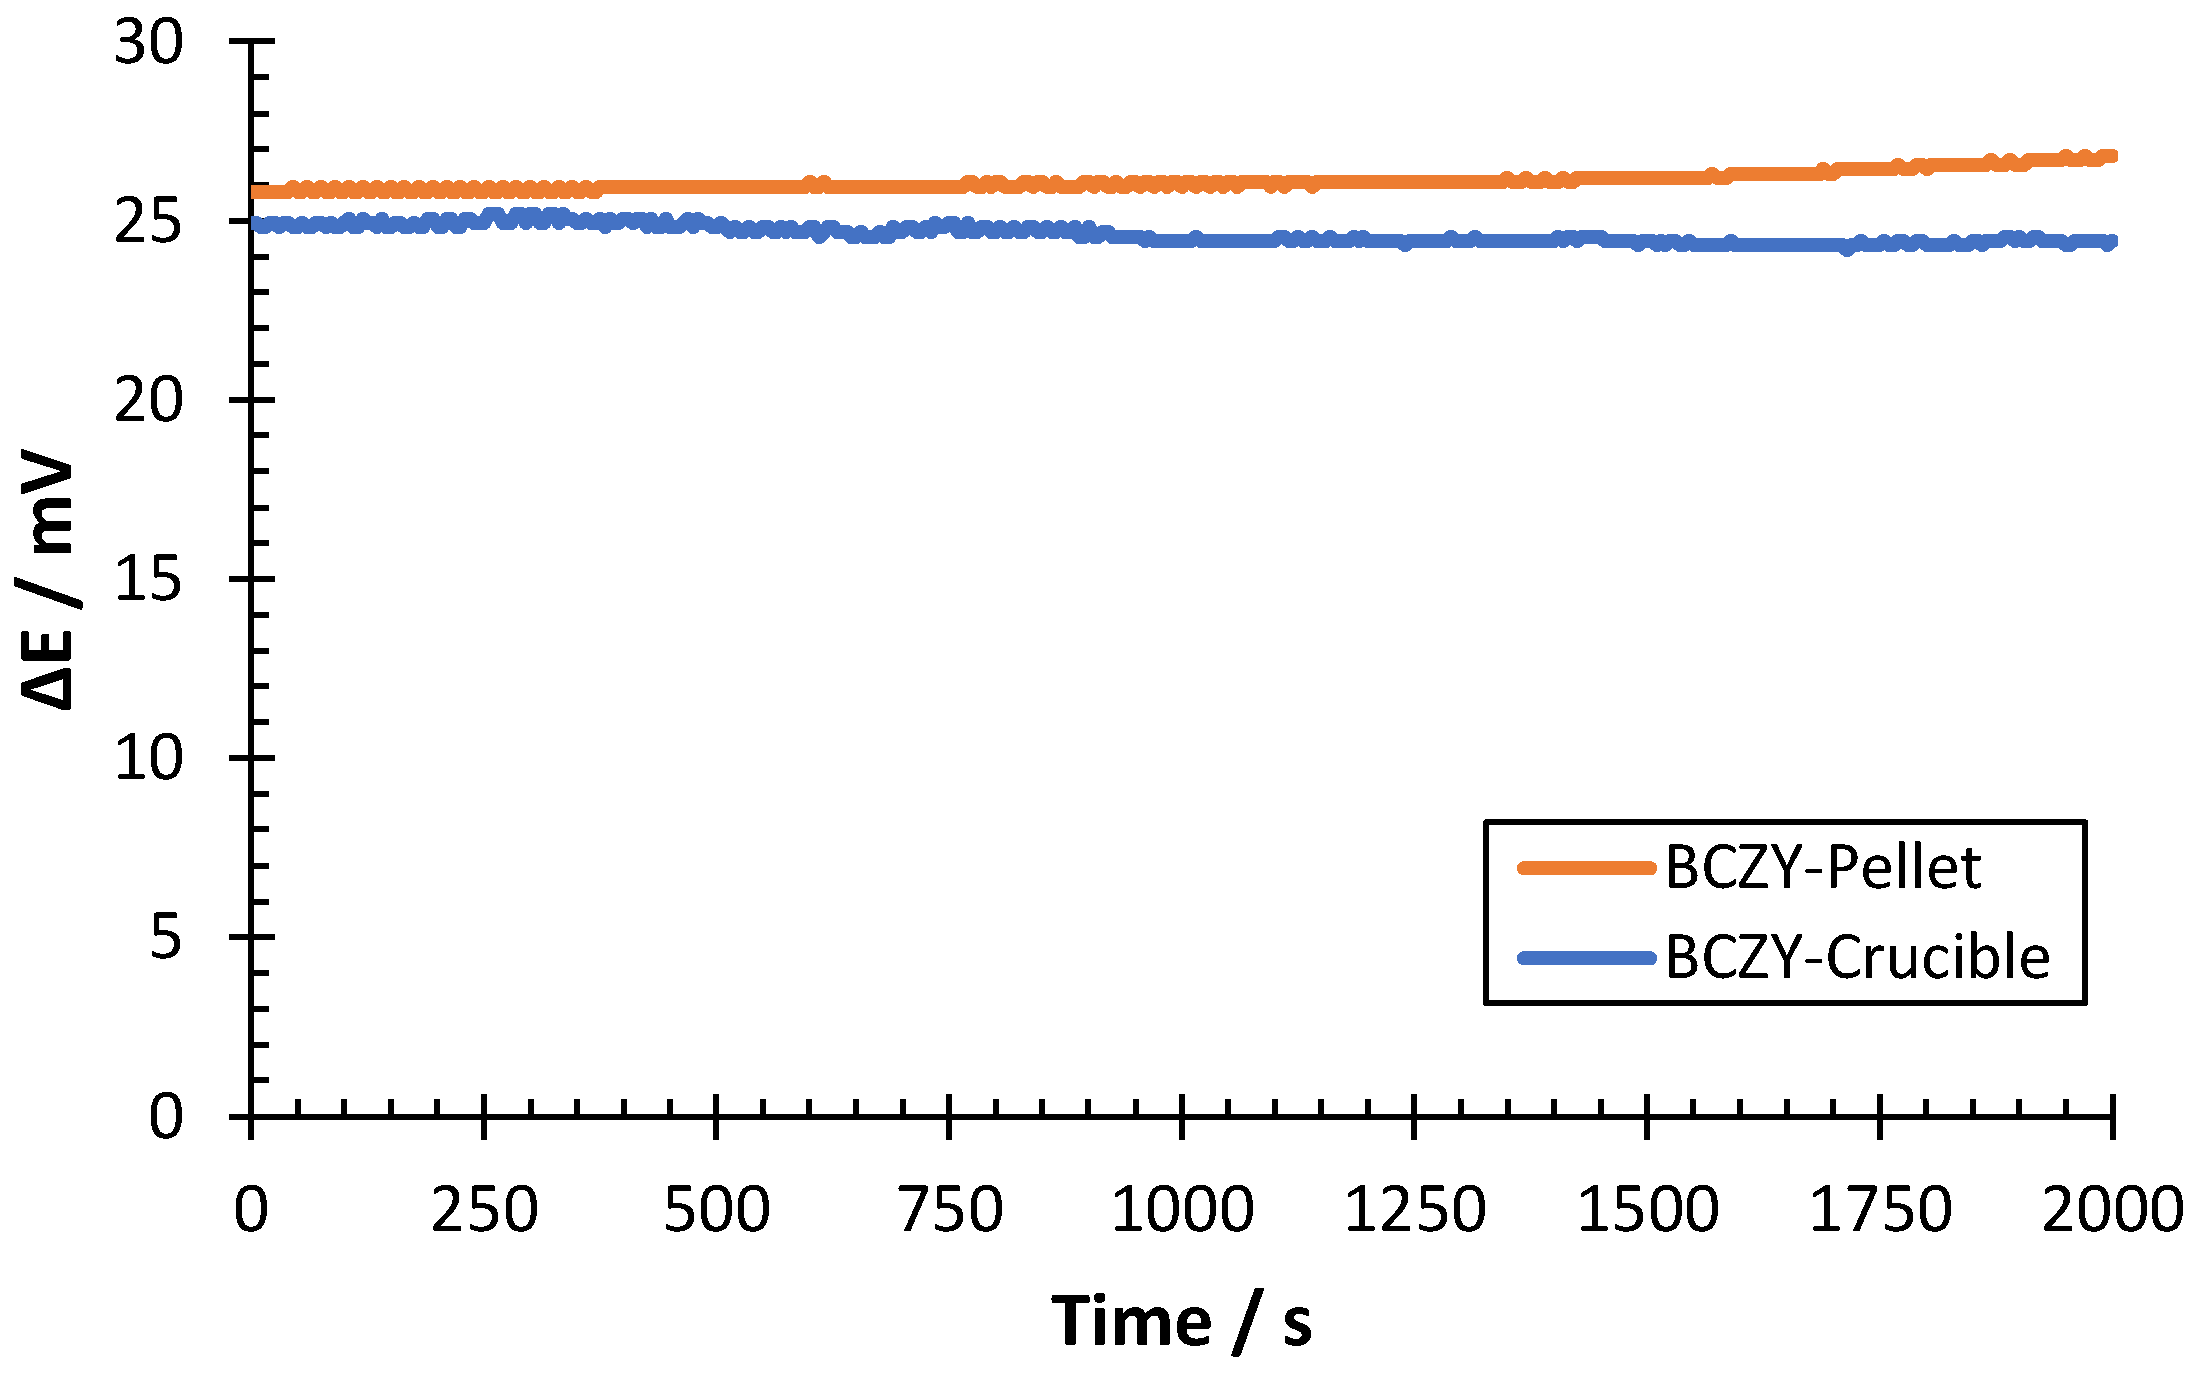
| T/°C | Sensor | Average ΔE/mV | H2 Measured/mbar | Discrepancy/% |
|---|---|---|---|---|
| 500 | BCZY-Pellet | 26.093 ± 0.502 | 0.198 ± 0.003 | −1.0 |
| BCZY-Crucible | 24.617 ± 0.500 | 0.209 ± 0.003 | +4.3 |
| Material | Geometry/Shaping Technology | Type of Sensor | Sensing Range (mbar) | Response Time (s) | Ref. |
|---|---|---|---|---|---|
| Sr(Ce0.9Zr0.1)0.95Yb0.05O3- α | Pellet/Uniaxial pressure | Amperometric | 0.2–0.8 | ~480 | [18] |
| BaCe0.6Zr0.3Y0.1O3-α | Pellet/Uniaxial pressure | Amperometric | 0.06–0.2 | ~240–360 | [18] |
| BaCe0.6Zr0.3Y0.1O3-α(Sintered at 1400 °C) | Pellet/Uniaxial pressure | Potentiometric | 0.02–0.5 | ~100 | [19] |
| BaCe0.6Zr0.3Y0.1O3-α(Sintered at 1650 °C) | Pellet/Uniaxial pressure | Potentiometric | 0.02–0.5 | ~100 | [19] |
| BaCe0.6Zr0.3Y0.1O3-α-ZnO | Pellet/Uniaxial pressure | Potentiometric (Nernstian) | 0.02–0.5 | ~100 | [19] |
| BaCe0.6Zr0.3Y0.1O3-α(BCZY-Pellet) | Pellet/3D Printing | Potentiometric (Nernstian) | 0.02–0.5 | ~100–185 | This work |
| BaCe0.6Zr0.3Y0.1O3-α(BCZY-Crucible) | Crucible/3D Printing | Potentiometric (Nernstian) | 0.02–0.5 | ~70–115 | This work |
Publisher’s Note: MDPI stays neutral with regard to jurisdictional claims in published maps and institutional affiliations. |
© 2022 by the authors. Licensee MDPI, Basel, Switzerland. This article is an open access article distributed under the terms and conditions of the Creative Commons Attribution (CC BY) license (https://creativecommons.org/licenses/by/4.0/).
Share and Cite
Hinojo, A.; Lujan, E.; Nel-lo, M.; Abella, J.; Colominas, S. Potentiometric Hydrogen Sensor with 3D-Printed BaCe0.6Zr0.3Y0.1O3-α Electrolyte for High-Temperature Applications. Sensors 2022, 22, 9707. https://doi.org/10.3390/s22249707
Hinojo A, Lujan E, Nel-lo M, Abella J, Colominas S. Potentiometric Hydrogen Sensor with 3D-Printed BaCe0.6Zr0.3Y0.1O3-α Electrolyte for High-Temperature Applications. Sensors. 2022; 22(24):9707. https://doi.org/10.3390/s22249707
Chicago/Turabian StyleHinojo, Antonio, Enric Lujan, Marc Nel-lo, Jordi Abella, and Sergi Colominas. 2022. "Potentiometric Hydrogen Sensor with 3D-Printed BaCe0.6Zr0.3Y0.1O3-α Electrolyte for High-Temperature Applications" Sensors 22, no. 24: 9707. https://doi.org/10.3390/s22249707
APA StyleHinojo, A., Lujan, E., Nel-lo, M., Abella, J., & Colominas, S. (2022). Potentiometric Hydrogen Sensor with 3D-Printed BaCe0.6Zr0.3Y0.1O3-α Electrolyte for High-Temperature Applications. Sensors, 22(24), 9707. https://doi.org/10.3390/s22249707