Non-Destructive Detection of Abnormal Chicken Eggs by Using an Optimized Spectral Analysis System
Abstract
:1. Introduction
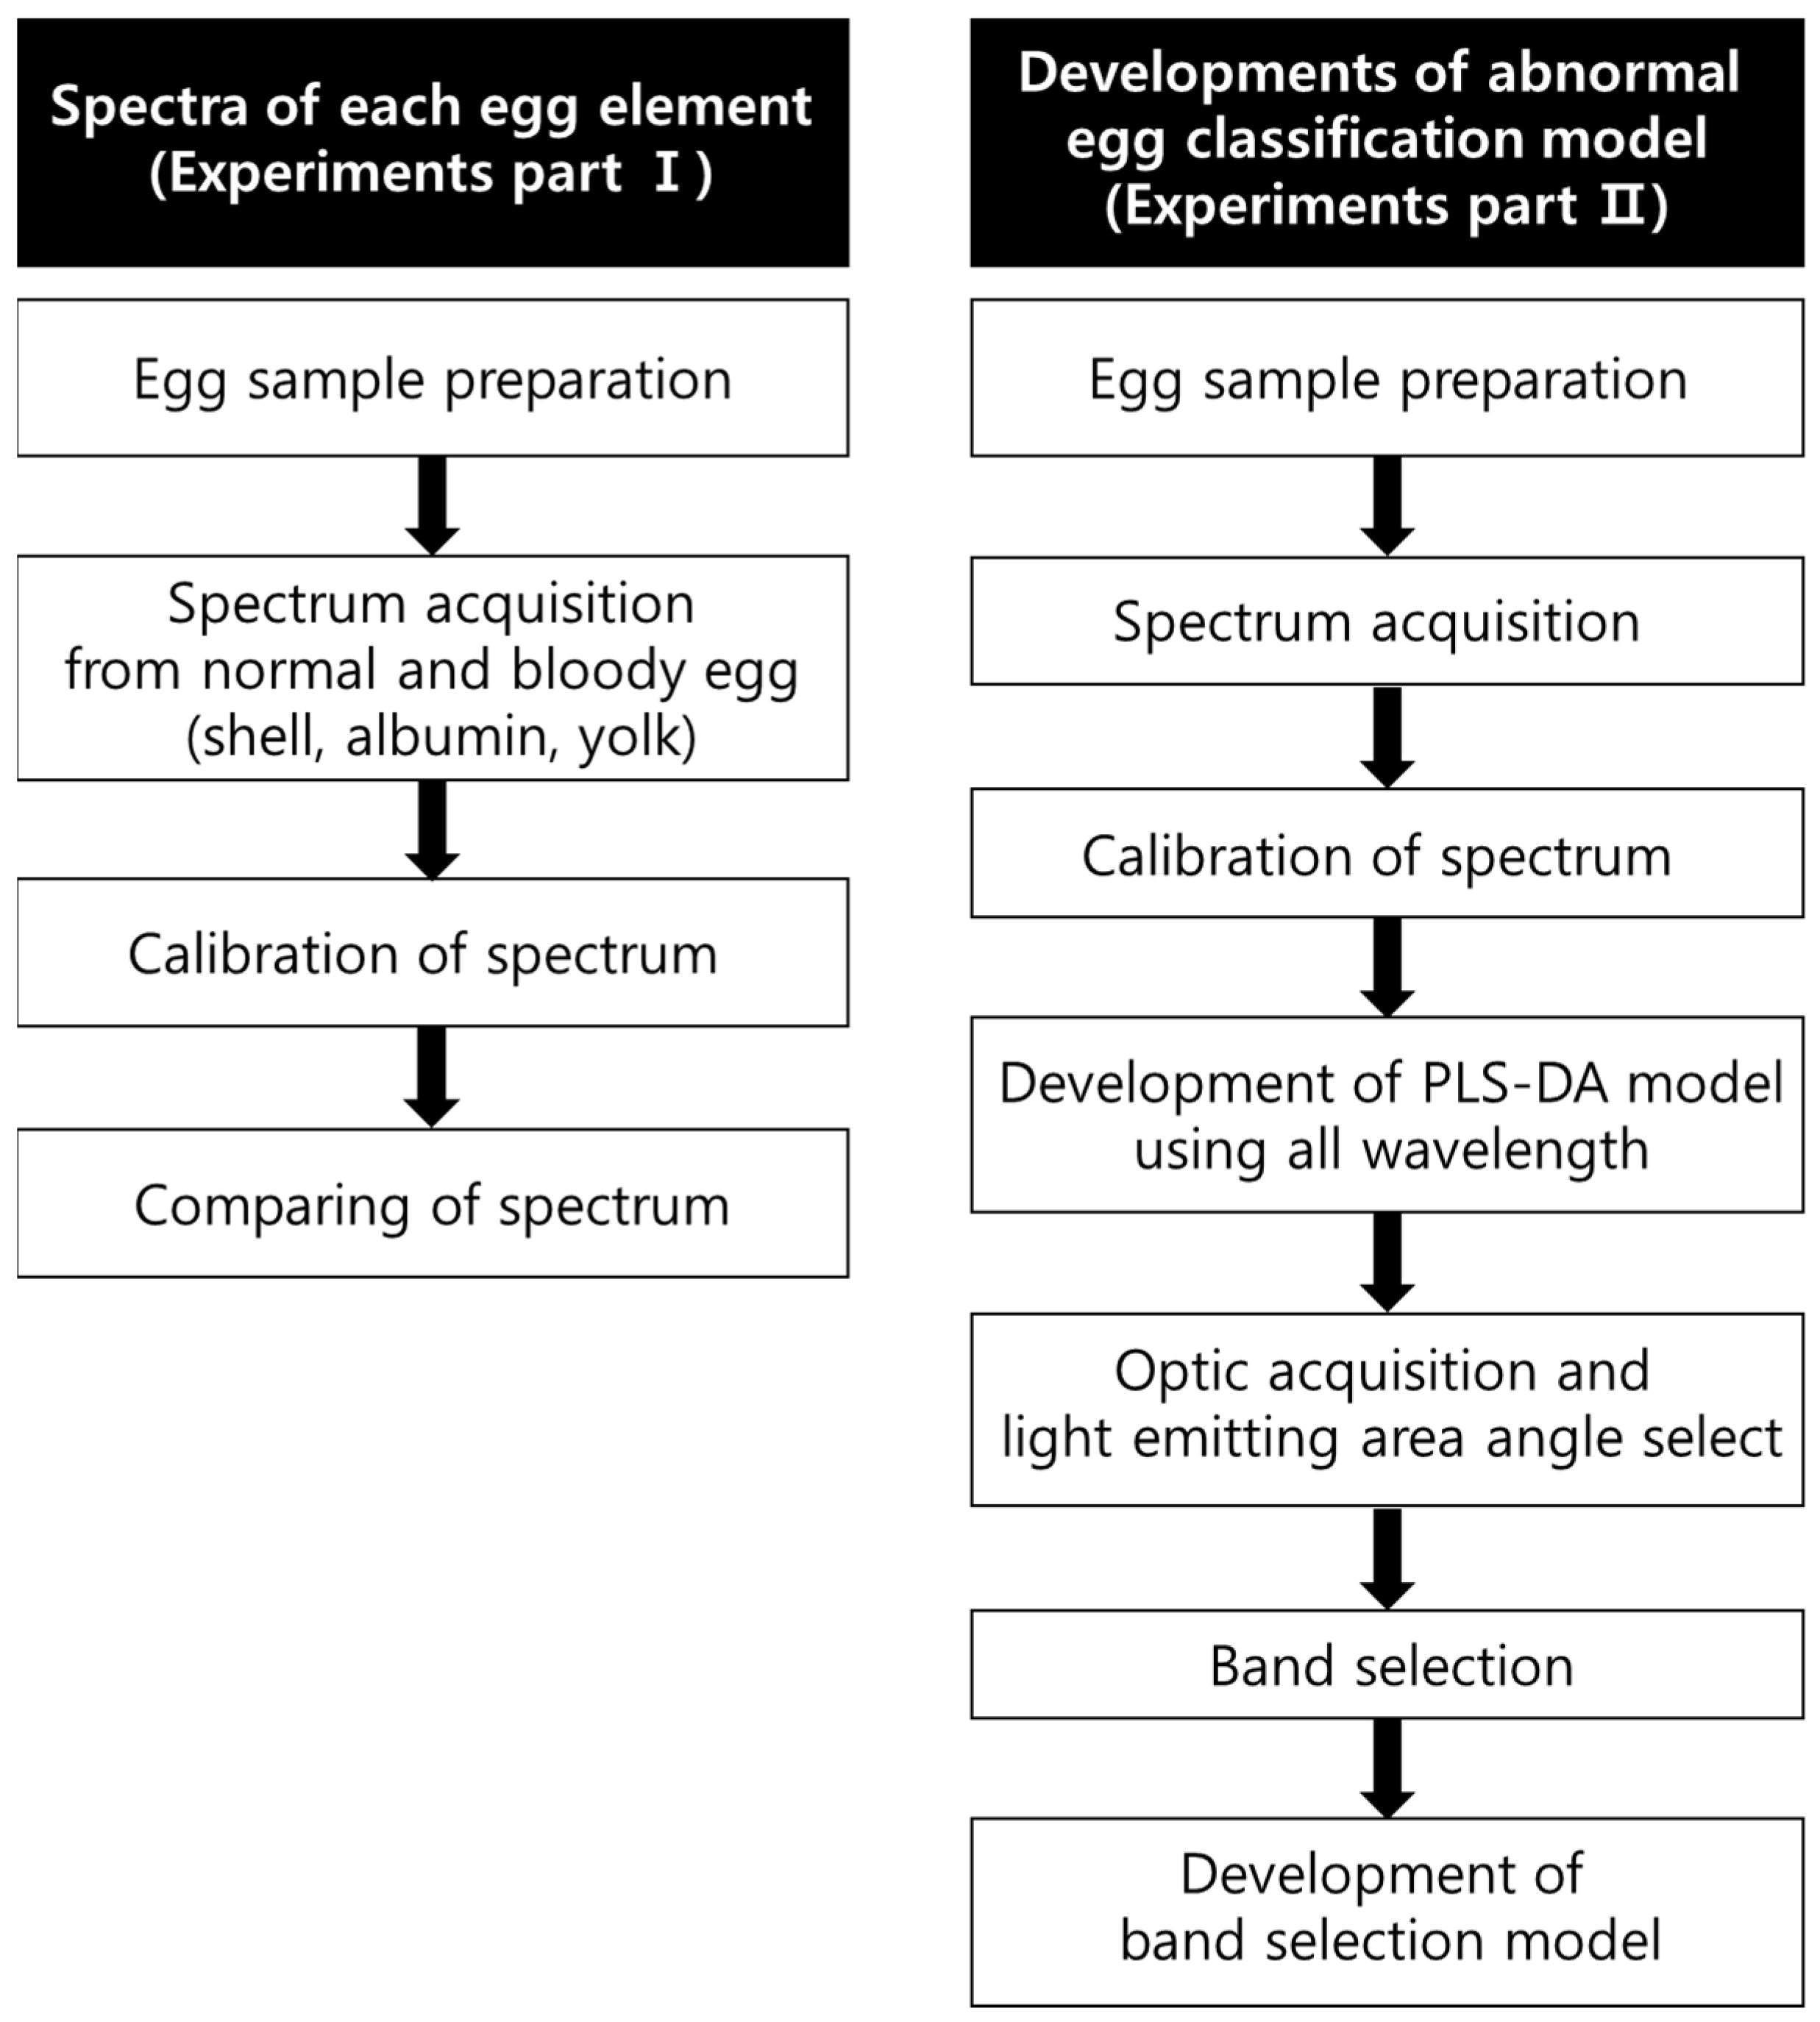
2. Materials and Methods
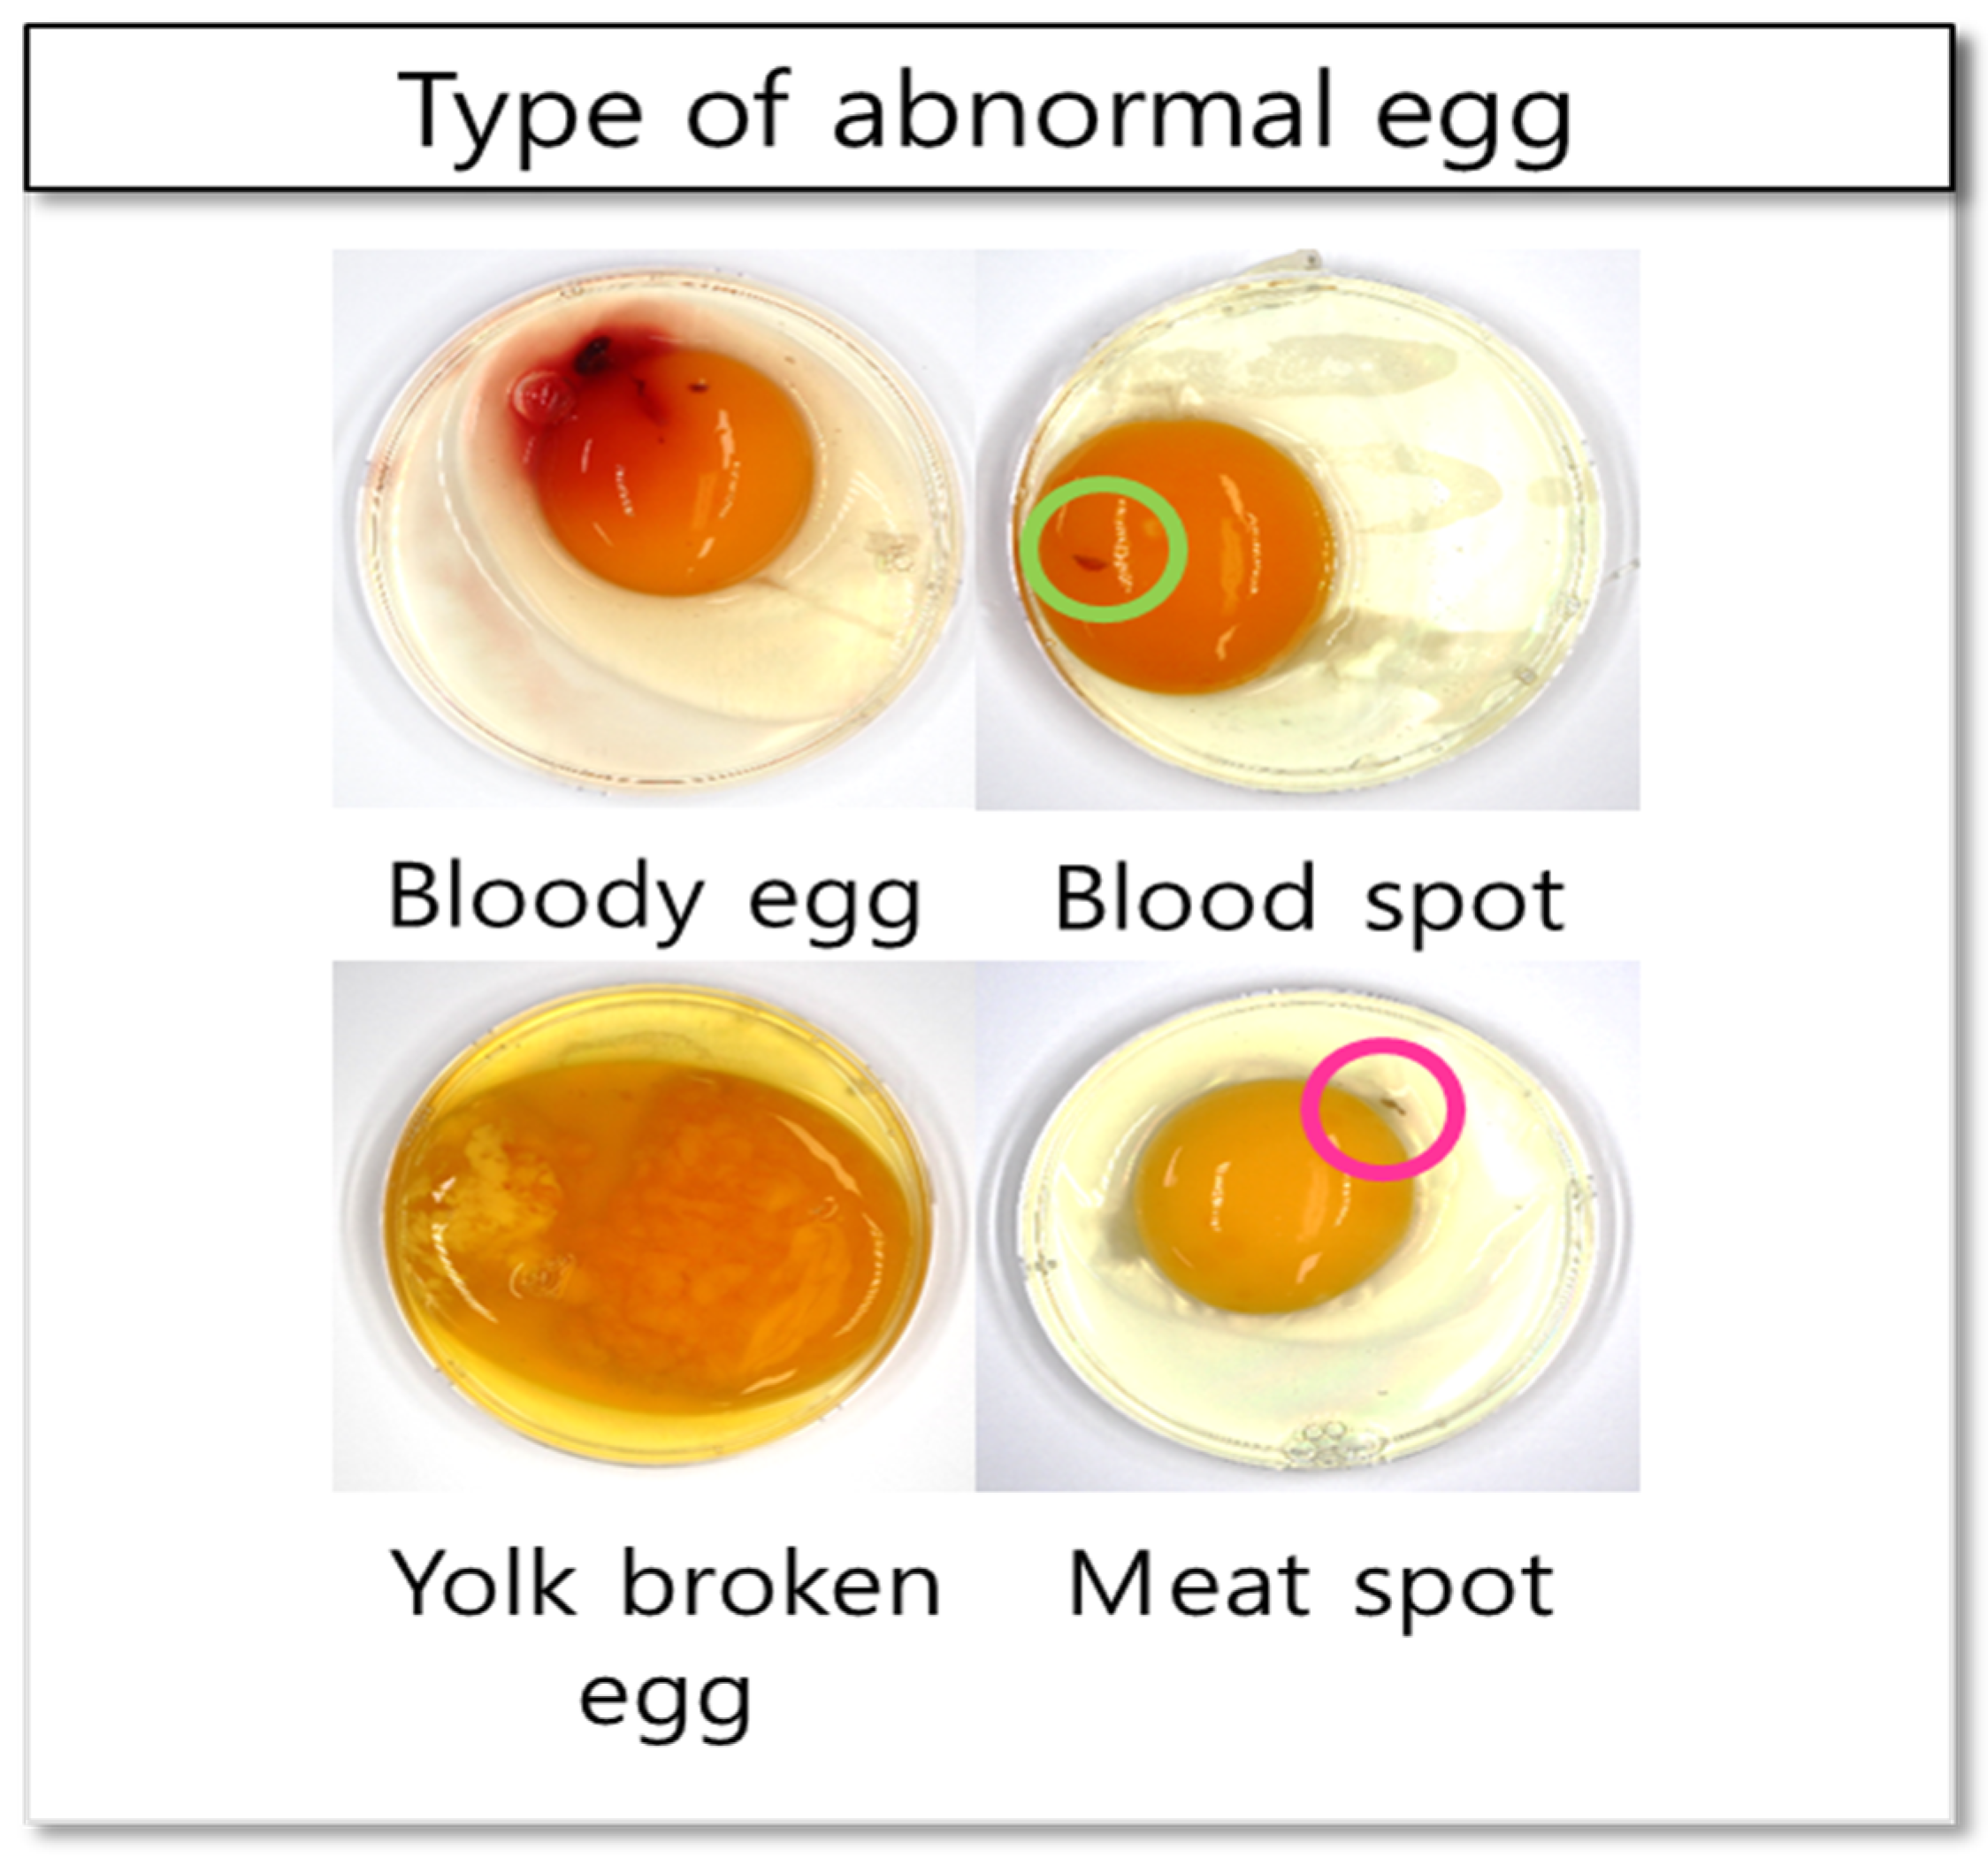
2.1. Sample Preparation
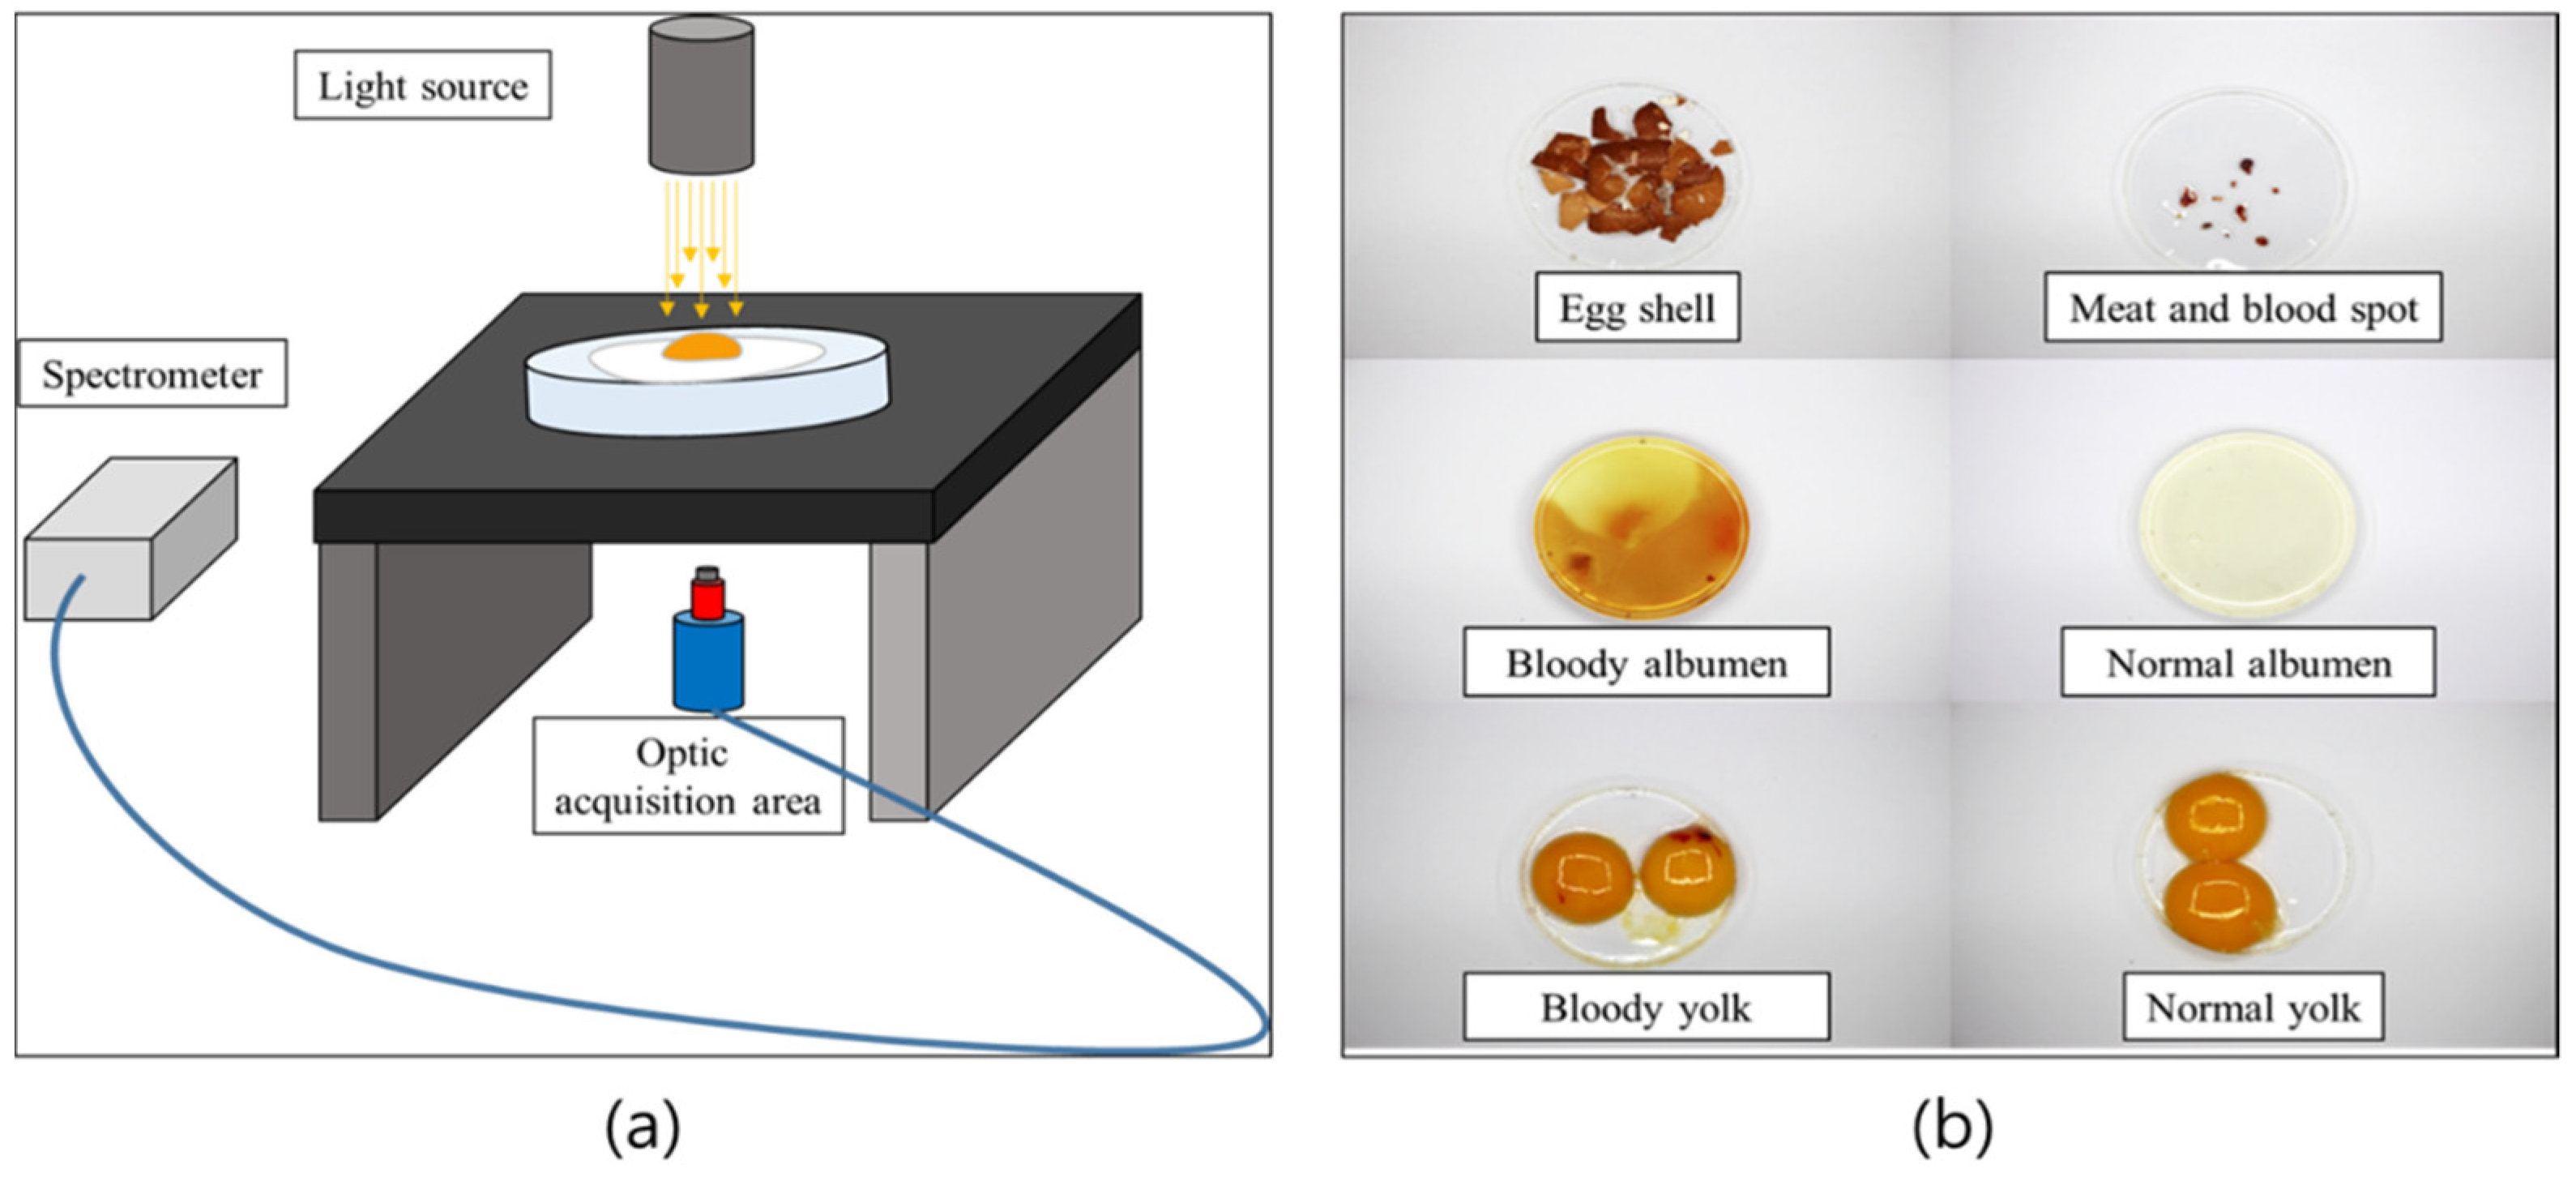
2.2. Hardware Setup
2.3. Spectral Acquisition
2.4. Intensity Calibration
2.5. Data Preprocessing
2.6. Model Development
2.7. Waveband Selection Methods
2.7.1. Weighted Regression Coefficient (WRC)
2.7.2. Sequential Feature Selection (SFS)
2.7.3. Successive Projection Algorithm (SPA)
2.7.4. Stepwise Regression (SR)
2.8. Model Performance Assessment
3. Results and Discussion
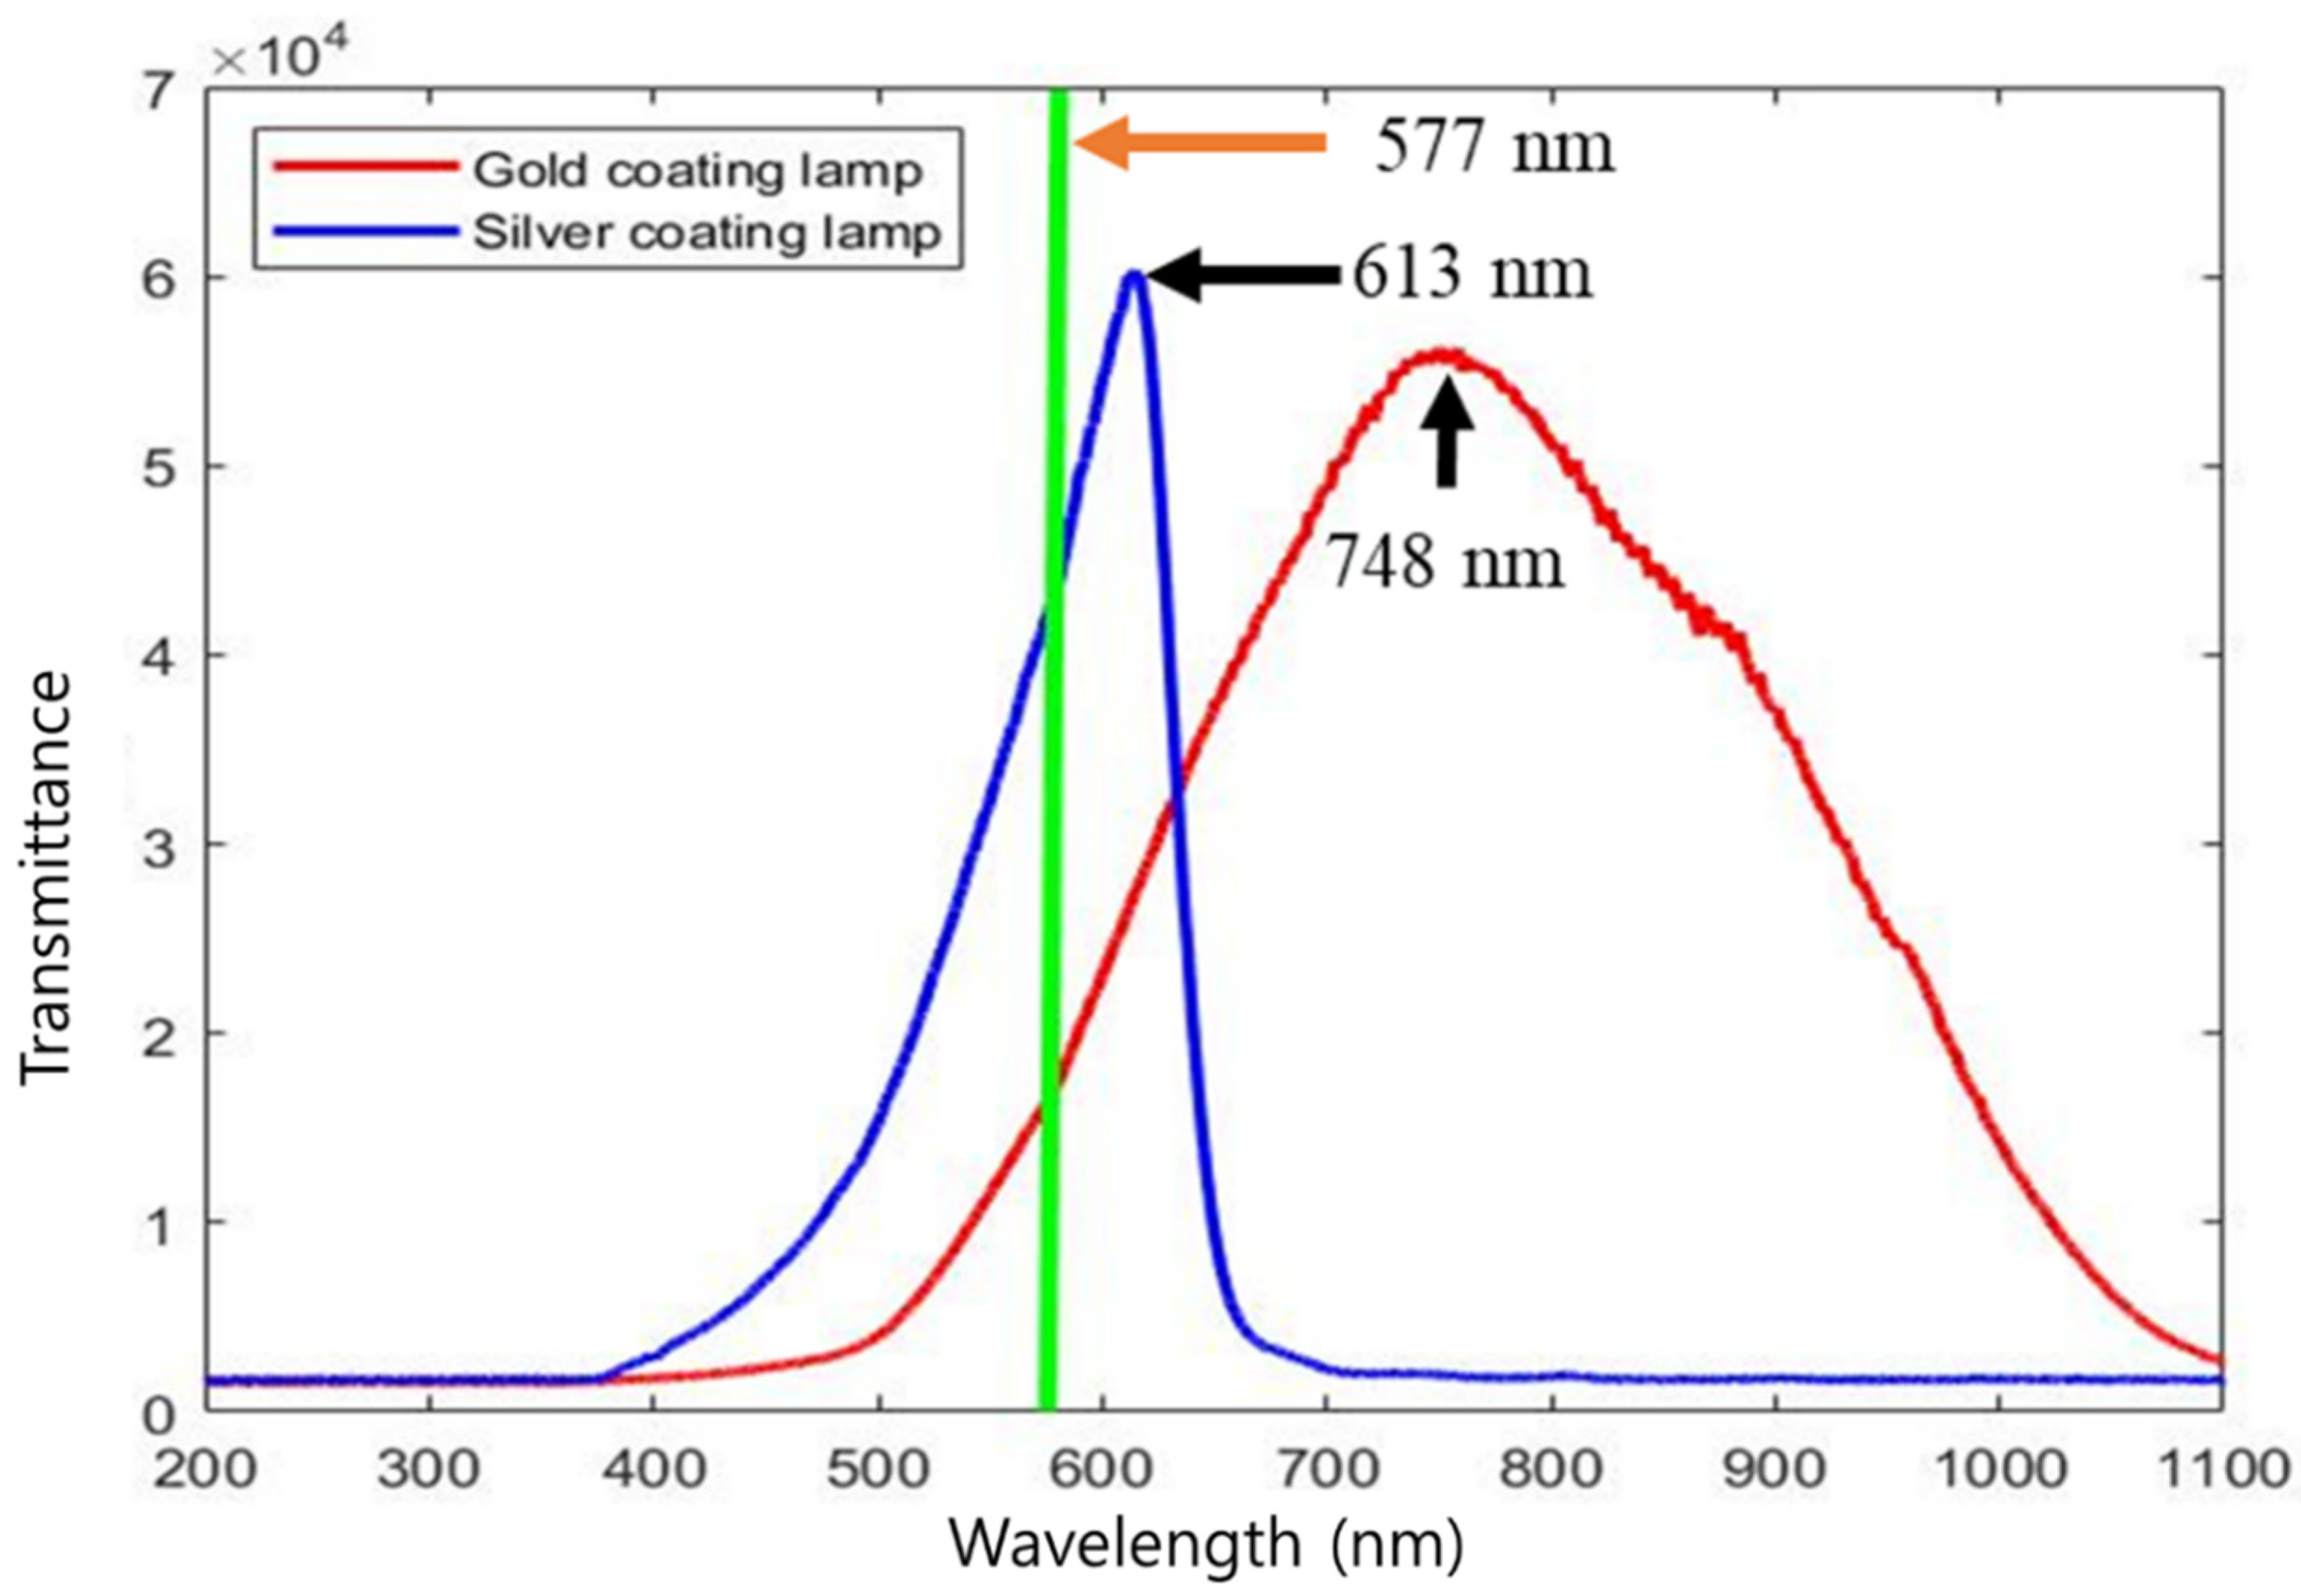
3.1. Illumination Optimization
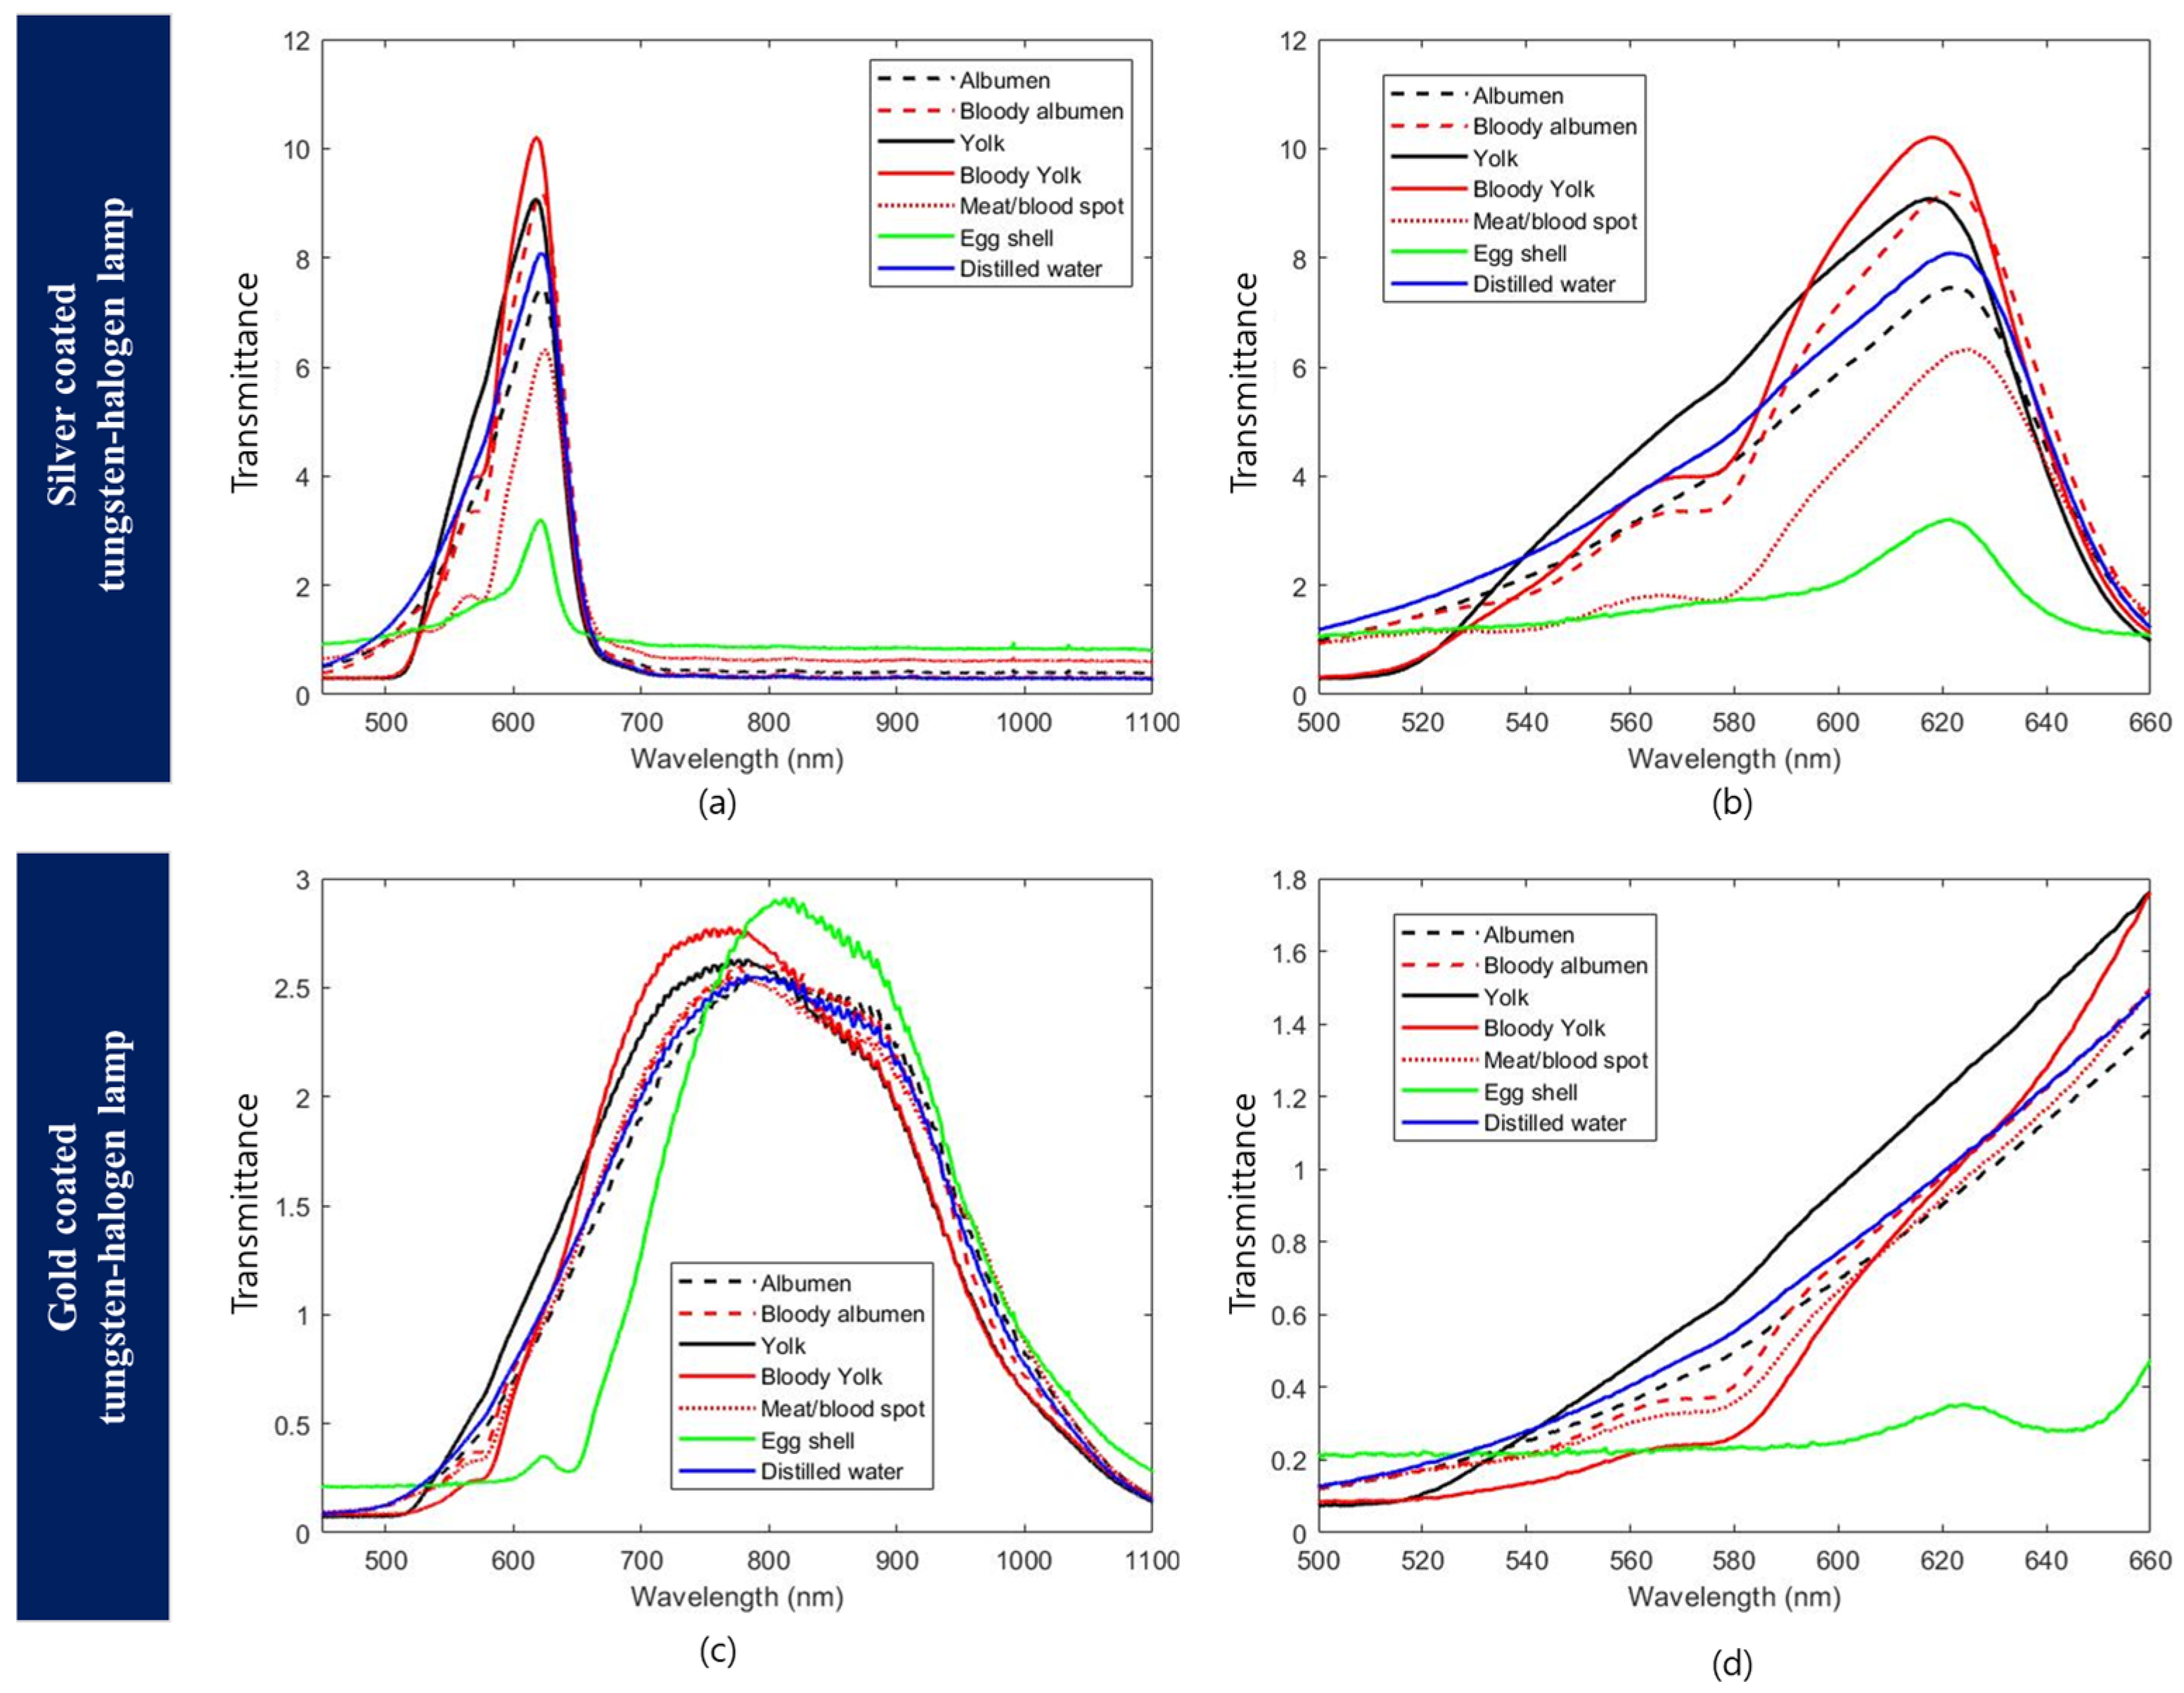
3.2. Egg Component Spectra
3.3. Abnormal Egg Detection Model
3.3.1. Raw Data Spectra
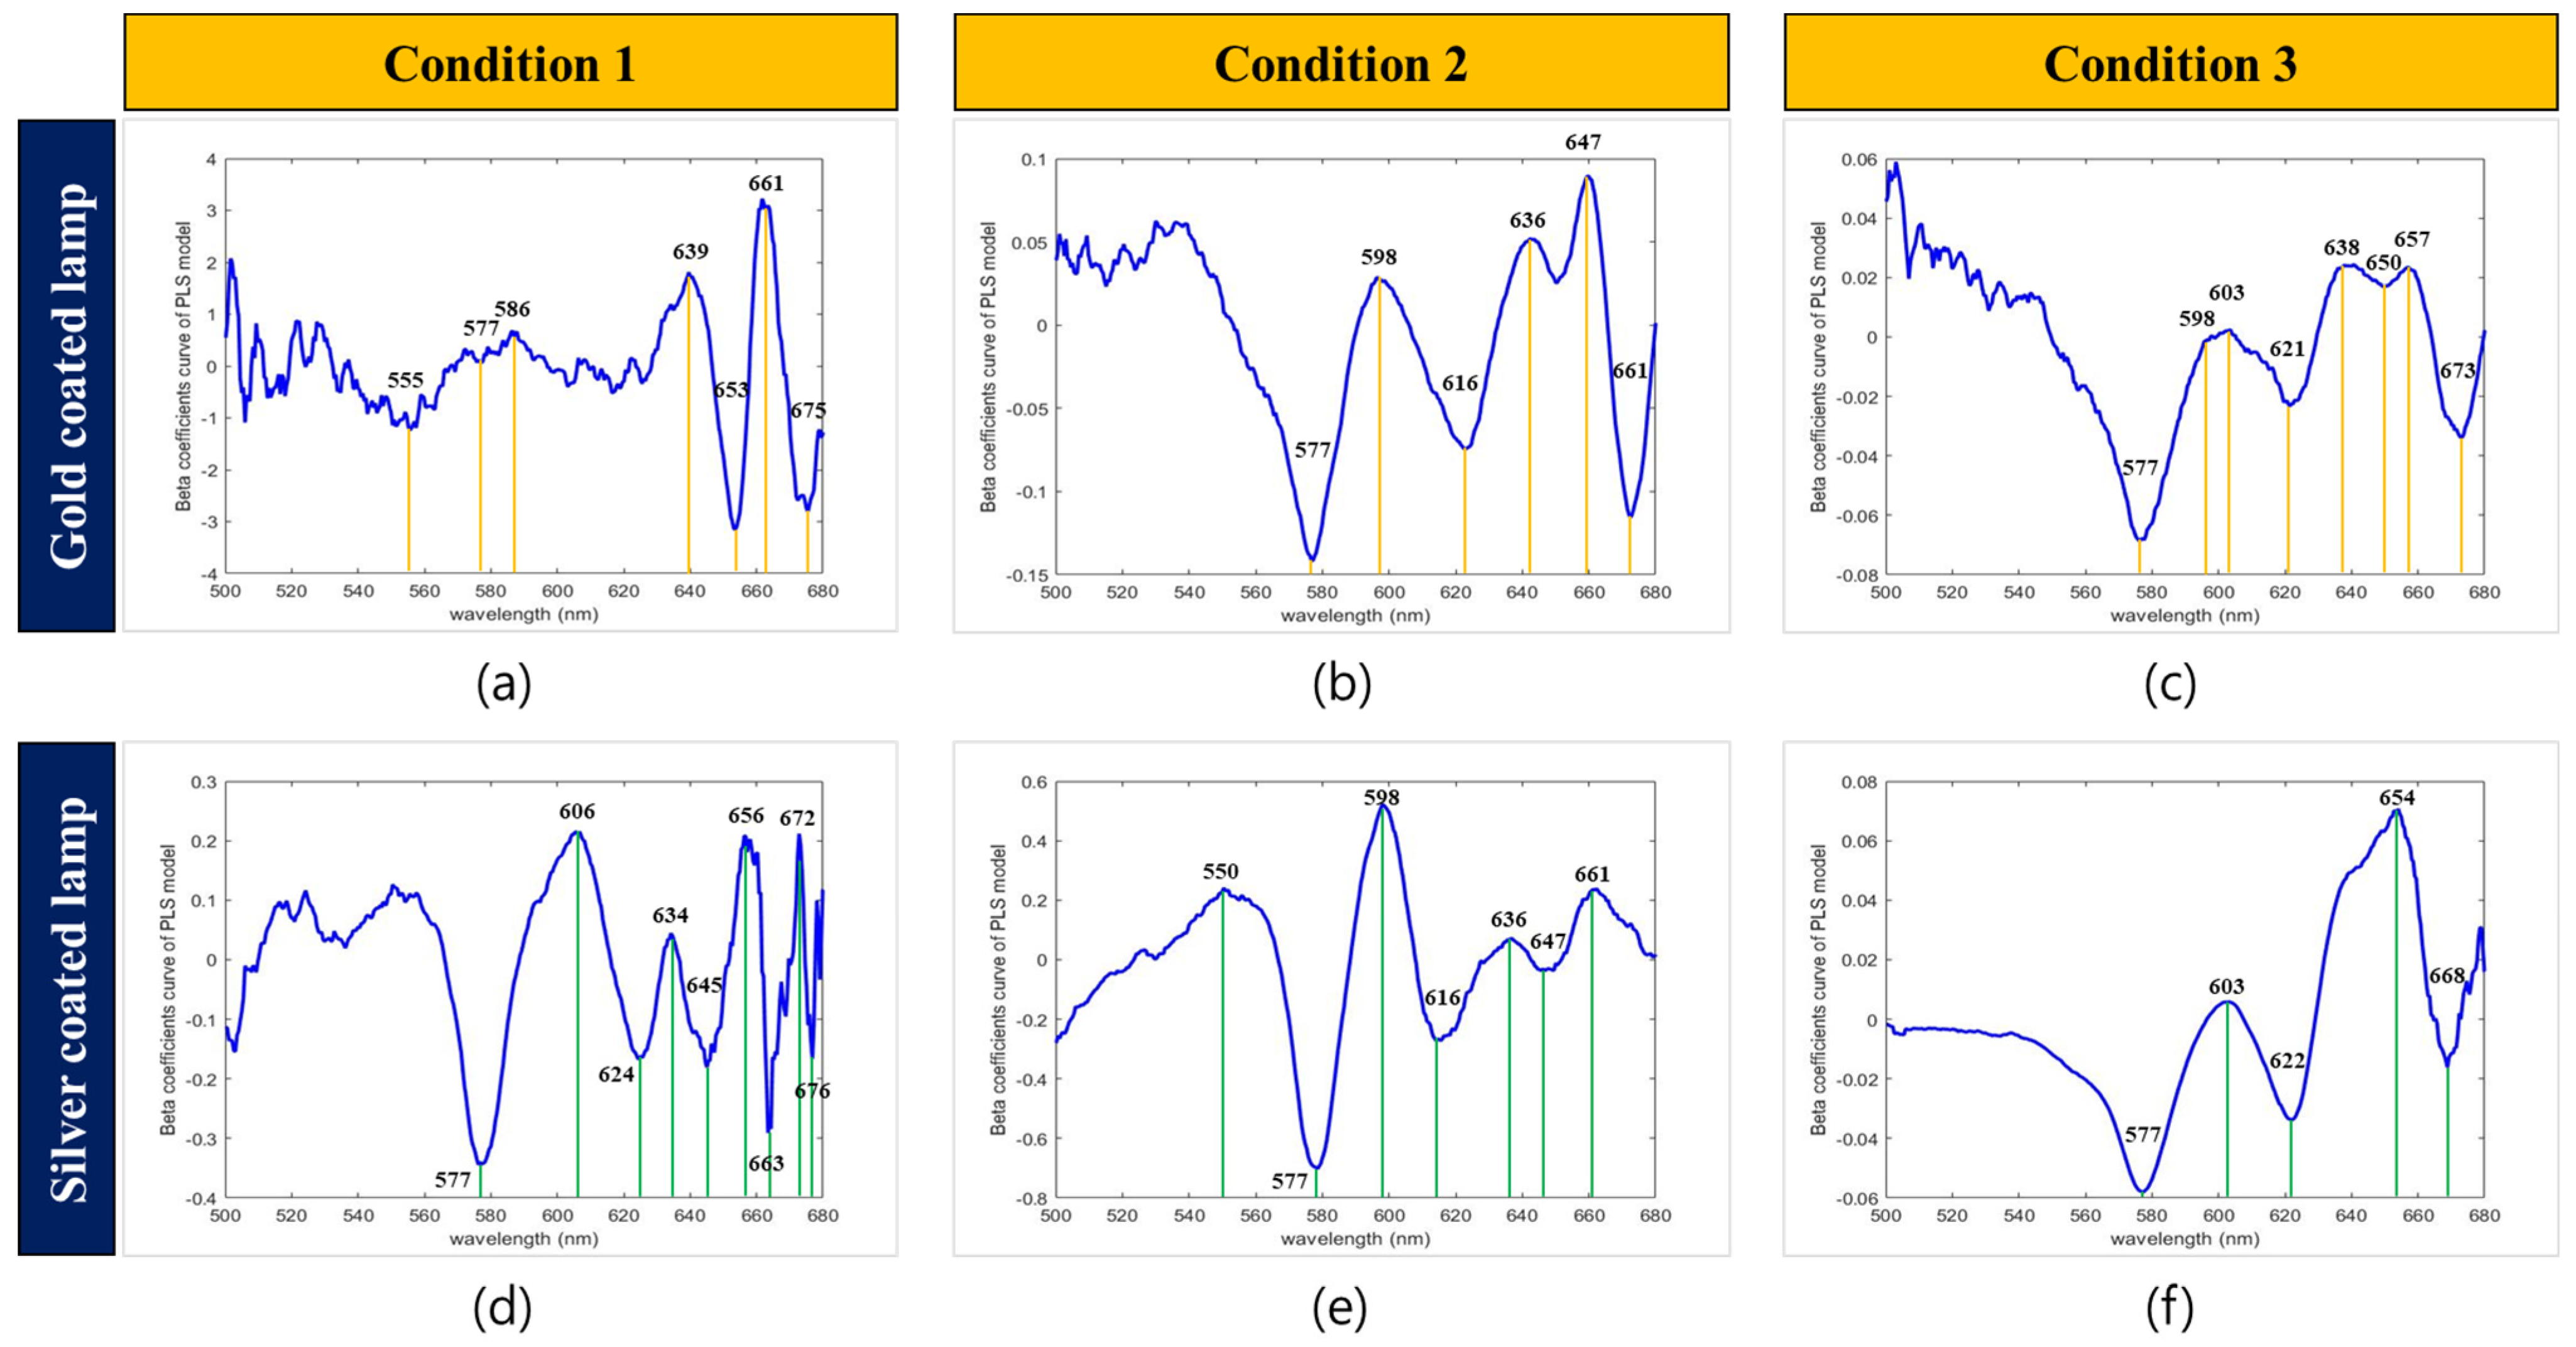
3.3.2. Model Based on All Wavebands
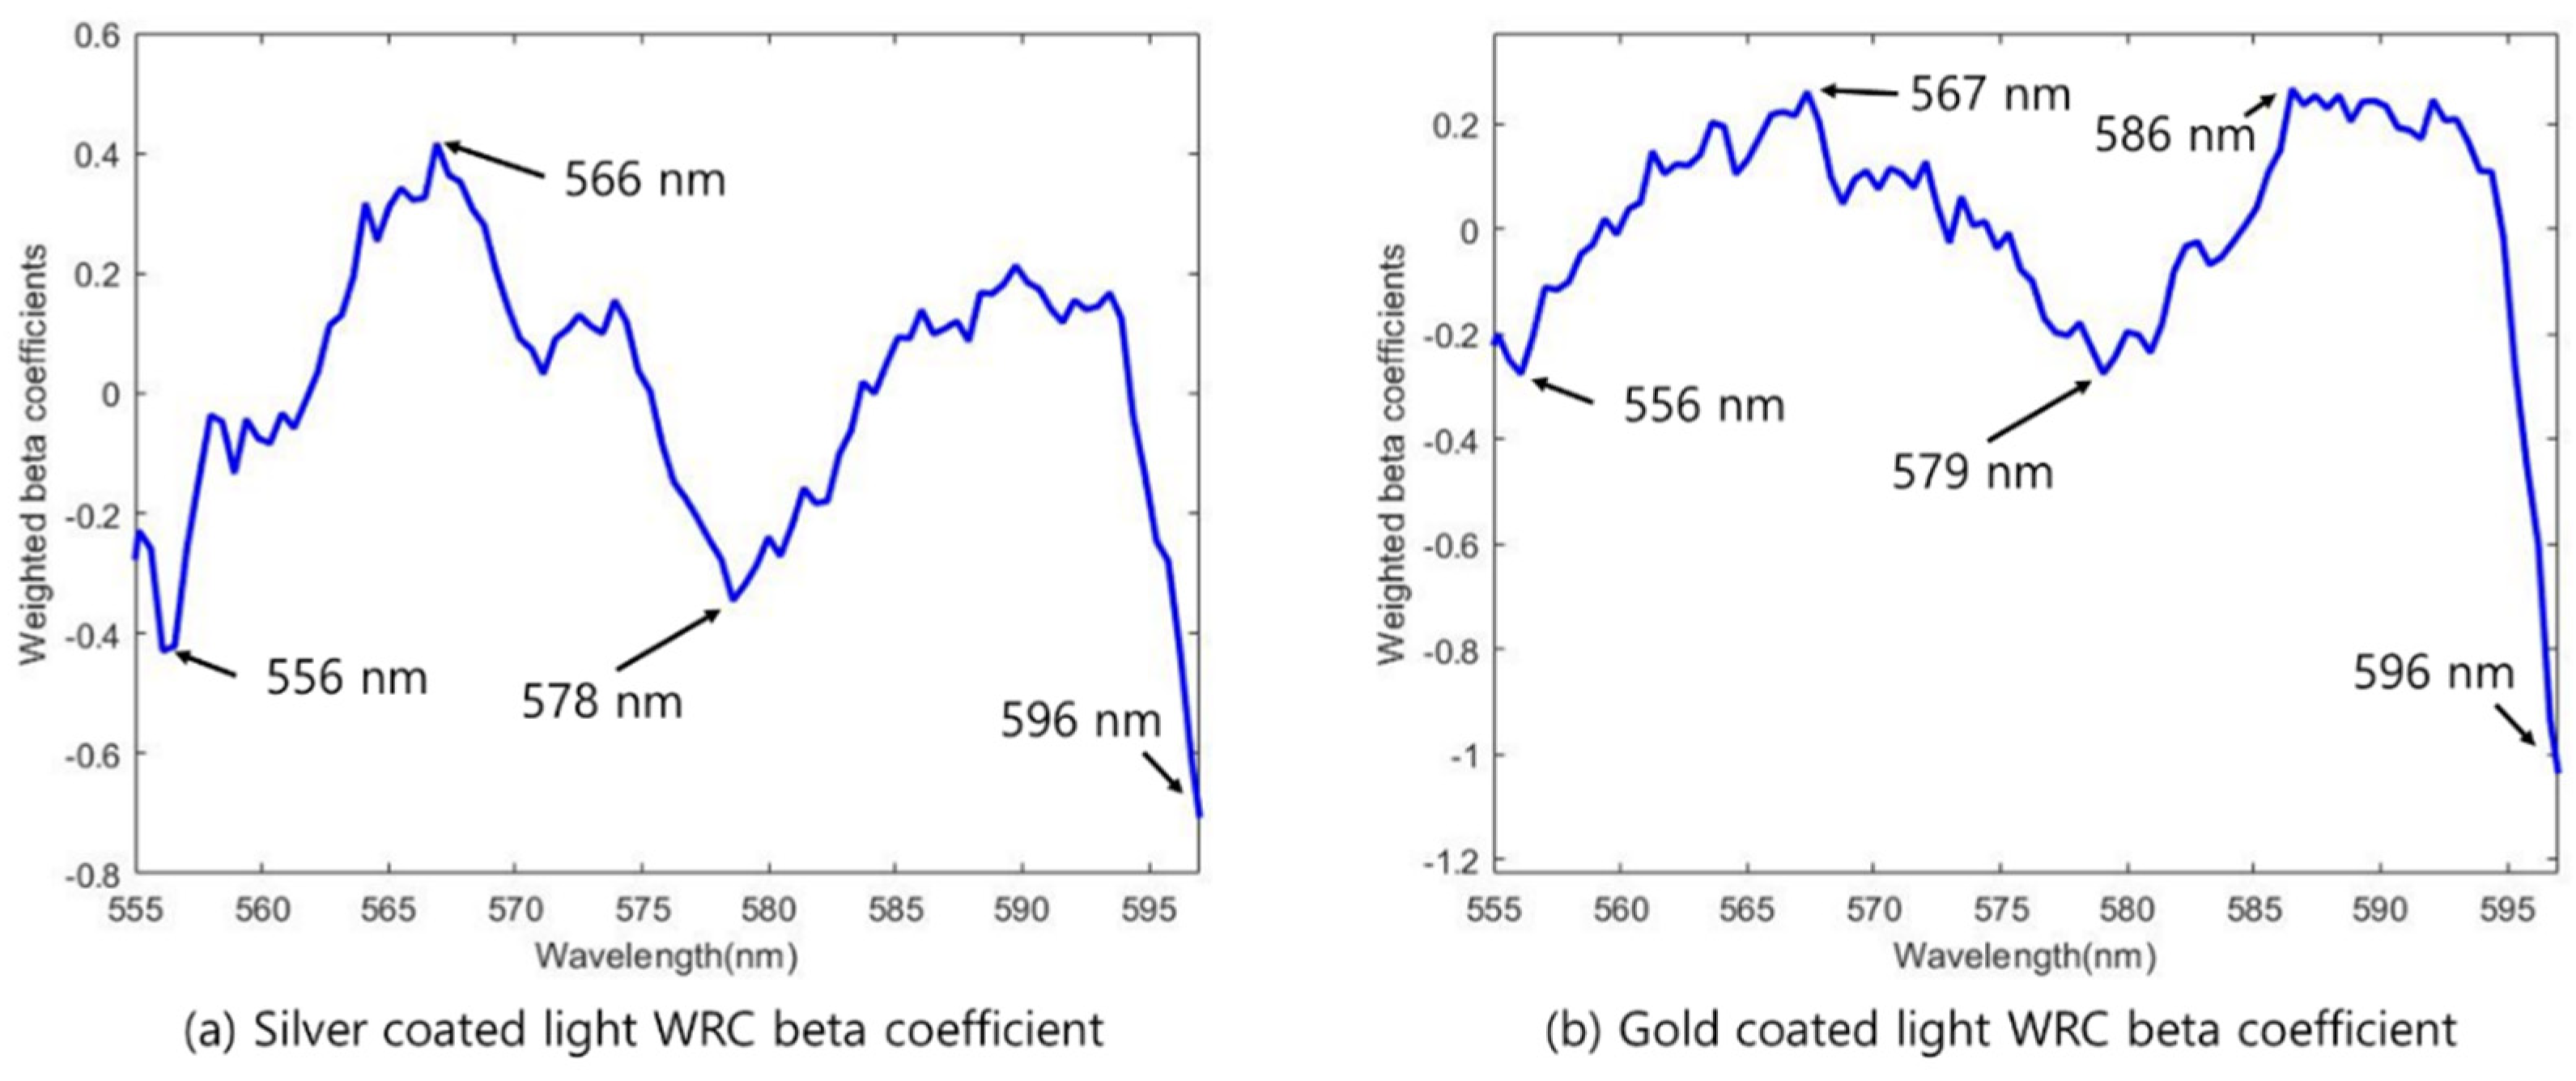
3.3.3. Model Based on Selected Wavebands
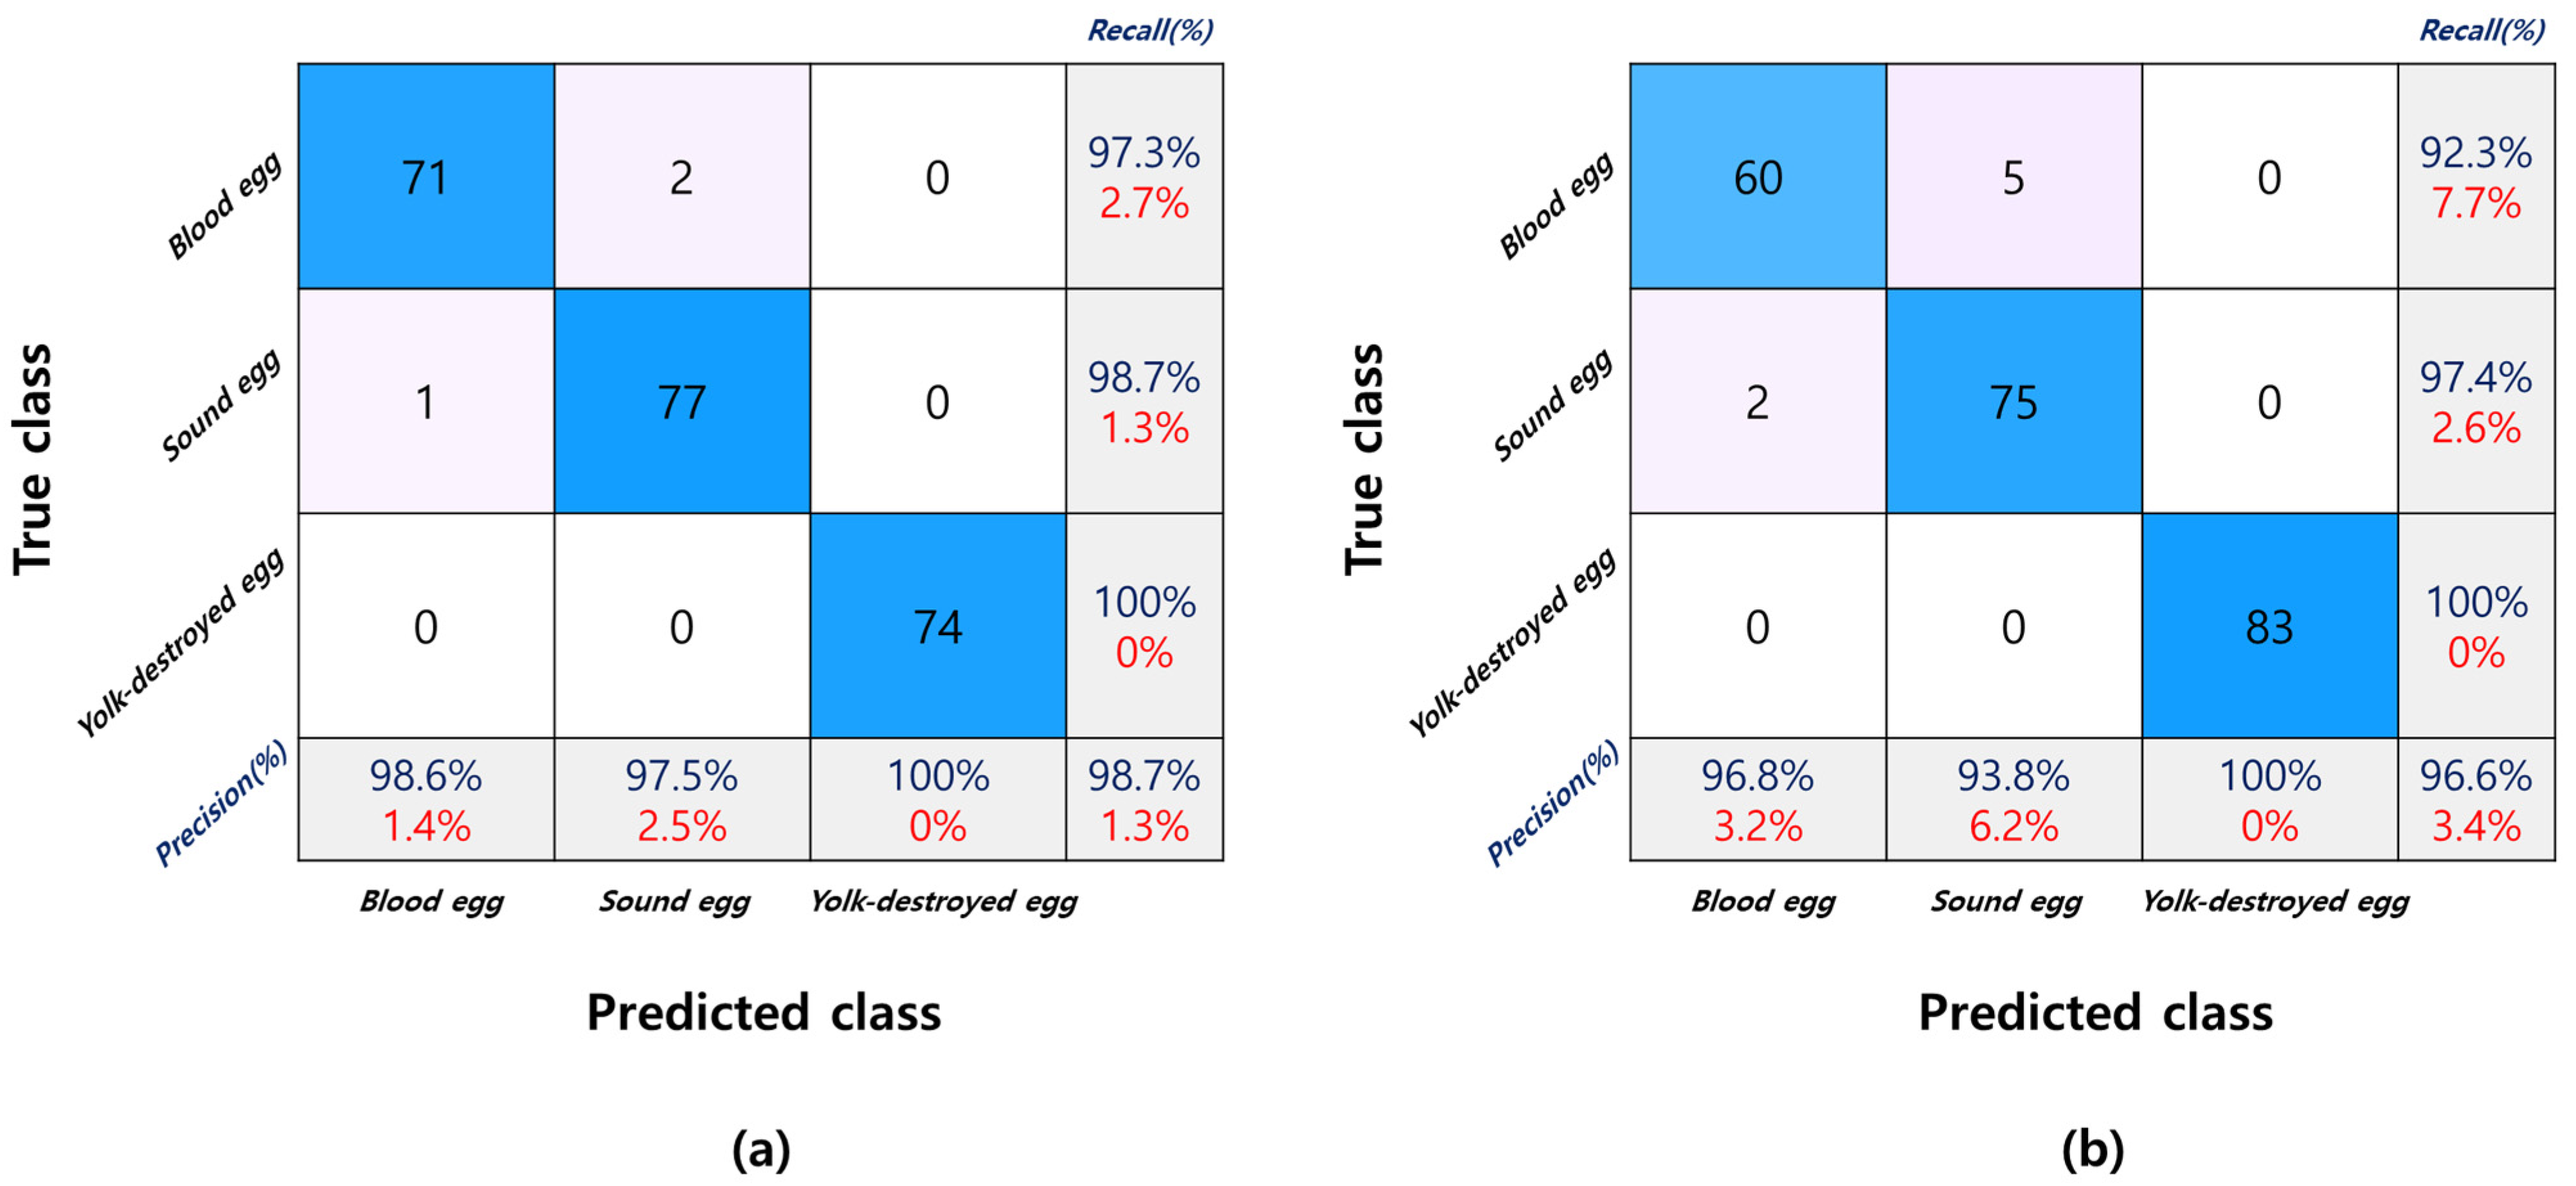
3.3.4. Model Performance
4. Conclusions
Author Contributions
Funding
Institutional Review Board Statement
Informed Consent Statement
Data Availability Statement
Conflicts of Interest
References
- De Ketelaere, B.; Mertens, K.; Kemps, B.; Bamelis, F.; Decuypere, E.; De Baerdemaker, J. Improved blood detection in consumption eggs using combined reflection-transmission spectroscopy. In Proceedings of the XIth European Symposium on the Quality of Eggs and Egg Products, Doorwerth, The Netherlands, 23–26 May 2005. [Google Scholar]
- Wolc, A.; Arango, J.; Settar, P.; O’sullivan, N.P.; Olori, V.E.; White, I.M.S.; Hill, W.G.; Dekkers, J.C.M. Genetic parameters of egg detects and egg quality in layer chickens. Poult. Sci. 2012, 96, 1292–1298. [Google Scholar] [CrossRef] [PubMed]
- Kim, D.J.; Kim, D.H.; Kang, S.J.; Kwon, K.M.; Lee, J.C.; Lee, K.W. Effects of age of laying hens on internal and external quality of eggs. Korean J. Poult. Sci. 2018, 45, 63–71. [Google Scholar] [CrossRef] [Green Version]
- Campo, J.L.; Garcia, G.M. Internal inclusions in brown eggs: Relationships with fearfullness and stress. Poult. Sci. 1998, 77, 1743–1747. [Google Scholar] [CrossRef]
- Lee, S.K. Egg quality and storage method. In Chicken and Egg Science, 1st ed.; Cheon, S.B., Ed.; Yu Han Mun Hwa Sa: Seoul, Republic of Korea, 2016; pp. 281–312. [Google Scholar]
- Richard, M.P.; Poch, S.M.; Coon, C.N.; Rosebrough, R.W.; Ashwell, C.; McMurtry, J.P. Feed restriction significantly alters lipogenic gene expression in broiler breeder chickens. J. Nutr. 2003, 133, 707–715. [Google Scholar] [CrossRef] [Green Version]
- Omid, M.; Soltani, M.; Dehrouyeh, M.H.; Mohtasebi, S.S.; Ahmadi, H. An expert egg grading system based on machine vision and artificial intelligence techniques. J. Food Eng. 2013, 118, 70–77. [Google Scholar] [CrossRef]
- Lee, H.S.; Kim, D.Y.; Kandpal, L.M.; Lee, S.D.; Mo, C.; Hong, S.J.; Cho, B.K. Development of nondestructive sorting method for brown bloody eggs using VIS/NIR spectroscopy. J. Korean Soc. Nondestruct. Test. 2014, 34, 51–57. [Google Scholar]
- Chen, M.; Zhang, L.; Xu, H. On-line detection of blood spot introduced into brown-shell eggs using visible absorbance spectroscopy. Biosyst. Eng. 2015, 131, 95–101. [Google Scholar] [CrossRef]
- Feng, Z.; Ding, C.; Li, W.; Cui, D. Detection of blood spots in eggs by hyperspectral transmittance imaging. IJABE 2019, 12, 209–214. [Google Scholar] [CrossRef]
- Kennedy, G.Y.; Vevers, H.G. Eggshell pigments of the Araucano fowl. Comp. Biochem. Physiol. Part B Comp. Biochem. 1973, 44, 11–25. [Google Scholar] [CrossRef]
- Miksik, I.; Holan, V.; Deyl, Z. Avian eggshell pigments and their variability. Comp. Biochem. Physiol. B 1996, 113, 607–612. [Google Scholar] [CrossRef]
- Liu, S.C.; Huang, J.F.; Sun, T.J.; Lee, S.R.; Wang, C.T. The inheritance of blue eggshell in Brown Tsaiya. J. Taiwan Livest. Res. 1998, 31, 373–382. [Google Scholar]
- Brant, A.W.; Norris, K.H.; Chin, G. A spectrophotometric method for detecting blood in white-shell eggs. Poult. Sci. 1953, 32, 357–363. [Google Scholar] [CrossRef]
- Uyeh, D.; Kim, J.; Lohumi, S.; Park, T.S.; Cho, B.K.; Woo, S.; Lee, W.S.; Ha, Y. Rapid and non-destructive monitoring of moisture content in livestock feed using a global hyperspectral mode. Animals 2022, 11, 1299. [Google Scholar] [CrossRef] [PubMed]
- Rinnan, Å.; van den Berg, F.; Engelsen, S.B. Review of the most common pre-processing techniques for near-infrared spectra. TrAC 2009, 28, 1201–1222. [Google Scholar] [CrossRef]
- Bonifazi, G.; Palmeieri, R.; Serranti, S. Short wave infrared hyperspectral imaging for recovered post-consumer single and mixed polymers characterization. In Image Sensors and Imaging Systems; SPIE: San Francisco, CA, USA, 2015; Volume 9403, pp. 165–176. [Google Scholar]
- Barnes, R.J.; Dhanoa, M.S.; Lister, S.J. Standard normal variate transformation and de-trending of near-infrared diffuse reflectance spectra. Appl. Spectrosc. 1989, 43, 772–777. [Google Scholar] [CrossRef]
- Martens, H.; Naes, T. Multivariate Calibration; John Wiley & Sons: Hoboken, NJ, USA, 1992. [Google Scholar]
- Savitzky, A.; Golay, M. Smoothing and differentiation of data by simplified least squares procedures. Anal. Chem. 1964, 36, 1627–1639. [Google Scholar] [CrossRef]
- Kamruzzaman, M.; Elmasry, G.; Sun, D.W.; Allen, P. Non-destructive prediction and visualization of chemical composition in lamb meat using NIR hyperspectral imaging and multivariate regression. Innov. Food Sci. Emerg. Technol. 2012, 16, 218–226. [Google Scholar] [CrossRef]
- Al Ghayab, H.R.; Li, Y.; Abdulla, S.; Diykh, M.; Wan, X. Classification of epileptic EEG signals based on simple random sampling and sequential feature selection. Brain Inform. 2016, 3, 85–91. [Google Scholar] [CrossRef] [Green Version]
- Hu, F.; Zhou, M.; Yan, P.; Li, D.; Lai, W.; Zhu, S.; Wang, Y. Selection of characteristic wavelengths using SPA for laser induced fluorescence spectroscopy of mine water inrush. Spectrochim. Acta Part A Mol. Biomol. Spectrosc. 2019, 219, 367–374. [Google Scholar] [CrossRef]
- Norgaard, L.; Saudland, A.; Wagner, J.; Nielsen, J.P.; Munck, L.; Engelsen, S.B. Interval partial least-squares regression (iPLS): A comparative chemometric study with an example from near-infrared spectroscopy. Appl. Spectrosc. 2000, 54, 413–419. [Google Scholar] [CrossRef]
- Tunny, S.S.; Amanah, H.Z.; Faqeerzada, M.A.; Wakholi, C.; Kim, M.S.; Baek, I.; Cho, B.K. Multispectral wavebands selection for the detection of potential foreign materials in fresh-cut vegetables. Sensors 2022, 22, 1775. [Google Scholar] [CrossRef] [PubMed]
- Rahman, A.; Faqeerzada, M.A.; Cho, B.K. Hyperspectral imaging for predicting the allicin and soluble solid content of garlic with variable selection algorithms and chemometric models. J. Sci. Food Agric. 2018, 98, 4715–4725. [Google Scholar] [CrossRef] [PubMed]
- Rahman, A.; Syduzzaman, M.; Khaliduzzaman, A.; Fujitani, S.; Kashimori, A.; Suzuki, T.; Ogawa, Y.; Kondo, N. Nondestructive sex-specific monitoring of early embryonic development rate in white layer chicken eggs using visible light transmission. Br. Poult. Sci. 2020, 61, 209–216. [Google Scholar] [CrossRef] [PubMed]
- Gielen, R.M.A.M.; Leo, P.D.J.; Kerkvliet, H.M.M. Electro optical blood spot detection in intact eggs. IEEE Trans. Instrum. Meas. 1979, 28, 177–183. [Google Scholar] [CrossRef]
- Titova, T.; Nachev, V.; Damyanov, C. Non-destructive egg quality determination with intelligent classifiers. In Proceedings of the XI International SAUM Conference on Systems, Automatic Control and Measurements, Niš, Serbia, 14–16 November 2012; pp. 451–454. [Google Scholar]



| Total Accuracy (%) | ||||||||||
|---|---|---|---|---|---|---|---|---|---|---|
| Experiment | Light Source | Pre-Processing Method | Calibration Set | Validation Set | ||||||
| Normal | Bloody | YB | Total | Normal | Bloody | YB | Total | |||
| Condition 1 | Gold | Raw | 95.1 | 85.1 | 81.7 | 87.3 | 92.1 | 85.4 | 78.1 | 85.2 |
| Mean norm | 81.4 | 86.5 | 76.4 | 81.4 | 76.3 | 91.3 | 66.7 | 78.4 | ||
| SG 1st | 94.1 | 82.0 | 85.6 | 87.2 | 89.5 | 75.7 | 77.1 | 80.8 | ||
| Silver | Raw | 94.4 | 96.3 | 100.0 | 96.9 | 100.0 | 92.7 | 97.8 | 96.8 | |
| Mean norm | 100.0 | 92.7 | 97.8 | 96.8 | 100.0 | 92.7 | 93.5 | 95.4 | ||
| Max norm | 100.0 | 92.7 | 93.5 | 95.4 | 94.4 | 90.2 | 97.8 | 94.2 | ||
| Condition 2 | Gold | Raw | 88.9 | 94.0 | 100.0 | 94.3 | 84.0 | 96.4 | 100.0 | 93.5 |
| Mean norm | 100.0 | 94.5 | 100.0 | 98.2 | 98.7 | 97.3 | 100.0 | 98.7 | ||
| Max norm | 100.0 | 95.9 | 100.0 | 98.6 | 96.0 | 96.4 | 100.0 | 97.5 | ||
| Silver | Raw | 87.8 | 84.5 | 100.0 | 90.8 | 89.2 | 87.0 | 100.0 | 92.0 | |
| Mean norm | 93.9 | 86.0 | 99.4 | 93.1 | 97.3 | 90.2 | 100.0 | 95.8 | ||
| Range norm | 96.9 | 88.9 | 100.0 | 95.3 | 97.4 | 92.3 | 100.0 | 96.6 | ||
| Condition 3 | Gold | Raw | 91.2 | 94.8 | 100.0 | 95.3 | 88.6 | 89.7 | 98.7 | 92.3 |
| Mean norm | 100.0 | 96.2 | 98.3 | 98.2 | 100.0 | 93.1 | 97.3 | 96.8 | ||
| MSC | 100.0 | 95.3 | 96.0 | 97.7 | 100.0 | 94.3 | 96.0 | 96.8 | ||
| Silver | Raw | 89.4 | 90.7 | 99.3 | 93.1 | 95.1 | 89.3 | 95.9 | 93.4 | |
| Mean norm | 88.3 | 88.0 | 100.0 | 92.1 | 90.2 | 88.1 | 98.6 | 92.3 | ||
| Range norm | 90.4 | 90.3 | 100.0 | 93.6 | 92.7 | 85.7 | 100.0 | 92.8 | ||
| Lamp Type | Variable Selection Method | Selected Variable Numbers | Selected Wavelengths (nm) |
|---|---|---|---|
| Silver Lamp | WRC | 4 | 556. 566, 578, 596 |
| SFS | 3 | 577, 597, 598 | |
| SPA | 3 | 577, 589, 598 | |
| Total band | 9 | 556, 566, 576, 577, 578, 589, 596, 597, 598 | |
| Gold Lamp | WRC | 5 | 556, 567, 579, 586, 596 |
| SFS | 3 | 577, 595, 598 | |
| SPA | 3 | 576, 593, 598 | |
| Total | 10 | 556, 567, 576, 577, 579, 586, 593, 595, 596, 598 |
| Lamp Type | Stepwise P Value Threshold | Selected Variable Numbers | Selected Wavelengths (nm) |
|---|---|---|---|
| Silver Lamp | 0 | 9 | 556, 566, 576, 577, 578, 589, 596, 597, 598 |
| 0.05 | 6 | 556, 566, 577, 589, 596, 598 | |
| 0.01 | 5 | 556, 577, 589, 596, 598 | |
| 0.001 | 4 | 577, 589, 596, 598 | |
| 0.0001 | 3 | 577, 596, 598 | |
| Gold Lamp | 0 | 10 | 556, 567, 576, 577, 579, 586, 593, 595, 596, 598 |
| 0.05 | 7 | 556, 576, 577, 586, 593, 595, 598 | |
| 0.01 | 6 | 556, 576, 577, 593, 595, 598 | |
| 0.001 | 5 | 556, 577, 593, 595, 598 | |
| 0.0001 | 3 | 577, 595, 598 |
| Lamp Type | Selected Bands | Validation Set Accuracy | |||
|---|---|---|---|---|---|
| Normal (%) | Bloody (%) | YD (%) | Total (%) | ||
| Silver Lamp | 9 | 100.0 | 92.6 | 100.0 | 97.5 |
| 6 | 100.0 | 86.6 | 100.0 | 95.5 | |
| 5 | 100.0 | 83.8 | 100.0 | 94.6 | |
| 4 | 100.0 | 82.0 | 100.0 | 94.0 | |
| 3 | 100.0 | 82.5 | 98.7 | 93.7 | |
| Gold Lamp | 10 | 100.0 | 89.0 | 98.6 | 95.9 |
| 7 | 100.0 | 82.3 | 95.7 | 92.7 | |
| 6 | 100.0 | 79.8 | 98.2 | 92.7 | |
| 5 | 100.0 | 78.3 | 98.4 | 92.2 | |
| 3 | 100.0 | 78.0 | 95.3 | 91.1 | |
Publisher’s Note: MDPI stays neutral with regard to jurisdictional claims in published maps and institutional affiliations. |
© 2022 by the authors. Licensee MDPI, Basel, Switzerland. This article is an open access article distributed under the terms and conditions of the Creative Commons Attribution (CC BY) license (https://creativecommons.org/licenses/by/4.0/).
Share and Cite
Kim, J.; Semyalo, D.; Rho, T.-G.; Bae, H.; Cho, B.-K. Non-Destructive Detection of Abnormal Chicken Eggs by Using an Optimized Spectral Analysis System. Sensors 2022, 22, 9826. https://doi.org/10.3390/s22249826
Kim J, Semyalo D, Rho T-G, Bae H, Cho B-K. Non-Destructive Detection of Abnormal Chicken Eggs by Using an Optimized Spectral Analysis System. Sensors. 2022; 22(24):9826. https://doi.org/10.3390/s22249826
Chicago/Turabian StyleKim, Juntae, Dennis Semyalo, Tae-Gyun Rho, Hyungjin Bae, and Byoung-Kwan Cho. 2022. "Non-Destructive Detection of Abnormal Chicken Eggs by Using an Optimized Spectral Analysis System" Sensors 22, no. 24: 9826. https://doi.org/10.3390/s22249826
APA StyleKim, J., Semyalo, D., Rho, T.-G., Bae, H., & Cho, B.-K. (2022). Non-Destructive Detection of Abnormal Chicken Eggs by Using an Optimized Spectral Analysis System. Sensors, 22(24), 9826. https://doi.org/10.3390/s22249826


