3.1. Experimental Methods and Conditions
Three healthy young men (aged 24–25 years, with an average height of 173.8 cm and an average weight of 68.6 kg) participated in the experiment. Before the experiment, the drivers practiced driving the experimental vehicle manually for 30 min to become sufficiently familiar with riding and steering the vehicle to minimize the differences in driving skills between the subjects.
The experiment was conducted under two conditions: manual turning by the driver, and automatic turning. The former condition was achieved by tilting the handle to the maximum in a specified direction. The latter condition was achieved by activating the automatic turning system with a random direction and timing, including a condition in which the vehicle did not turn, making it difficult for the driver to predict the turning direction. This increases the reproducibility of the automatic operation. The turning time was set to 1.5 s. For each condition, the vehicle speed was set as either low or high. The results were 3.3 ± 0.3 km/h for low speed and 4.9 ± 0.3 km/h for high speed. For each condition, the turning sensitivity was varied in two steps: The turning sensitivity was achieved by changing the value of in Equations (2) and (3). Three sets of experimental data were obtained for each of the eight experimental conditions. Data that could not be analyzed due to a large amount of missing data were excluded from the analysis.
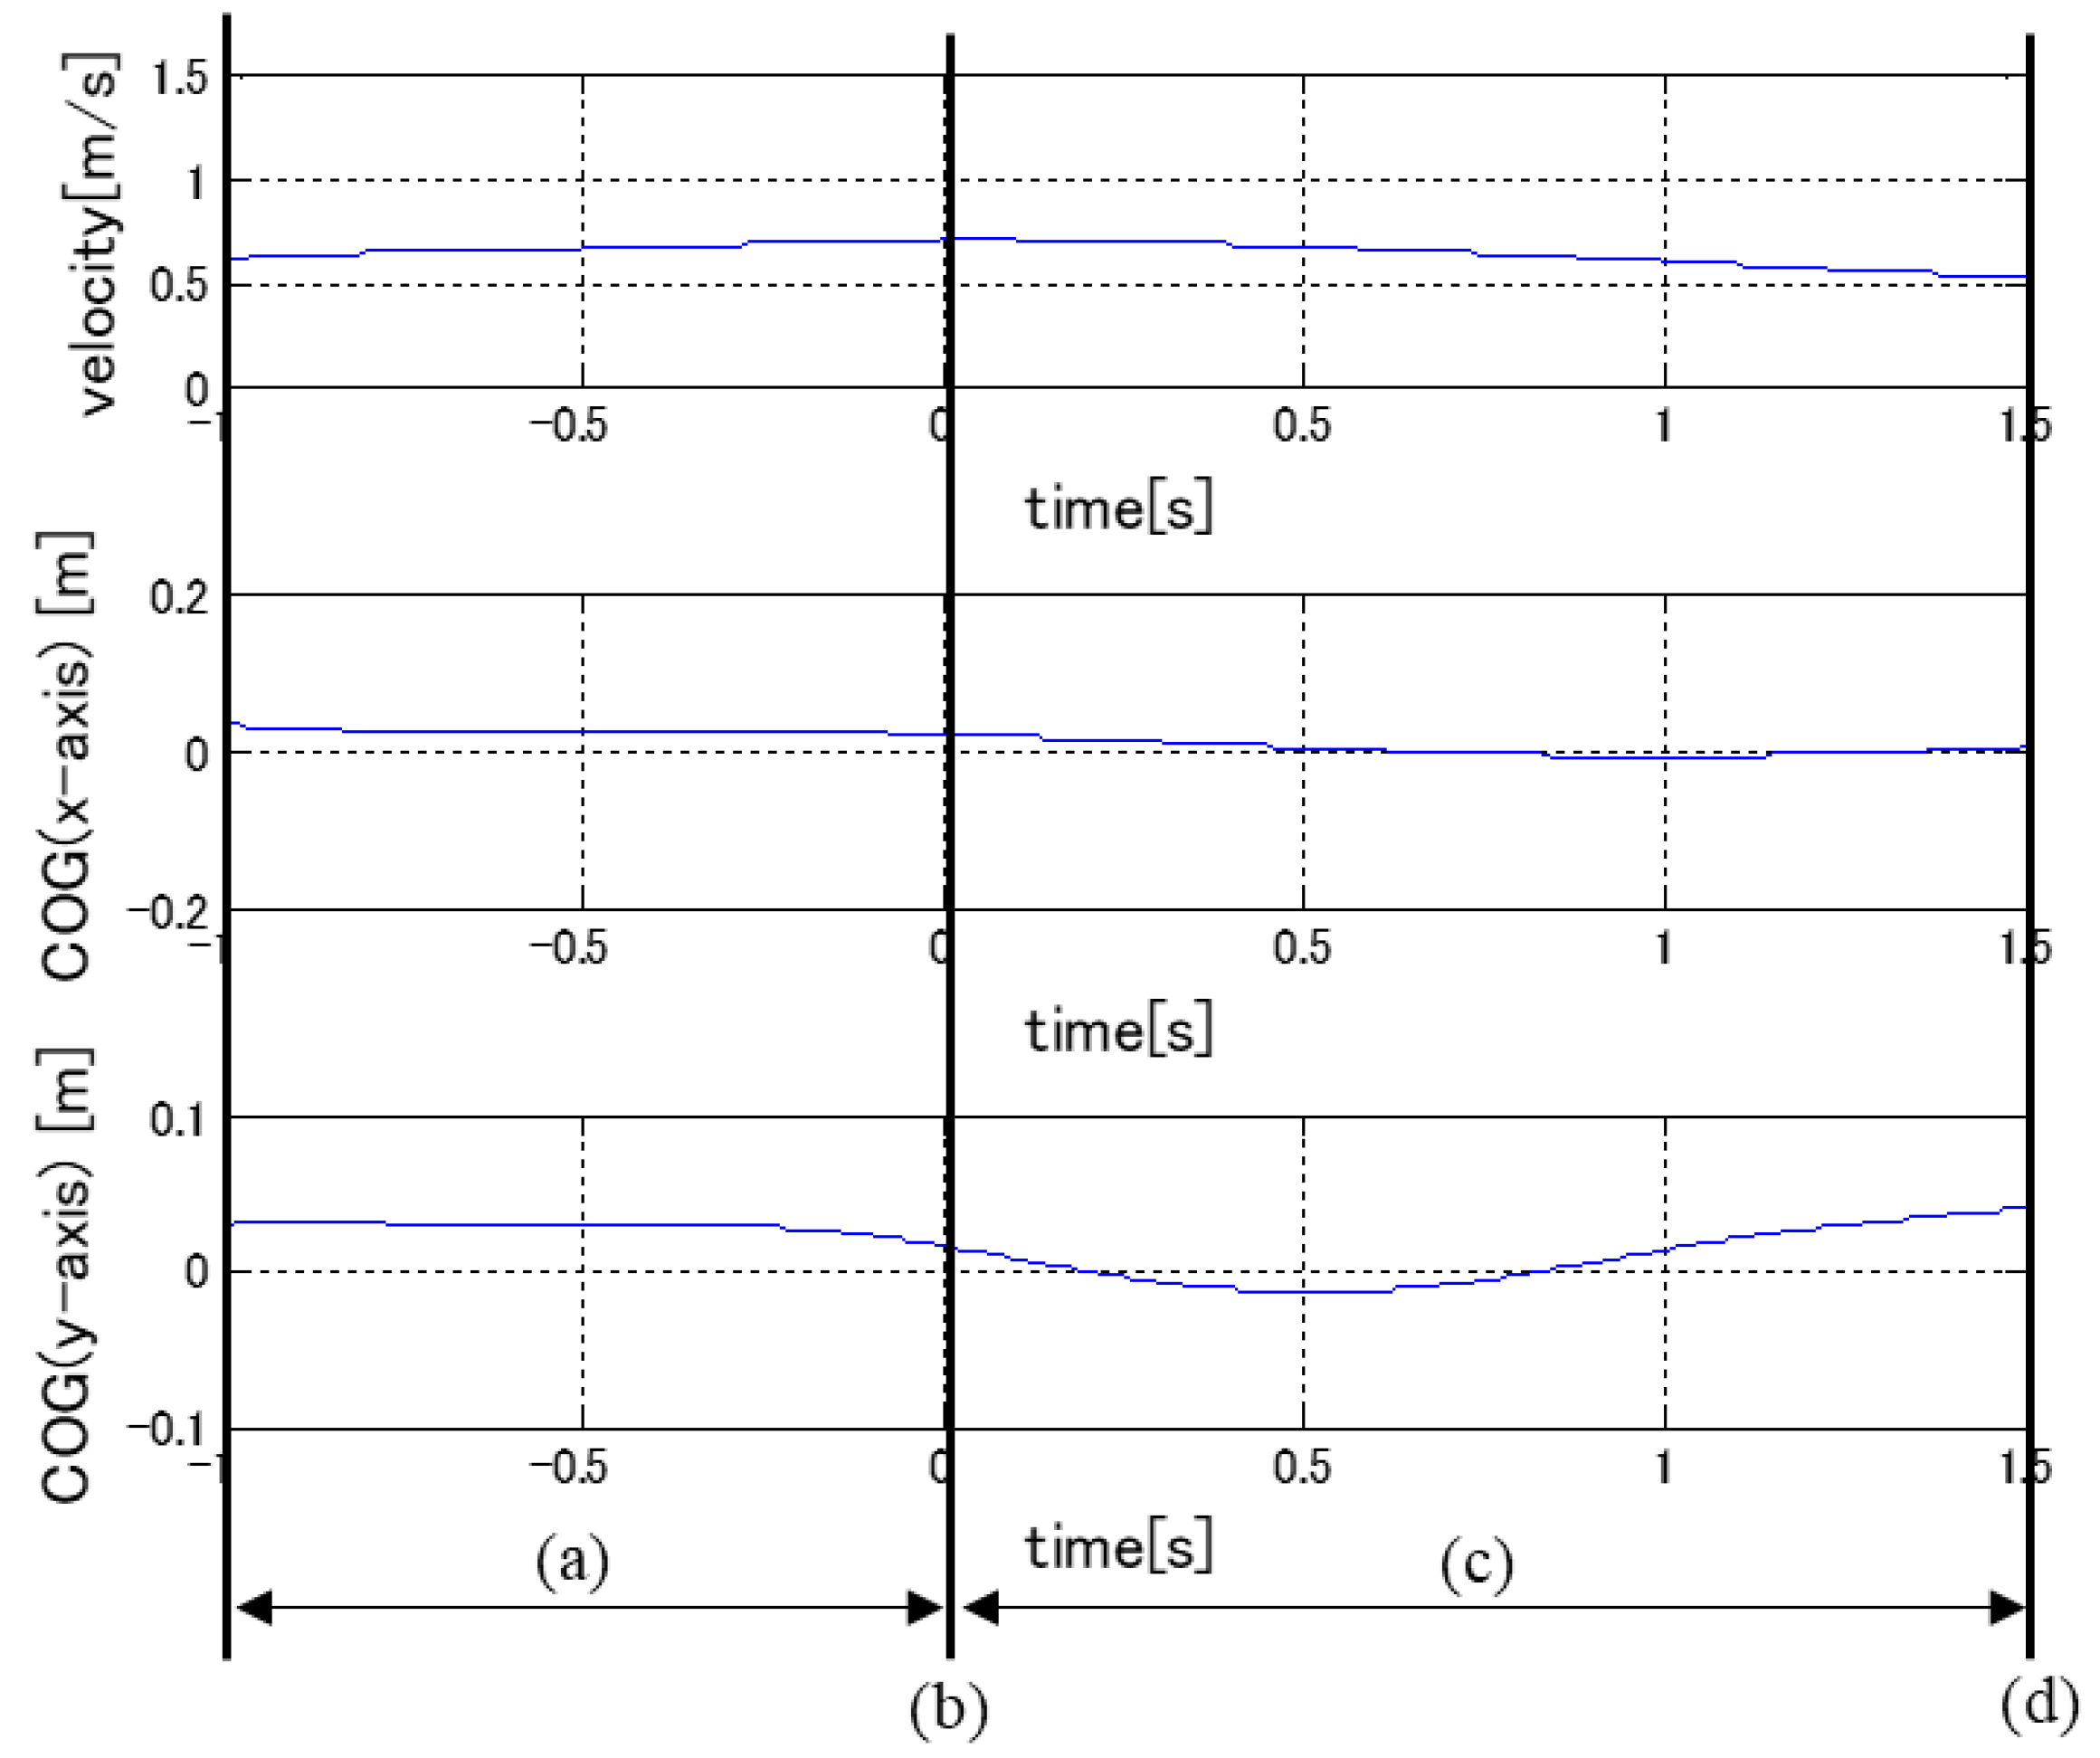
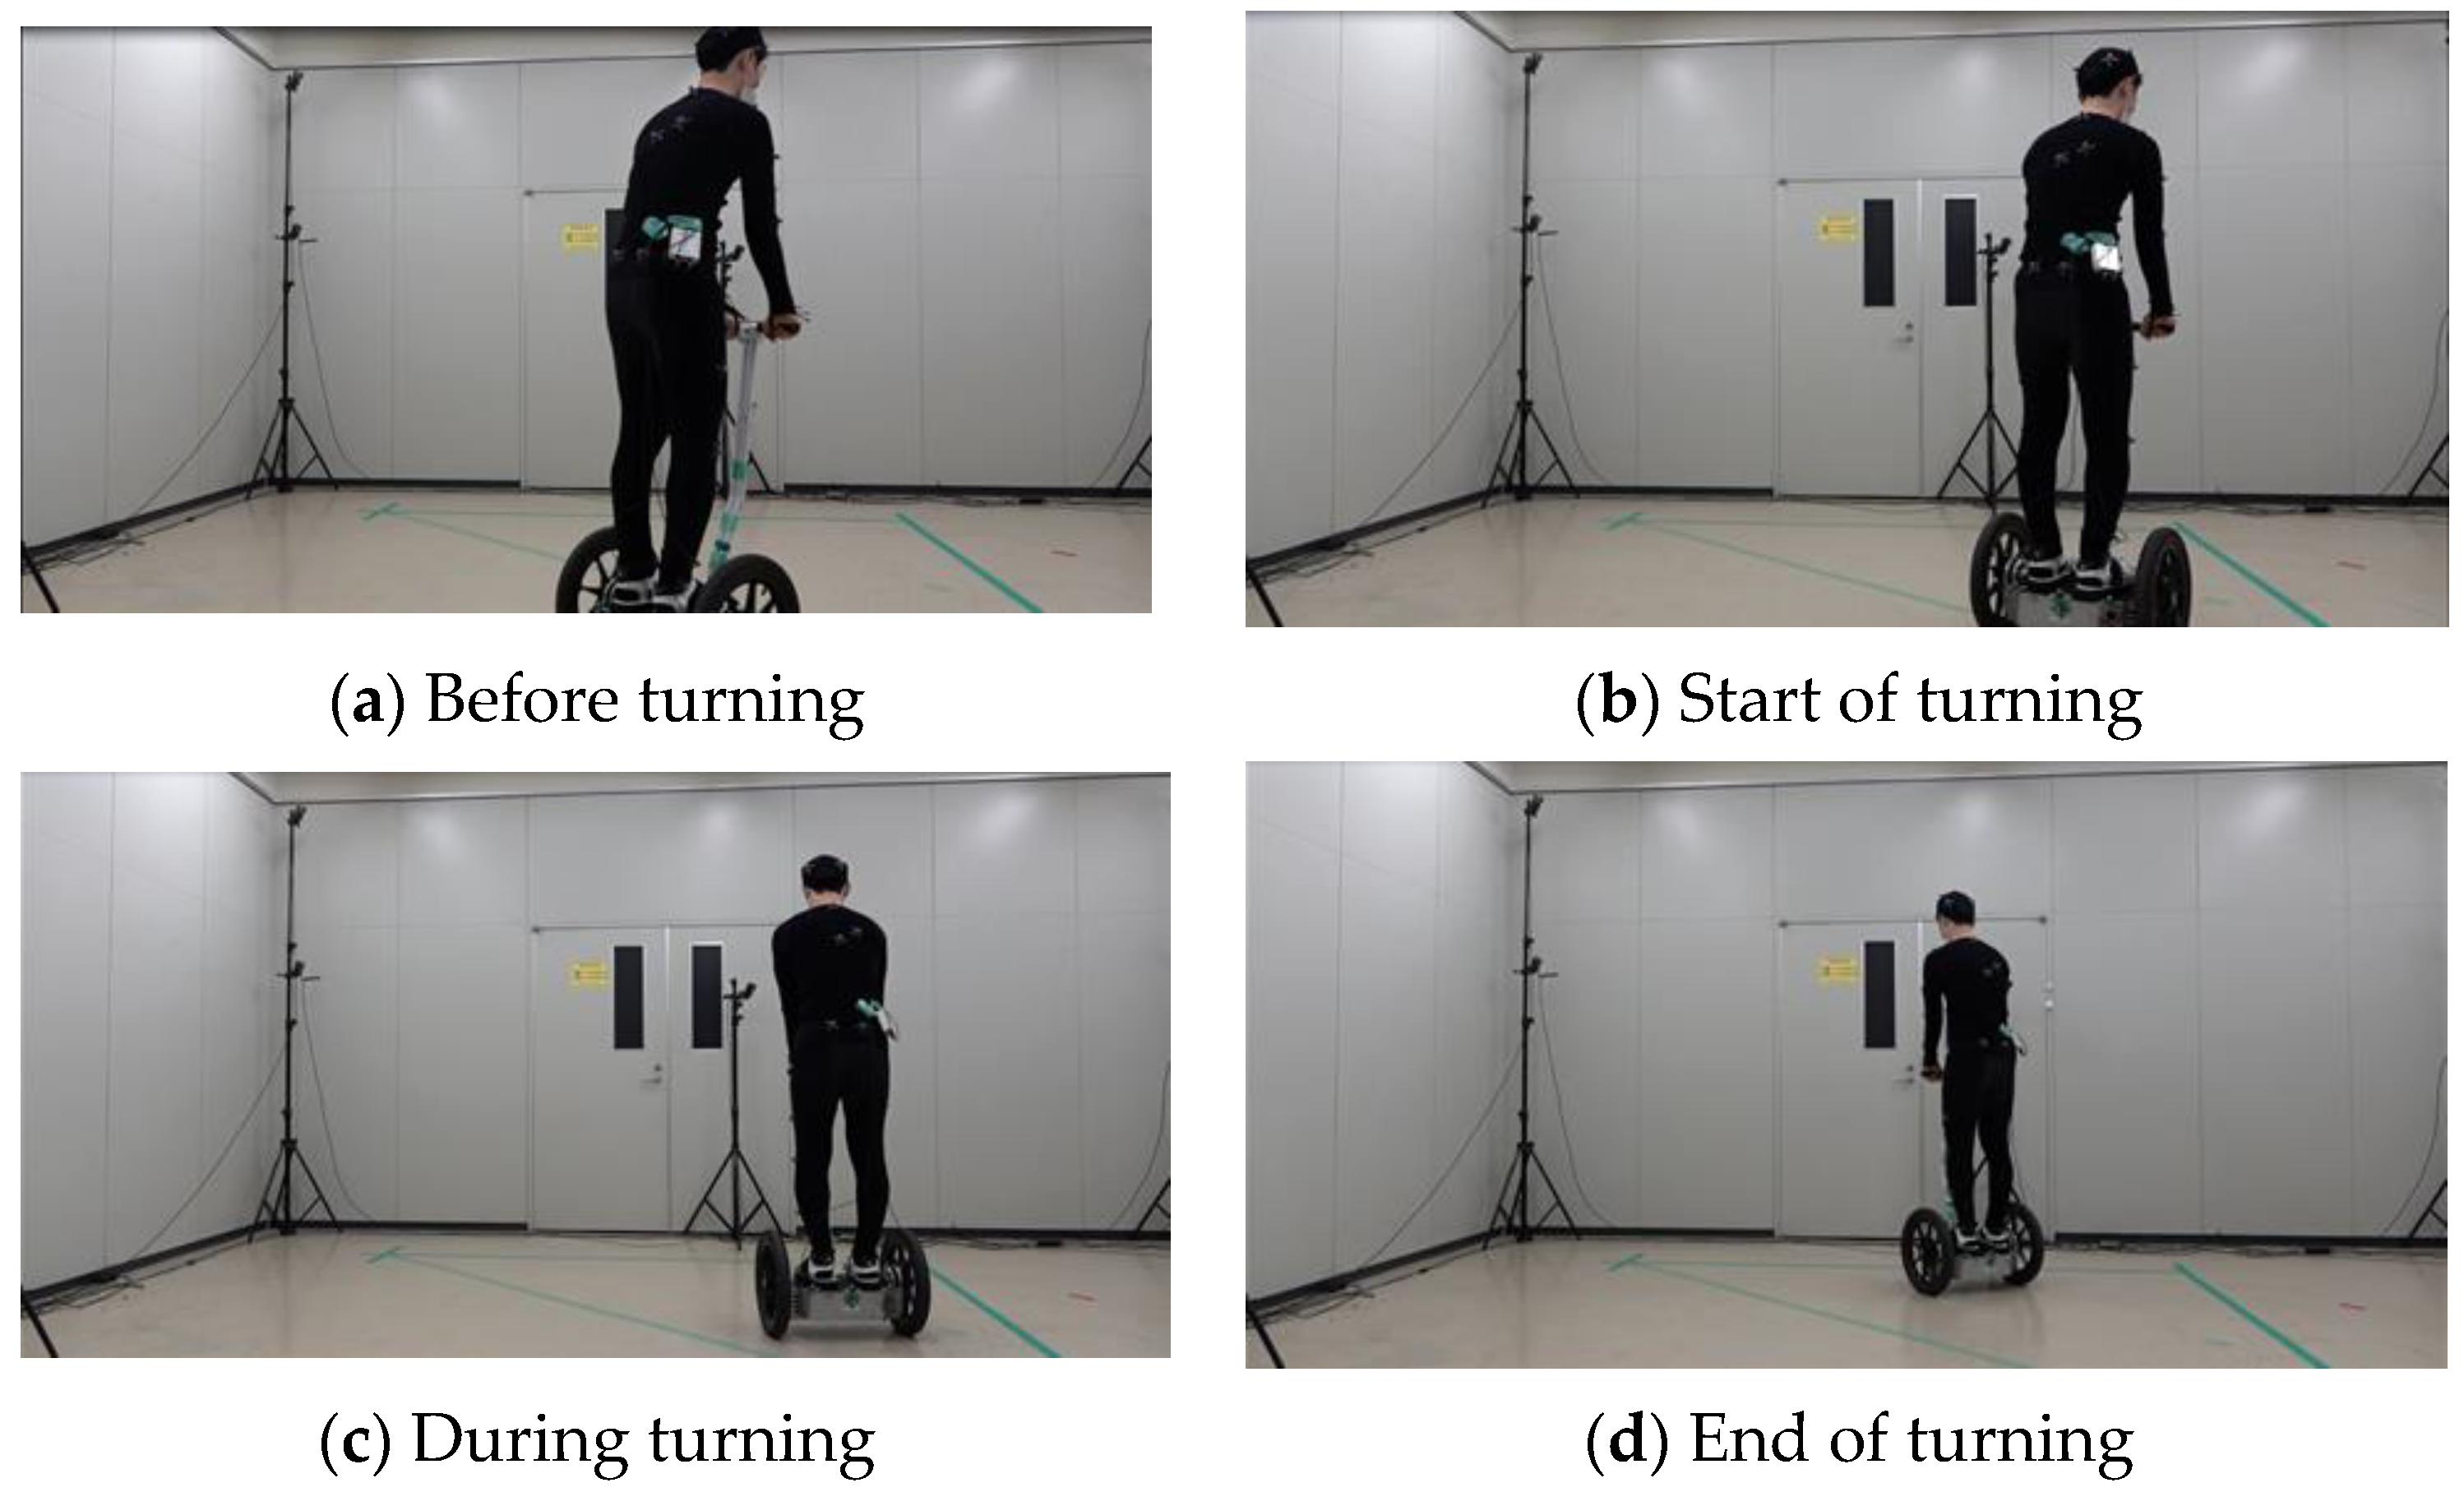
The time history of the turning experiment is shown in
Figure 3. This is the case for automatic turning, where the vehicle velocity is low and turning sensitivity is high. For each section, (a) (−1 s–0 s) is before turning, (b) (0 s) is at the beginning of turning, (c) (0 s–1.5 s) occurs during turning, and (d) (1.5 s) occurs at the end of turning. For reference, the data are shown in
Figure 4 in correspondence with the acquired analysis data described below. The evaluation was conducted by measuring the displacements of the driver’s COG and COP during turning relative to the stationary state for each condition.
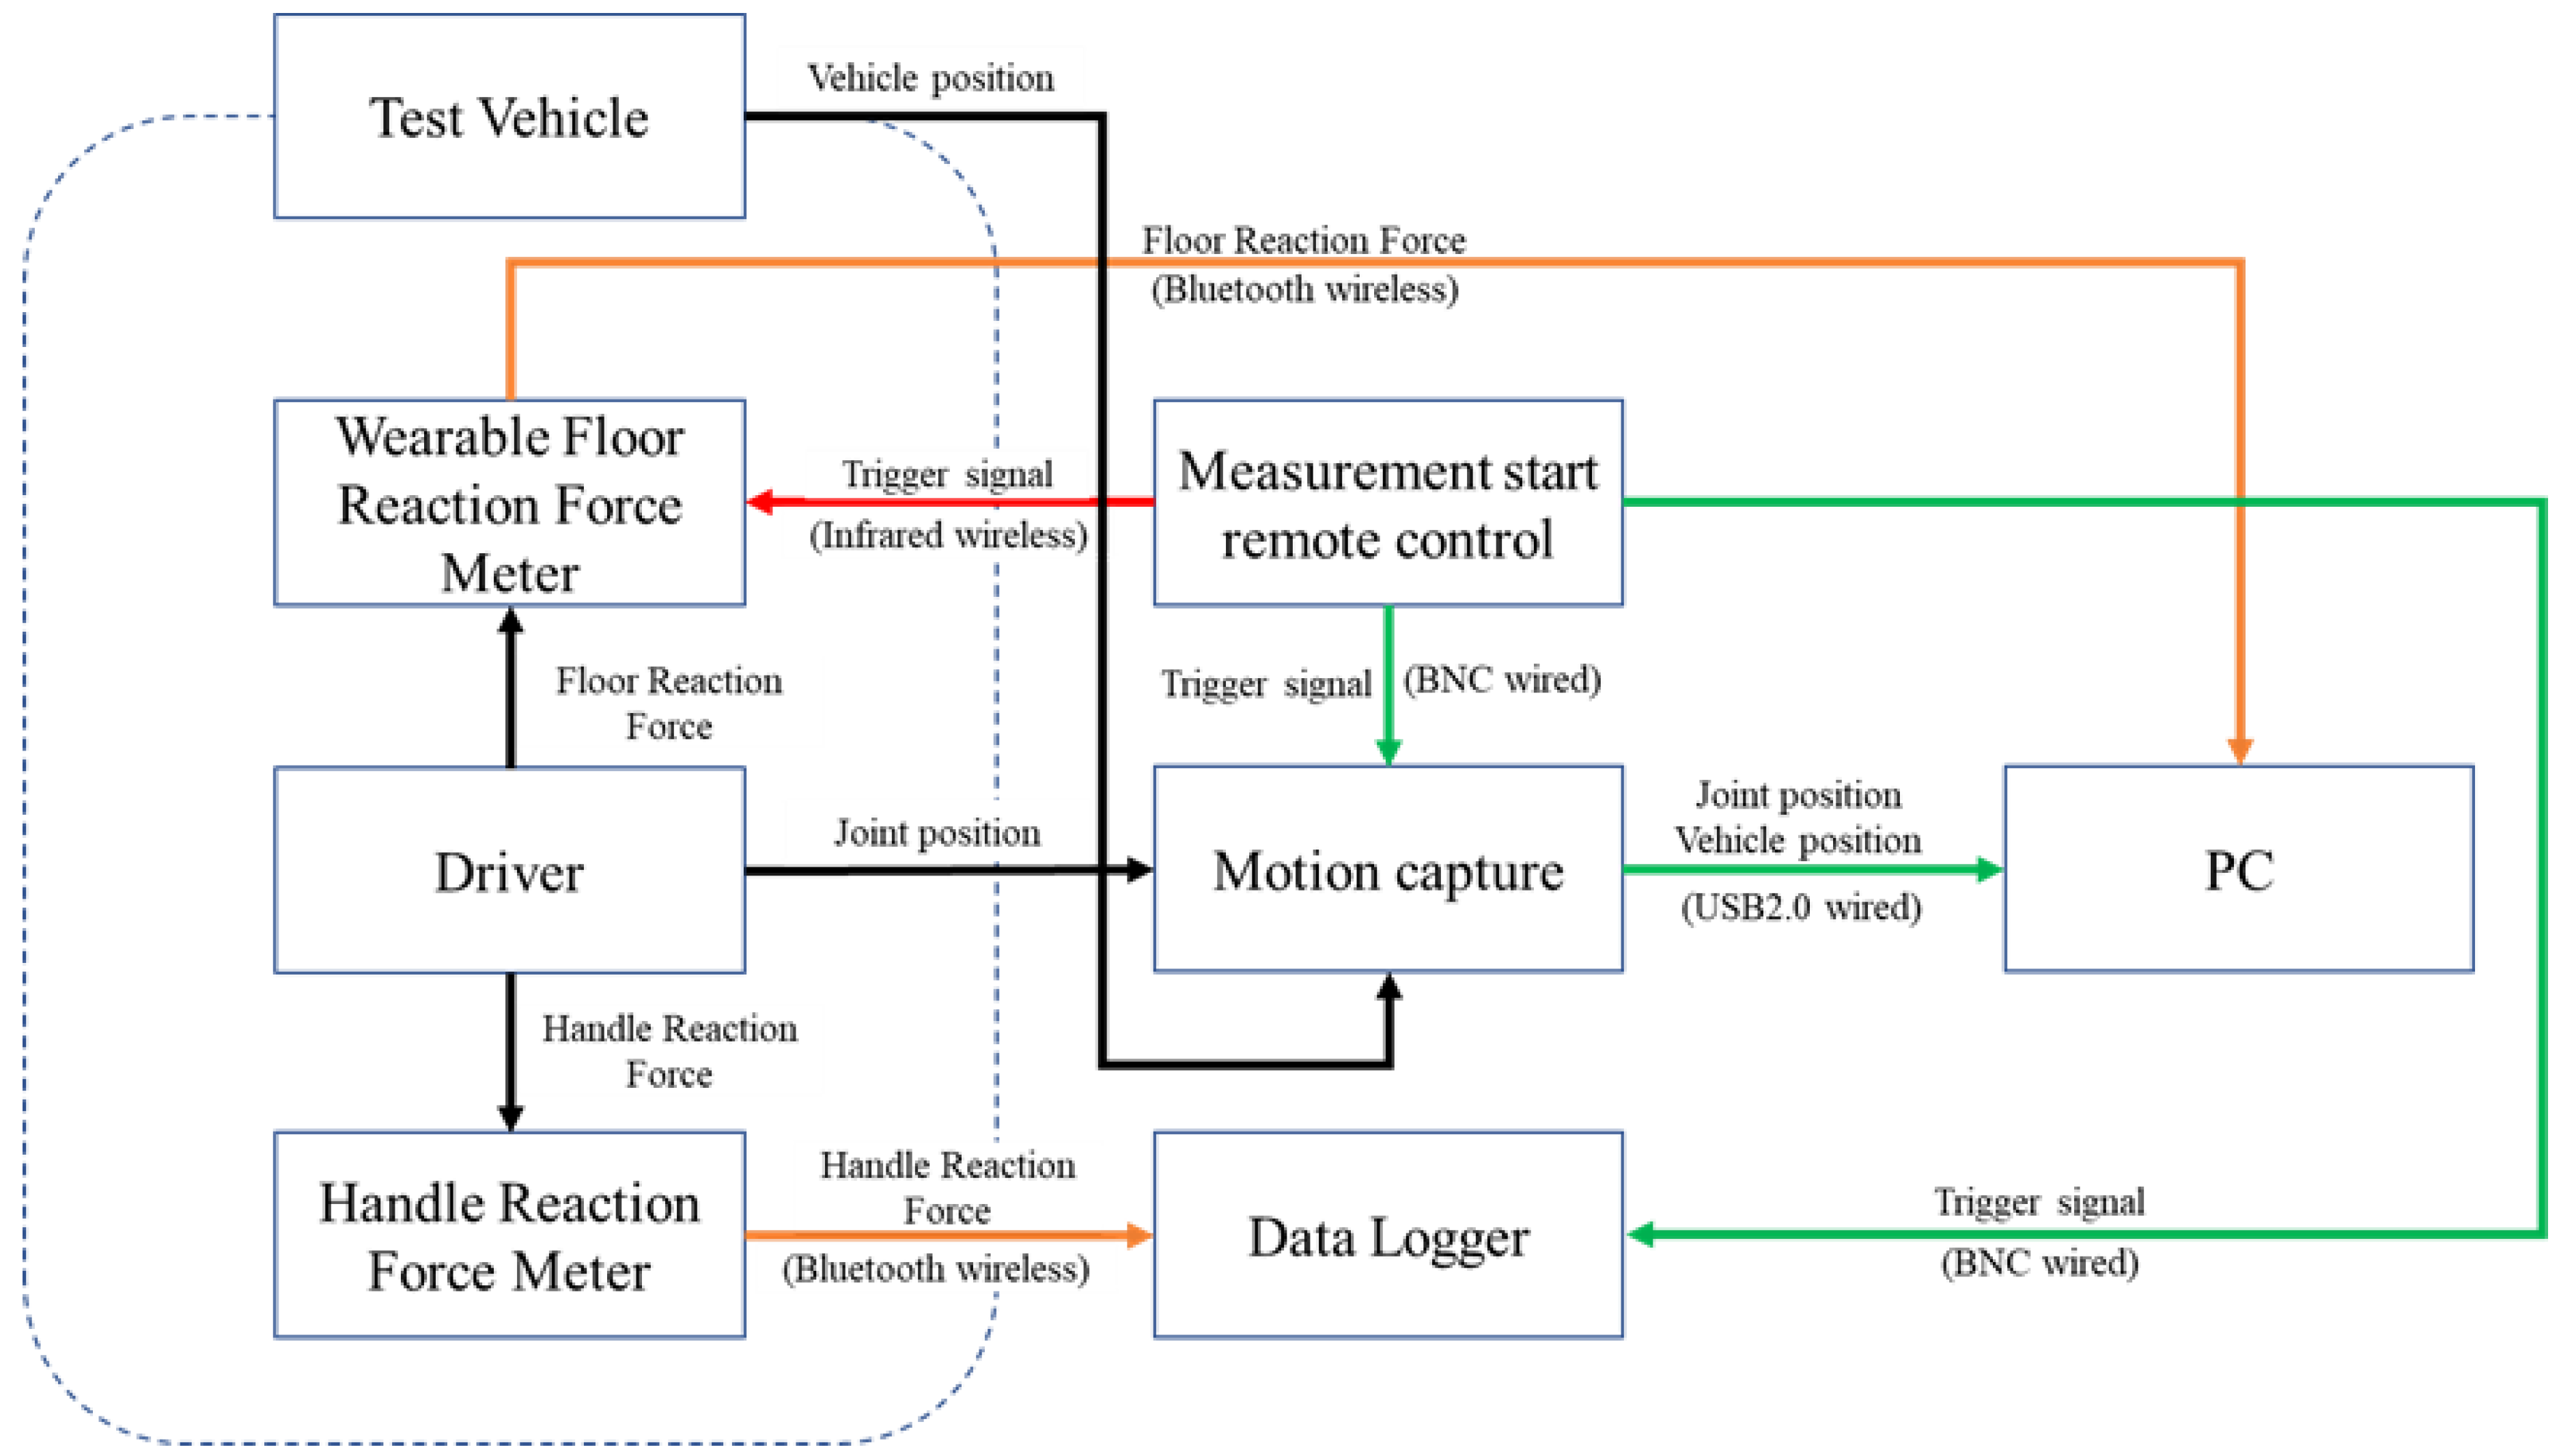
3.2. Measurement System
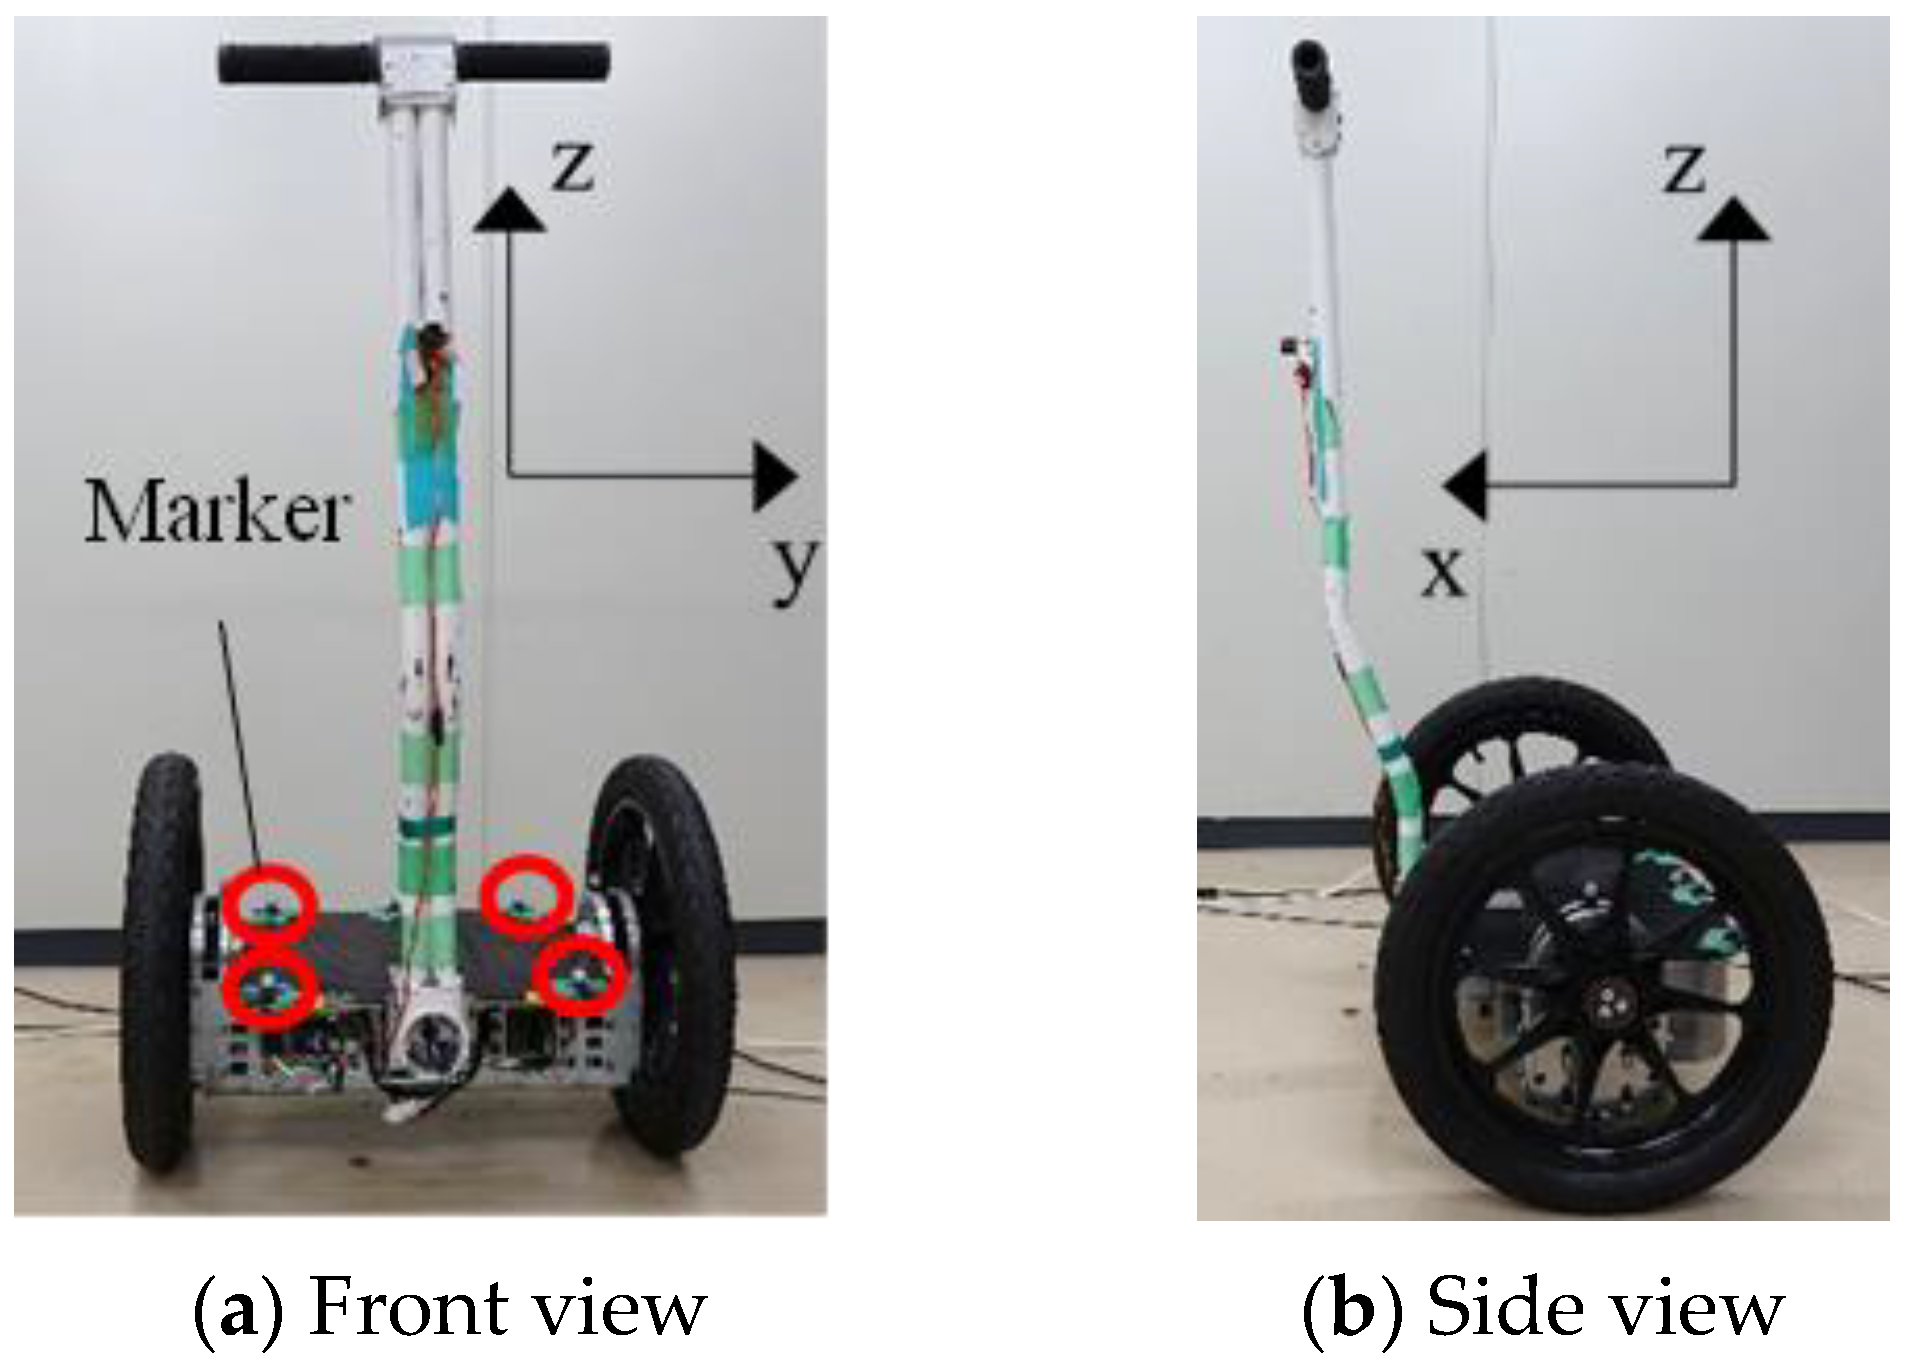
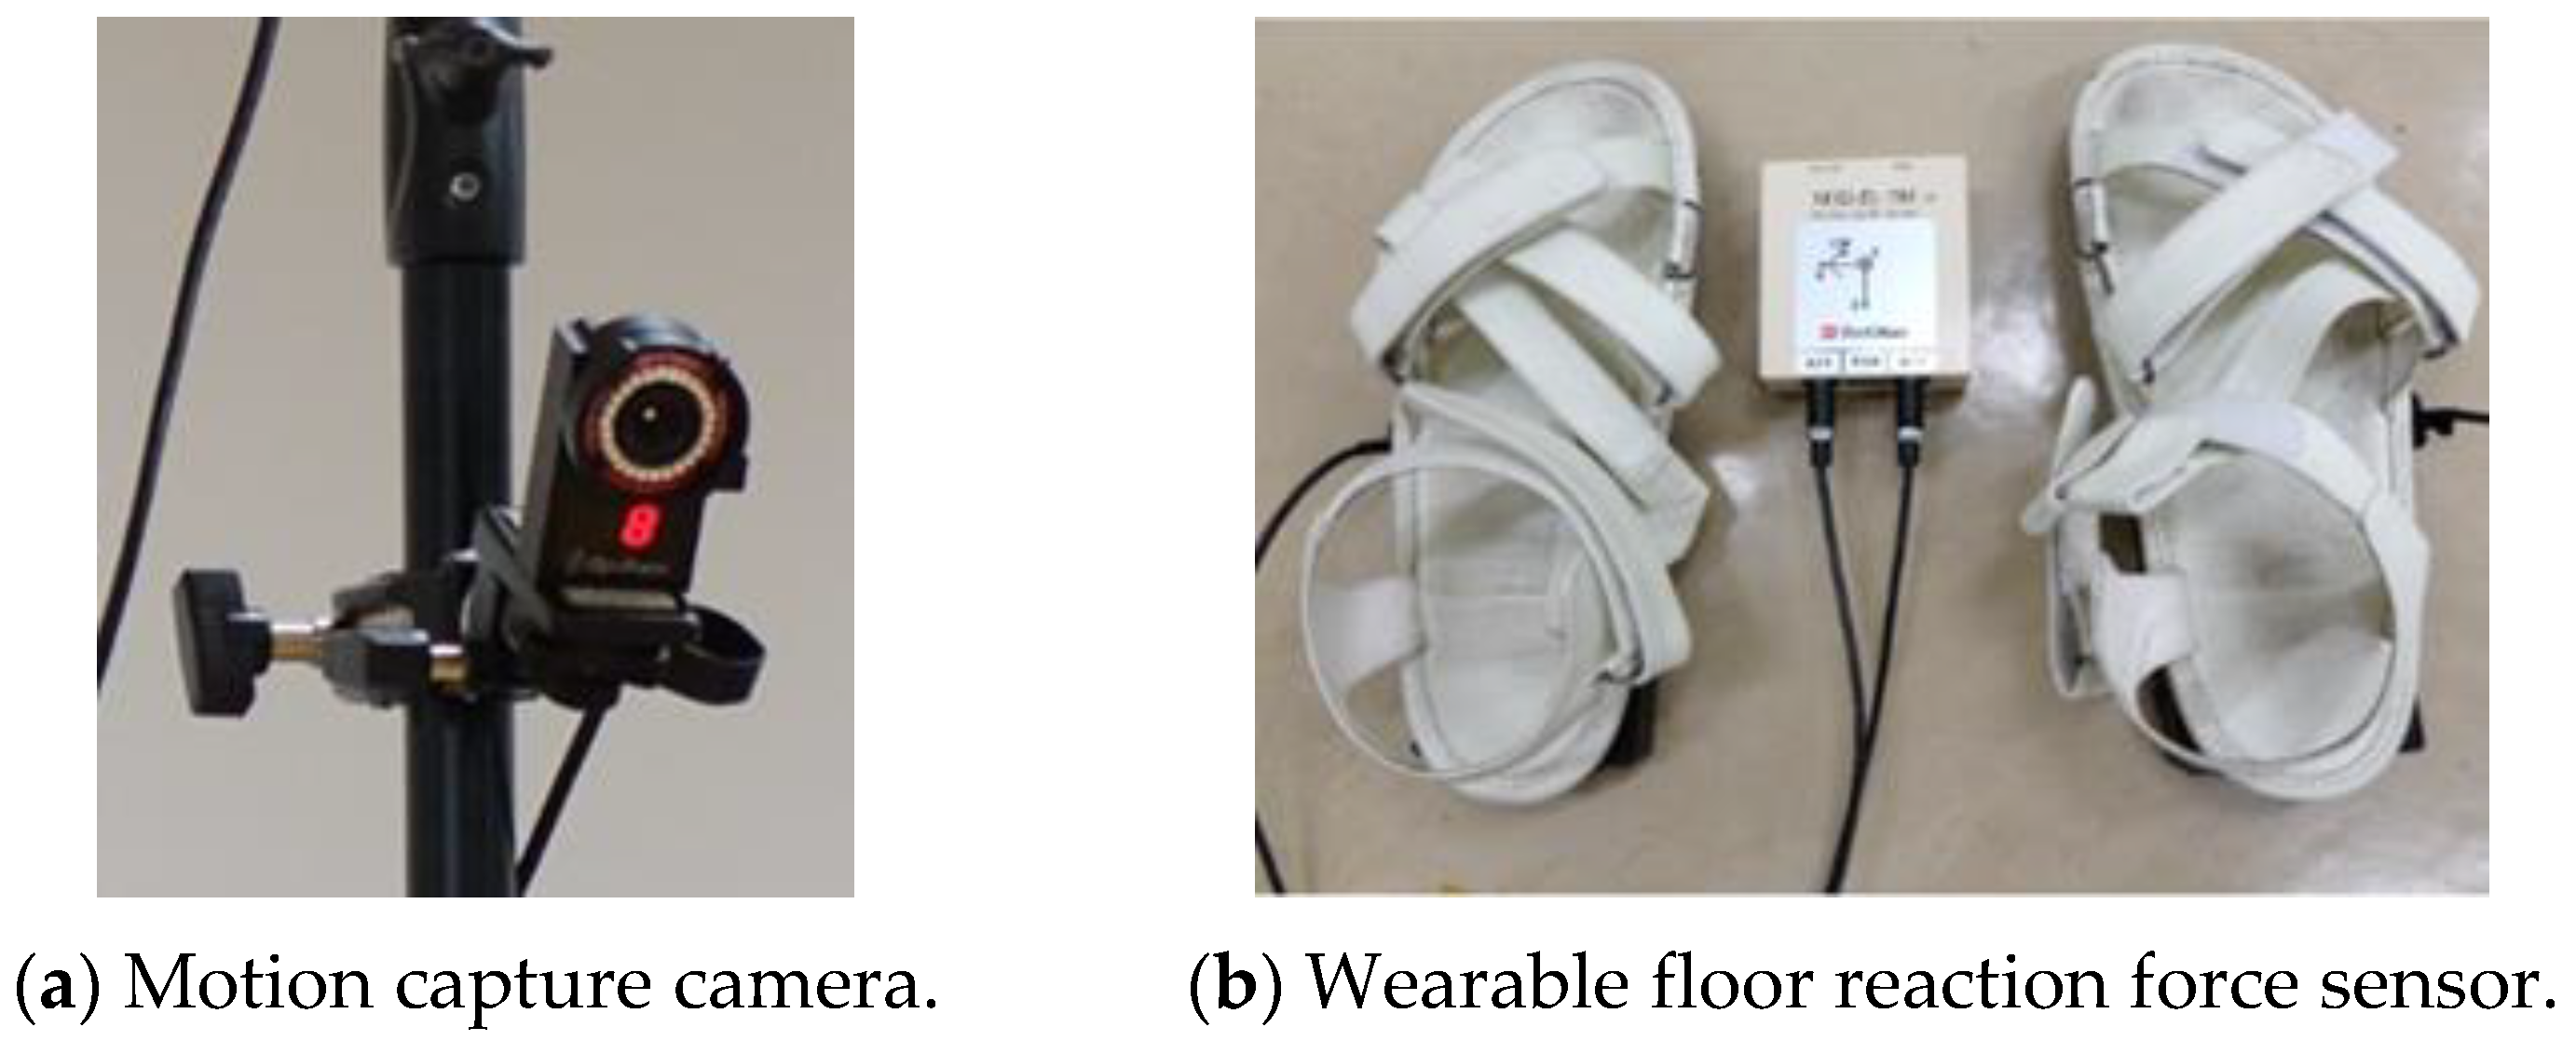
In this experiment, the position of each part of the human body was measured using 12 cameras in the 3D motion analysis system Flex3 (OptiTrack) (
Figure 5a). The 3D motion analysis system can be used to analyze detailed human movements [
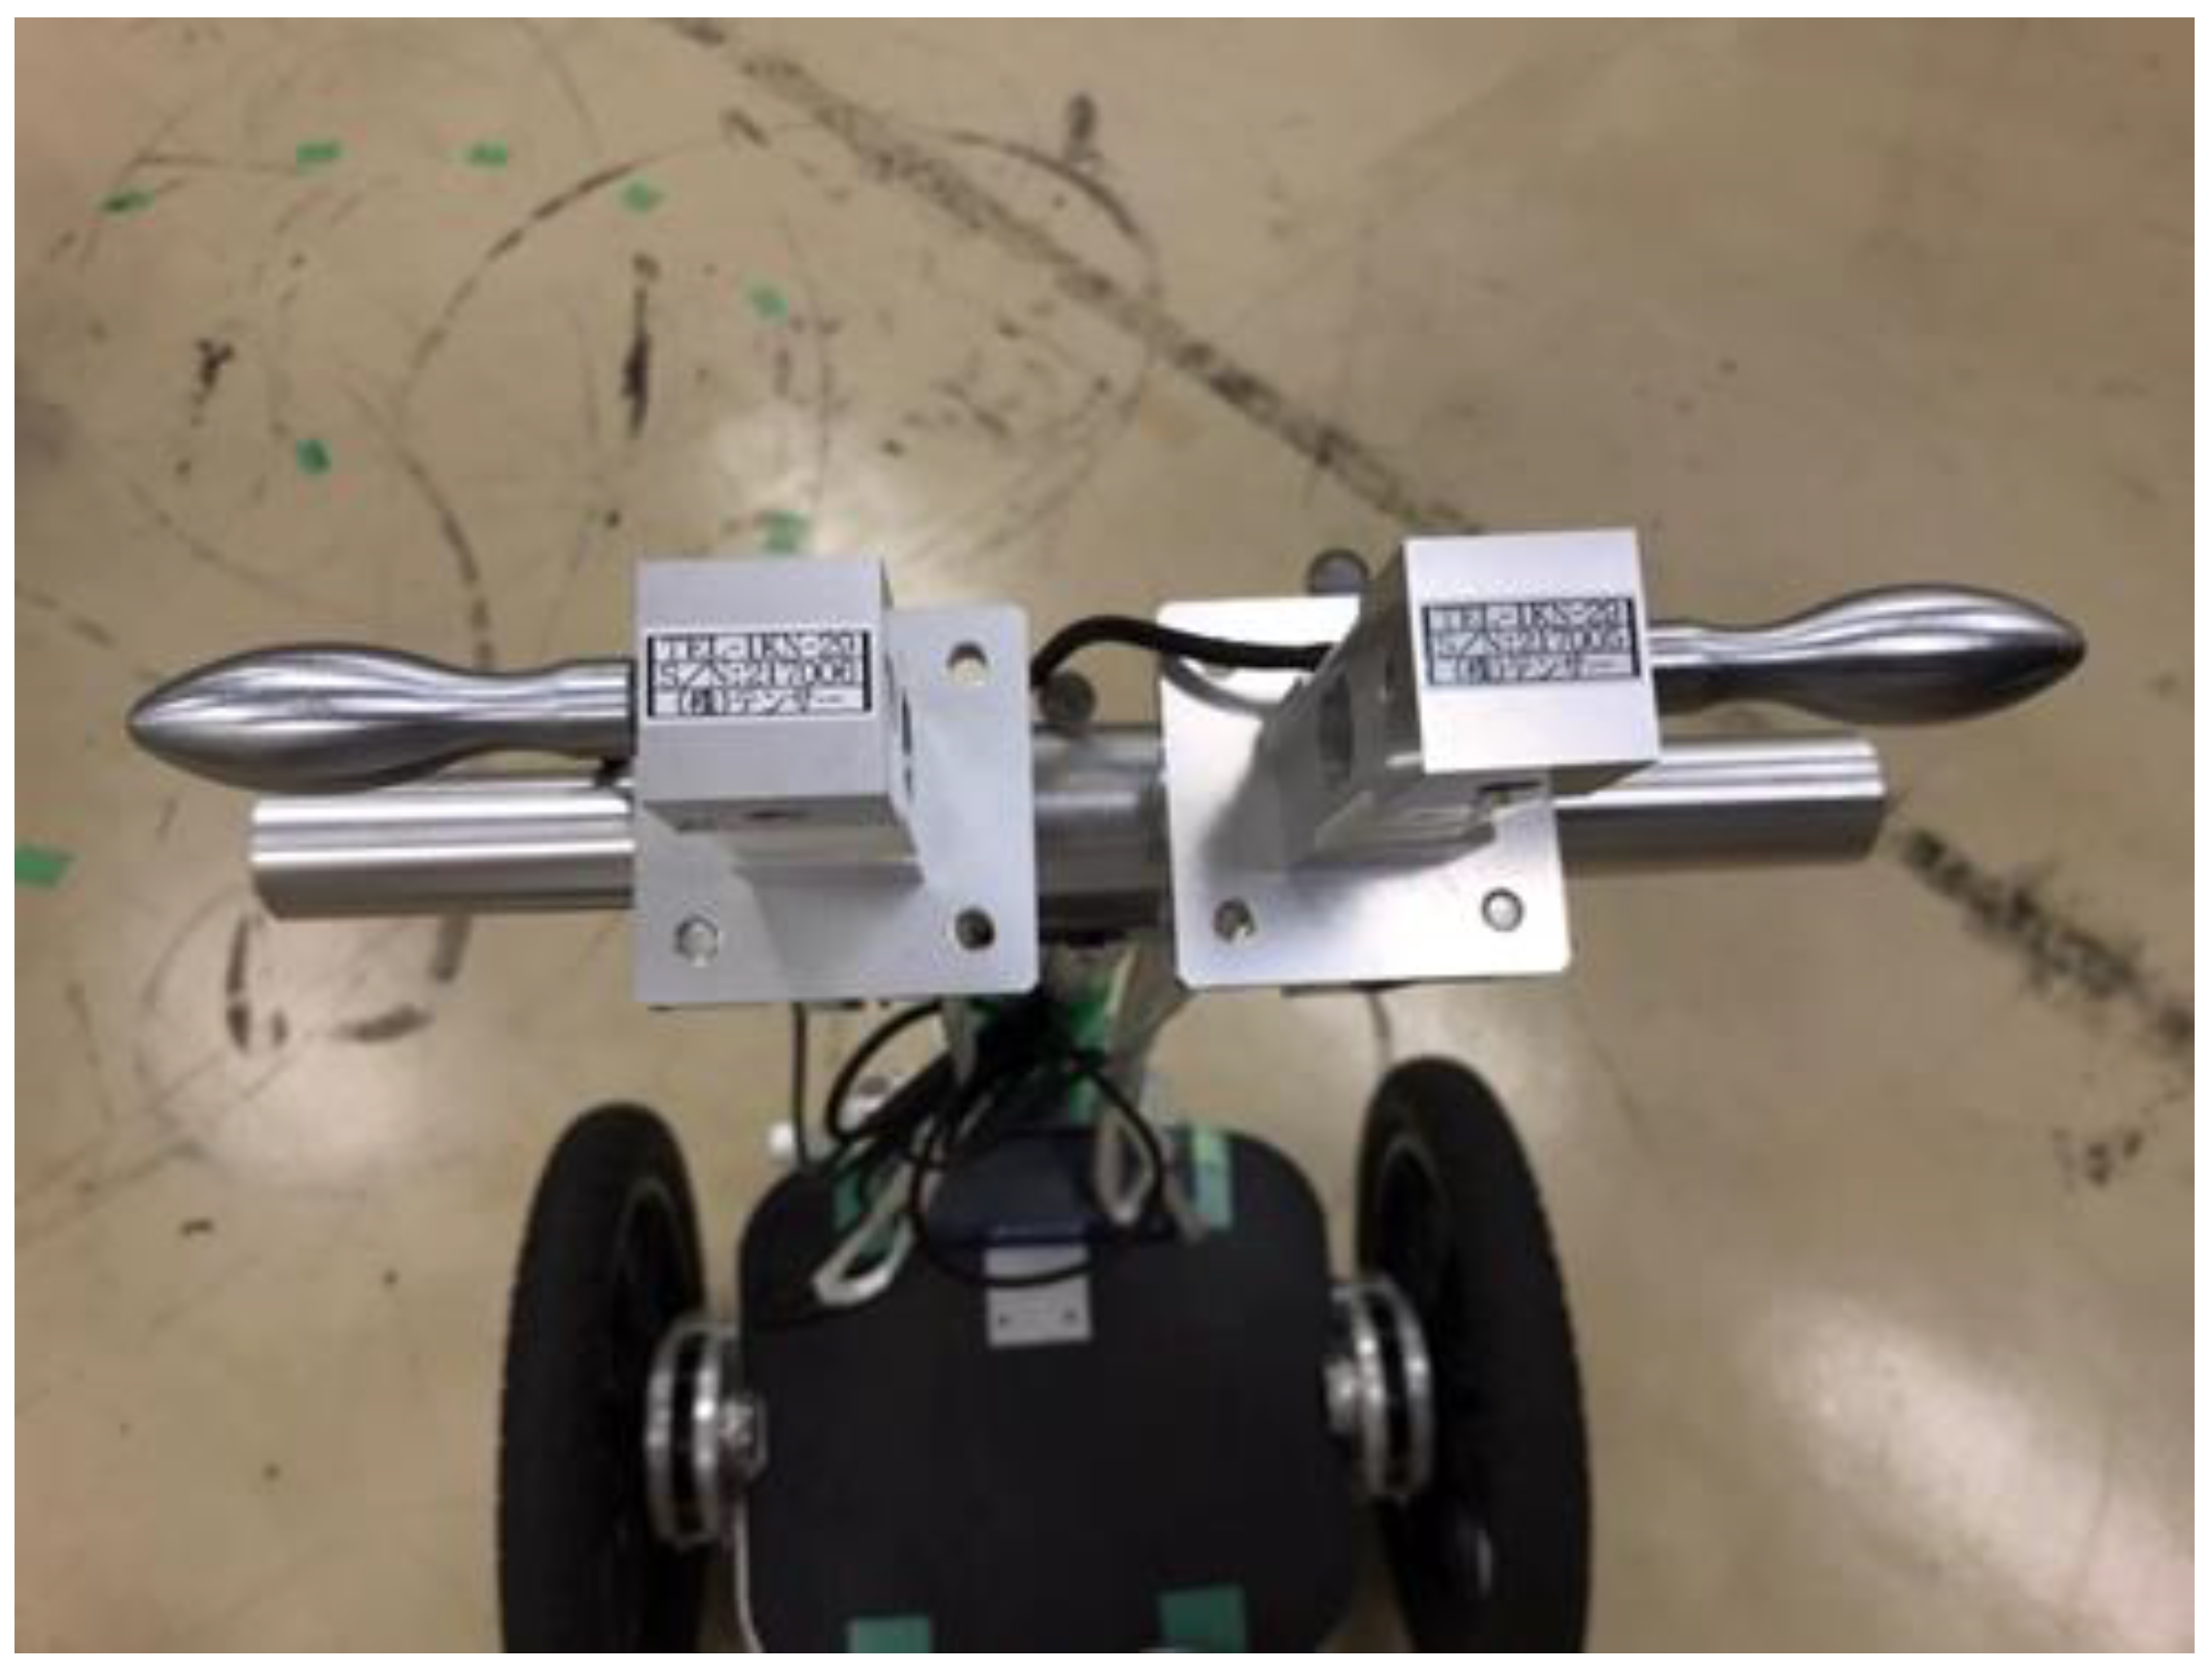
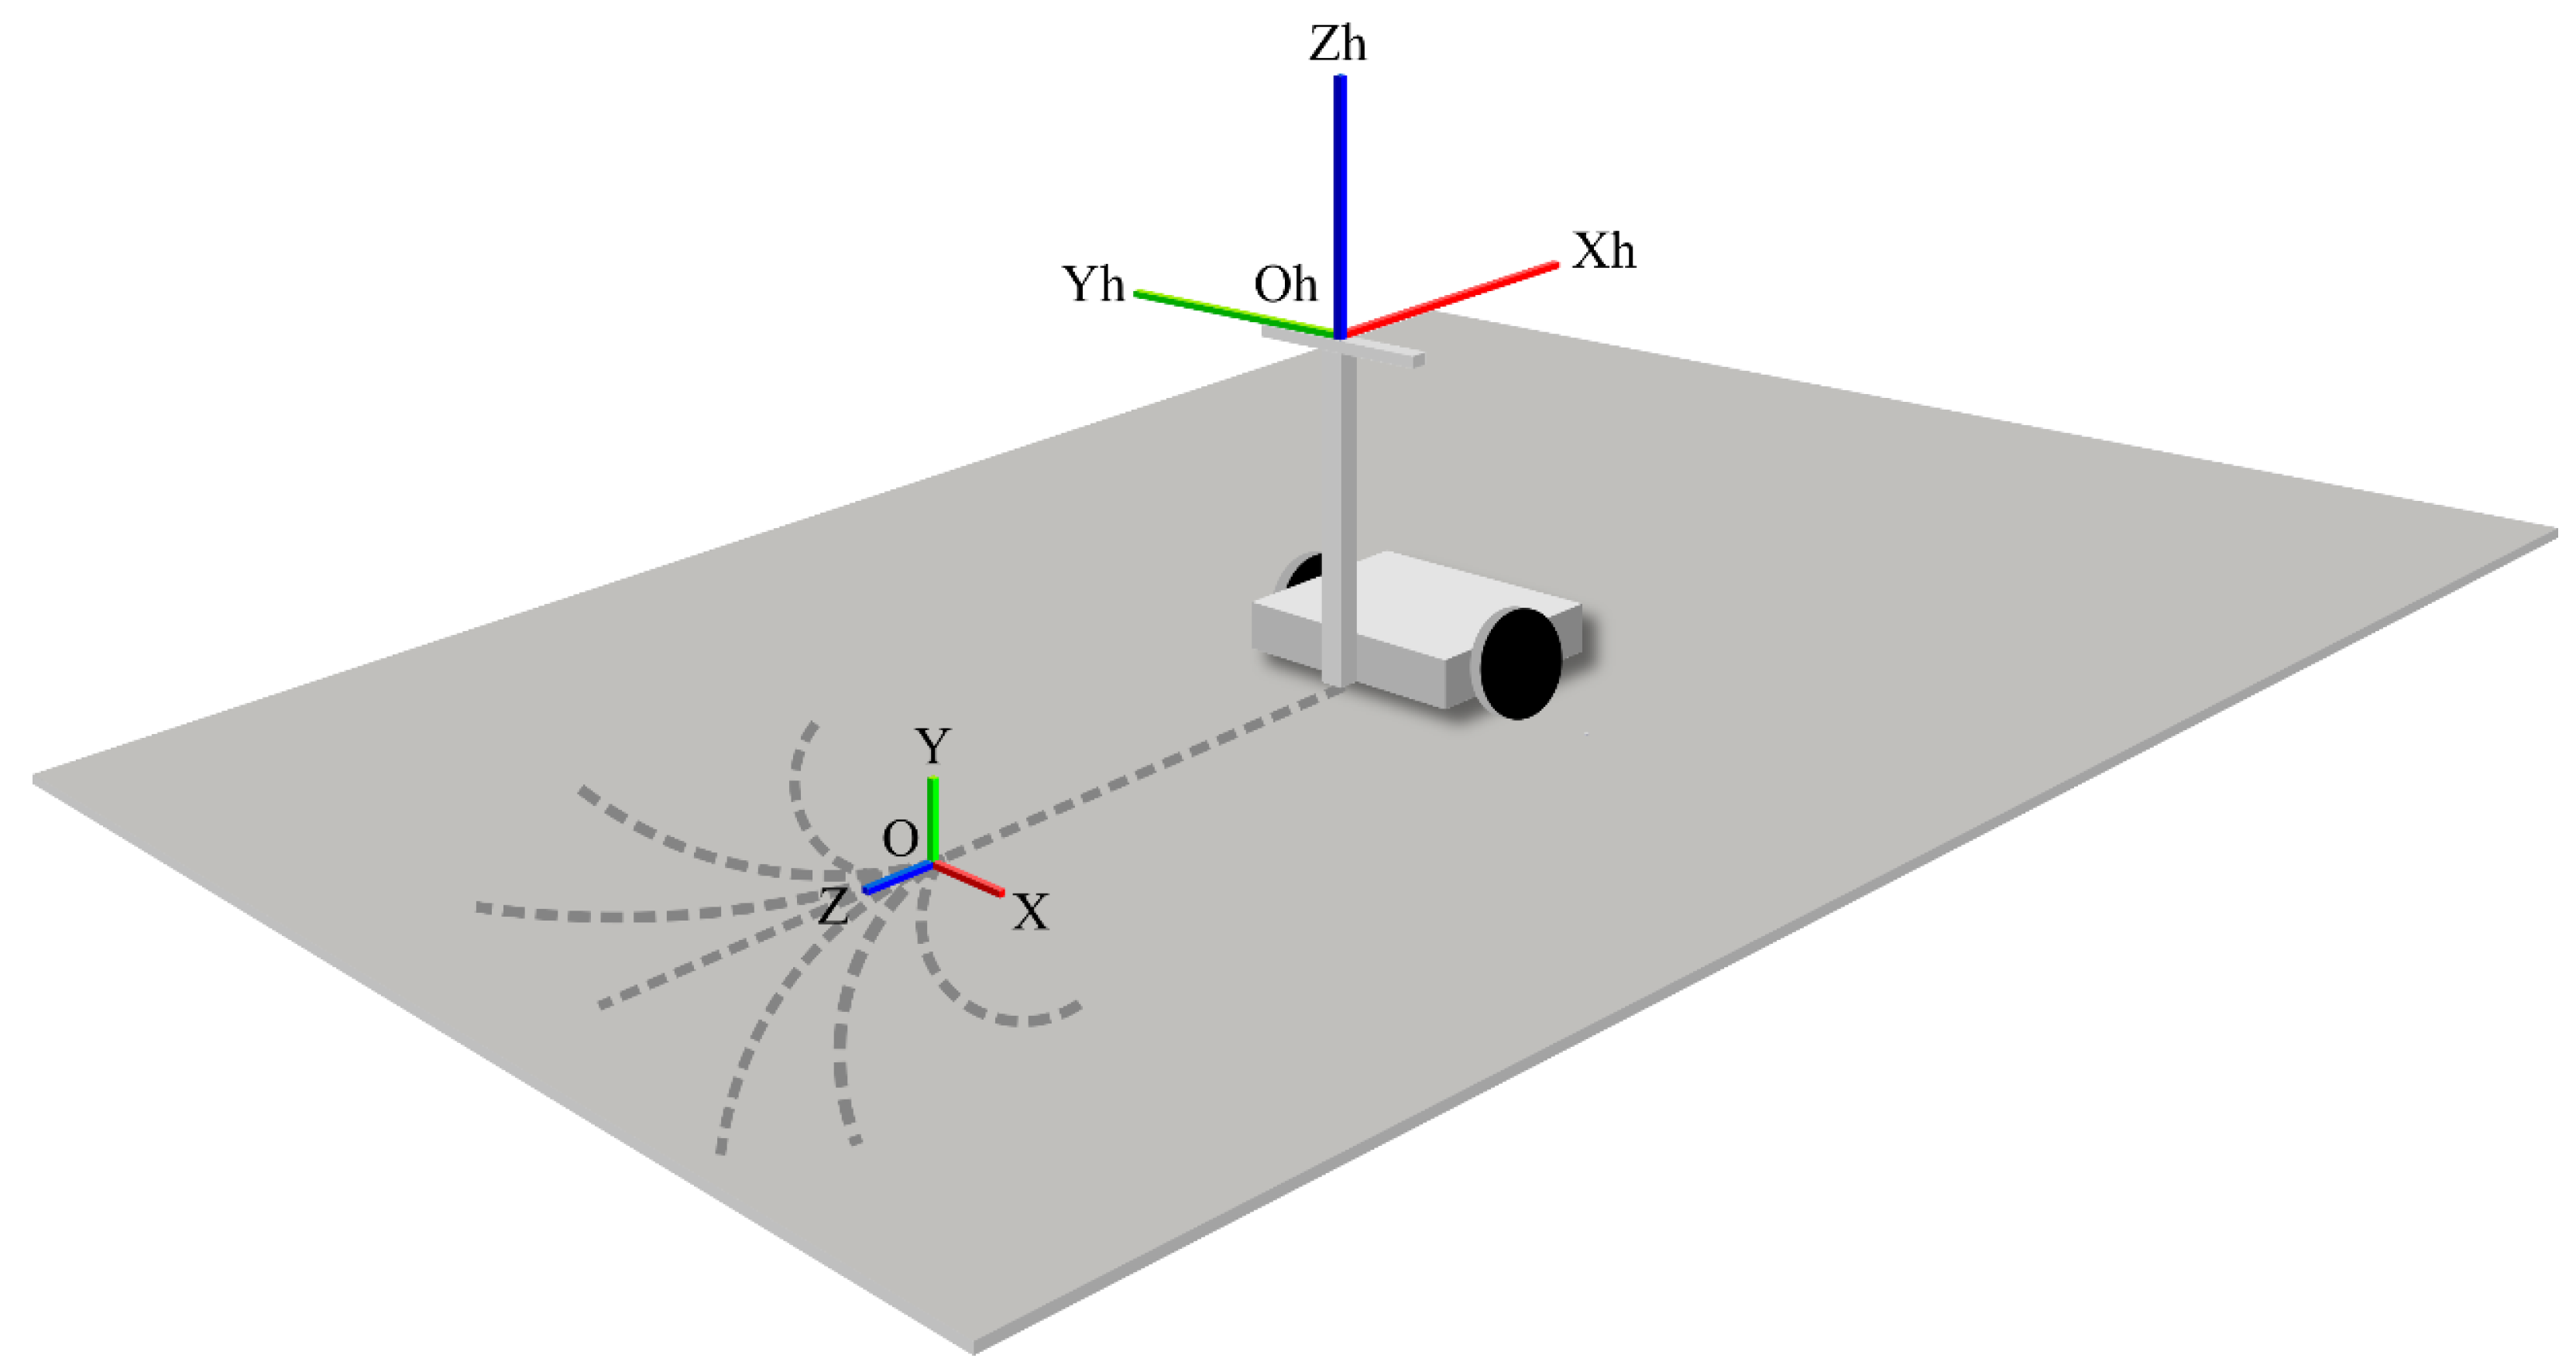
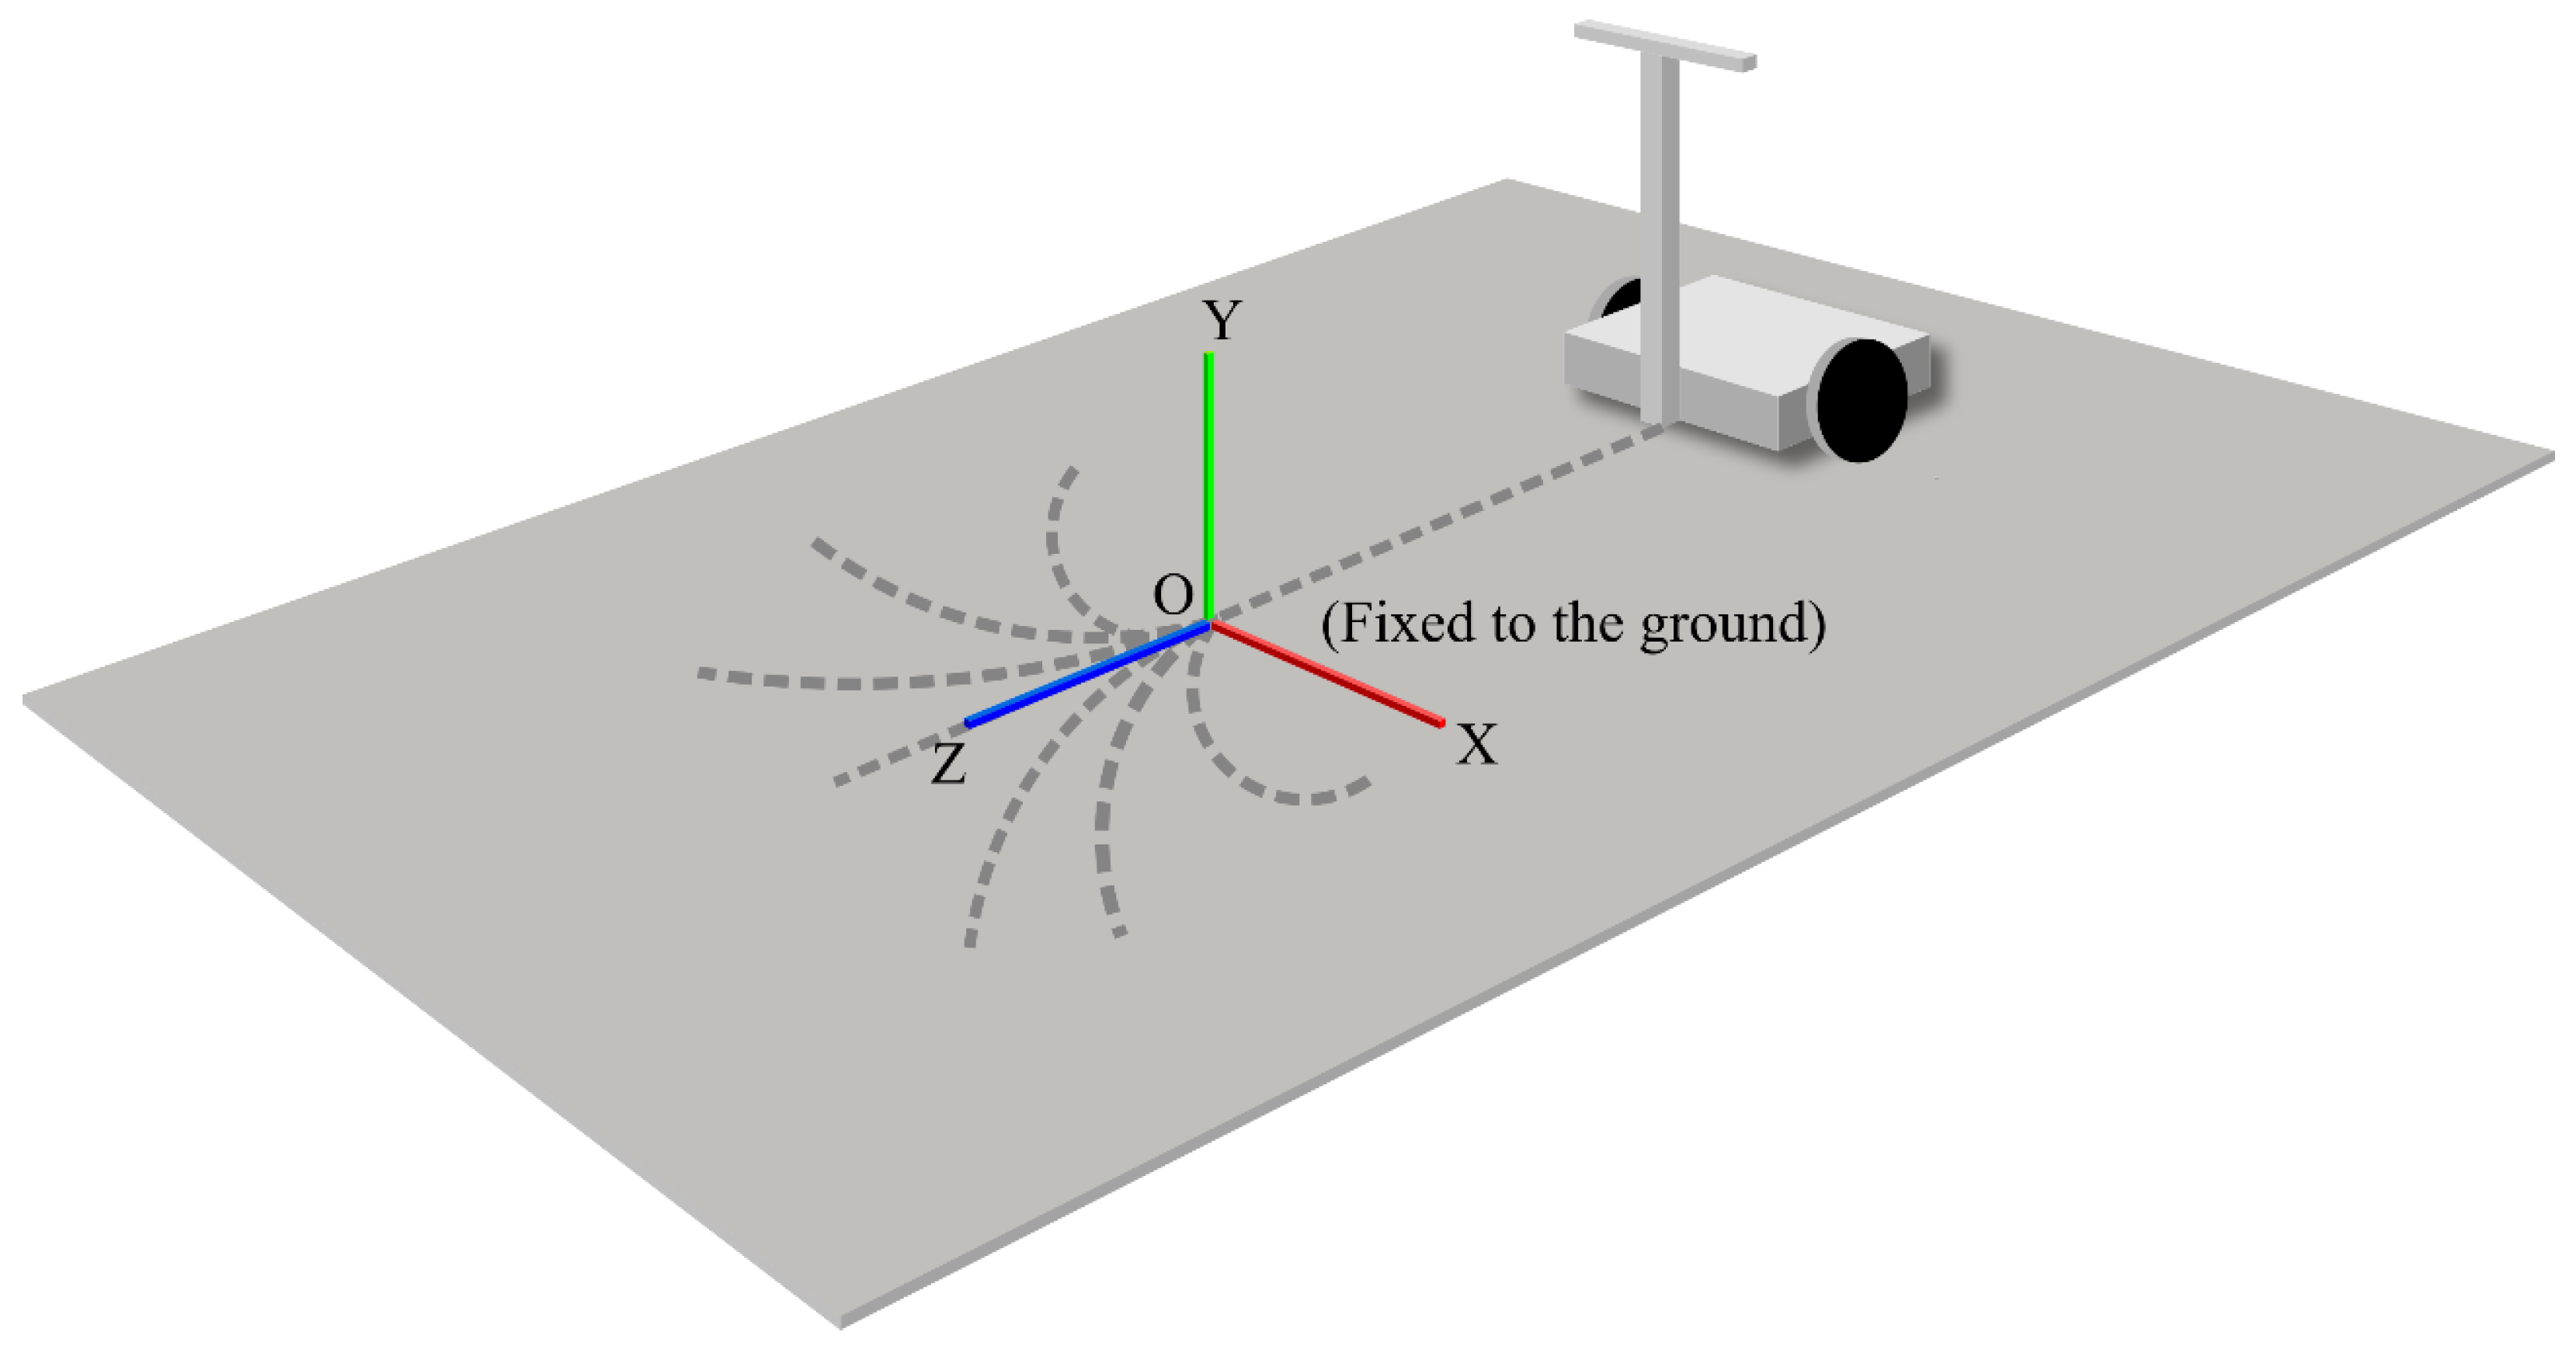
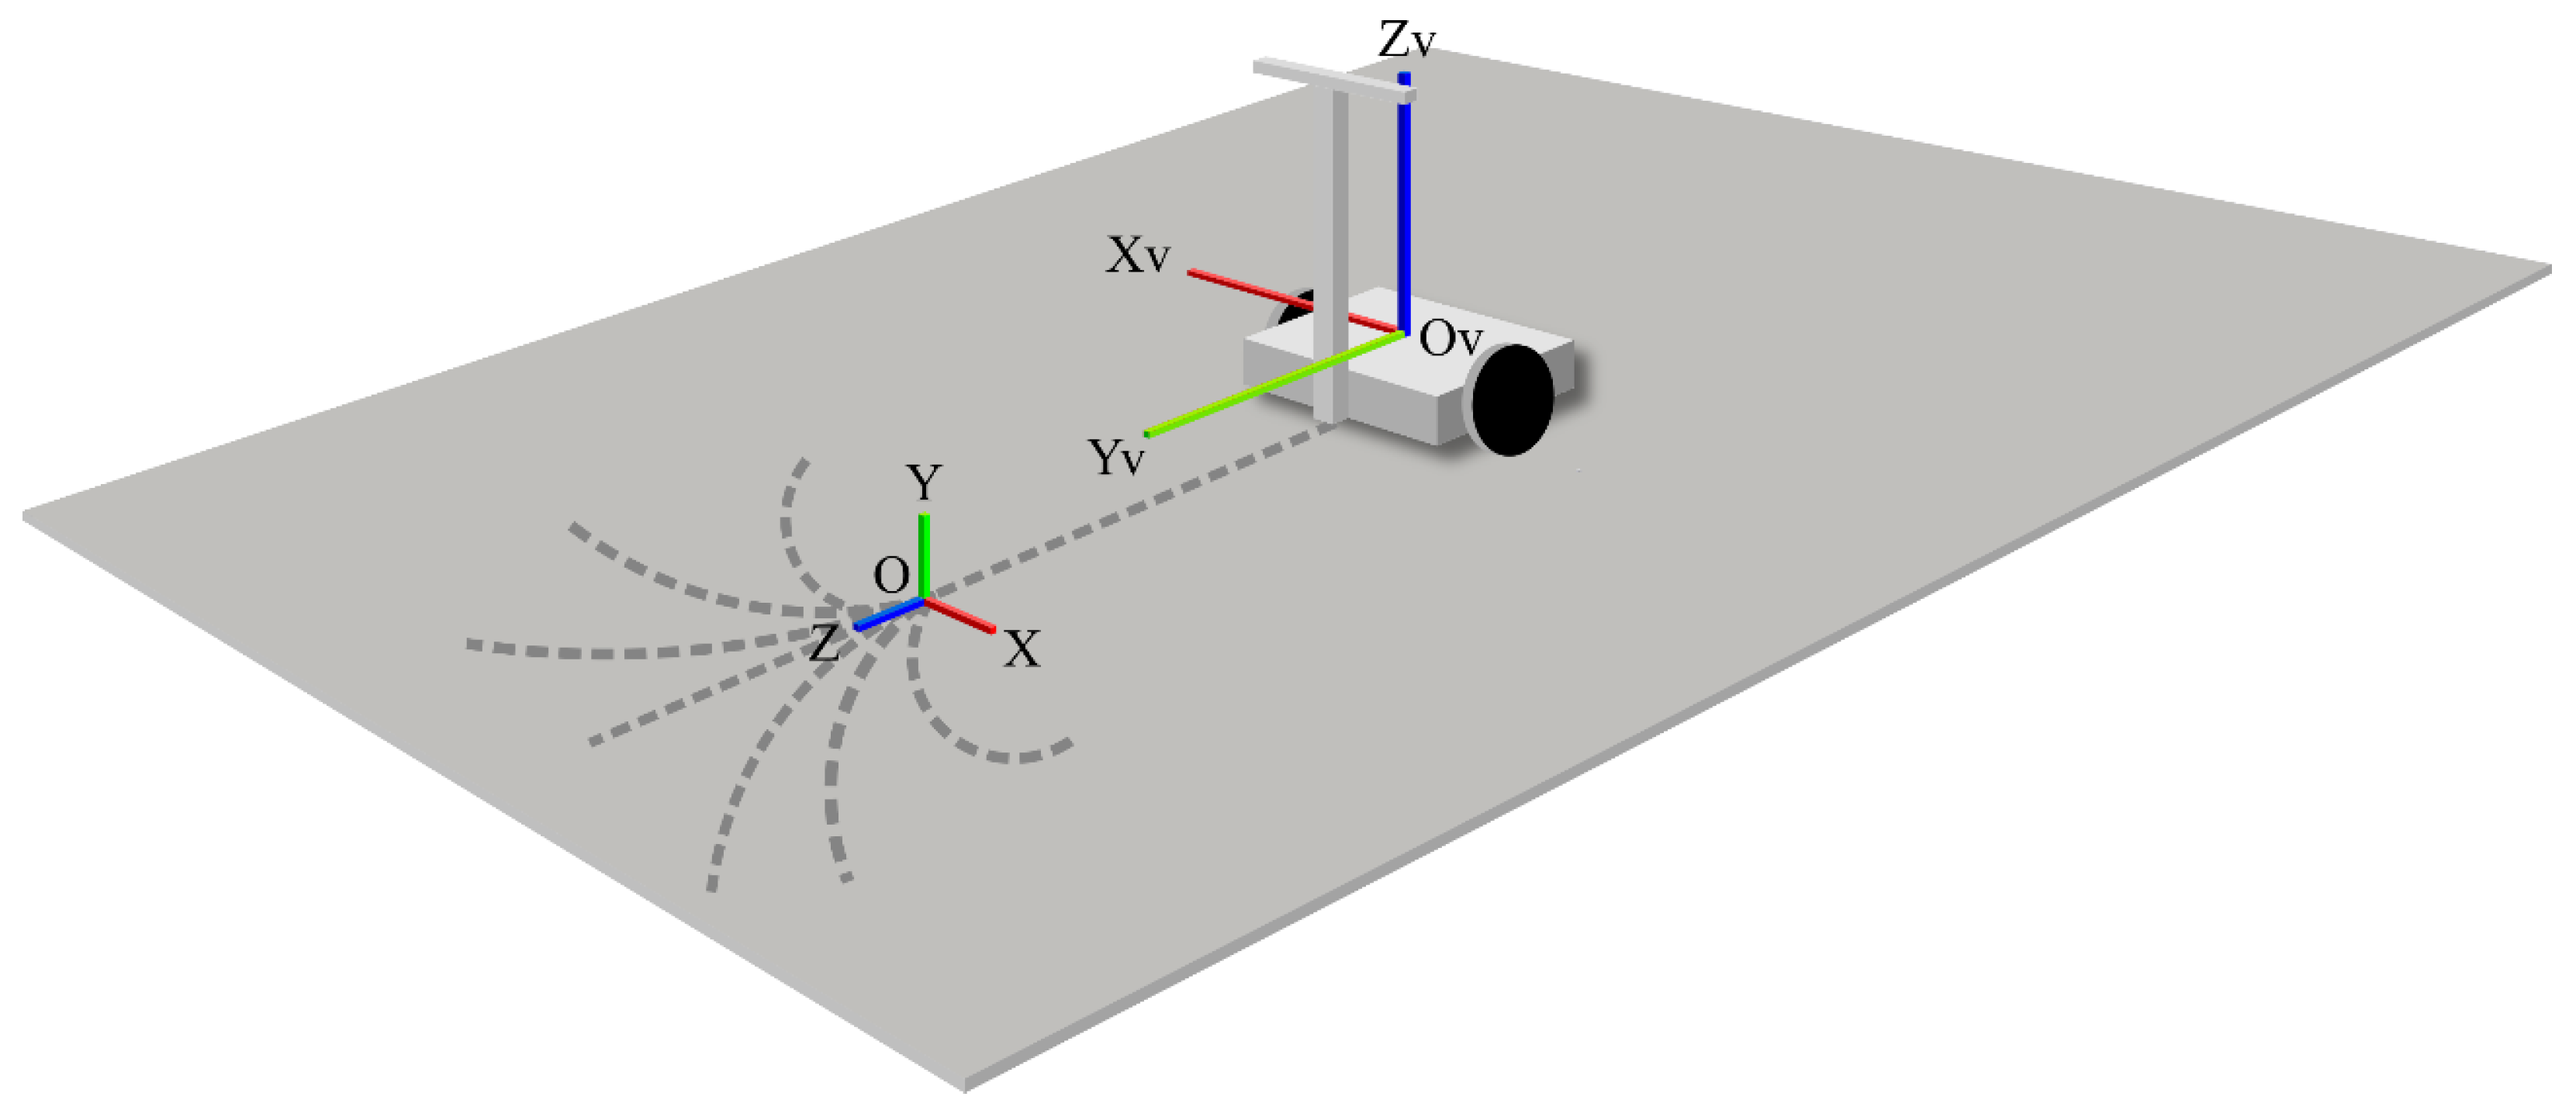
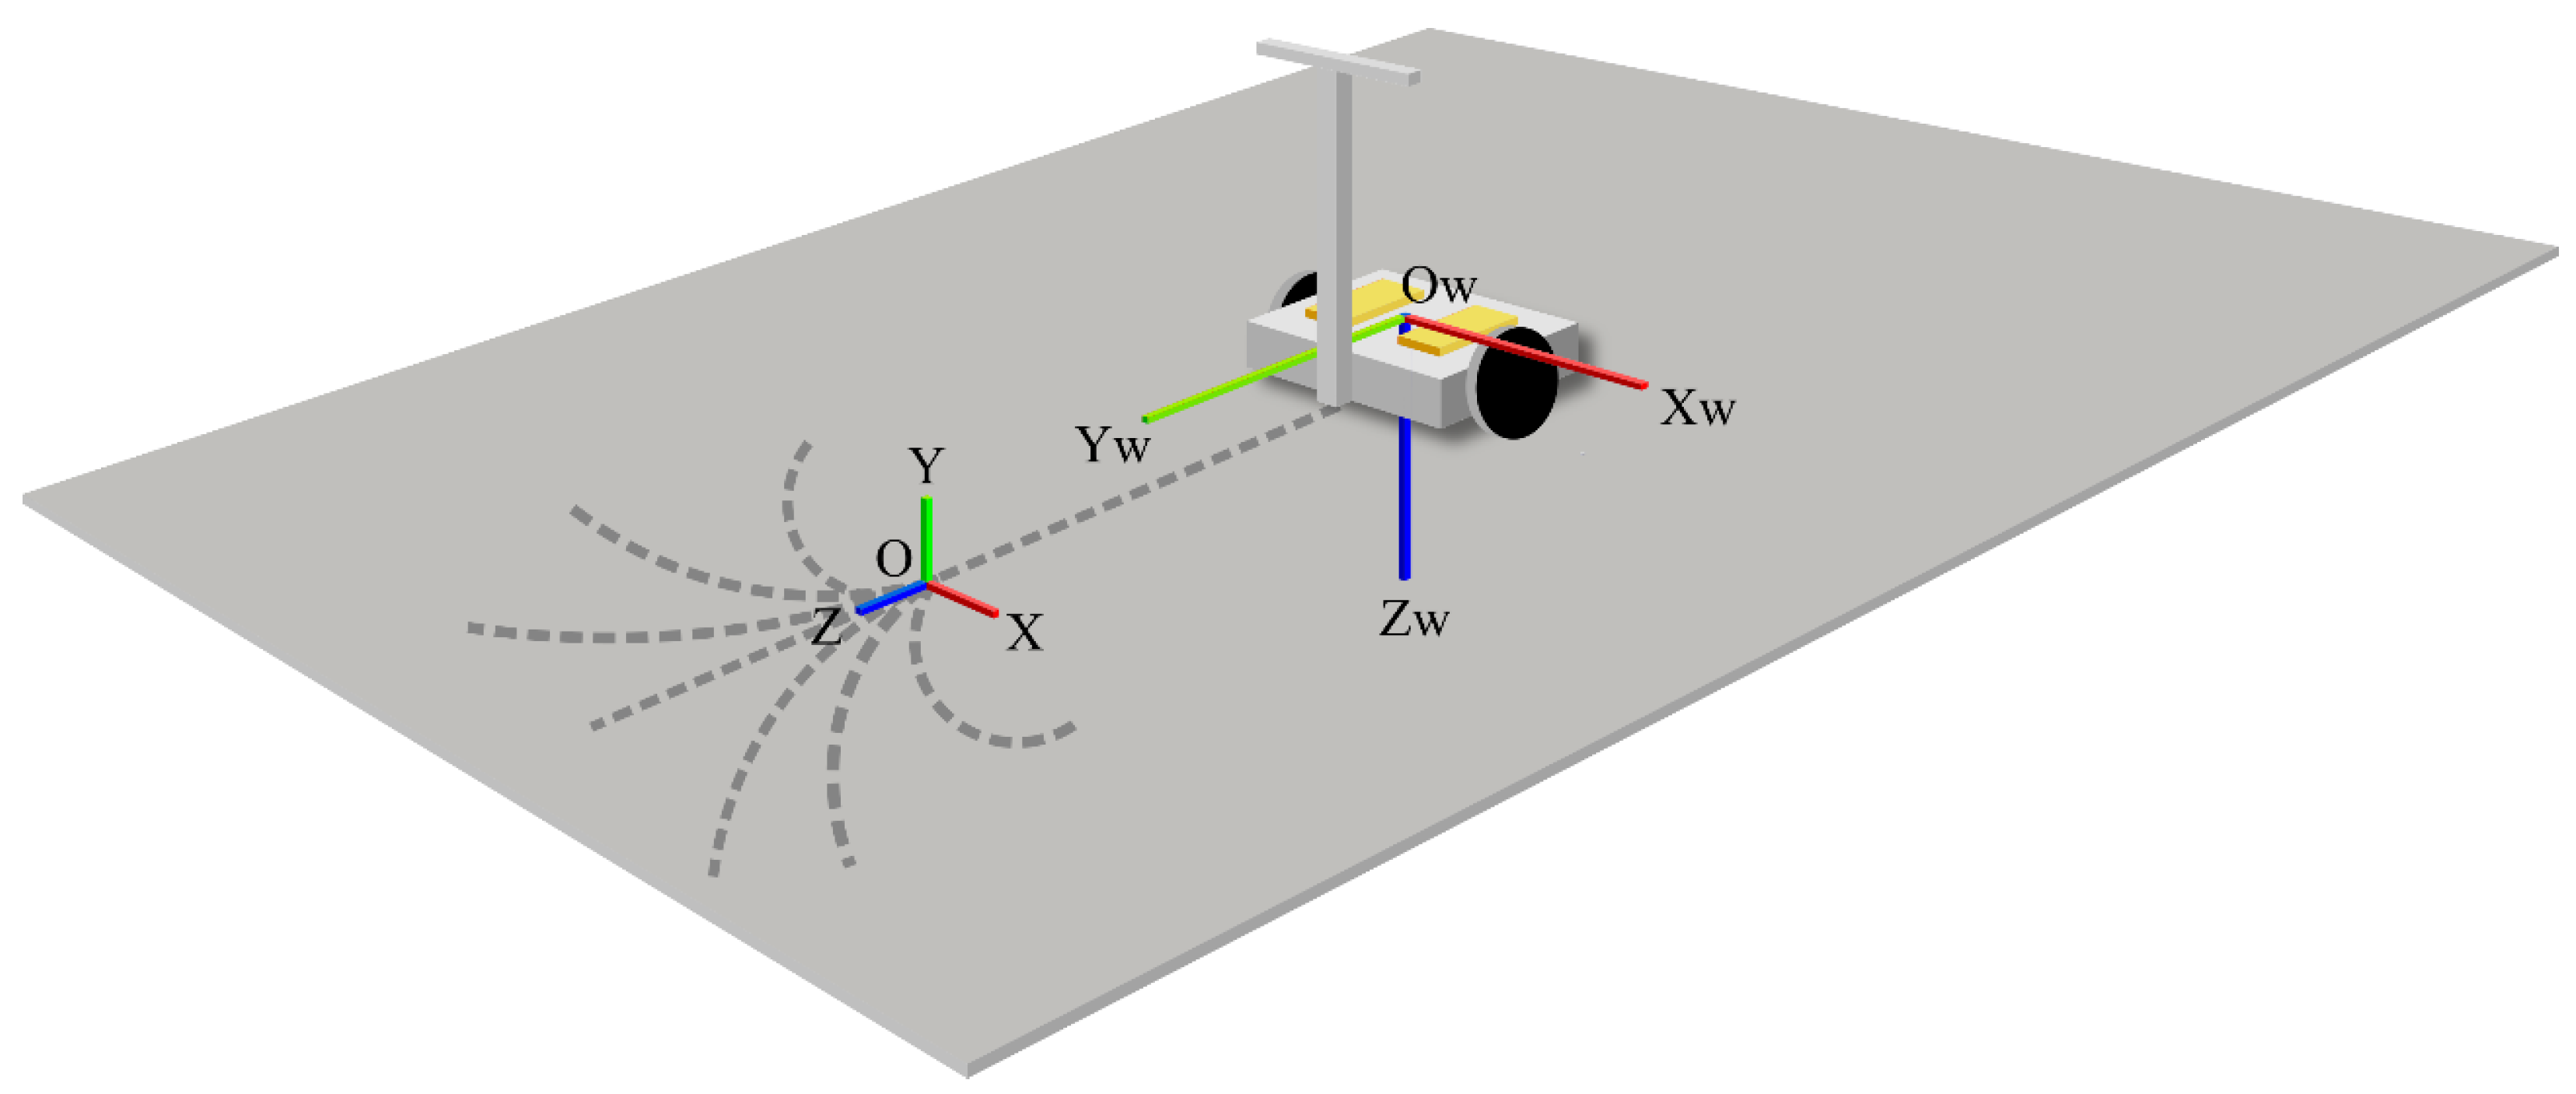
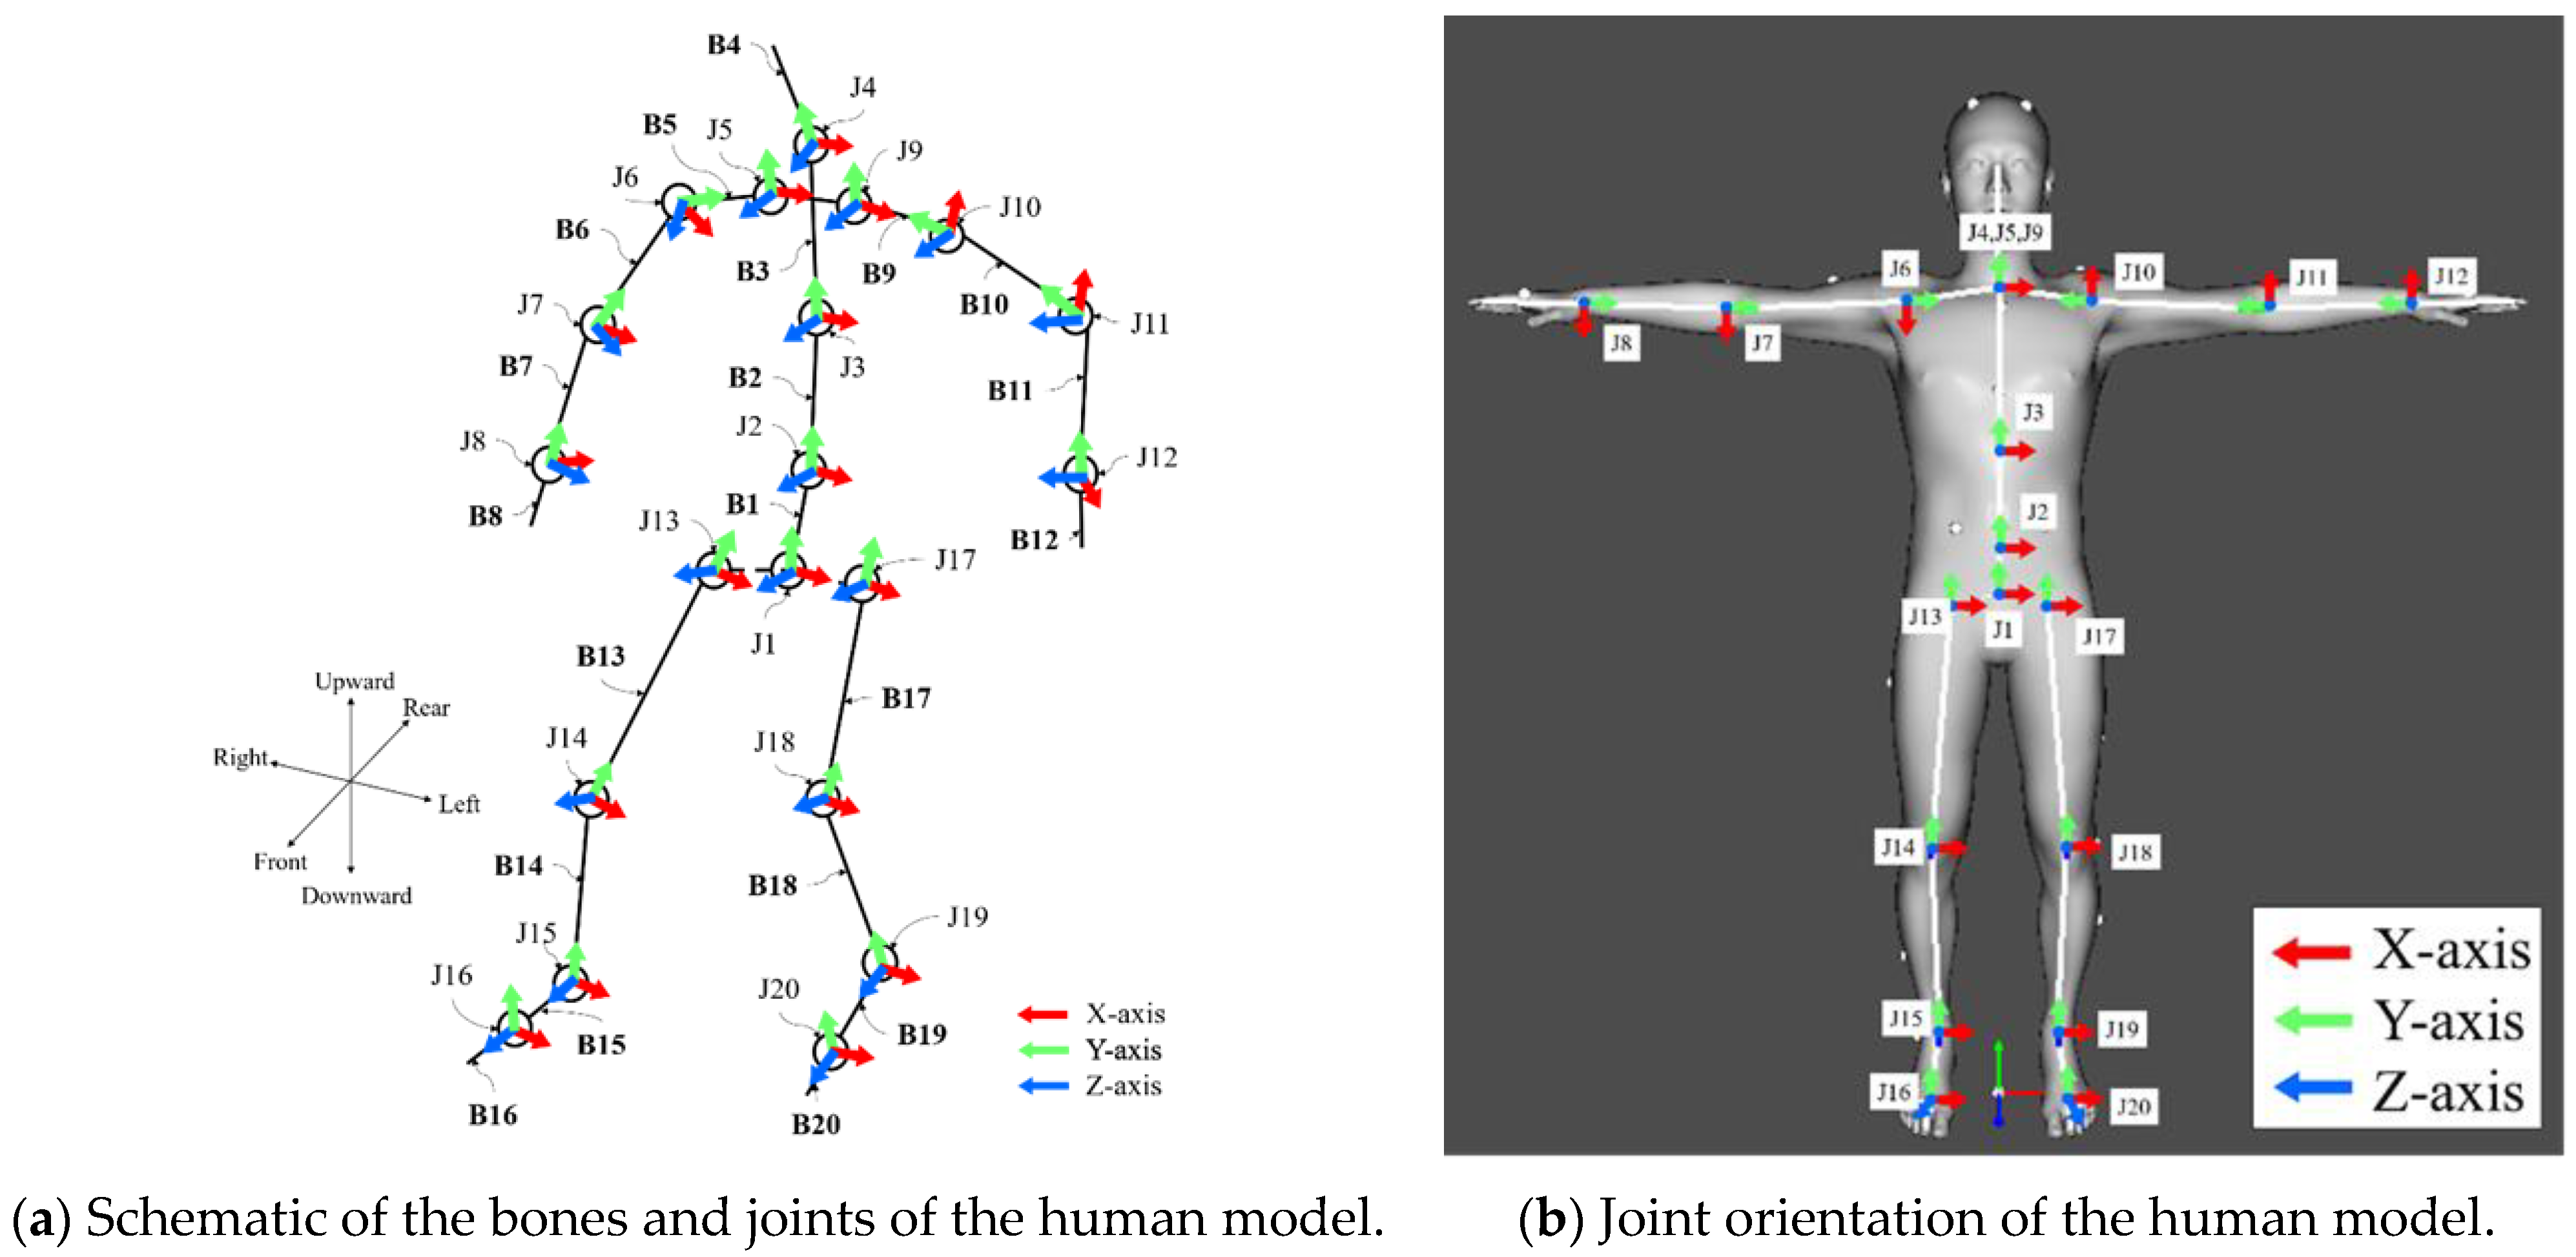
19]. The sampling rate was set to 100 Hz. Markers were attached to the driver at 39 points based on a Plug-in Gait full-body model. The position data output from the 3D motion analysis system was based on a fixed coordinate system on the ground; therefore, it was converted to a fixed coordinate system on the vehicle. Hence, the position and yaw angle of the vehicle were measured by attaching markers to the vehicle at four points, and the coordinates were converted. The positions of the markers on the vehicle are shown in
Figure 1. The fixed vehicle coordinate system was a right-handed Cartesian coordinate system with the
x-axis in the traveling direction of the vehicle,
y-axis in the lateral direction, and
z-axis in the direction that formed a right-handed system with the
x- and
y-axes. The COP, on the contrary, was measured using the floor reaction force sensor M3D-EL-FP-U-C2005 (Tech-Gihan Co., Ltd., Kyoto, Japan) (
Figure 5b), which can be attached to a human foot to measure the reaction force of one foot at a time.
3.4. Experimental Results
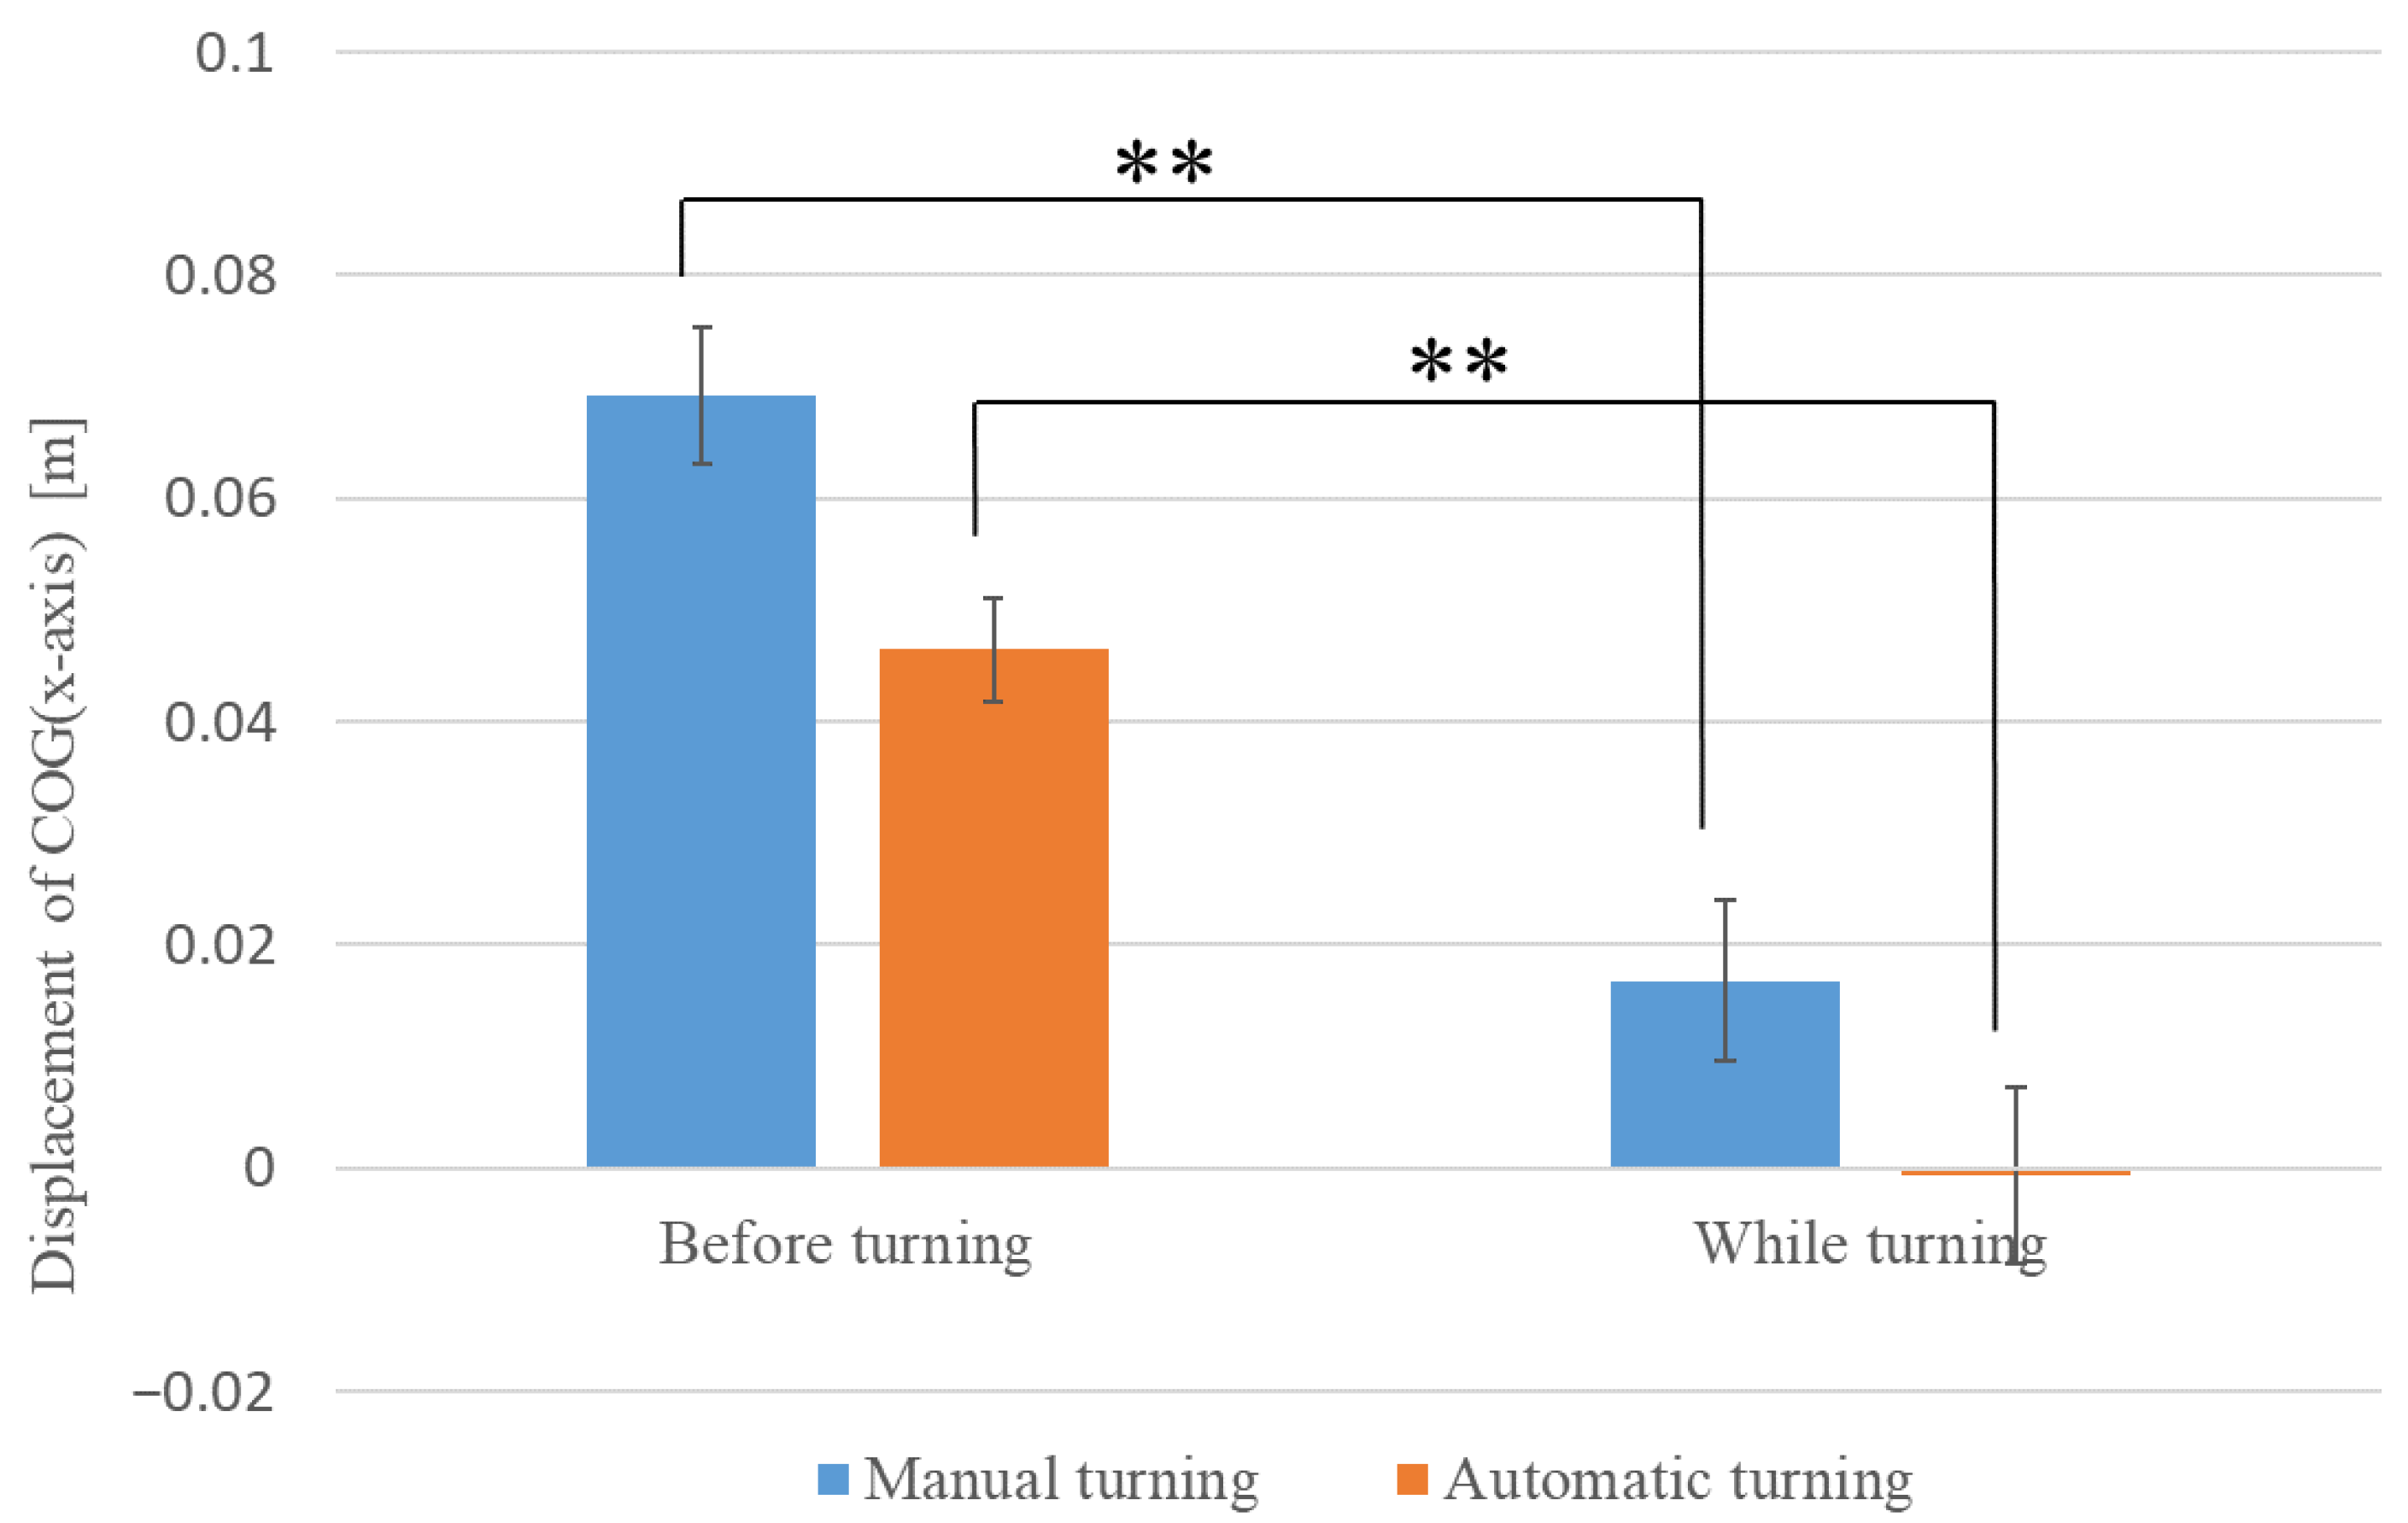
First, we examined whether the COG (
x-axis) displacement of the driver before and after turning differed between manual and automatic driving conditions. The average values of COG (
x-axis) displacement before and after turning are shown in
Figure 7. In
Figure 7, the inward direction of the turn is the positive
y-axis (the blue graph is the result of manual turning, and the red graph is the result of automatic turning). The results show that the mean displacement of the COG (
x-axis) during manual operation was 0.069 m (SE = 0.006) before turning and 0.017 m (SE = 0.007) after turning. Welch’s
t-test [
22] showed a significant difference (**) in COG (
x-axis) displacement before and after turning during manual operations (t (43) = 5.368,
p < 0.01). The mean COG (
x-axis) displacement during automatic driving was 0.046 m (SE = 0.005) before turning and −0.001 m (SE = 0.008) after turning. Welch’s
t-test showed a significant difference (**) in the COG (
x-axis) displacement before and after turning during automatic driving (t (44) = 5.060,
p < 0.01). In other words, the COG moved backward more significantly during turning than before turning, resulting in a deceleration.
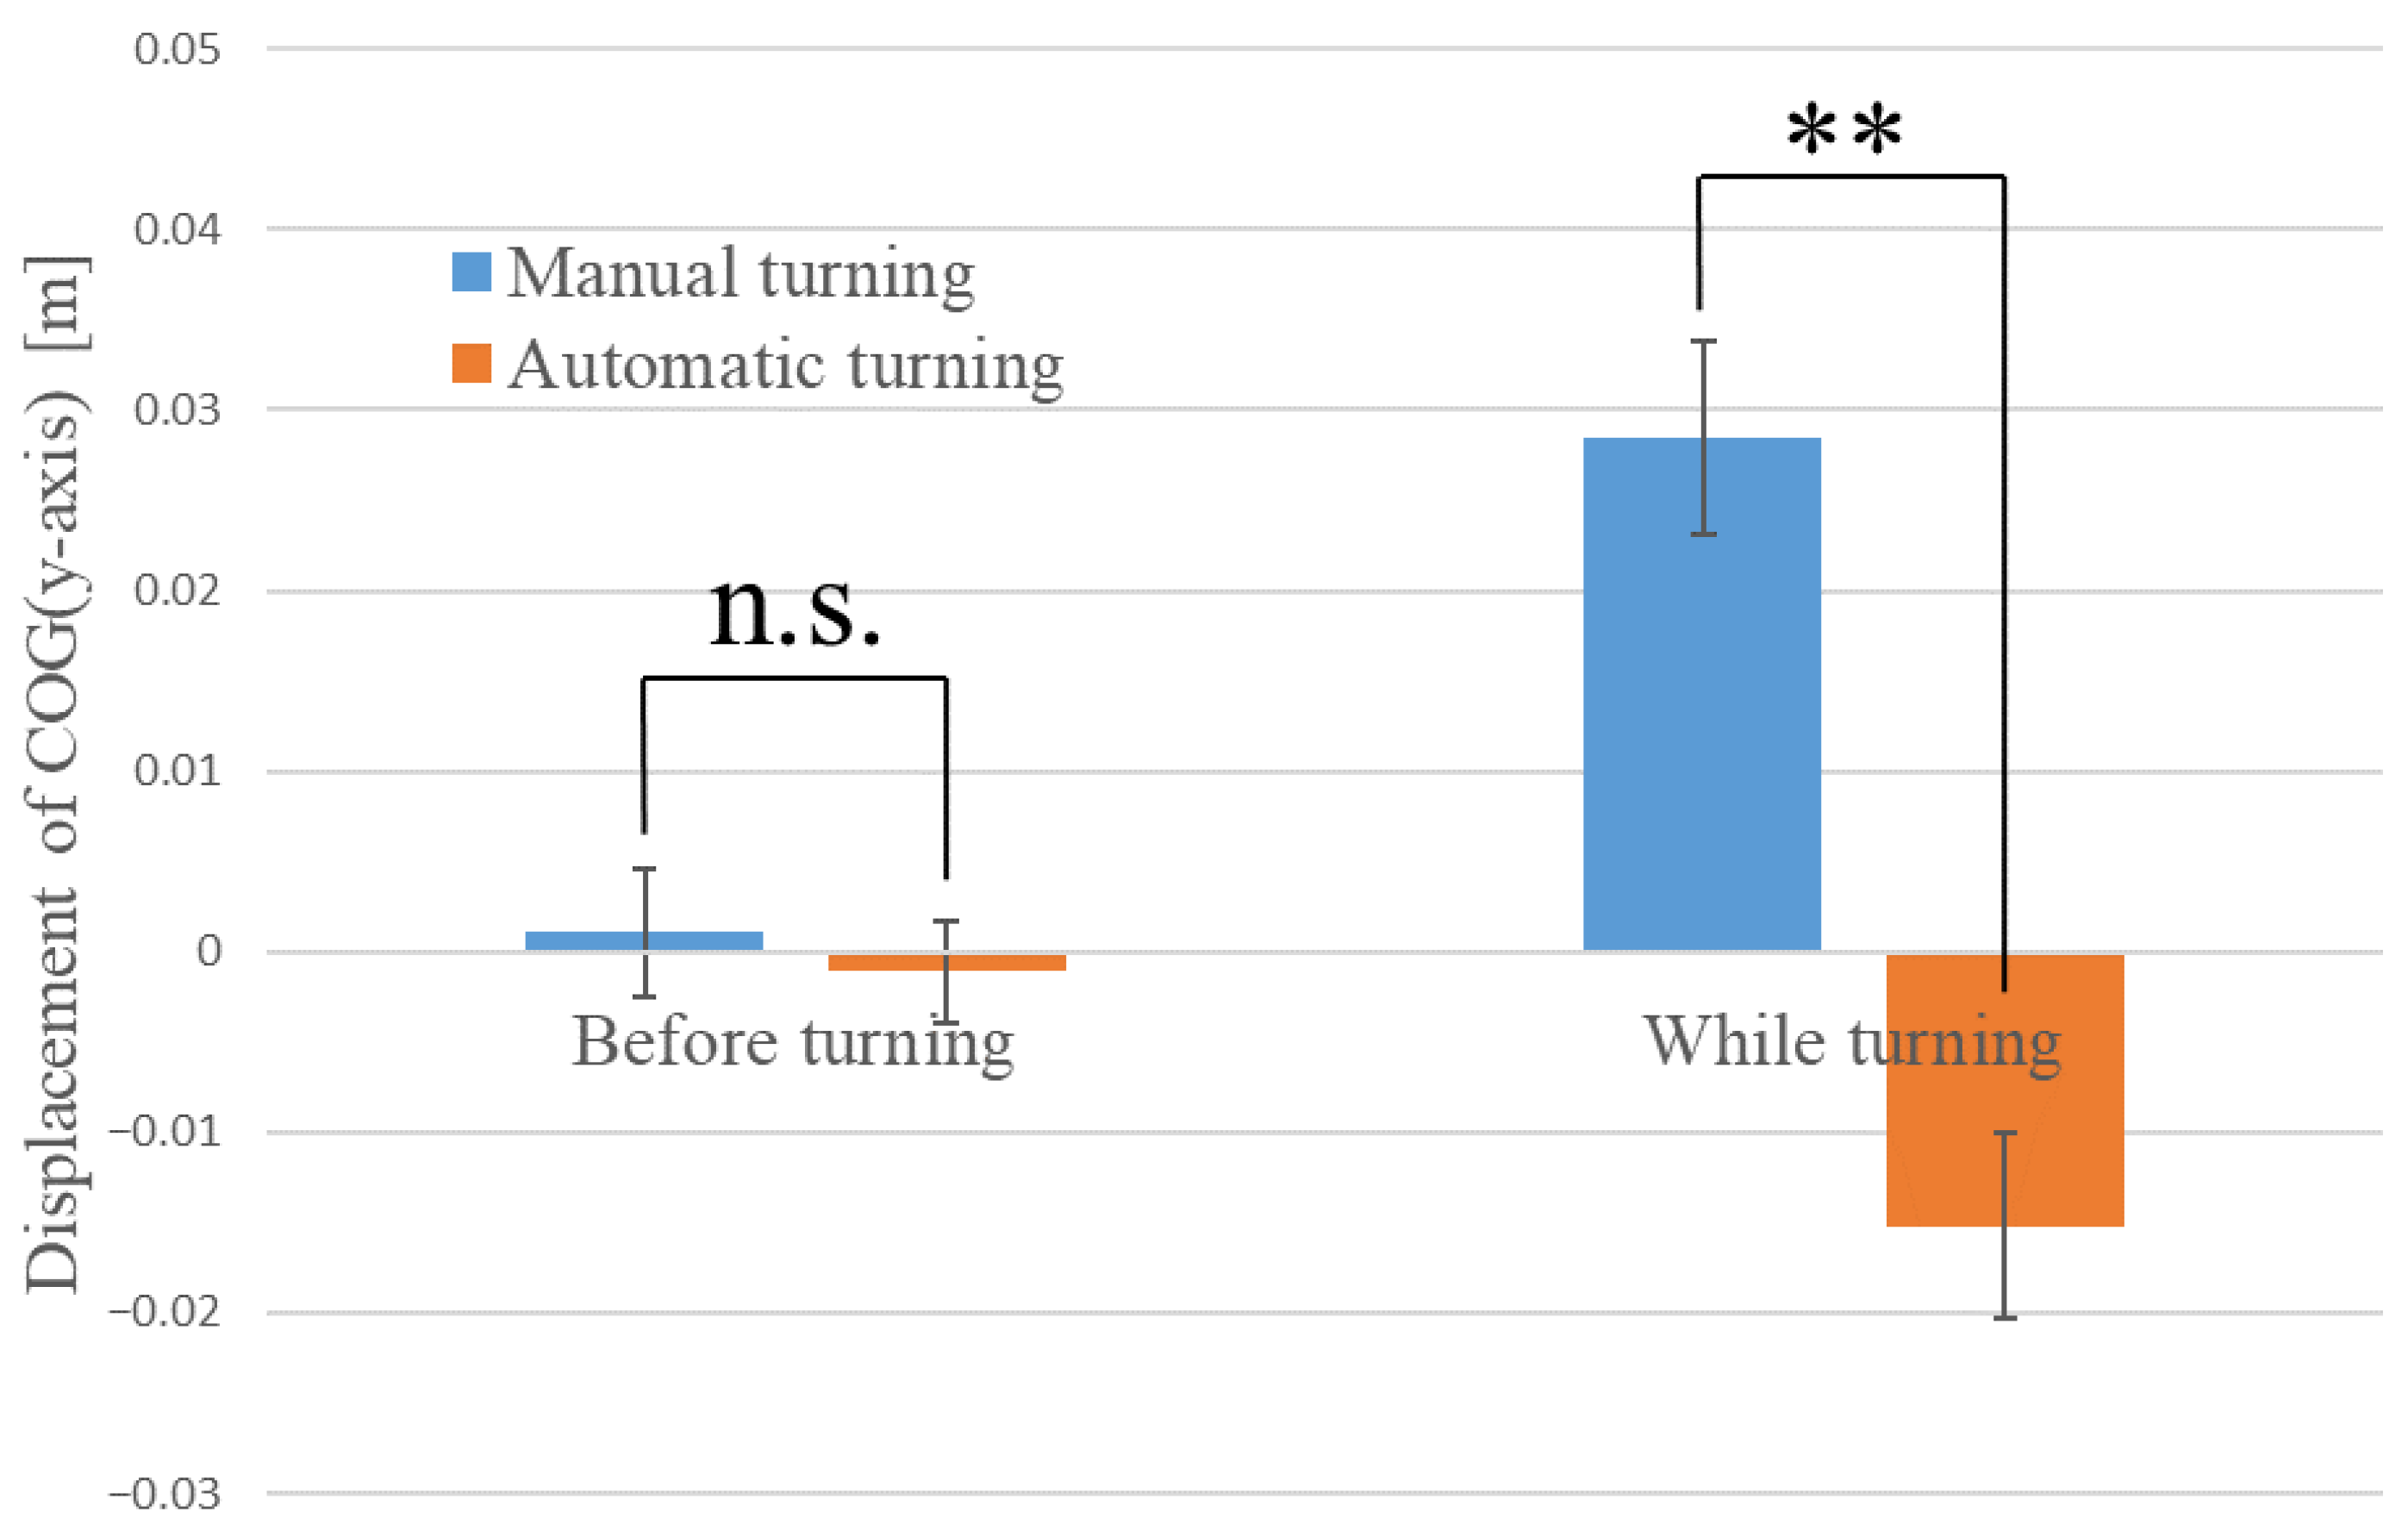
Next, we examined whether the driver’s COG (
y-axis) displacement differed between manual and automatic driving both before and after turning. The average values of COG (
x-axis) displacement before and after turning are shown in
Figure 8. In
Figure 8, the inward direction of the turn is the positive
y-axis (the blue graph is the result of manual turning, and the red graph is the result of automatic turning). The results show that the mean displacement of the COG (
y-axis) before turning was 0.001 m (SE = 0.004) for manual driving and −0.001 m (SE = 0.003) for automatic driving. Welch’s
t-test showed no significant difference (n.s.) in COG (
y-axis) displacement among the driving modes before turning (t (44) = 0.472, n.s.). The mean COG (
y-axis) displacement after turning was 0.028 m (SE = 0.005) for manual driving and −0.015 m (SE = 0.005) for automatic driving. Welch’s
t-test showed a significant difference (**) in COG (
y-axis) displacement between the driving modes after turning (t (48) = 5.719,
p < 0.01). That is, the center of gravity shifted inward during manual turning and it significantly shifted outward during automatic turning. This may be due to the centrifugal force applied to the driver during automatic turning.
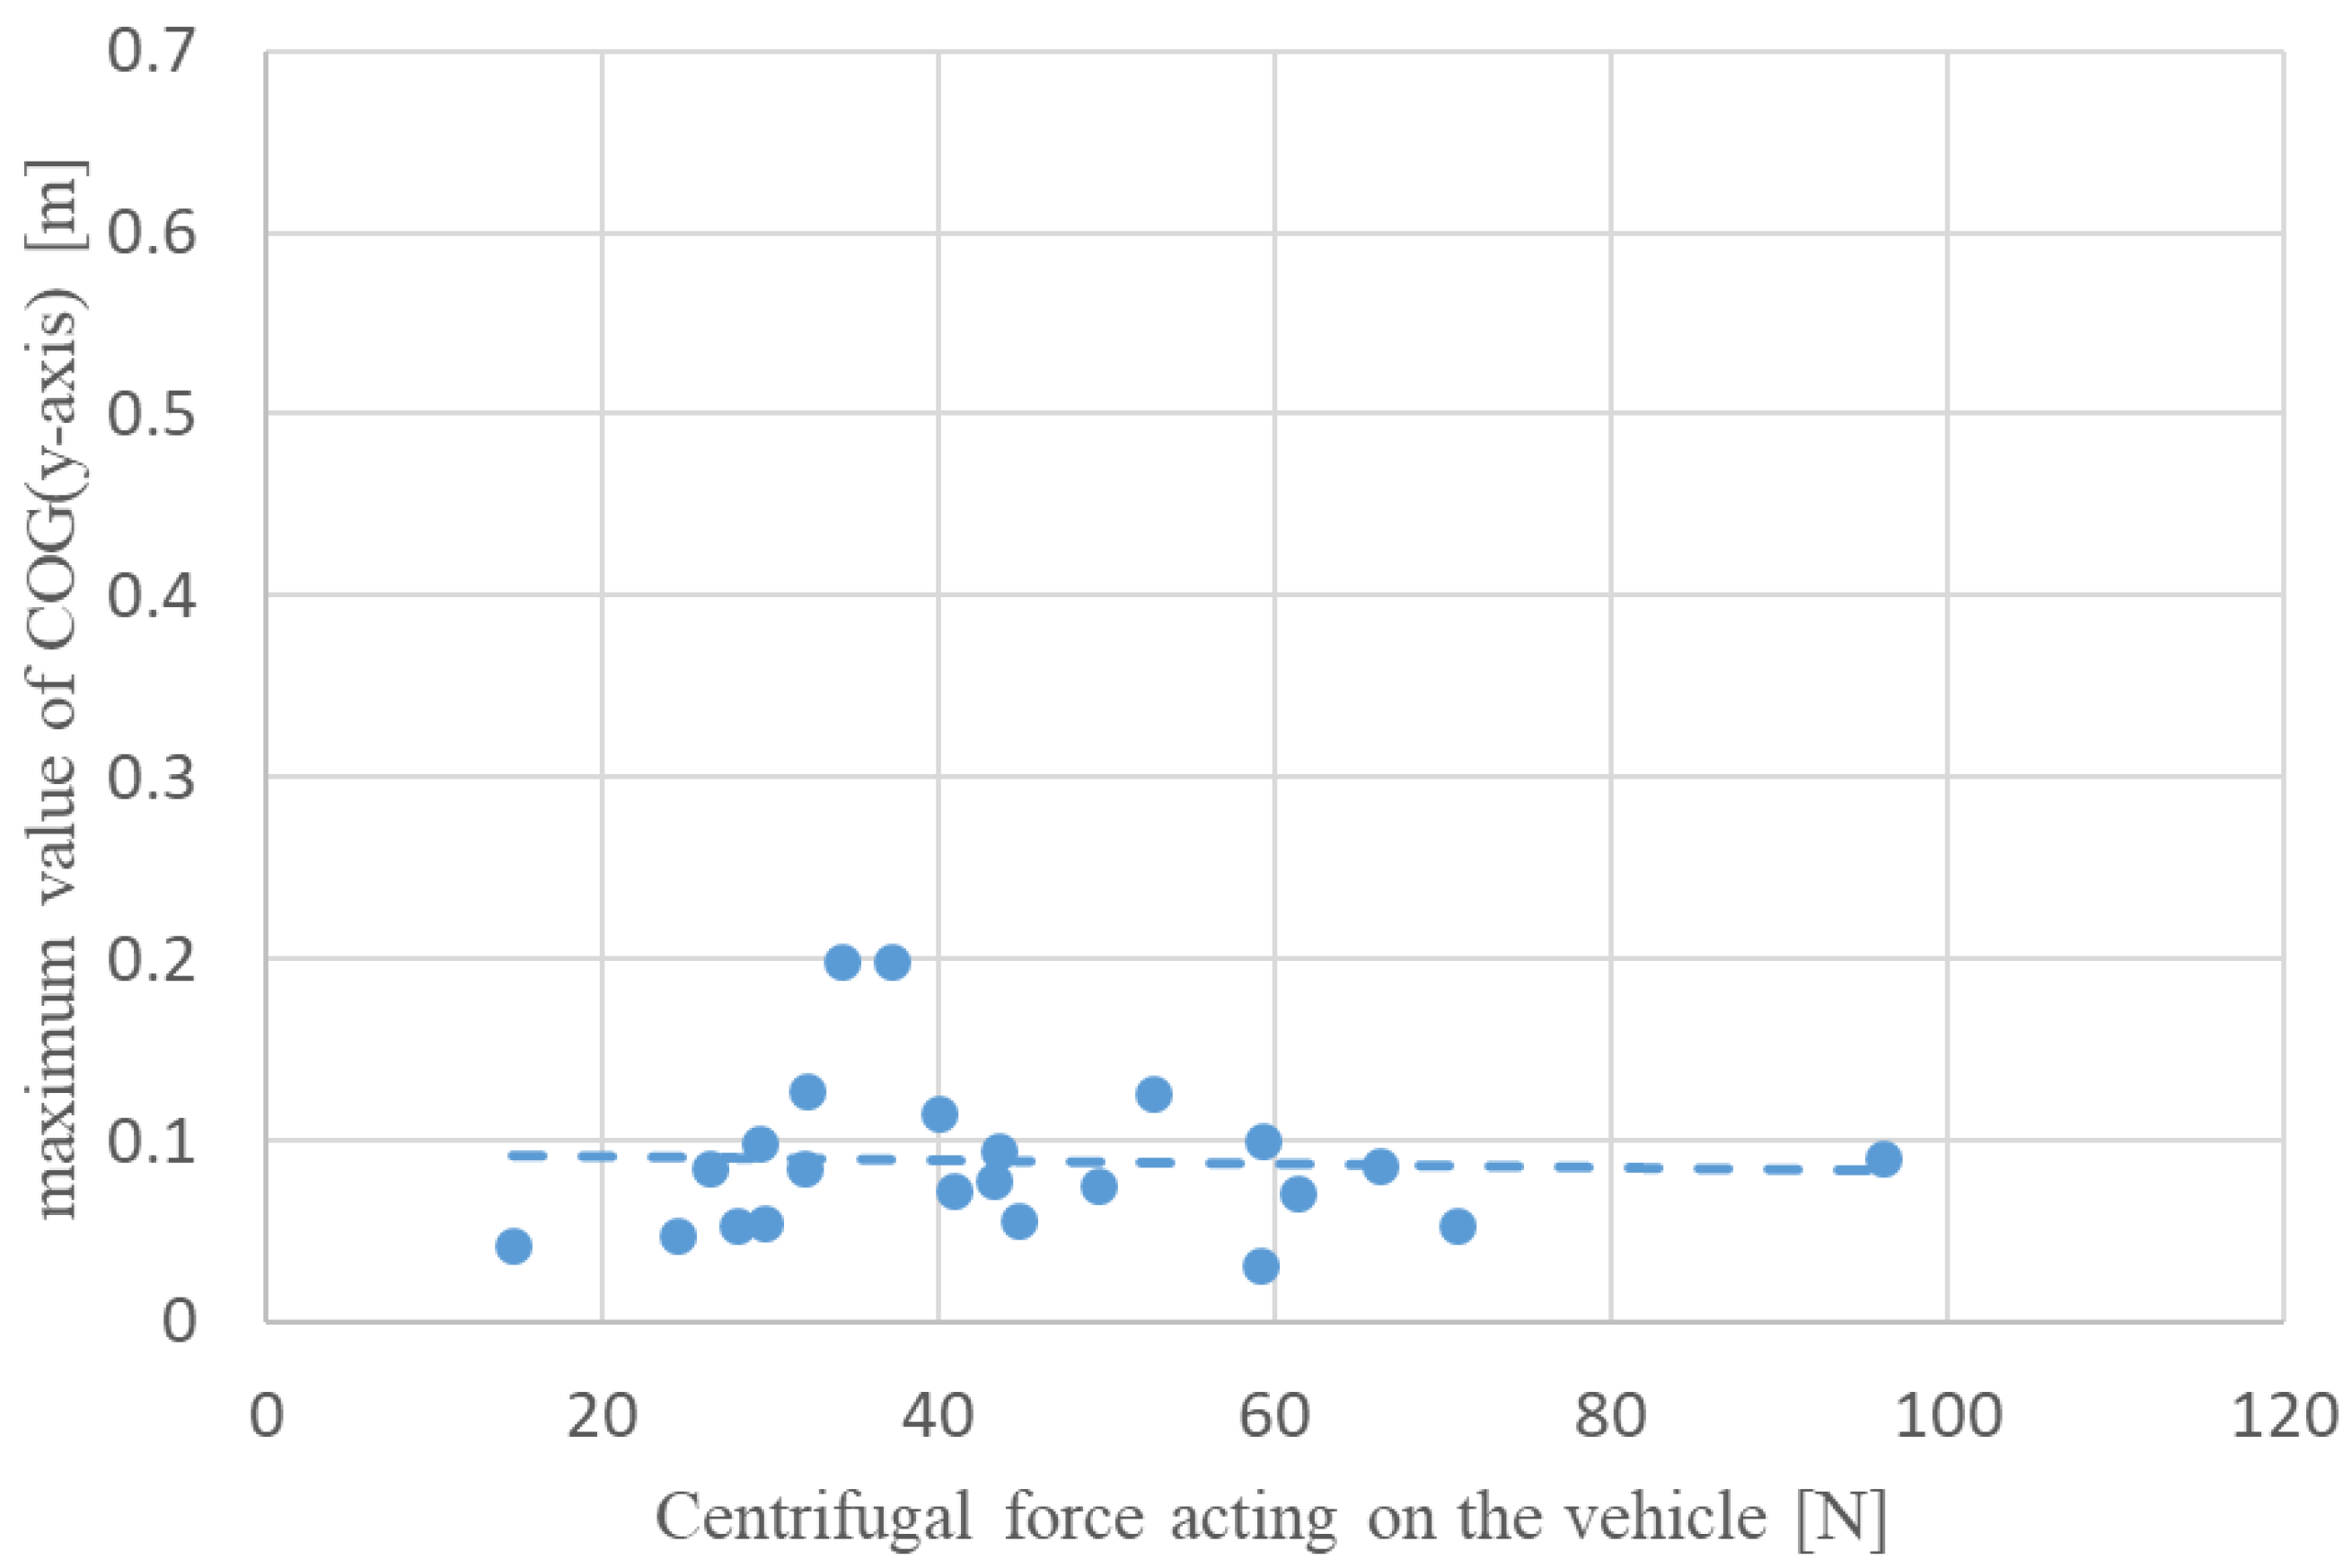
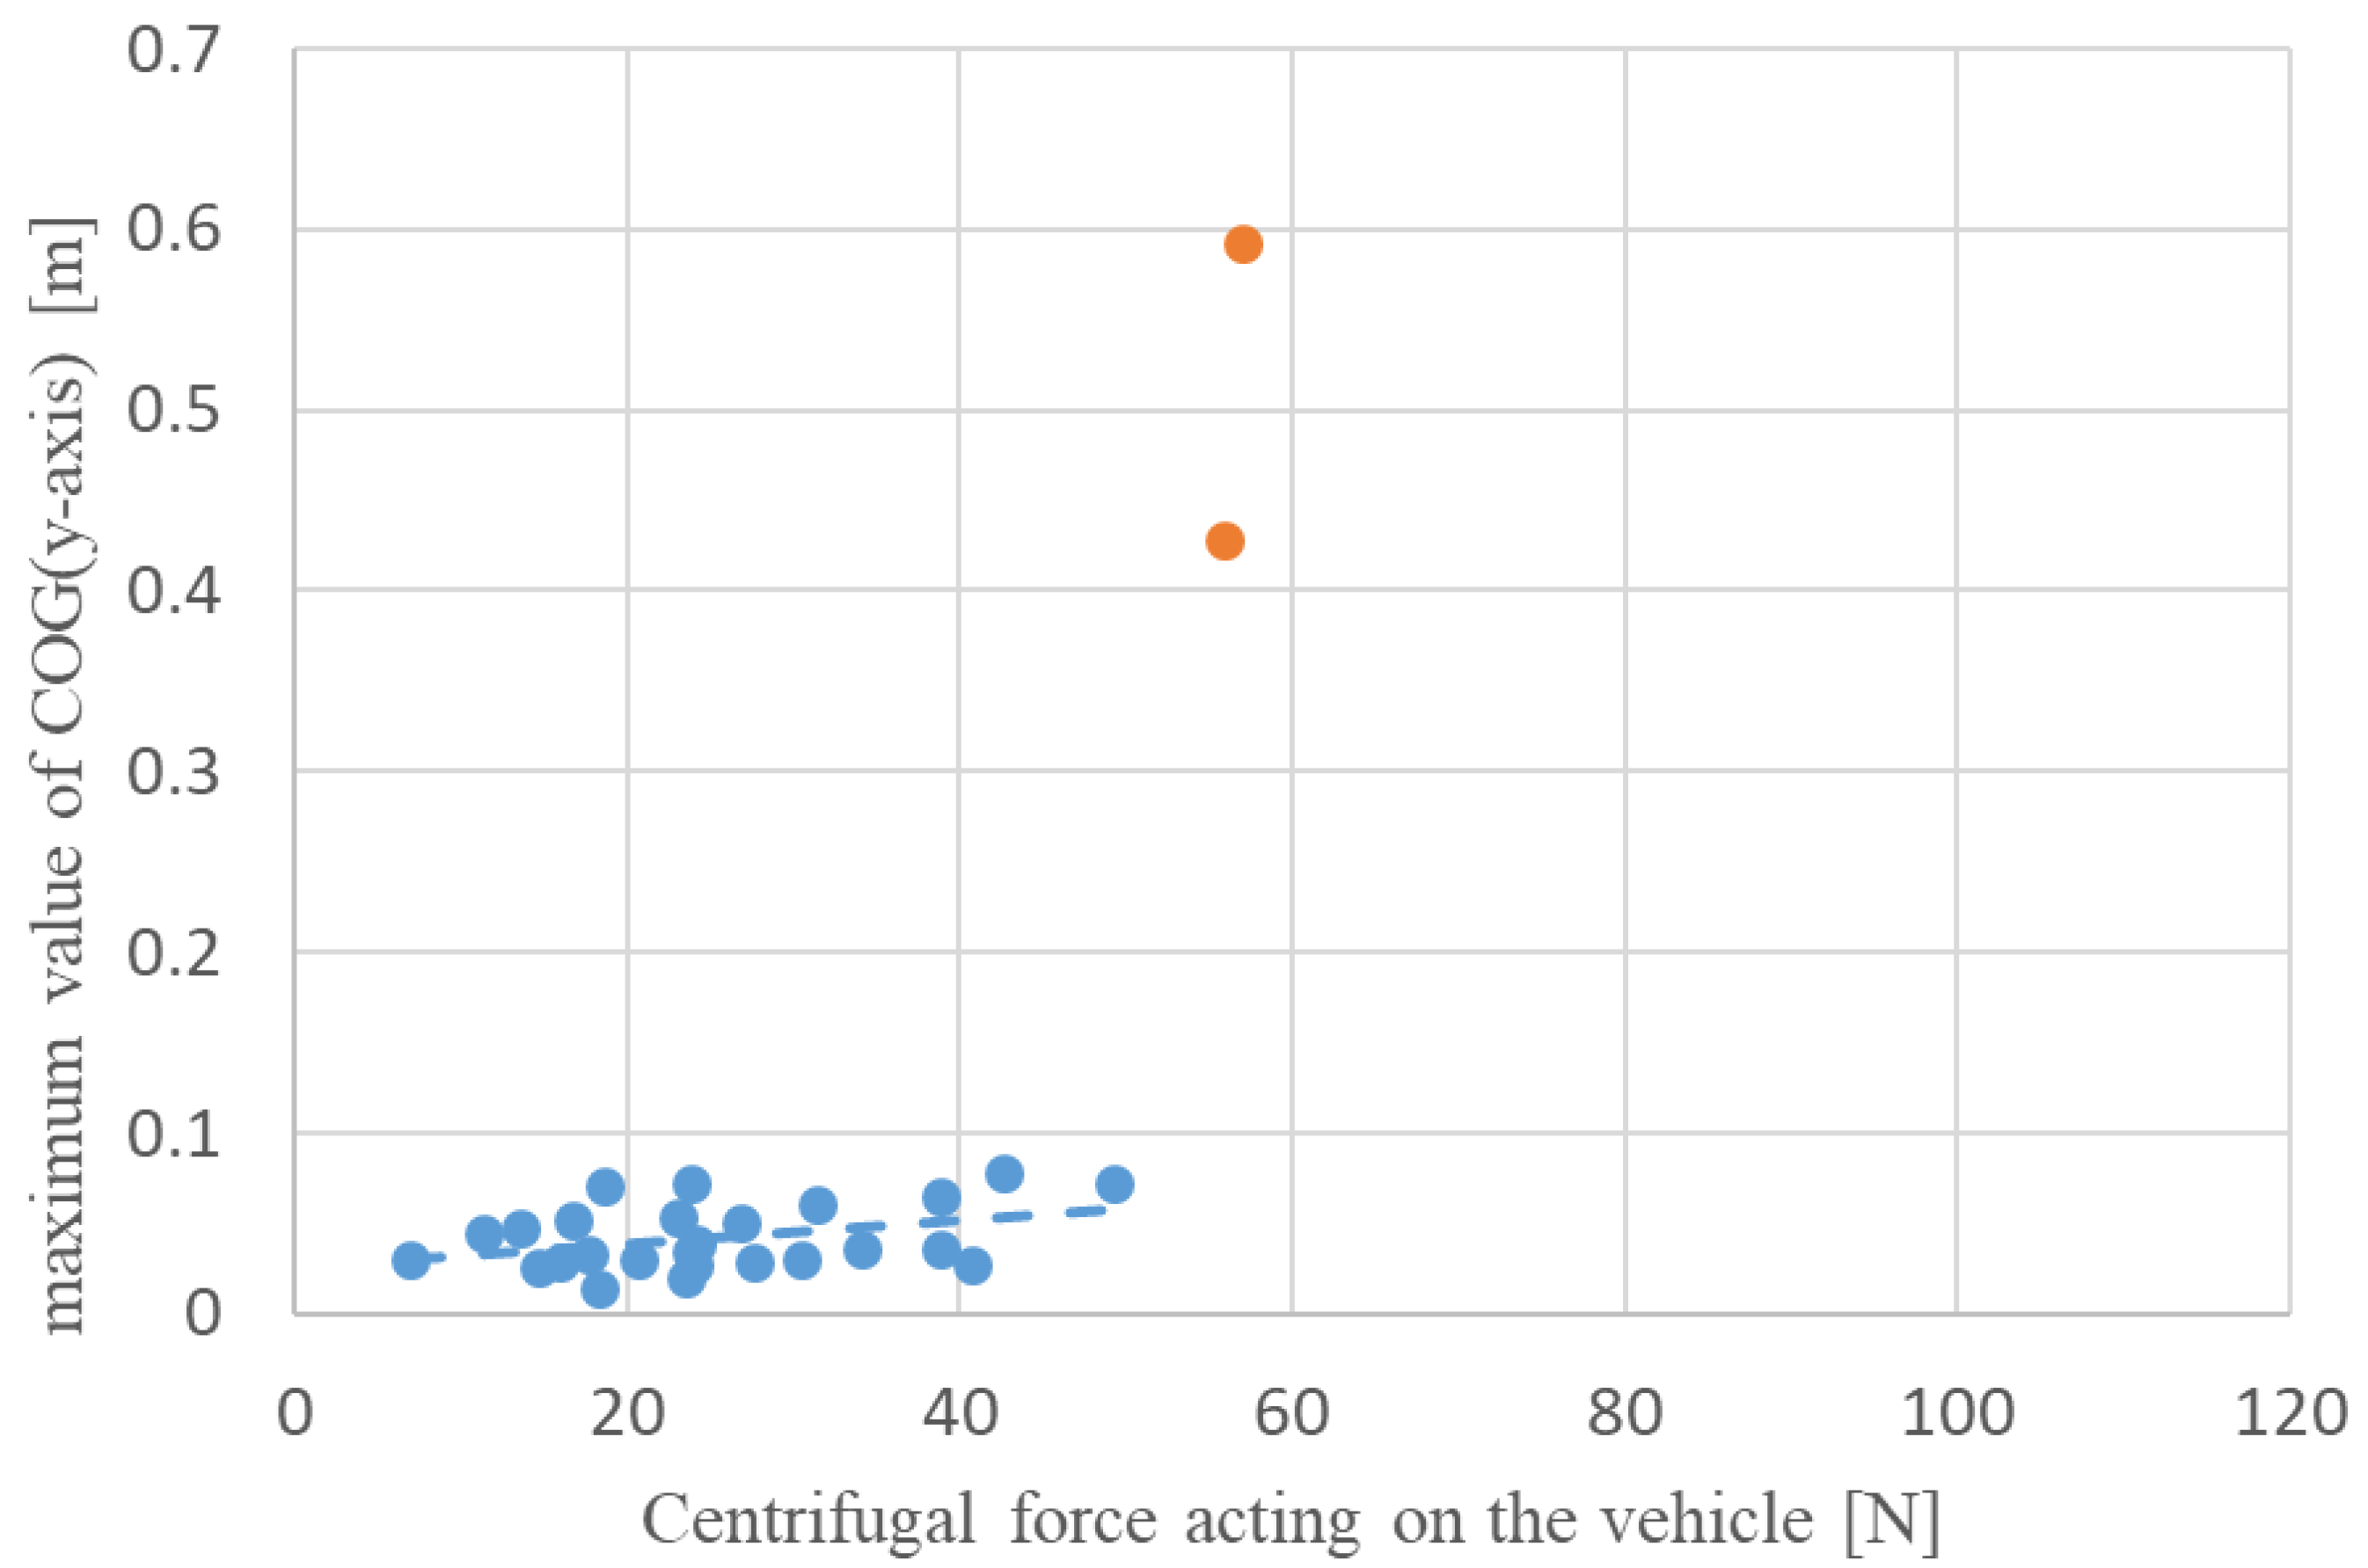
To examine the effect of centrifugal force on the lateral attitude stability of the driver during a turn, the relationship between the average value of centrifugal force and the maximum value of COG (
y-axis) displacement during turning for the manual and automatic turning conditions was determined, as shown in
Figure 9 and
Figure 10. The data indicated with red dots in
Figure 10 represent the fallen condition. The correlation coefficients for each scatter plot were −0.004 and 0.378 for manual and automatic turning, respectively, indicating a weak positive correlation between the centrifugal force and the maximum COG (
y-axis) displacement for automatic turning. The lack of correlation in manual turning can be attributed to a larger COG (
y-axis) displacement caused by turning the handle in the roll direction inside the turn than the effect of the centrifugal force. This indicates that the driver is easily affected by centrifugal force during automatic turning, and that there is a risk of falling when the centrifugal force acting on the vehicle exceeds approximately 50 N.
The mean value of the maximum displacement of the COG (y-axis) for each driving style was calculated to examine the extent to which the driving mode (manual or automatic) affects the lateral posture stability of the driver. The results were 0.089 m (SE = 0.009) and 0.043 m (SE = 0.003) for manual and automatic driving, respectively. A Welch’s t-test showed that displacement was significantly greater for manual turning (t (29) = 4.742, p < 0.01). This may be due to the fact that in manual turning, the entire body tilted significantly in the roll direction when the handle was rotated in that direction.
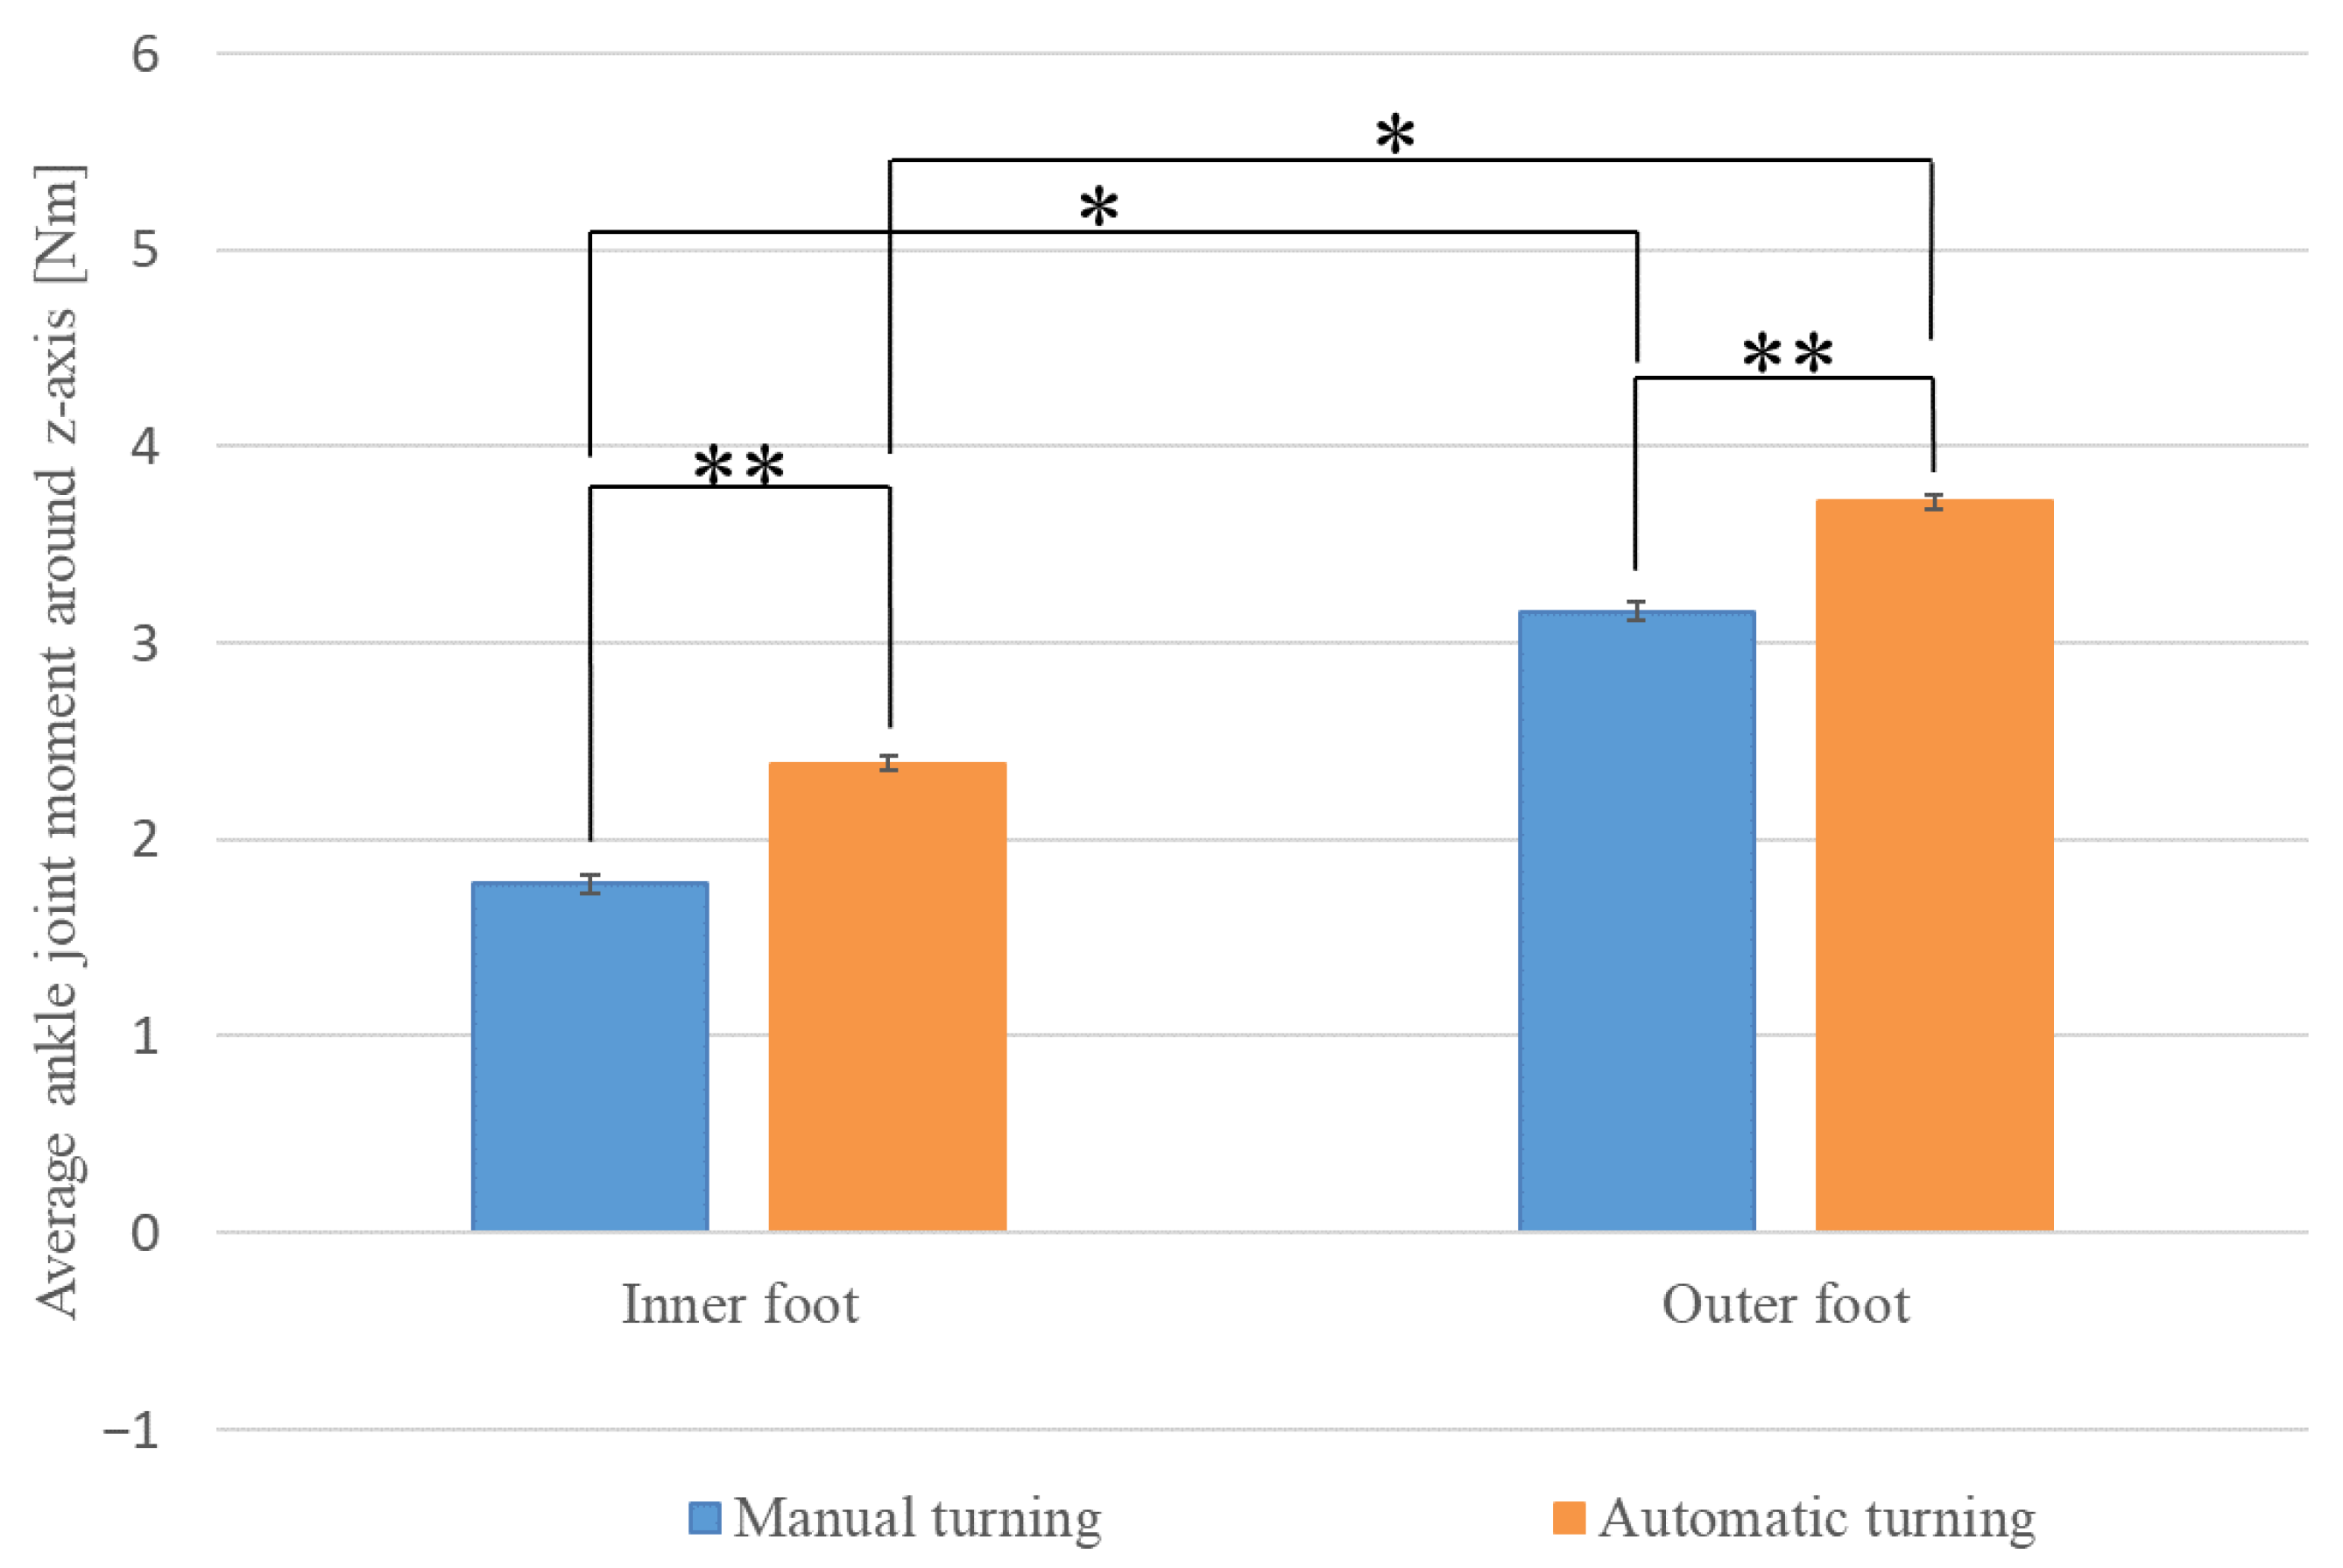
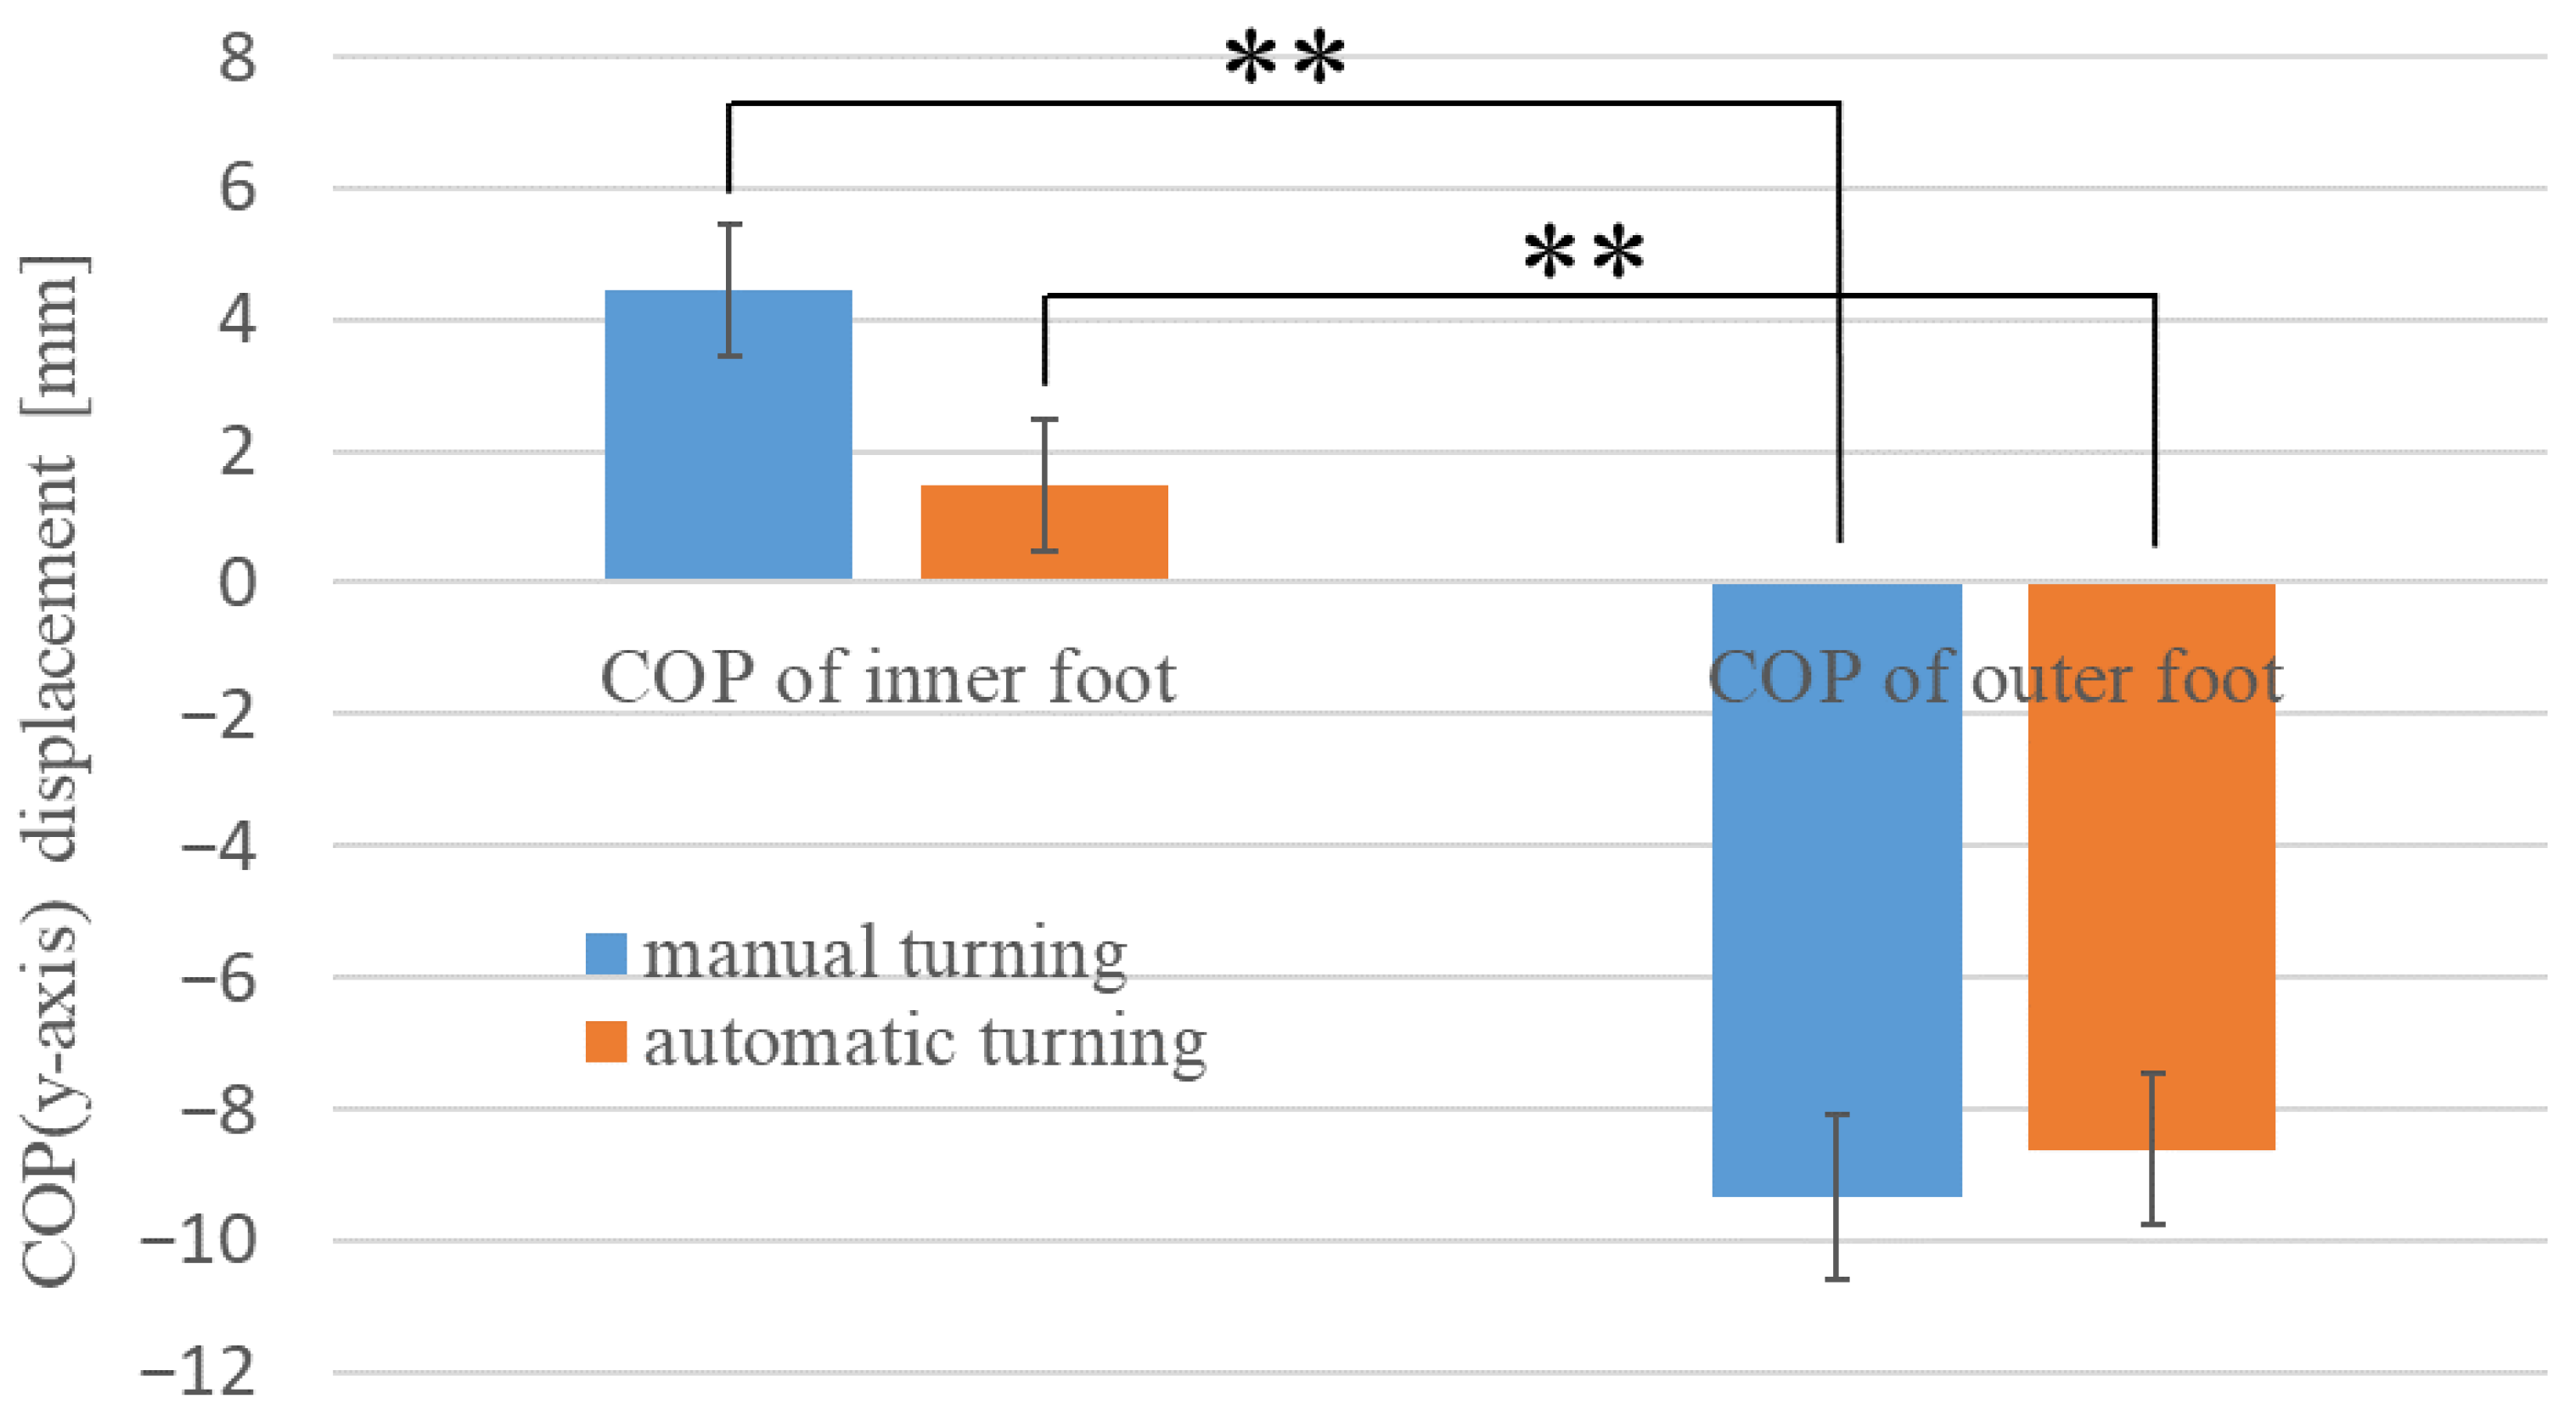
Figure 11 shows the average COP (
y-axis) values for both feet during turning, which indicate the effects of the position of the feet on the lateral postural stability of the drivers. In
Figure 11, the positive
y-axis represents the inward direction of the turn. The COP of the inner leg during manual operation was 4.459 mm (SE = 0.995) and that of the outer leg was −9.342 mm (SE = 1.270). In automatic driving, the values were 1.461 mm (SE = 1.002) for the inward turning of the leg and −8.627 mm (SE = 1.150) for the outward turning of the leg. A Welch’s
t-test showed a significant difference (**) between the COP (
y-axis) of the foot on the inside of the turn and the COP (
y-axis) of the foot on the outside of the turn, regardless of the driving style (manual driving, t (42) = 8.367,
p < 0.01) (automatic driving, t (51) = 6.490,
p < 0.01). In other words, it was found that during turning, the foot inside the turn moved more inward and the foot outside the turn moved more outward. This could be attributed to the axle foot shifting inward during turning, with the other foot being used to maintain balance.


