Abstract
Atom gravimeters use locked lasers to manipulate atoms to achieve high-precision gravity measurements. Frequency modulation spectroscopy (FMS) is an accurate method of optical heterodyne spectroscopy, capable of the sensitive and rapid frequency locking of the laser. Because of the effective absorption coefficient, Doppler broadening and susceptibility depend on temperature, and the signal-to-noise ratio (SNR) of the spectroscopy could be affected by temperature. We present a detailed study of the influence of the temperature on FMS in atom gravimeters, and the experimental results show that the SNR of the spectroscopy is dependent on temperature. In this paper, the frequency of the reference laser is locked by tracking the set point of the fringe slope of FMS. The influence of the frequency-locking noise of the reference laser on the sensitivity of the atom gravimeter is investigated by changing the temperature of the Rb cell without extra operations. The method presented here could be useful for improving the sensitivity of quantum sensors that require laser spectroscopic techniques.
1. Introduction
Since the first quantum sensor based on atom interferometry was developed in 1990s [1,2,3], atom interferometry techniques have been demonstrated to be extremely sensitive and accurate methods. These sensors enable precise measurements in lots of fields, such as the determination of fundamental constants [4,5,6,7,8,9,10,11], measurement of the rotation rate [12,13,14,15,16], gravitational accelerations [17,18,19,20], gravity-field curvature [21], and gravity-field gradient [22,23,24,25,26,27]. At present, the atom gravimeter has demonstrated better performance than its classical counterparts [28,29,30]. Laser spectroscopic techniques are vital methods of experiments used to study atom properties [31,32], including saturated absorption spectroscopy (SAS) [33,34], modulated transfer spectroscopy (MTS) [35,36], frequency modulation spectroscopy (FMS) [37,38], etc. Indeed, both FMS and MTS have the advantage of not relying on the polarization of lasers and fluctuations in laser intensity. However, the FMS laser system is simpler and has a good signal-to-noise ratio, as well as a better short-term stability performance [39], which is conducive to improving the short-term sensitivity of the atomic gravimeter and to the integration of the miniaturized atom-gravimeter laser system. Among all these methods, FMS is a typical method of optical heterodyne spectroscopy capable of sensitive and rapid measurements of the absorption and dispersion associated with weak, narrow spectral features.
FMS is based on converting the imposed frequency modulation into an amplitude modulation as an atom transition is encountered [40]. FMS can be classified into regimes depending on the modulation depth M or frequency ω. When the modulation depth () is small and the modulation frequency (, where the Г is the natural line width) is large, it is called frequency modulation (FM). On the contrary, when the modulation depth is large ( and ) and the modulation frequency () is smaller, it is named wavelength modulation (WM) spectroscopy [41]. Based on the method of frequency modulation, FMS can effectively circumvent the problem of laser intensity noise and offer a method for phase-sensitive detection with high sensitivity at the per billion level [42]. Therefore, FMS can be used as an ultra-high precision-frequency reference in the atom sensors. In addition, the transition probability population of the atom gravimeter, which is measured by collecting fluorescence signals of atoms in each of the two hyperfine states. As such, the frequency noises directly affect the signal-to-noise ratio of fluorescence signals and ultimately jeopardize measurement accuracy [19].
In this paper, a unique experimental method has been applied to characterize the influence of temperature on the signals of FMS and thus on the performance of an atom gravimeter by observing frequency noise and sensitivity. We firstly describe the experimental setup, and then analyze the influence of temperature on FMS. In particular, we investigate the relationship between the temperature and the detection noise of the atom gravimeter; thereby, the explanation of its contribution to the sensitivity of the atom gravimeter is discussed. Finally, the results show that the short-term sensitivity of the atom gravimeter increased from to via an optimization of the temperature for FMS. This research yields an efficient method for the improvement of the sensitivity of atomic sensors.
2. Experimental Setup
The laser system of our atom gravimeter has been described in detail elsewhere [43,44]. As shown in Figure 1, the laser system consists of two external-cavity diode lasers (ECDLs) at 780 nm, and the ECDL1 is called the reference laser. The frequency of the reference laser is locked to the F = 1 → F′ = 1 transition of the D2 line of 87Rb via FMS. The theory of FMS has been described in detail in [38,40]. It utilizes an external phase modulator to produce the WM and is capable of detecting weak absorption or dispersion features with the full spectral resolution characteristic of lasers. The modulator converts the single-axial-mode laser input into pure FMS with a low modulation index. In addition, both the absorption and the dispersion associated with the spectral feature can be separately measured by monitoring the phase and amplitude of the RF heterodyne beat signal that occurs when FMS is distorted by the effects of the spectral feature on the probing sideband. Figure 1 describes a schematic of the typical experimental arrangement for FMS, where the driving frequency ω of the electro-optic modulator (EOM) is 12.5 MHz. The digital locking module refers to the FPGA-based laser frequency locking with an auto-locking module, and it can auto-lock the frequency of the ECDL1 by tracking the set point of the fringe slope of FMS. Additionally, a heating wire is implemented around the cell to control the temperature of the Rb cell. The frequency of the ECDL2 is controlled by beating with the reference laser. Raman light is generated by the AOM frequency shift after the ECDL1 and EDCL2 are combined. In the cooling beam and the detection beam, the laser of ECDL1 is used as the repumping laser, and the light of the ECDL2 can quickly switch between cooling and detection via frequency control.
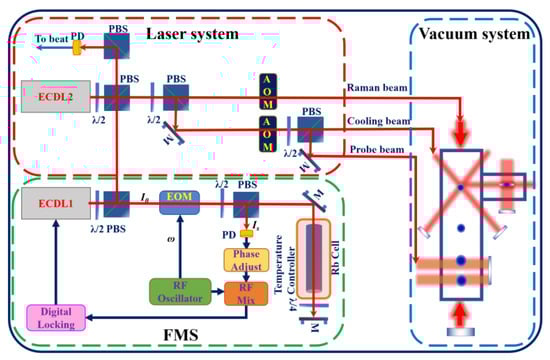
Figure 1.
Scheme of frequency modulation spectroscopy (FMS). ECDL is the external-cavity diode laser, EOM is the electro-optic modulator, PBS is the polarizing beam splitter, PD is the photo diode, λ/4 is the quarter-wave plate, M is the mirror.
In the experiment performed here, the laser beams are transmitted to the vacuum system via a polarization-maintaining fiber. The cooling beam is combined with a gradient magnetic field to form a magneto-optical trap for trapping and cooling 108 atoms in 280 ms, before cooling them down to 5 μk in 20 ms. Then, the atoms are selected in F = 1 using a microwave pulse. During their free fall, atom interferometry is performed using a sequence of three counter-propagative Raman laser pulses (π/2-π-π/2), separated by free evolution times T = 55 ms. Finally, the whole sequence ends at the bottom of the experiment with the successive time-of-flight (TOF) fluorescence detection of the populations of the two interferometer output ports, thanks to the state-labeling method.
3. Theory
The demodulated dispersive signals of FMS are shown in Figure 2. The blue curve in Figure 2a illustrates a partially demodulated dispersive signal of FMS obtained by a digital laser lock module where the dispersive signals are the 87Rb D2 line F = 1 → F′ = 0, F′ = 1, F′ = 2 formants. The frequency of the ECDL1 is locked in F = 1 → F′ = 1 by tracking the set point of the fringe slope. The red line in Figure 2b is a linear fitted curve to the side of the F = 1 → F′ = 1 fringe, and the slope γ (, where is the peak-to-peak value of the amplitude ρ, ω is the modulation frequency) is maintained via the digital locking module.
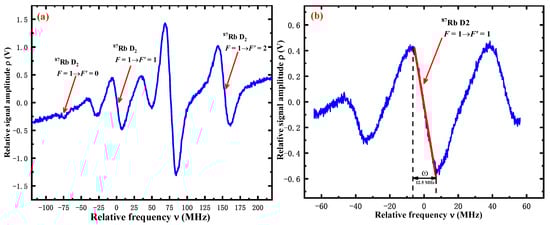
Figure 2.
The results of the demodulated dispersive signal of FMS. (a): The measurement of the dispersive curve of the 87Rb D2 line F = 1 → F′ = 0, F′ = 1, F′ = 2. (b): The measurement of the dispersive curve of the 87Rb D2 line F = 1 → F′ = 1, and the red line with the slope γ = −0.07959 V/MHz is the linear fitting of the side of the F = 1 → F′ = 1, and the modulation frequency ω = 12.5 MHz.
The frequency-locking noise is defined by . Therefore, the frequency-locking noise depends on the slope γ, and the higher the value of , the lower the frequency-locking noise .
In the following, we analyze the relationship between the temperature T and slope γ of the demodulated dispersive signal of FMS. Based on the theory of FMS [40], the modulated laser ECDL1 with intensity I0 travels through the Rb cell with the absorption coefficient α and length l = 150 mm. Then, the intensity of the incident modulated laser I0 is reduced to Is as:
where Is is the detection light intensity of FMS, δ is the amplitude attenuation , Δδ is the difference in first-order sideband signal absorption , and M is the modulation depth.
The absorption coefficient α, as a function of the laser angular frequency ω near an atom transition with resonant angular frequency ωP, is given approximately as the simple sum of the Doppler broadenings αD due to the random thermal motion of the atoms and the Lorentzian functions in the Doppler limit [45]:
where k is the wave number of the laser, ꭓ is the susceptibility, and is the hyperfine transition probability. The most probable velocity of u is given by , where T is the temperature of the Rb cell, kB is Boltzmann’s constant, and m is the atom’s mass.
Here, let us consider the effect of the temperature on the absorption coefficient α. The absorption coefficient α needs to be modified, and the modified absorption coefficient can be represented by αcorr:
where the number density of the Rb cell of n(T) is given by , PV is the pressure of saturated vapor, S is the hole-burning area, and σ(ω) is the cross-section. Because of the effective atomic number density, the Doppler background absorption coefficient and the electrodeposition rate are affected by the temperature. As shown in Figure 3, the relationship between temperature T and spectral absorption intensity β can be given by Equation (4). For temperatures below 59 °C, with an increase in the temperature of the Rb cell, the relative intensity β trends with two decaying exponents with a maximum at T = 44 °C. The optimum temperature T = 44 °C is determined by the Rb cell length l.
where β is the relative intensity of the absorption without the Doppler background, αDcorr is the correctional Doppler broadenings, and .
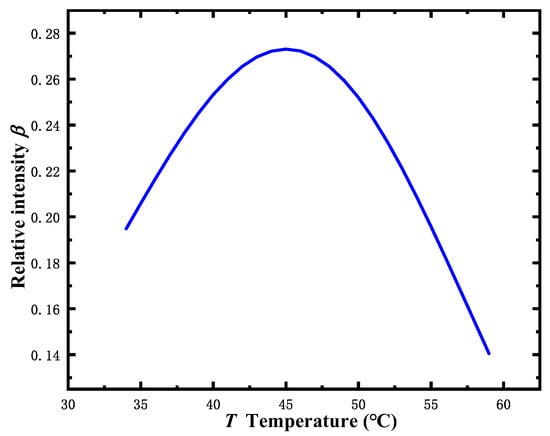
Figure 3.
The theoretical calculation of the relationship between β and T.
The relationship between the of demodulated dispersive signal and the relative intensity of absorption β can be expressed as .
4. Experimental Results
According to the analysis above, we can intentionally modify the temperature of the Rb cell to change the slope γ of FMS to investigate the effect of the frequency-locking noise on the sensitivity of the atom gravimeter. The FMS signals obtained by changing the temperature of the Rb cell are illustrated in Figure 4a. The amplitude of the FMS signal is affected by various factors with respect to the applied temperatures. For simplicity, we shall only discuss the transition of the 87Rb D2 line F = 1 → F′ = 1. As shown in the partial enlargement in Figure 4a, we can observe the relationship between the temperature T ∈ (34~59 °C) and the amplitude ρ. For temperatures T below 44 °C, the amplitude ρ increases with the T, and the amplitude ρ decreases with T as the result of the influence of the effective atom number density, Doppler broadening, and susceptibility. The results of this experiment validate the previous theoretical analysis . Therefore, by heating the Rb cell, the amplitude ρ of FMS (the 87Rb D2 line F = 1 → F′ = 1) can be adjusted efficiently without introducing additional noise.
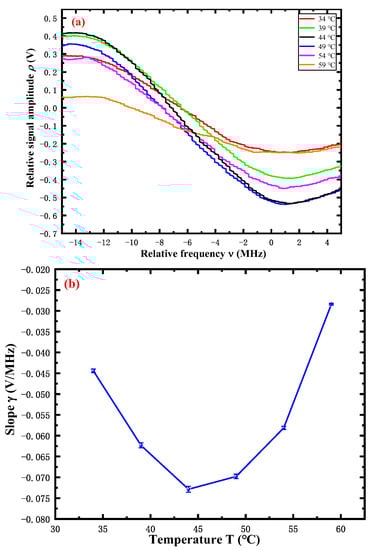
Figure 4.
The results of the demodulated dispersive signal and its slope versus temperature of the Rb cell. (a): The measurements of the demodulated dispersive signal with varying temperatures T ∈ [34 °C, 59 °C]. (b): The blue points represent the slope of the demodulated dispersive signal fringe of the 87Rb D2 F = 1 → F′ = 1.
Figure 4b clearly displays the slope γ of the demodulated dispersive signal with varying temperatures, and we find good agreement of the slope γ with the relative intensity of absorption β, and the slope γ reaches a peak γ = −0.073 V/MHz at T = 44 °C. Therefore, we determine that the optimum slope is γ = −0.073 V/MHz due to the definition of frequency-locking noise . In addition, the slope γ of FMS could also be modified by adjusting the normalized frequency R [40]. R is defined by , where the line center frequency and is the full width at half maximum. However, this method may introduce other systematic noises, such as electronic noises from the frequency modulator.
The principle of the atom gravimeter is based on the coherent manipulation of atom wave packets by the two-photon-stimulated Raman transitions. The transition probability P is given by: , where ϕ is the phase shift accumulated by the atom matter waves along two interferometer arms. For an ideal atom gravimeter, , where α0 is the frequency chirp of the Raman lasers applied to compensate the gravity-induced Doppler shift, is the local gravitation acceleration and T is the time separation between pulses. In addition, in the presence of a uniform gravity field, the phase shift is denoted by . However, the transition probability P is deduced from the population in F = 1 and F = 2, and the detection laser is used to obtain the population of 87Rb in each of the two hyperfine states by measuring the resonant fluorescence signal. As such, the transition probability P depends on the frequency-locking noise of the reference laser.
Therefore, we assess the detection noise independently of any interferometer by preparing a superposition using a π/2 microwave pulse. Then, the atoms are distributed on the ground state F = 1 and F = 2, as shown in Figure 5.
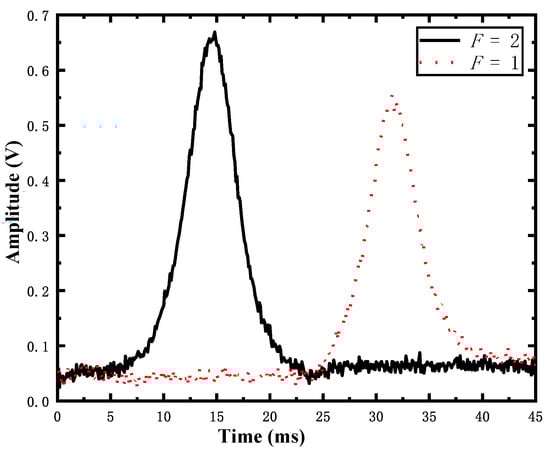
Figure 5.
Typical plot of detection signals after π/2 microwave pulse; the two curves are for the F = 1 and F = 2 channels, respectively.
The result of this measurement is shown Figure 6a, and the detection noise can be defined as ( is the standard deviation of transition probability and C = 0.3 is the contrast of the atom interferometer). In order to highlight the effect of the frequency-locking noise δν on the sensitivity of the atom gravimeter, we deliberately selected a set of slopes γ with a large difference of γ = −0.073 V/MHz, −0.044 V/MHz, −0.028 V/MHz for the experiments. Figure 6b shows the short-term sensitivity of (0.073 V/MHz), (−0.044 V/MHz), and (−0.028 V/MHz), respectively. In addition, the stability of the gravity measurement improves as τ−1/2 reaches , , and after 1000 s. The results have demonstrated the effect of the frequency-locking noise on the long-term or short-term sensitivity of the atom gravimeter. The lower the frequency-locking noise δν, the better the sensitivity of the atom gravimeter Δg.
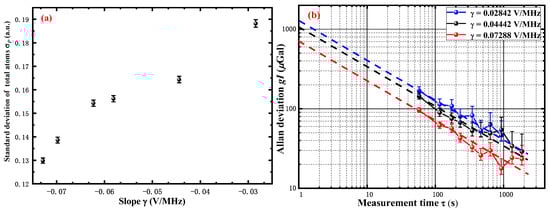
Figure 6.
The Allan deviation of the gravimeter measurements and the fluctuation of the transition probability σP. (a) The standard deviation of detection σP with the slope γ. (b) The Allan deviation of the gravimeter measurement with the various slope γ. The dashed lines illustrate the τ−1/2 scaling, which corresponds to the white noise.
In summary, we have introduced a frequency-locking scheme based on FMS technology, and then analyzed the effect of Rb cell temperature on the frequency-locking noise. By analyzing the fluctuation of the transition probability σP, the relationship between the frequency-locking slope γ and the σP is obtained, and the relationship between the sensitivity of the atom gravimeter and the frequency-locking noise is carried out. The results show that the short-term sensitivity of the atom gravimeter increased from to by optimizing the slope γ.
5. Discussion
We have investigated the effect of frequency-locking noise on the sensitivity of the atom gravimeter by modifying the slope γ of FMS. Furthermore, the slope γ of FMS was only modified by setting different temperatures in the Rb cell, which can effectively avoid other uncertain noises. Through monitoring the fluctuation of the transition probability σP, we found that the frequency-locking noise directly affects the detection noise, and that setting the appropriate Rb temperature (T = 44 °C) can effectively suppress this noise. As the experimental results show, the short-term sensitivity of the atom gravimeter increased from to , while the long-term sensitivity of the atom gravimeter increased from to after the integration of 1000 s. After optimizing the laser frequency noise, the atom gravimeter sensitivity was mainly limited by vibration noise and laser phase noise.
Author Contributions
Conceptualization, Q.L. and B.W.; methodology, K.W.; software, B.C.; validation, F.W., X.Z. and Y.Z.; formal analysis, Y.Z.; investigation, F.W.; data curation, X.Z.; writing—original draft preparation, K.W.; writing—review and editing, K.W. and B.W.; supervision, Q.L.; funding acquisition, Q.L. All authors have read and agreed to the published version of the manuscript.
Funding
This research was funded by the National Natural Science Foundation of China (Grant Nos. 61727821, 61875175, 11404286, 51905482); National Key Research and Development Program of China (Grant Nos. 2017YFC0601602, 2016YFF0200206); Research funds from the Ministry of natural resources of China (DD20189831).
Institutional Review Board Statement
Not applicable.
Informed Consent Statement
Not applicable.
Data Availability Statement
Not applicable.
Conflicts of Interest
The authors declare no conflict of interest.
References
- Keith, D.W.; Schattenburg, M.L.; Smith, H.I.; Pritchard, D.E. Diffraction of Atoms by a Transmission Grating. Phys. Rev. Lett. 1988, 61, 1580–1583. [Google Scholar] [CrossRef] [PubMed]
- Clauser, J.F. Ultra-high sensitivity accelerometers and gyroscopes using neutral atom matter-wave interferometry. Phys. B+C 1988, 151, 262–272. [Google Scholar] [CrossRef]
- Kasevich, M.; Chu, S. Atomic interferometry using stimulated Raman transitions. Phys. Rev. Lett. 1991, 67, 181–184. [Google Scholar] [CrossRef] [PubMed]
- Parker, R.H.; Yu, C.; Zhong, W.; Estey, B.; Müller, H. Measurement of the fine-structure constant as a test of the Standard Model. Science 2018, 360, 191–195. [Google Scholar] [CrossRef]
- Bouchendira, R.; Cladé, P.; Guellati-Khélifa, S.; Nez, F.; Biraben, F. New Determination of the Fine Structure Constant and Test of the Quantum Electrodynamics. Phys. Rev. Lett. 2011, 106, 080801. [Google Scholar] [CrossRef]
- Fixler, J.B.; Foster, G.T.; McGuirk, J.M.; Kasevich, M.A. Atom Interferometer Measurement of the Newtonian Constant of Gravity. Science 2007, 315, 74–77. [Google Scholar] [CrossRef]
- Rosi, G.; Sorrentino, F.; Cacciapuoti, L.; Prevedelli, M.; Tino, G.M. Precision measurement of the Newtonian gravitational constant using cold atoms. Nature 2014, 510, 518–521. [Google Scholar] [CrossRef]
- Wu, B.; Zhao, Y.; Cheng, B.; Zhang, C.; Li, D.; Zhu, D.; Yue, Y.; Li, J.; Zhang, K.; Lin, Q.; et al. A Simplified Laser System for Atom Interferometry Based on a Free-Space EOM. Photonics 2022, 9, 301. [Google Scholar] [CrossRef]
- Rozenman, G.G.; Zimmermann, M.; Efremov, M.A.; Schleich, W.P.; Shemer, L.; Arie, A. Amplitude and Phase of Wave Packets in a Linear Potential. Phys. Rev. Lett. 2019, 122, 124302. [Google Scholar] [CrossRef]
- Gonçalves, M.R.; Rozenman, G.G.; Zimmermann, M.; Efremov, M.A.; Case, W.B.; Arie, A.; Shemer, L.; Schleich, W.P. Bright and dark diffractive focusing. Appl. Phys. A 2022, 128, 1–23. [Google Scholar] [CrossRef]
- Asenbaum, P.; Overstreet, C.; Kim, M.; Curti, J.; Kasevich, M.A. Atom-interferometric test of the equivalence principle at the 10–12 level. Phys. Rev. Lett. 2020, 125, 191101. [Google Scholar] [CrossRef] [PubMed]
- Gustavson, T.L.; Bouyer, P.; Kasevich, M.A. Precision Rotation Measurements with an Atom Interferometer Gyroscope. Phys. Rev. Lett. 1997, 78, 2046–2049. [Google Scholar] [CrossRef]
- Savoie, D.; Altorio, M.; Fang, B.; Sidorenkov, L.A.; Geiger, R.; Landragin, A. Interleaved atom interferometry for high-sensitivity inertial measurements. Sci. Adv. 2018, 4, eaau7948. [Google Scholar] [CrossRef] [PubMed]
- Tackmann, G.; Berg, P.; Schubert, C.; Abend, S.; Gilowski, M.; Ertmer, W.; Rasel, E.M. Self-alignment of a compact large-area atomic Sagnac interferometer. New J. Phys. 2012, 14, 015002. [Google Scholar] [CrossRef]
- Fang, J.; Qin, J. Advances in Atomic Gyroscopes: A View from Inertial Navigation Applications. Sensors 2012, 12, 6331–6346. [Google Scholar] [CrossRef] [PubMed]
- Zhang, L.; Gao, W.; Li, Q.; Li, R.; Yao, Z.; Lu, S. A Novel Monitoring Navigation Method for Cold Atom Interference Gyroscope. Sensors 2019, 19, 222. [Google Scholar] [CrossRef]
- Kasevich, M.; Chu, S. Measurement of the gravitational acceleration of an atom with a light-pulse atom interferometer. Appl. Phys. A 1992, 54, 321–332. [Google Scholar] [CrossRef]
- Peters, A.; Chung, K.Y.; Chu, S. High-precision gravity measurements using atom interferometry. Metrologia 2001, 38, 25–61. [Google Scholar] [CrossRef]
- Le Gouët, J.; Mehlstäubler, T.; Kim, J.; Merlet, S.; Clairon, A.; Landragin, A.; Dos Santos, F.P. Limits to the sensitivity of a low noise compact atomic gravimeter. Appl. Phys. B Laser Opt. 2008, 92, 133–144. [Google Scholar] [CrossRef]
- Xu, V.; Jaffe, M.; Panda, C.D.; Kristensen, S.L.; Clark, L.W.; Müller, H. Probing gravity by holding atoms for 20 s. Science 2019, 366, 745–749. [Google Scholar] [CrossRef]
- Margalit, Y.; Dobkowski, O.; Zhou, Z.; Amit, O.; Japha, Y.; Moukouri, S.; Rohrlich, D.; Mazumdar, A.; Bose, S.; Henkel, C.; et al. Realization of a complete Stern-Gerlach interferometer: Toward a test of quantum gravity. Sci. Adv. 2021, 7, eabg2879. [Google Scholar] [CrossRef] [PubMed]
- Snadden, M.J.; McGuirk, J.M.; Bouyer, P.; Haritos, K.G.; Kasevich, M.A. Measurement of the Earth’s gravity gradient with an atom interferometer-based gravity gradiometer. Phys. Rev. Lett. 1998, 81, 971–974. [Google Scholar] [CrossRef]
- Sorrentino, F.; Bodart, Q.; Cacciapuoti, L.; Lien, Y.-H.; Prevedelli, M.; Rosi, G.; Salvi, L.; Tino, G.M. Sensitivity limits of a Raman atom interferometer as a gravity gradiometer. Phys. Rev. A 2014, 89, 023607. [Google Scholar] [CrossRef]
- Sorrentino, F.; Lien, Y.-H.; Rosi, G.; Cacciapuoti, L.; Prevedelli, M.; Tino, G.M. Sensitive gravity-gradiometry with atom interferometry: Progress towards an improved determination of the gravitational constant. New J. Phys. 2010, 12, 095009. [Google Scholar] [CrossRef]
- Duan, X.-C.; Zhou, M.-K.; Mao, D.-K.; Yao, H.-B.; Deng, X.-B.; Luo, J.; Hu, Z.-K. Operating an atom-interferometry-based gravity gradiometer by the dual-fringe-locking method. Phys. Rev. A 2014, 90, 023617. [Google Scholar] [CrossRef]
- Caldani, R.; Weng, K.X.; Merlet, S.; Dos Santos, F.P. Simultaneous accurate determination of both gravity and its vertical gradient. Phys. Rev. A 2019, 99, 033601. [Google Scholar] [CrossRef]
- Perrin, I.; Bidel, Y.; Zahzam, N.; Blanchard, C.; Bresson, A.; Cadoret, M. Proof-of-principle demonstration of vertical-gravity-gradient measurement using a single-proof-mass double-loop atom interferometer. Phys. Rev. A 2019, 99, 013601. [Google Scholar] [CrossRef]
- Hu, Z.-K.; Sun, B.-L.; Duan, X.-C.; Zhou, M.-K.; Chen, L.-L.; Zhan, S.; Zhang, Q.-Z.; Luo, J. Demonstration of an ultrahigh-sensitivity atom-interferometry absolute gravimeter. Phys. Rev. A 2013, 88, 043610. [Google Scholar] [CrossRef]
- Narducci, F.A.; Black, A.T.; Burke, J.H. Advances toward fieldable atom interferometers. Adv. Phys. X 2022, 7, 043610. [Google Scholar] [CrossRef]
- Amit, O.; Margalit, Y.; Dobkowski, O.; Zhou, Z.; Japha, Y.; Zimmermann, M.; Efremov, M.A.; Narducci, F.A.; Rasel, E.M.; Schleich, W.P. T 3 Stern-Gerlach matter-wave interferometer. Phys. Rev. Lett. 2019, 123, 083601. [Google Scholar] [CrossRef]
- Wu, B.; Zhou, Y.; Weng, K.; Zhu, D.; Fu, Z.; Cheng, B.; Wang, X.; Lin, Q. Modulation transfer spectroscopy for D1 transition line of rubidium. J. Opt. Soc. Am. B 2018, 35, 2705–2710. [Google Scholar] [CrossRef]
- Le Gouët, J.; Kim, J.; Bourassin-Bouchet, C.; Lours, M.; Landragin, A.; Dos Santos, F.P. Wide bandwidth phase-locked diode laser with an intra-cavity electro-optic modulator. Opt. Commun. 2009, 282, 977–980. [Google Scholar] [CrossRef]
- Schmidt, O.; Knaak, K.-M.; Wynands, R.; Meschede, D. Cesium saturation spectroscopy revisited: How to reverse peaks and observe narrow resonances. Appl. Phys. A 1994, 59, 167–178. [Google Scholar] [CrossRef]
- Wang, Q.; Qi, X.; Liu, S.; Yu, J.; Chen, X. Laser frequency stabilization using a dispersive line shape induced by Doppler Effect. Opt. Express 2015, 23, 2982–2990. [Google Scholar] [CrossRef] [PubMed]
- Shirley, J.H. Modulation transfer processes in optical heterodyne saturation spectroscopy. Opt. Lett. 1982, 7, 537–539. [Google Scholar] [CrossRef]
- Hong, Y.; Hou, X.; Chen, D.; Zhou, C.; Huang, M.; Song, T.; Wang, G.; Zhao, J.; Chen, W. Research on Frequency Stabilization Technology of Modulation Transfer Spectroscopy Based on Rb~(87). Chin. J. Lasers 2021, 48, 27–34. [Google Scholar]
- Bjorklund, G.C. Frequency-modulation spectroscopy: A new method for measuring weak absorptions and dispersions. Opt. Lett. 1980, 5, 15–17. [Google Scholar] [CrossRef]
- Mandon, J.; Guelachvili, G.; Picqué, N. Frequency-modulation Fourier transform spectroscopy: A broadband method for measuring weak absorptions and dispersions. Opt. Lett. 2007, 32, 2206–2208. [Google Scholar] [CrossRef]
- Zi, F.; Wu, X.; Zhong, W.; Parker, R.H.; Yu, C.; Budker, S.; Lu, X.; Müller, H. Laser frequency stabilization by combining modulation transfer and frequency modulation spectroscopy. Appl. Opt. 2017, 56, 2649–2652. [Google Scholar] [CrossRef]
- Bjorklund, G.C.; Levenson, M.D.; Lenth, W.; Ortiz, C. Frequency modulation (FM) spectroscopy. Theory of lineshapes and signal-to-noise analysis. Appl. Phys. B (Photophys. Laser Chem.) 1983, B32, 145–152. [Google Scholar] [CrossRef]
- Supplee, J.M.; Whittaker, E.A.; Lenth, W. Theoretical description of frequency modulation and wavelength modulation spectroscopy. Appl. Opt. 1994, 33, 6294–6302. [Google Scholar] [CrossRef] [PubMed]
- Petrov, K.P.; Waltman, S.; Dlugokencky, E.J.; Arbore, M.; Fejer, M.M.; Tittel, F.K.; Hollberg, L.W. Precise measurement of methane in air using diode-pumped 3.4-μm difference-frequency generation in PPLN. Appl. Phys. B-Lasers Opt. 1997, 64, 567–572. [Google Scholar] [CrossRef]
- Merlet, S.; Volodimer, L.; Lours, M.; Dos Santos, F.P. A simple laser system for atom interferometry. Appl. Phys. A 2014, 117, 749–754. [Google Scholar] [CrossRef]
- Fu, Z.F.Z.; Wang, Q.W.Q.; Wang, Z.W.Z.; Bin Wu, B.W.; Cheng, B.C.B.; Lin, Q.L.Q. Participation in the absolute gravity comparison with a compact cold atom gravimeter. Chin. Opt. Lett. 2019, 17, 011204. [Google Scholar] [CrossRef]
- Nakayama, S. Theoretical Analysis of Rb and Cs D2 Lines in Saturation Spectroscopy with Optical Pumping. Jpn. J. Appl. Phys. 1984, 23, 879–883. [Google Scholar] [CrossRef]


Publisher’s Note: MDPI stays neutral with regard to jurisdictional claims in published maps and institutional affiliations. |
© 2022 by the authors. Licensee MDPI, Basel, Switzerland. This article is an open access article distributed under the terms and conditions of the Creative Commons Attribution (CC BY) license (https://creativecommons.org/licenses/by/4.0/).