1. Introduction
Establishing smart hospitals using suitable technologies is a necessity of time, and it requires an appropriate replacement of the physical interaction between patients and doctors by a reliable virtual one [
1]. In a smart healthcare environment, the utility of a patient quantifies how fast and how reliably his/her real-time physical condition is reported to a central healthcare information management system. Moreover, different health parameters are typically interdependent, and they have different importance levels. Thus, the problem of user utility maximization is translated as a multi-objective data delivery performance enhancement problem. Furthermore, it requires the prioritization of critical data over normal or regular event reporting. For example, when a patient’s extreme high/low blood pressure (BP) is considered as the most important health parameter, the corresponding blood sugar level and respiratory rate become relatively important and a few others as regular health parameters.
Healthcare is boosted as an application domain that appears to be very promising for enhancing service quality of the patients due to the Internet of Things (IoT), cloud computing, and Wireless Body Area Network (WBAN) technologies, as well as the interactions among those [
2]. Some wireless technologies (e.g., ZigBee, Bluetooth, LoRa, Sigfox) are used in healthcare applications; however, some recent studies [
3,
4] have already revealed that the Narrow Band IoT (NB-IoT) is more suitable for healthcare applications in terms of licensing policy, long-range data transmission performance, energy-efficiency, etc., than other technologies. The fact that the NB-IoT is a Low Power Wide Area Network (LPWAN) technology facilitating a long-range and deep indoor coverage makes it perfect for a typical smart hospital context [
5,
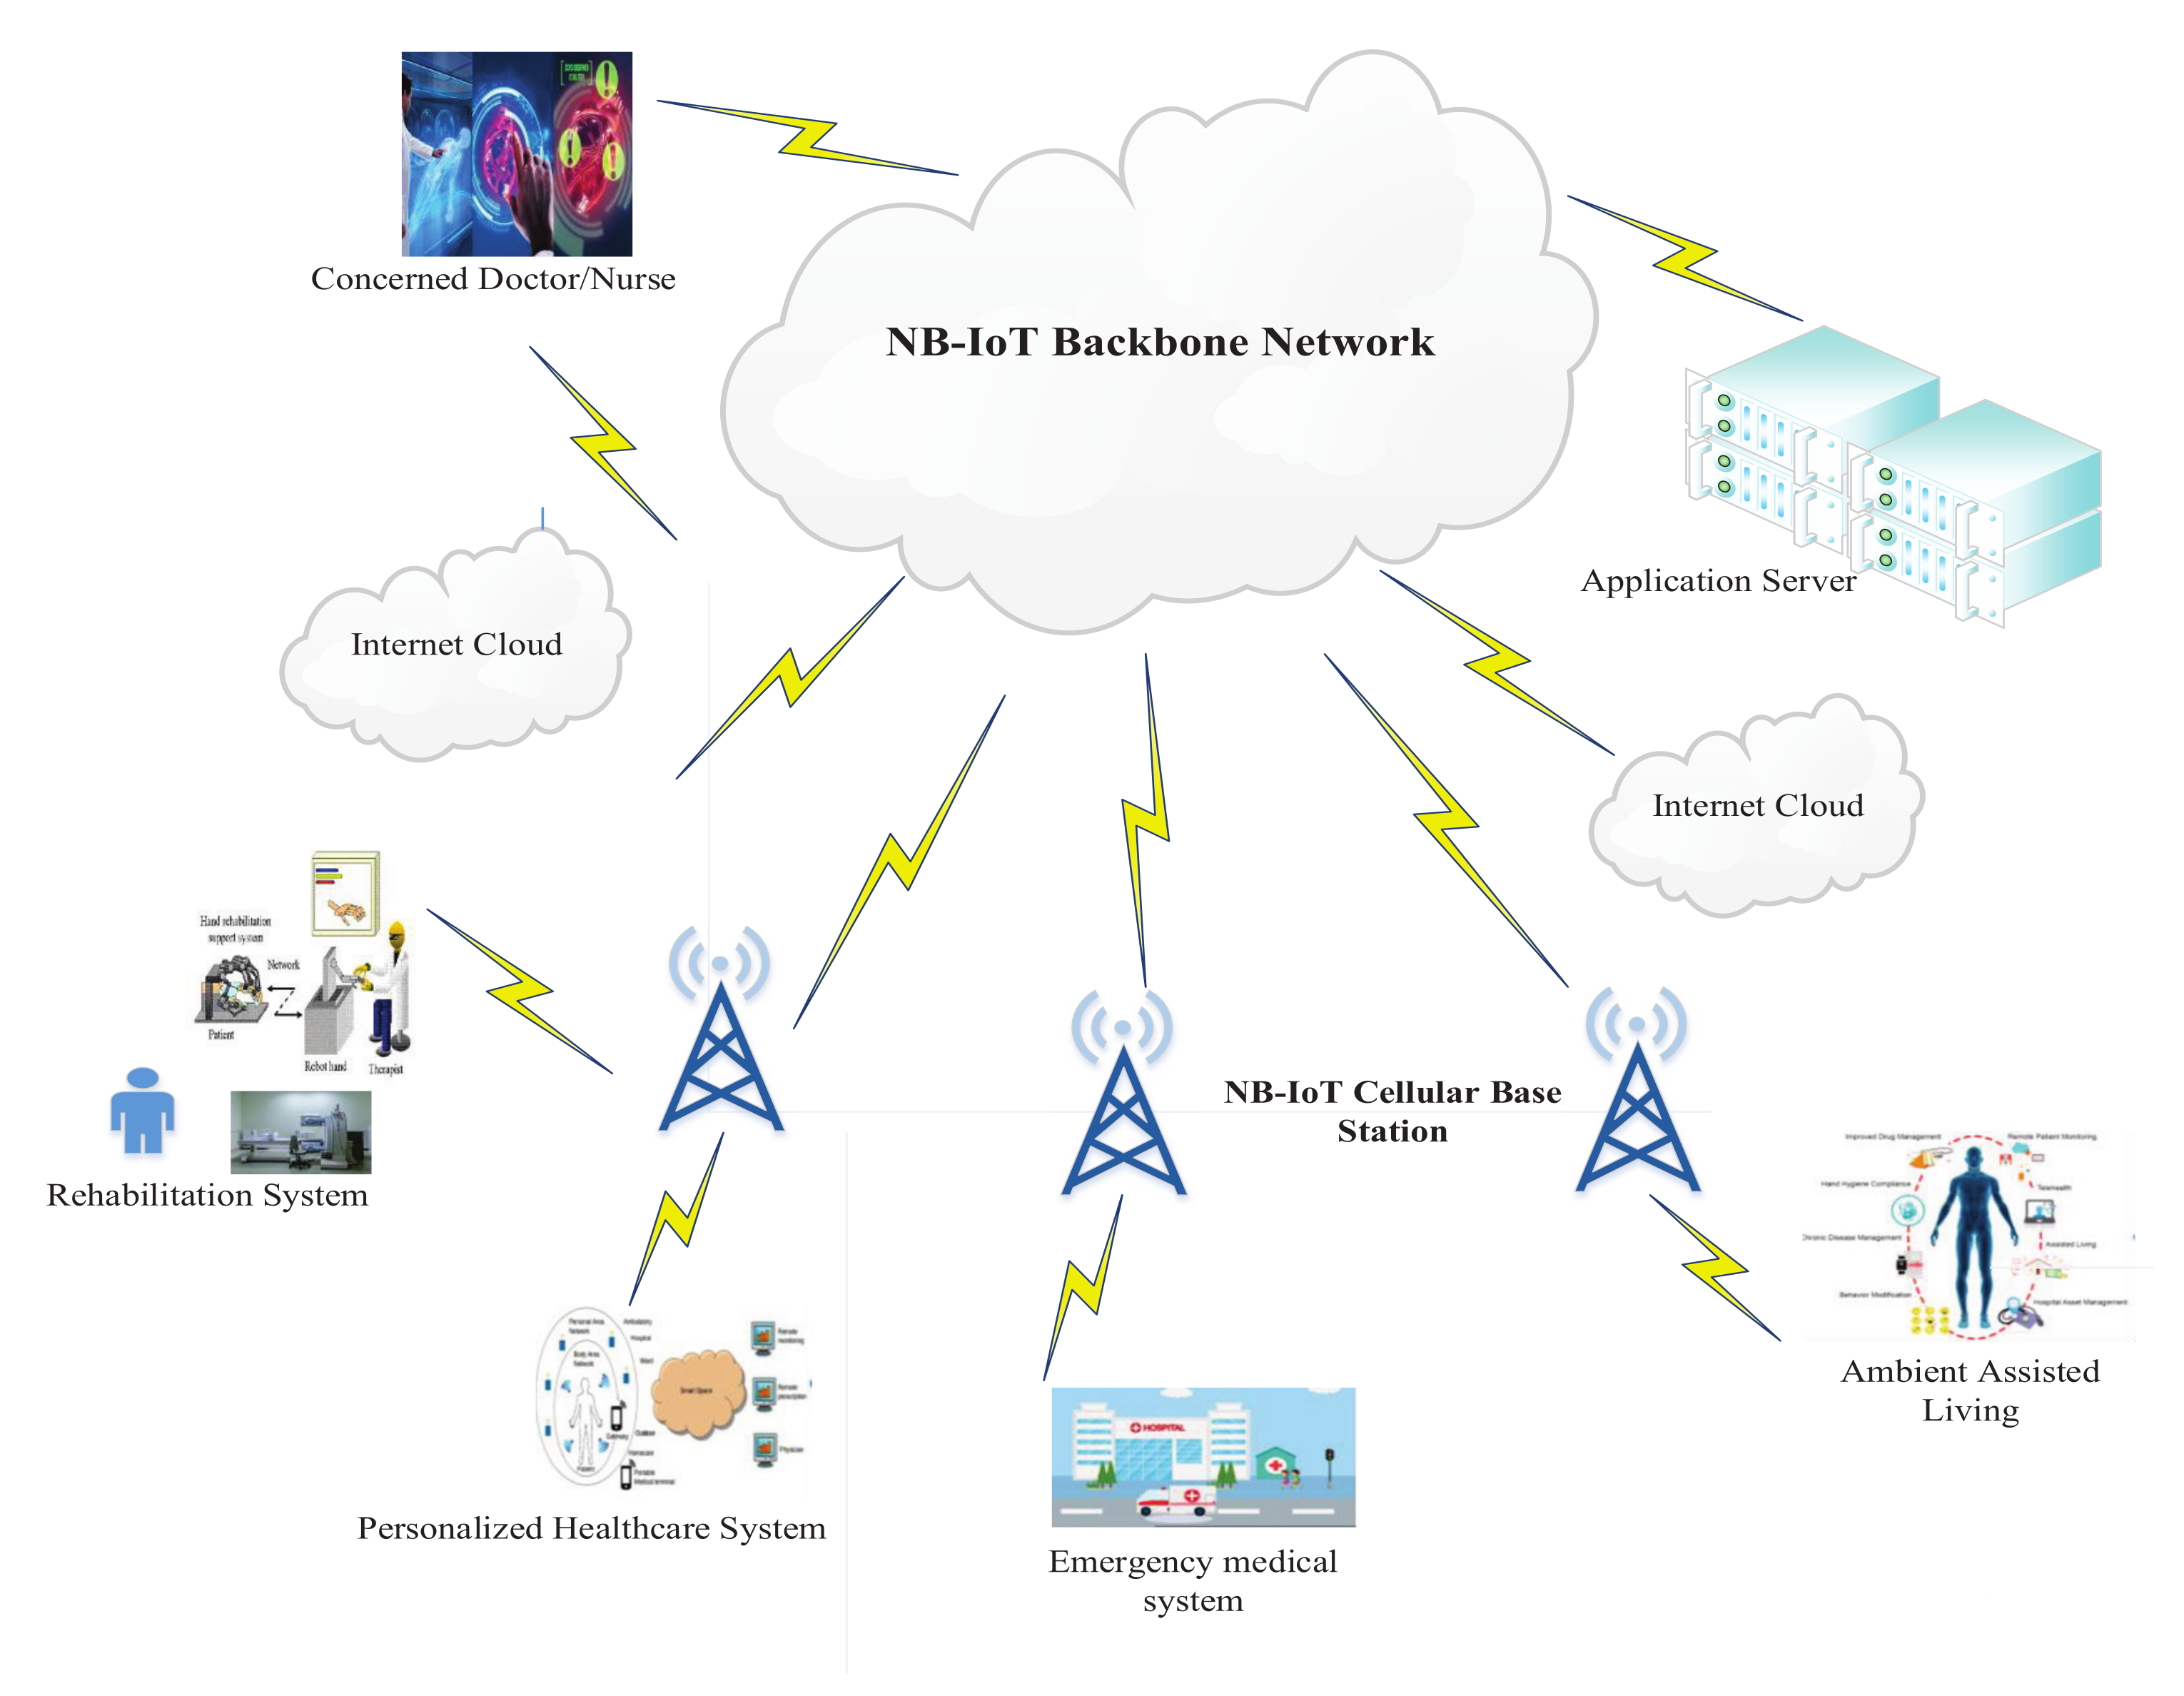
6]. Furthermore, it offers seamless connectivity between patients and concerned medical personnel.
The Narrow Band Internet of Things ( NB-IoT) is a radio access technology developed by the third-generation partnership project (3GPP) that turns out to be categorically prevalent for real-time sensing and monitoring applications [
5], including smart metering, connected personal appliances, smart hospitals, etc. [
6,
7]. Licensed frequencies of today’s cellular network can provide NB-IoT devices more accurate traffic management, high-quality service (QoS) assurance over broad areas, and higher reliability [
1]. Interference mitigation in NB-IoT becomes another challenge as several transmissions frequently occur at the same time [
5] in a typical healthcare application; otherwise, it might hamper reliable and guaranteed data delivery. Solving such a multi-objective data delivery performance enhancement problem that requires data prioritization becomes more critical in a resource-constrained environment.
In [
8], the authors developed an optimization algorithm, named bRRM, which analyzes inter-carrier interference for radio resource management for OFDM (Orthogonal Frequency Division Multiplexing). Their proposed resource allocation strategy boosts up throughput; however, event relationship, queue management, etc., parameters were not incorporated. In [
9], the authors conducted an experiment, collecting the continuous data of a patient from a weight scale based on NB-IoT technology, which can be sent to a specific server at any time. The system was developed to reduce unnecessary data storage operations by transferring healthcare data from medical instruments to a web server utilizing NB-IoT. Their system lacks in developing an application that can separate and identify patient data, which resembles event categorization and inter-dependency of health parameters, respectively. The problem of data collection using NB-IoT devices in a smart hospital was first addressed in [
10]; their inadequate policies of the given wireless protocols merely handled the collection of huge data from numerous NB-IoT devices in a smart hospital.
The authors of [
11] investigated the realistic performance of NB-IoT in a healthcare monitoring system in terms of effective throughput and latency. However, the work did not optimize the required throughput, delay, and device density jointly. The authors mainly focused on the application-specific analysis of cell throughput, device capacity, and latency of NB-IoT, keeping aside joint optimization and radio resource allocation with prioritized scheduling. Later, in [
12], an intelligent radio resource management algorithm, iRRM for NB-IoT, was developed with efficient resource allocation considering inter-cell interference (ICI), coverage extension, and the repetition factor. In a healthcare environment, due to the periodic transmission of sensory data, a higher density of User Equipment (UE) always incurs higher delays. However, the necessity of prioritizing interdependent health parameters needs to be addressed to reduce the delay, and it can be implemented through traffic classification. Moreover, achieving expected user utility under the interference-aware radio resource allocation needs further investigation [
1,
9].
This paper develops an interference-aware radio resource allocation for NB-IoT devices in healthcare applications that prioritizes data traffic from different sources and maximizes user utility. We define user utility as a joint metric of achievable data rate and event influenced priority, where users communicate data to the base station (eNB) minimizing interference. The proposed resource allocation is optimized according to the interdependent event under the same time slot with the intention to maximize the overall utility of all users that introduces Priority Aware Utility Maximization (PAUM). This model is projected to achieve the increased performance for healthcare applications. The key contributions of this work are summarized as follows:
We design a Priority Aware Utility Maximization (PAUM) system for providing high-quality medical care in such a way that is convenient for patients so that data transmission can occur according to the application’s urgency level.
We develop an event-influenced prioritized access scheduling of critical and non-critical data packets exploiting Bayes Theorem, which determines the importance of events in a probabilistic distribution.
Under certain constraints, the problem of maximizing user utility has been formulated as a multi-objective non-integer linear programming (MNILP) problem that ensures high performance and fair resource allocation to the users.
The performances of the proposed system have been carried out in Network Simulator version 3, and significant performance improvements are observed for various events and prioritized users in healthcare applications.
This paper is organized as follows:
Section 2 presents relevant studies,
Section 3 defines the system model and assumptions,
Section 4 elaborates the design components of the PAUM system, and
Section 5 analyzes the performance results. Finally,
Section 6 contains the conclusion.
2. Related Works
According to various studies, the healthcare industry utilized radio communication technologies in a variety of ways as it approached advancements in care and rehabilitation. The Wireless Body Sensor Network (WBSN) was one of the most promising concepts; it consisted of a network of sensor nodes worn on the body, capable of capturing, analyzing, and wirelessly transmitting one or more types of physiological or environmental information [
13]. Wireless Body Area Network (WBAN), also known as a body sensor network (WBSN), allowed for health monitoring everywhere on the human body at any time [
14]. On the other hand, IEEE 802.15.6 provided low-power, short-range, and extremely dependable wireless communication within the body’s surrounding area [
15]. For short-, medium-, and long-range communications, WBSNs could communicate with other networks by a number of wireless protocols such as ZigBee, Bluetooth, Ultra-Wide Band, Wireless LAN (Wi-Fi), WiMAX, etc. [
15]. Their uncertainty of battery lifetime and short range communication are the major disadvantages [
13], which prompted the introduction of low-power, wide-area network technology (LPWAN) for healthcare applications, such as LoRa, Sigfox, and NB-IoT. According to [
2,
6], while the unlicensed LoRa and Sigfox technologies focused only on supporting low-cost applications in an energy-efficient way, the NB-IoT is directed to augment high QoS and low latency.
The problem of maximizing utility considering rate maximization or interference mitigation or access prioritization to the application in an NB-IoT based healthcare system has been categorized into two groups. These are: the basic operation of NB-IoT and resource management in NB-IoT-based healthcare applications. This section epitomizes state-of-the-art papers covering both of these groups.
A real-time application of a patients’ health status monitoring system based on theIoT was discussed in [
1] with a brief overview. This work aimed to automatically provide suggestions to the patient according to his health condition. According to their analysis, a licensed frequency supported cellular network (e.g., NB-IoT) ensures reliable and efficient communication in the healthcare system. An intelligent medical plan was based on NB-IoT technology and a smart hospital information management system was developed and explored in [
4].
The study in [
5] explored the aspect of the physical and medium access control (MAC) layer issues of NB-IoT in detail. The authors elaborately discuss synchronous and asynchronous networks elongated with the 5G network. They derive theories for resource allocation, link adaptation, coverage, and capacity issues for specific NB-IoT-based applications, such as healthcare, smart meters, smart grids, etc. Furthermore, a continual survey of Low Power Wide Area Network (LPWAN) technologies of LoRa and NB-IoT in [
6] is also discussed broadly with their basic specification for different services such as IoT industries (Smart Agriculture), public services (Smart metering), personal services (healthcare), etc. The long-range (LoRa), as an unlicensed LPWAN technology, has some advantages in battery lifetime, cost, and capacity, whereas the licensed NB-IoT technology offers efficiency in terms of QoS, latency, reliability, and coverage range. They compared and described the technical differences of LoRa and NB-IoT, where the key aspects consist of physical features, network architecture, MAC evaluation, several IoT applications, QoS, lifetime, and latency. In the paper, IoT cases studies were widely categorized as
IoT personal,
IoT public,
IoT industries, and
IoT appliances. Additionally, it focused on how the network deployment for various applications such as smart agriculture, smart metering, and smart healthcare using NB-IoT will deliver future low-cost services in hard-to-reach areas. This paper also presented the cases of successful implementations of diverse applications in different countries, mainly in Korea, Japan, and China.
In [
9], the authors experimented with collecting the continuous data of a patient to a specific server from a weight scale based on NB-IoT technology. By transferring healthcare data from medical instruments to a web server using NB-IoT, the system aimed at decreasing unnecessary data storage operations. However, it certainly lacks in developing an application that could differentiate and identify patient data classification.
To support the healthcare system, the introduction of connecting intelligent devices to smart hospitals using NB-IoT was discussed in [
10], as NB-IoT provided a new way for connecting devices to meet the requirements of small-scale data over a long period of time. They also overviewed the application scenarios and characteristics of medical IoT devices in smart hospitals. Here, high latency and poor mobility influenced the undesirable effects of NB-IoT. The authors briefly discussed the challenges and future directions of building a smart hospital using NB-IoT. They mentioned the following challenges: (i) the accuracy and reliability of the data, (ii) security and privacy, (iii) wireless communication interference, (iv) energy consumption of terminals, and (v) NB-IoT performance testing, i.e., frame structure, resource allocation methods, connection configuration, etc. A remote healthcare monitoring system using NB-IoT is proposed in [
11]. NB-IoT is an emerging technology that provides low-cost, long-range, and low data rate coverage extension in delay-tolerant applications. The paper analyzed the realistic performance of healthcare data using NB-IoT in terms of effective throughput and latency with various modes of operation such as in-band and stand-alone deployment.
In [
16,
17,
18], NB-IoT evolutions, technologies, and open issues were narrated briefly for their suitable applications. They opened it as the newest Long Term Evolution (LTE) by 3GPP and one of the LPWAN solutions to achieve super coverage, low power, low cost, and massive connection, which was very likely to be used by a smart hospital system. Other than healthcare, a comprehensive discussion in [
19,
20,
21,
22] presented the difficulties of achieving high QoS for smart grid connection for unlicensed LPWAN technology. They proposed NB-IoT for smart grid connection, where the data rate, latency, range, etc., were discussed to satisfy all requirements of QoS.
A systematic analysis of NB-IoT’s Quality of Service in [
21,
22,
23,
24,
25,
26] approached the uplink transfer of individual sensor data from a single sensor and the downlink transfer of individual commands. The authors analyzed relevant physical- and application-layer QoS parameters and contributing factors in a real NB-IoT network, which was studied in Germany for the first time. A detailed evaluation of the end-user QoS of NB-IoT is presented in the paper. In [
8], the optimized radio resource management for OFDM (Orthogonal Frequency Division Multiplexing) was described, which is referred to as bRRM and which solely considers inter-carrier interference. The basic signal format used in 4G LTE (i.e., NB-IoT) is OFDM, which was suited for high-speed data transmission because it resisted narrowband fading caused by reflections and the general propagation qualities at these frequencies by using several carriers, which carried a low data rate. Radio resource management was a vital issue for the OFDM system. The authors devised a resource allocation technique that improved system performance while increasing throughput. Prior to resource management, they failed to recognize the relevance of cell element organization, which is comprehensively discussed in our work. We also looked at NB-IoT, a licensed LPWAN based on the OFDM method that featured to make it ideal for healthcare applications.
The way in which radio resources can be efficiently managed in the NB-IoT context to permit large IoT devices is proposed in [
12] regarded as iRRM. Repetition was a vital aspect to incorporate with the resource allocation strategy in order to achieve coverage augmentation. Initially, the researchers looked at single-cell achievable data rates, determining a trade-off between information rates, latency, and supported devices. Aiming to improve the system sum rate, they proposed NB-IoT-based QoS-aware resource allocation in a multi-cell situation. They created an optimization framework as well as a non-optimal solution for a large number of users in this regard. Finally, the authors developed a cooperative game strategy to achieve a certain system performance and evaluate their concept with evidence-based findings. Their findings revealed that providing higher data rates with NB-IoT comes at a cost, including fewer supported devices and increased delays. This paper focused on jointly optimizing the data rate, delays, device density, and resource allocation to achieve a better solution using NB-IoT. Moreover, in the case of healthcare applications, data sizes are small, requiring less power and long-distance communication, both of which are well supported by NB-IoT.
In this paper, we emphasize on resource allocation methods for smart healthcare system using NB-IoT addressing parameters that were not reflected in previous works. This paper discovers the idea of event categorization to identify an appropriate user for data transmission in a certain time slot for the allocation of radio resources. We explore the factors that affect event-influenced access priority in the NB-IoT healthcare environment and formulate an optimization framework to maximize user utility in networks along with some constraints. In this proposed model, prioritized users (uplink cases) communicate with the base station with interference-aware radio resource allocation while considering the appropriate users, data rate, time slot, and QoS constraints. Such a model is expected to offer higher performance for healthcare applications.
4. Design of the PAUM System
This section characterizes previously discussed research challenges into achievable clarification. Addressing proper access among UEs to communicate with eNB, the events classification model opens up the idea of handling the access based on the priorities of different events.
The block diagram in
Figure 2 illustrates a detailed understanding of our proposed interdependent event influenced prioritized data transmission access scheduling. The following subsections will delineate the events classification and dispensation of proposed algorithms. Preparing a scheduling of UEs tends to mitigate any mutual interference. Maximizing user utility through the optimal allocation of bandwidth resources has been depicted in the latter part of this section.
4.1. Events Classification
It is significant to ensure the data transmission of the healthcare system by making prioritization for various data from different sensors and to guarantee the diverse quality of services to those events [
28]. In this paper, the prioritized scheduling of data packets generated from different UEs is inspired by the fact that different diagnostic reports are related to each other, and the importance of an event is determined by the degree of its relevance with one or more other parameters. Initially, the eNB allocates time slots to uplink users, assuming that they are producing data within the normal range. Once it receives data from different users, it examines and finds out the relationship among the events, including the selection of the priority of the concerned event.
Table 2 gives some examples of the event classification using diseases, probable locations to collect data, and the corresponding diagnosis. First of all, we attempt to reference the syndromes and analogous diagnoses to categorize the events. The instantaneous identification of any disease inside a smart hospital is reflected as a Critical Event (CE), which is required to be handled as crisis/emergency. The diagnoses and treatments that are applied as a direct intervention or in a supportive role for a critical event are termed as Relevant Events (RE). Then, all unvarying procedures are named Normal Events (NE). There are numerous diseases with their own symptoms and diagnoses. Still, some of the diseases and their diagnoses that can be applied with smart-sensor-based equipment are mentioned in the proposed
Table 2. By all means, CE must get a chance first to transmit data with the highest priority, followed by RE and NE.
Applying the Bayes Theorem [
29], the sensed information is categorized into different types of events, based on its vital sign for effective data transmission. This proposed system uses the concept of a candidate model that approximates a target function for mapping inputs to outputs known as a hypothesis. The learner considers these inputs as some set of candidate hypothesis
s and is interested in finding the most probable hypothesis
given observed data
R, which returns the output as the categorized event described in Algorithm 1 in the following subsection.
According to Algorithm 1, event classification depends on sensory data and their co-relation. We use sensory data to determine event-wise training data based on its threshold value. This training data act as prior knowledge to find the likelihood of events in our proposed application. The Bayes Theorem expresses the likelihood of an event based on prior knowledge of the conditions that may be associated with it. Therefore, the Bayes Theorem can be relied on to identify the likelihood and categorize the occurrences with specific conditions to determine the more accurate probability of the emerging event.
| Algorithm 1 Probabilistic determination of Event Type. |
Input: : Sets of UEs, events, vital signs, and hypotheses, respectively : Lower and higher thresholds of vital sign Output: Event Determination Probability and Maximum probable hypothesis - 1:
for each do - 2:
if () then - 3:
; - 4:
else - 5:
if ( returns true) then - 6:
; - 7:
else - 8:
; - 9:
end if - 10:
end if - 11:
end for - 12:
for each do - 12:
; ; ; - 13:
end for - 14:
for each do - 15:
for each do - 15:
; - 16:
end for - 17:
end for - 18:
return;
|
4.2. Event Influenced Prioritized Data Transmission Access Scheduling
In the proposed PAUM system, algorithms and optimization functions are executed in the eNBs. After determining event types, an eNB sends specific transmission slots to the UEs according to their event priorities so as to achieve maximum utility. Individual data sources follow the eNB for sending sensory data. In this section, we formulate two consecutive algorithms intended for an event-influenced priority scheduling to be executed in the eNBs.
The Algorithm 1 generates a probabilistic event recognition output for a single channel based on gathered vital signs in a specific time window. A vital sign is defined as a sign that aids in the detection or monitoring of medical disorders or the measuring of a live organism’s physiological function [
30]. Vital signs are proof of the body’s current physical functioning, providing important information such as blood pressure, pulse rate, breathing rate, etc., to determine the urgency. The Bayes Theorem [
29], which is based on hypothesis and associated individual training data, was used to determine the most likely event type (Critical, Relevant, or Normal). In this algorithm,
N is the set of UEs,
V is the set of vital signs, and
S is the set of hypotheses used as input. In lines 1–11, the vital sign readings and their thresholds are exploited to categorize traffic types—critical training data
, relevant training data
, and ordinary training data
, having priorities 1, 2, and 3, respectively, where the lower number represents higher priority.
Note that the relevant training data are revealed by combining two propositions—: is a critical vital sign; and : is a supporting vital sign for any critical event, . The implication denotes whether a critical event needs the support of another vital sign. If the supporting vital sign is required for the associated critical event of that particular moment, it is counted as relevant training data. It then employs Bayesian learning to determine the probability of an occurrence based on new data that is connected to the event in lines 12 to 13. In fact, Bayesian approaches can incorporate probabilistic prediction hypotheses. In PAUM, the hypothesis is a vector of six constraints, specifying the values of the six attributes of vital sign, location{cabin, OPD, Emergency, Remote}, range, forecast, decision, and type, and combines training examples for the target concept “Event type”. Finally, the algorithm searches the maximally probable hypothesis by MAP (Maximum a posteriori) hypothesis, which returns the most probable event determination in lines 14 to 17.
Then, Algorithm 1’s outputs are received by Algorithm 2 as
—the sorted probabilistic determination of events. Another input is
, the UEs’ delay deadline for individual positioned events. Initially, the priority value is inserted in
applying the
positioned UEs vital sign record using function PRIORITY(
) on line 2, and that UE is placed in a subsequent Queue position. Then, in lines 3–4, the priorities and queue positions are updated depending on the delay deadline values of two consecutive events given that they have a very small difference (
) in their
values. It assists us in assuring that important packets are transmitted earlier than others. Finally, sorted priority events are stored in a queue as a result of Algorithm 2.
| Algorithm 2 Prioritized Data Transmission Queue Scheduling Algorithm. |
Input: sorted in descending order. Set of delay-deadlines of all UEs Output:P: Set of Priorities, Q: Transmission Queue Initialization: counting variable, 1 - 1:
for each do - 2:
PRIORITY(); ; - 3:
if then - 4:
PRIORITY(); ; ; - 5:
else - 5:
; - 6:
end if - 7:
end for - 8:
return;
|
Let us look at an example situation in which three vital signs are used to promote a better understanding of algorithms. Assume a smart BP (Blood Pressure) sensor sends data in a single channel from multiple places (OPD, Emergency, Ward, Cabin) during a time slot, , such as = {(80, 120), (45, 120), (82, 115), (80,185)}. A smart blood sugar monitor collects data = {4.2, 5.6, 6.7, 7.5} and a smart pulse oximeter collects data = { 97, 96.5, 98, 99} in the same time frame and channel. The Bayes Theorem thus aids in assessing the likelihood of a forthcoming event based on its vital sign record collection across multiple sites combine as a hypothesis. Both the second and fourth BP recordings in our example exceed the threshold, suggesting they are critical events. A chest X-ray/ECG is a significant relevant diagnosis in this circumstance to support the identified critical event. Then, both blood sugar and oxygen saturation levels are within acceptable limits, indicating that the occurrence is normal. Finally, the UE for blood pressure is given top priority, P, and is positioned first in Queue, followed by the UEs for chest X-ray, blood sugar, and pulse-oximeter. This is how the eNB categorizes the UEs according to the event.
Multilevel Queue with Preemptive Round Robin Scheduling
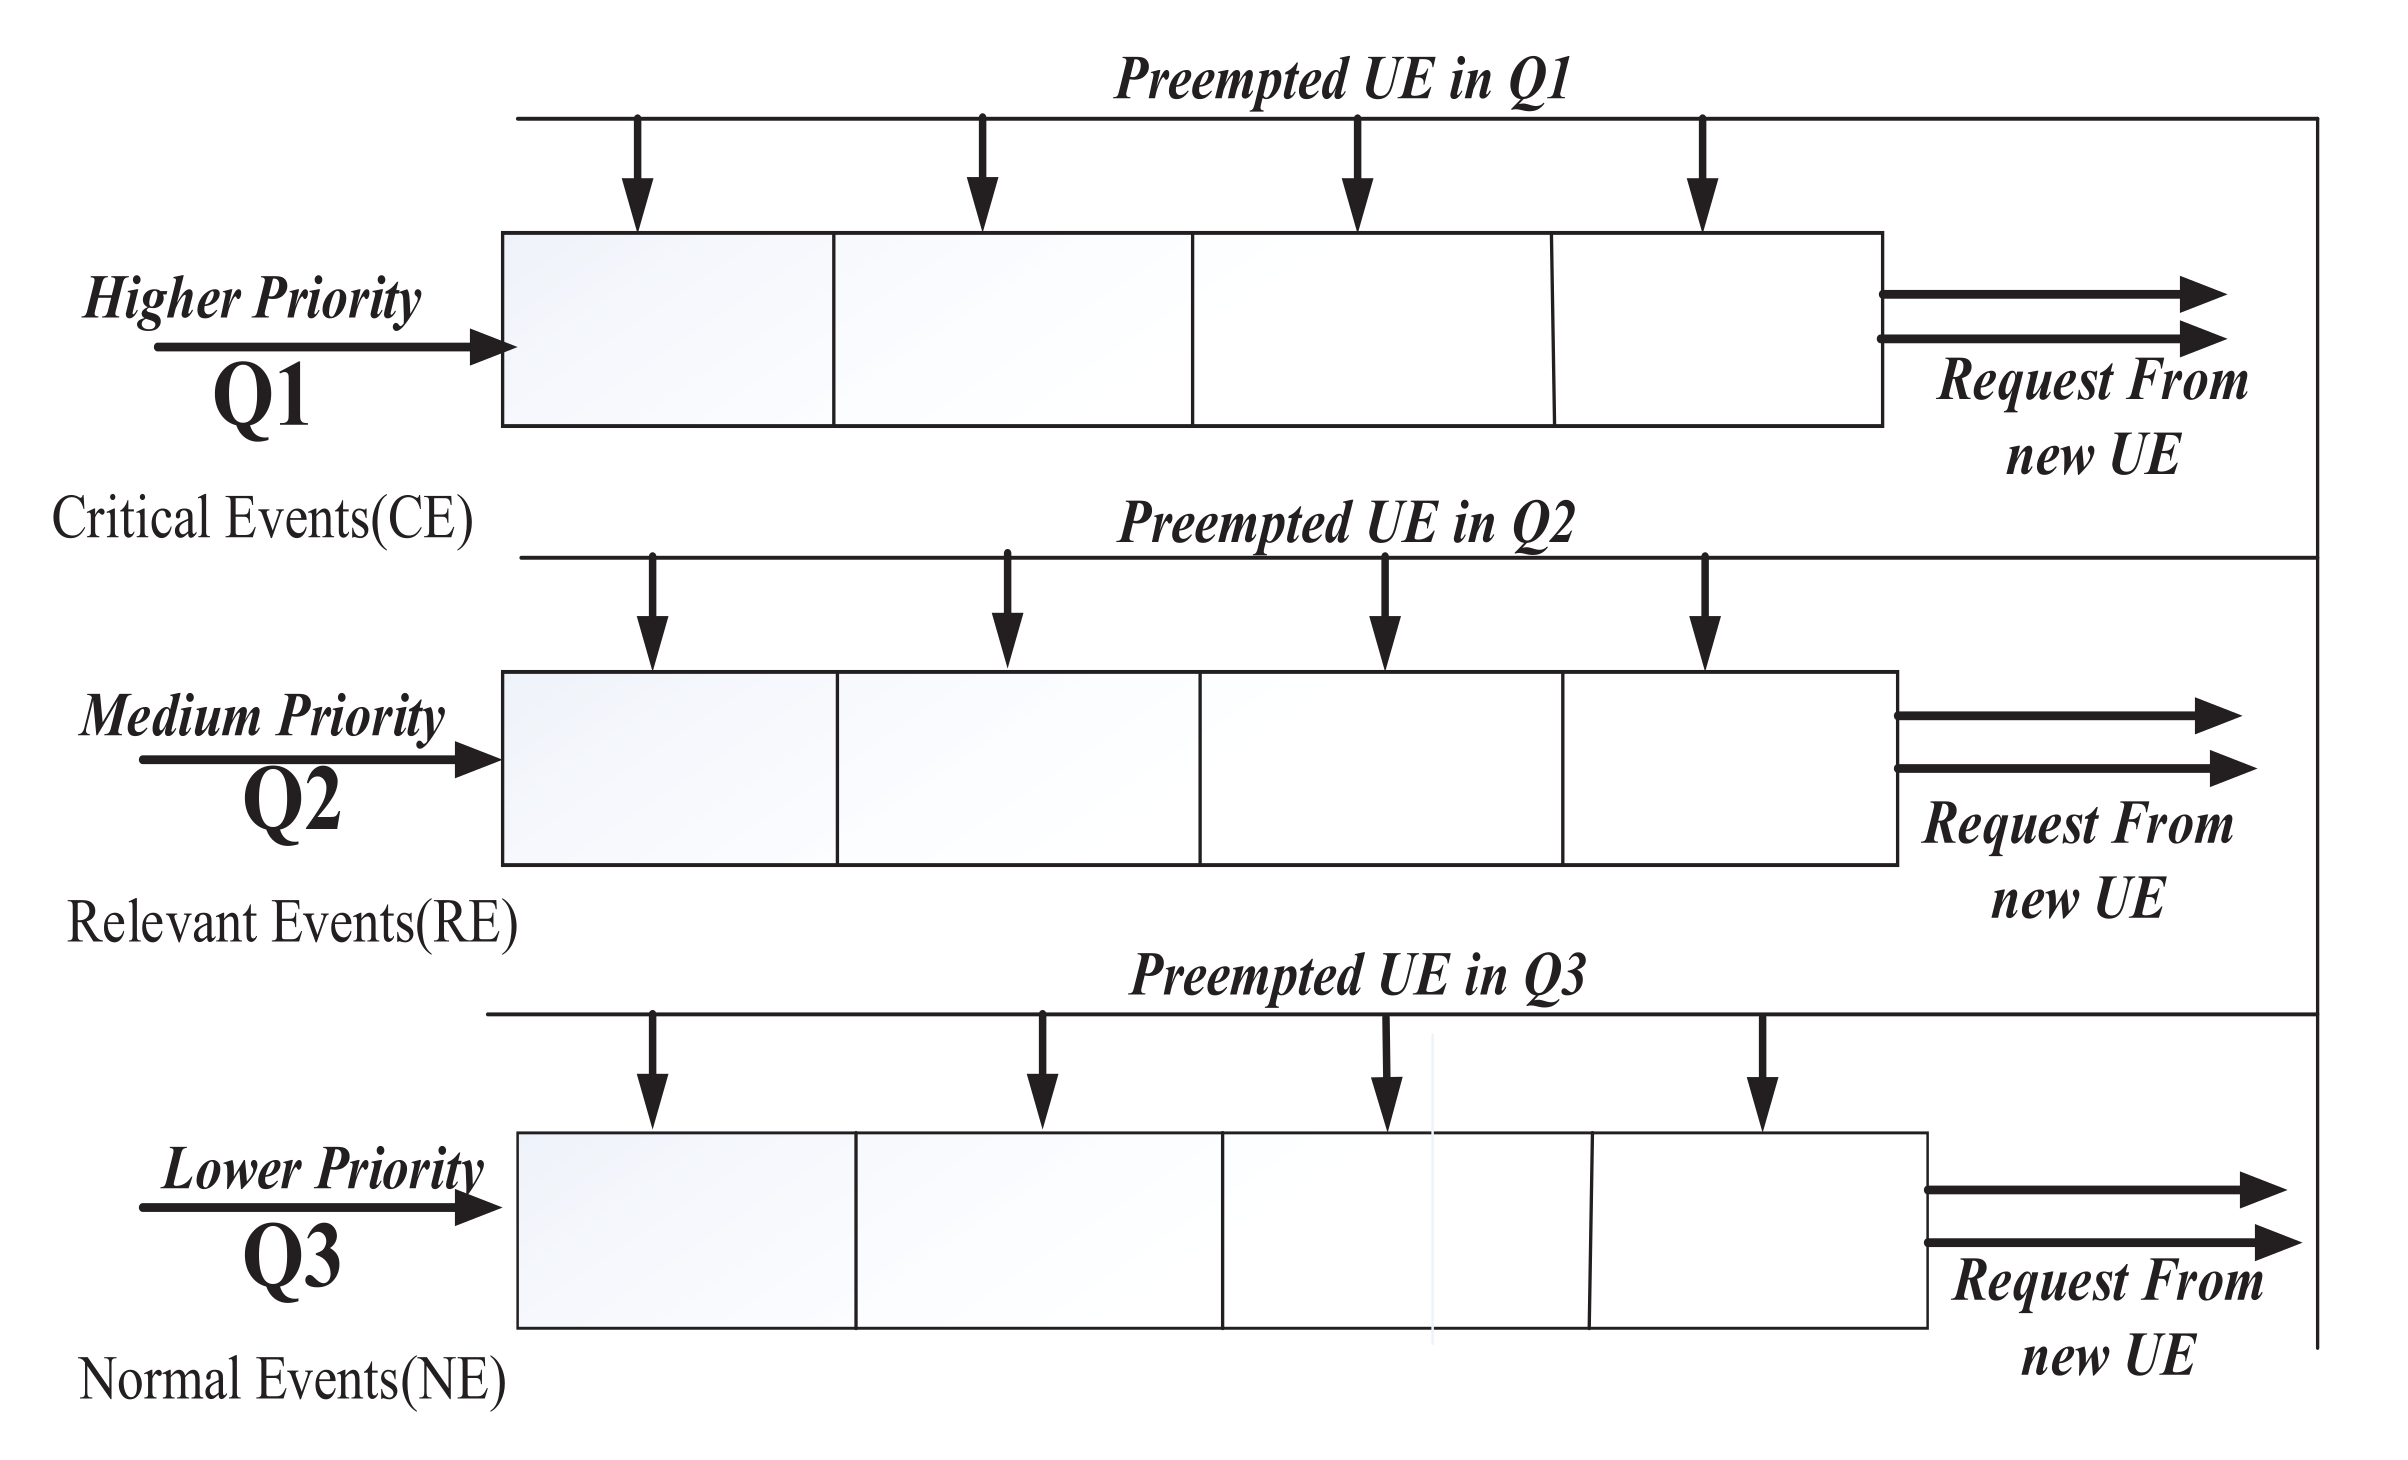
Algorithm 2 returns the transmission queue result, which reflects the data transmission priority. Because this queue uses a preemptive RR (Round Robin) algorithm, transmission begins with a higher priority data packet and ends with a lower priority. We examine the suggested method in this part, taking into account changes in location inside the smart hospital. As a result, we investigate how other UEs obtain a schedule from the base station during the transmission of a queue that has already been scheduled.
If any unscheduled higher priority events desire to join the eNB during the current transmission queue process, they must be handled by an eNB for effective scheduling and prioritized access. In this case,
Figure 3 shows that the ready queue is divided into a multilevel queue approach, with the first queue
having the highest priority and containing all critical events, the second queue
having the next higher priority and representing all relative events, and the third queue
having a lower priority and holding normal events.
Preemptive queue scheduling assigns a spot in Q1, Q2, or Q3 according to the priority of any new UE joining this access scheduling mechanism. When multilevel queuing is used, there is a significant risk of starvation [
28]. To mitigate data transmission starvation, the aging algorithm [
31] is used.
4.3. Interference Mitigation
The next research concern is interference mitigation among UEs while communicating with the base station. The frequency band allocation for NB-IoT in standalone mode or in-band mode may not be simultaneous in all cells, resulting in inter-cell interference (ICI) [
7,
11]. Any possible noise/interference may cause natural readings to be disrupted, resulting in incorrect identification and treatment [
10]. As a result, an effective strategy for eliminating interference and providing QoS to users must be developed.
The UEs are assigned to a transmission queue to prioritize event-influenced access to the base station. Currently, the system is working on making the most efficient use of available resources while addressing interference mitigation. For an OFDMA (Orthogonal Frequency Division Multiplexing)-based cellular network, where cells are separated into discrete areas with different frequencies, frequency reuse methods are the best interference management strategies. The signal to interference and noise ratio (SINR) is the most essential factor in determining the amount of inter-cell interference and evaluating the interference management technique’s performance.
The SINR formula, in general, is as follows:
Here, is the received power of the desired user, I is the total interference, h is the fading channel gain, and is Additive white Gaussian Noise.
Now, we can define, the interference:
Equation (
2) implies that
is the inter-cell interference received by the user
i of Base station
b in the uplink transmission scheme from the users of neighboring Base stations using the same resource, where
is the transmit power from
z the downlink/uplink user of neighboring cell
k,
is the channel gain between the neighboring BS
k, and
j is the uplink user of Base station
b.
The data rate in Equation (
3) can be defined for uplink users as follows:
4.4. User Utility Maximization
This section delineates user utility and develops an optimization framework to optimally allocate resources based on the desired user utility. We want to allocate bandwidth resources to the UEs so that the user data rate is maximized, the interference is minimized, and the high-priority users obtain access to good quality resources.
Thus, the Utility function
for an
uplink user, is defined as:
and the optimization framework is formulated as:
Here, the objective function in Equation (
5) is formulated as an MNILP (Multiobject Non-Integer Linear Programming) to be solved by the eNB. Maximizing utility with an allocated channel and its time slot for all uplink users resulted in an optimum solution with some effective constraints.
Allocation Constraint: The binary variable
in Equation (
6) contains 1 if an uplink user
is allocated a time slot
of channel
, and 0 otherwise.
Budget Constraint: The measurement variable
in Equation (
7) enumerates how much data of a UE is possible to be transmitted through a particular channel
with an allocated time slot.
Time Slot Allocation Constraint: The constraint in Equations (
8) and (
9) creates a restriction that exactly one time slot in a time frame can be allocated to an uplink user
z if the number of users is less than the available time slots; otherwise, the allocation of a time slot to an uplink user
z is not guaranteed but is rather opportunistic following its priority.
Interference Constraint: Constraints in Equations (
10) and (
11) mitigate interference issues by keeping power within a certain range while choosing a channel that offers gain above a certain minimum threshold. In the PAUM system, the utility of a patient emphasized the QoS of a successful and reliable smart healthcare system. The maximization of utility for any uplink user upgrades the system’s access reliability; under the time slot assignment, its higher priority and its higher data rate and event-influenced delay is achieved.
6. Conclusions
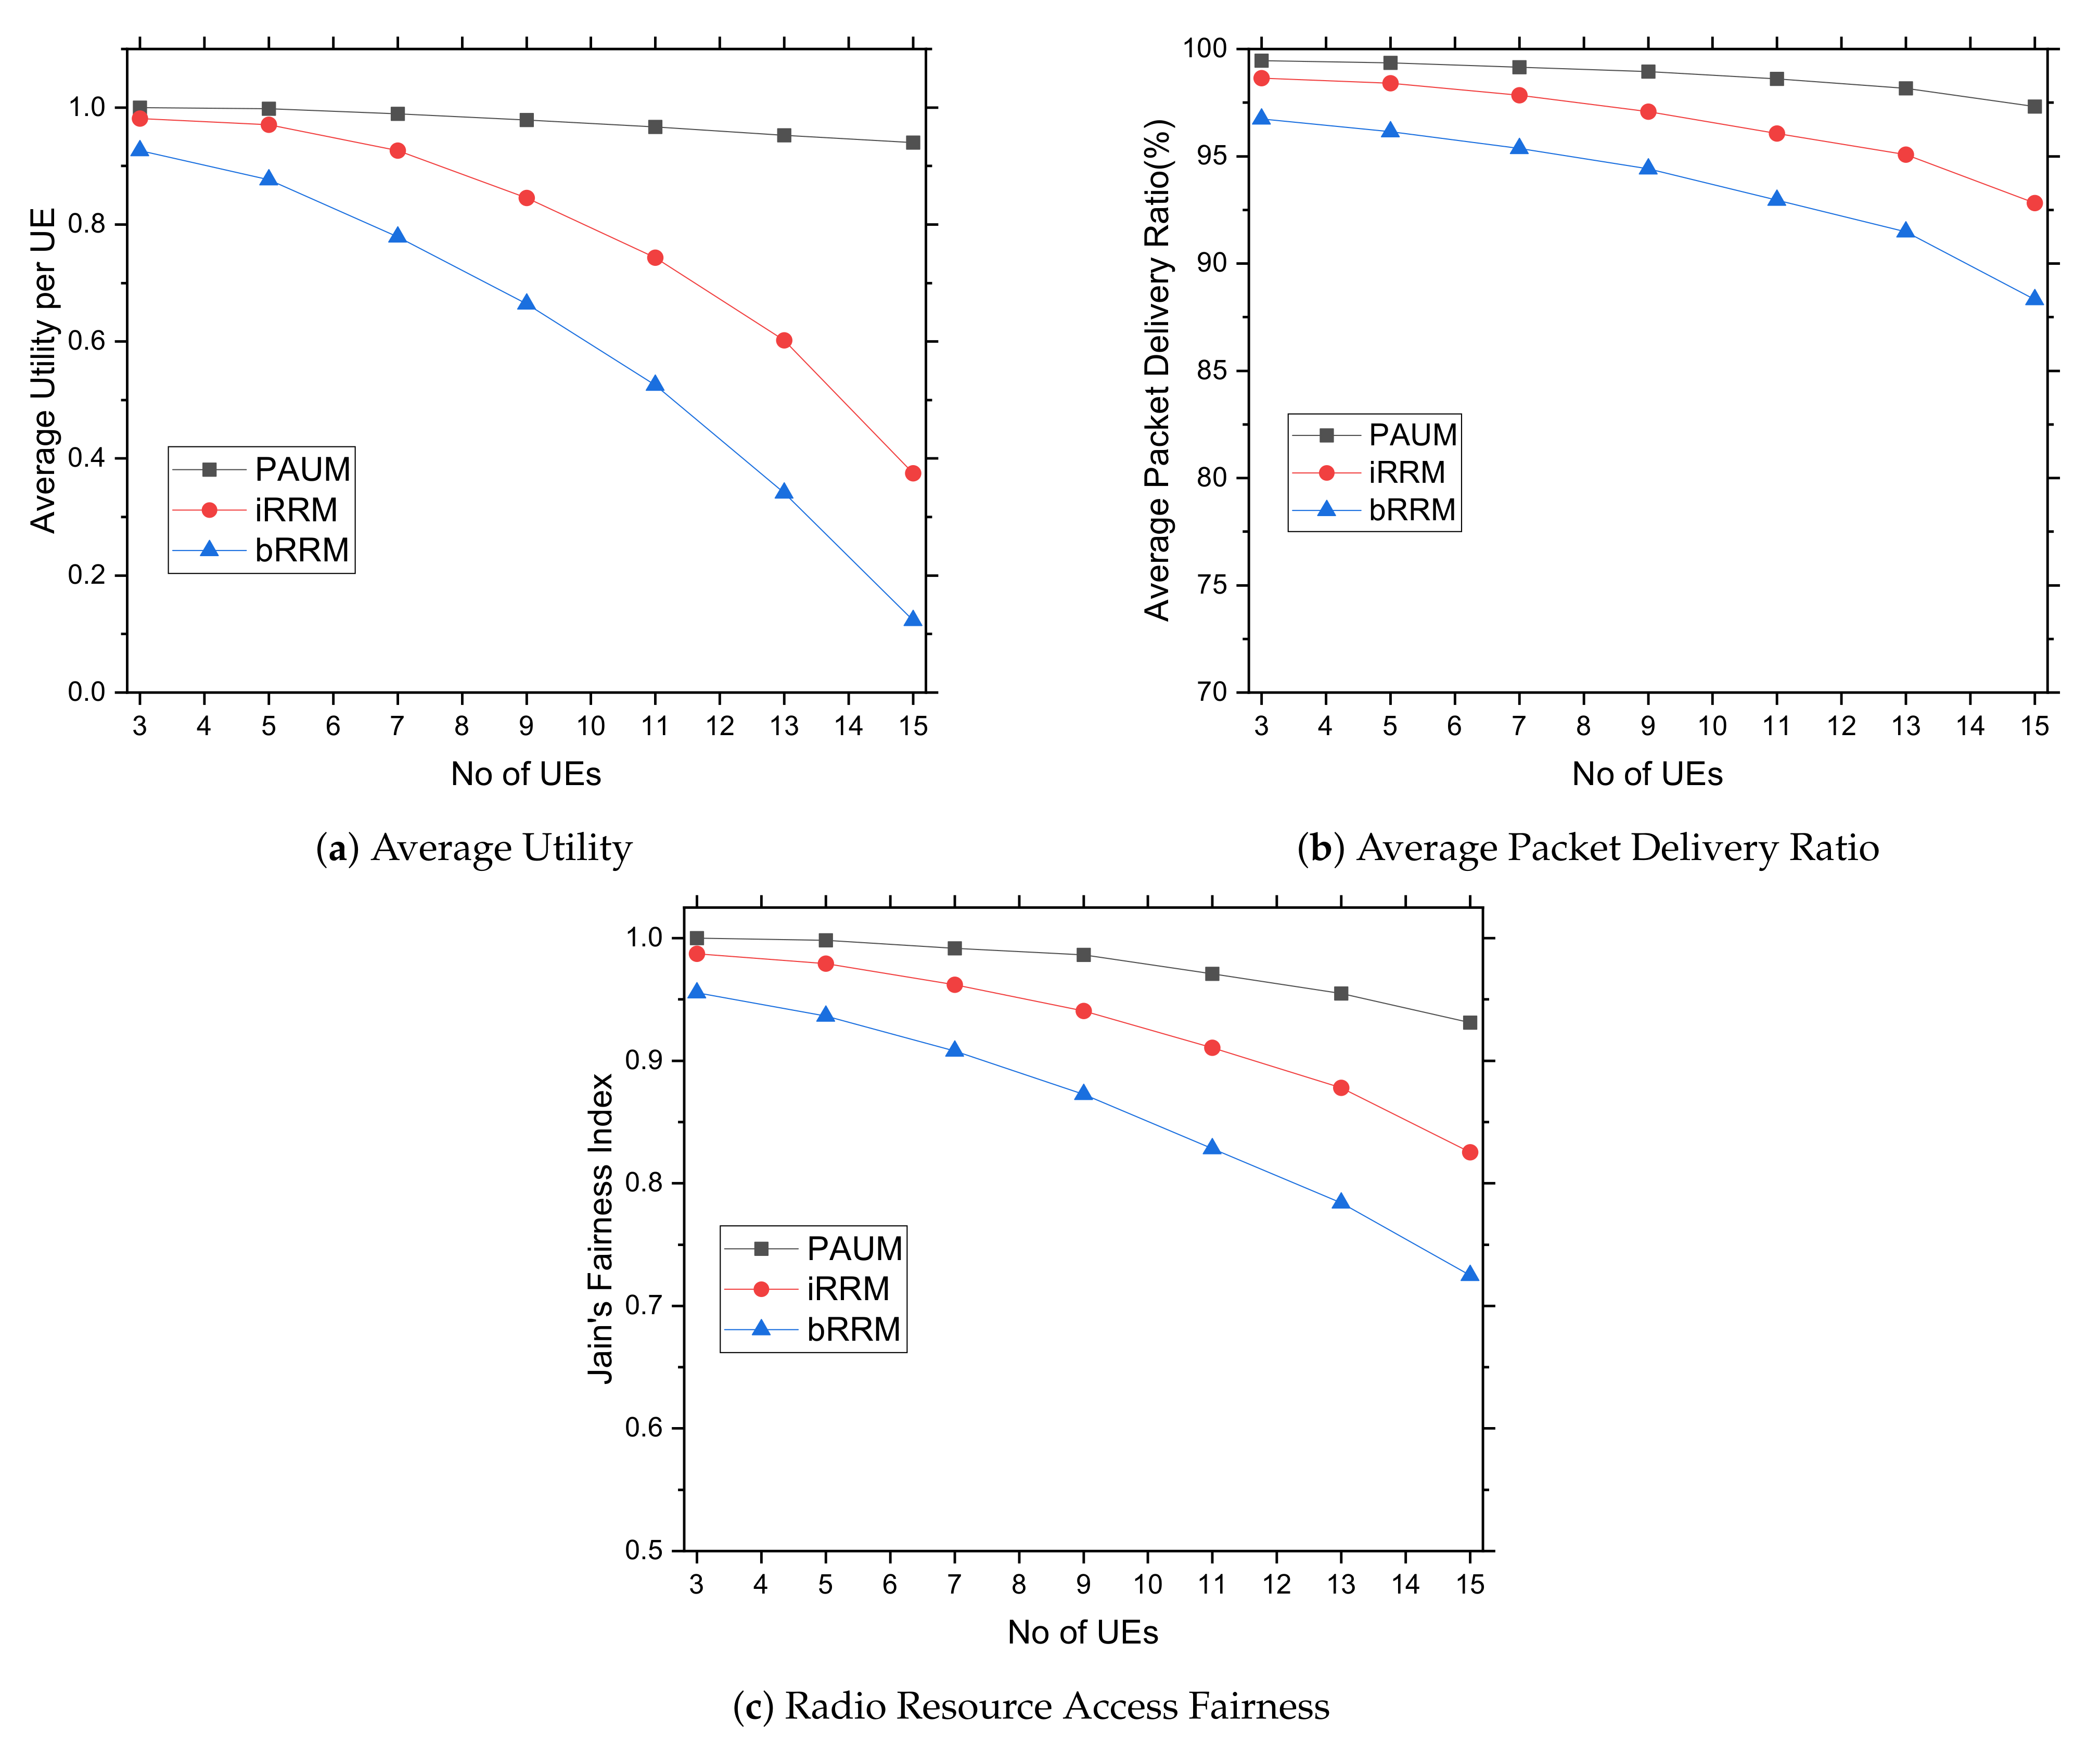
This work investigated how healthcare application events are influenced by priority access scheduling and utility maximization in NB-IoT. Our suggested system, PAUM, greatly contributed to resource allocation for prioritized access by allocating a suitable channel, a non-interfering time slot with greater data rate to different data packets by formulating a mixed non integer linear programming solution. Using event-induced prioritization, our system maximizes the utility value of users by allocating resources optimally. Our in-depth examination of the simulation trace file revealed that interference was reduced as a result of prioritized access scheduling to the time slots. Due to event classification, the critical event received the greatest priority to meet its urgency, followed by the other events. The simulation results showed significant performance improvement in terms of utility, fair share of resources, delay, and packet delivery ratio by 65%, 45%, 25%, and 15%, respectively, compared to the iRRM system.
In the future, in place of Bayesian learning, other learning approaches including instance-based algorithms, analytical learning, and reinforcement learning can be explored to study scopes for further performance improvement.


