
Carbon SH-SAW-Based Electronic Nose to Discriminate and Classify Sub-ppm NO2

 ,
, 
 , and
, and 
Abstract
: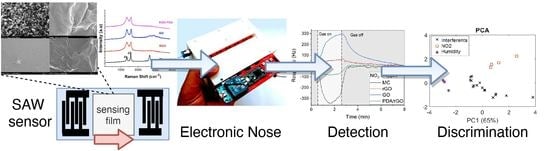
1. Introduction
2. Materials and Methods
2.1. Materials
2.2. SH-SAW Sensors Fabrication
2.3. Sensitive Layer Fabrication
- Mesoporous Carbon (MC). Gum Arabic (GA) was dissolved in deionized (DI) water to prepare a solution of 2 mg/mL. Then, 1 mg of MC was added to prepare a dispersion using an extended low power ultrasonication bath (Branson 5510) for 7 h. Afterwards, the dispersion was deposited on the SH-SAW sensor by spray coating in order to obtain a reproducible deposition method.
- Graphene Oxide (GO). An aqueous dispersion of GO (0.5 mg/mL) was prepared by mixing GO powder with DI water:methanol (1:5 volumetric ratio), then the mixture was sonicated for 15 min. The dispersion was used immediately for deposition using the Lagmuir–Blodgett (LB) technique.
- Reduced GO (rGO). The reduction of graphene oxide (reduced graphene oxide, rGO) was performed in a U reactor with a fritted plate 1.5 cm in diameter, where 100 mg of GO powder was heated at 400 °C for 2 h under constant flow of a 100 mL·min−1 H2/Ar (10% H2 balance Ar) mixture. Then, the reaction was allowed to cool until it reached RT. The synthesized product was a fine black powder. Further, a homogeneous rGO dispersion was obtained by mixing approximately 2.0 mg of rGO powder with 8 mL of methanol and sonicated for 4 h at RT.
- GO and rGO Langmuir–Blodgett film formation. Langmuir–Blodgett (LB) deposition on the sensor chip was performed in a trough KSV 5000 alternating multilayer LB system (KSV Finland). The trough was first cleaned with chloroform and then filled with ultrapure water (Milli-Q system, 18.2 MΩ cm and simplicity 185, Millipore, Burlington, MA, USA). The rGO/GO dispersion was spread onto the water surface dropwise using a glass syringe at a speed of ~100 μL/min. The surface pressure was monitored using a tensiometer attached to a Wilhelmy plate. Barriers compressed the film at a speed of 15 mm/min. The rGO monolayer was transferred to an SH-SAW sensor using the vertical lifting method at 22 °C. Z-type multilayer structures were prepared by the vertical deposition method at a dipping speed of 10 mm/min. The same procedure was followed to prepare GO monolayer substrates.
- Polydopamine (PDA) film formation on an rGO chip. PDA was obtained by dissolving DA hydrochloride powder in Tris buffer (pH 8.6) to obtain a DA concentration of 0.01 M. Then, the previously fabricated rGO (LB) sensor chip was immediately immersed in the DA/Tris solution at RT for 30 min. The PDA/rGO chip was rinsed three times with ultrapure water and dried in a dissector.
2.4. Structural and Morphological Characterization
2.5. Experimental Setup for Gas Measurement
2.6. Electronic Nose Configuration
- The signal conditioning module. The SH-SAW signals were generated using a set of microwave circuits that consisted of two amplification states and a directional coupler.
- The multiplexor module. The signal of each sensor oscillator was selected and forwarded to a single output, which was mixed with an oscillator-based reference signal, obtaining a new signal around 1 MHz. The reference device also compensates for external disturbances such as changes of temperature.
- The acquisition and transmission module. A microcontroller was used to measure the resulting signal of the multiplexor module. The e-nose was kept at controlled RT while variations of the frequency over time were recorded by wireless communication (XBEE protocol). The experiment control, the real time data acquisition and the classification analyses were implemented with a PC using the LabVIEW and the Matlab software, respectively.
3. Results and Discussion
3.1. Electrical Characterization
3.2. Morphological and Spectroscopic Characterization of Carbon-Based Sensitive Layers
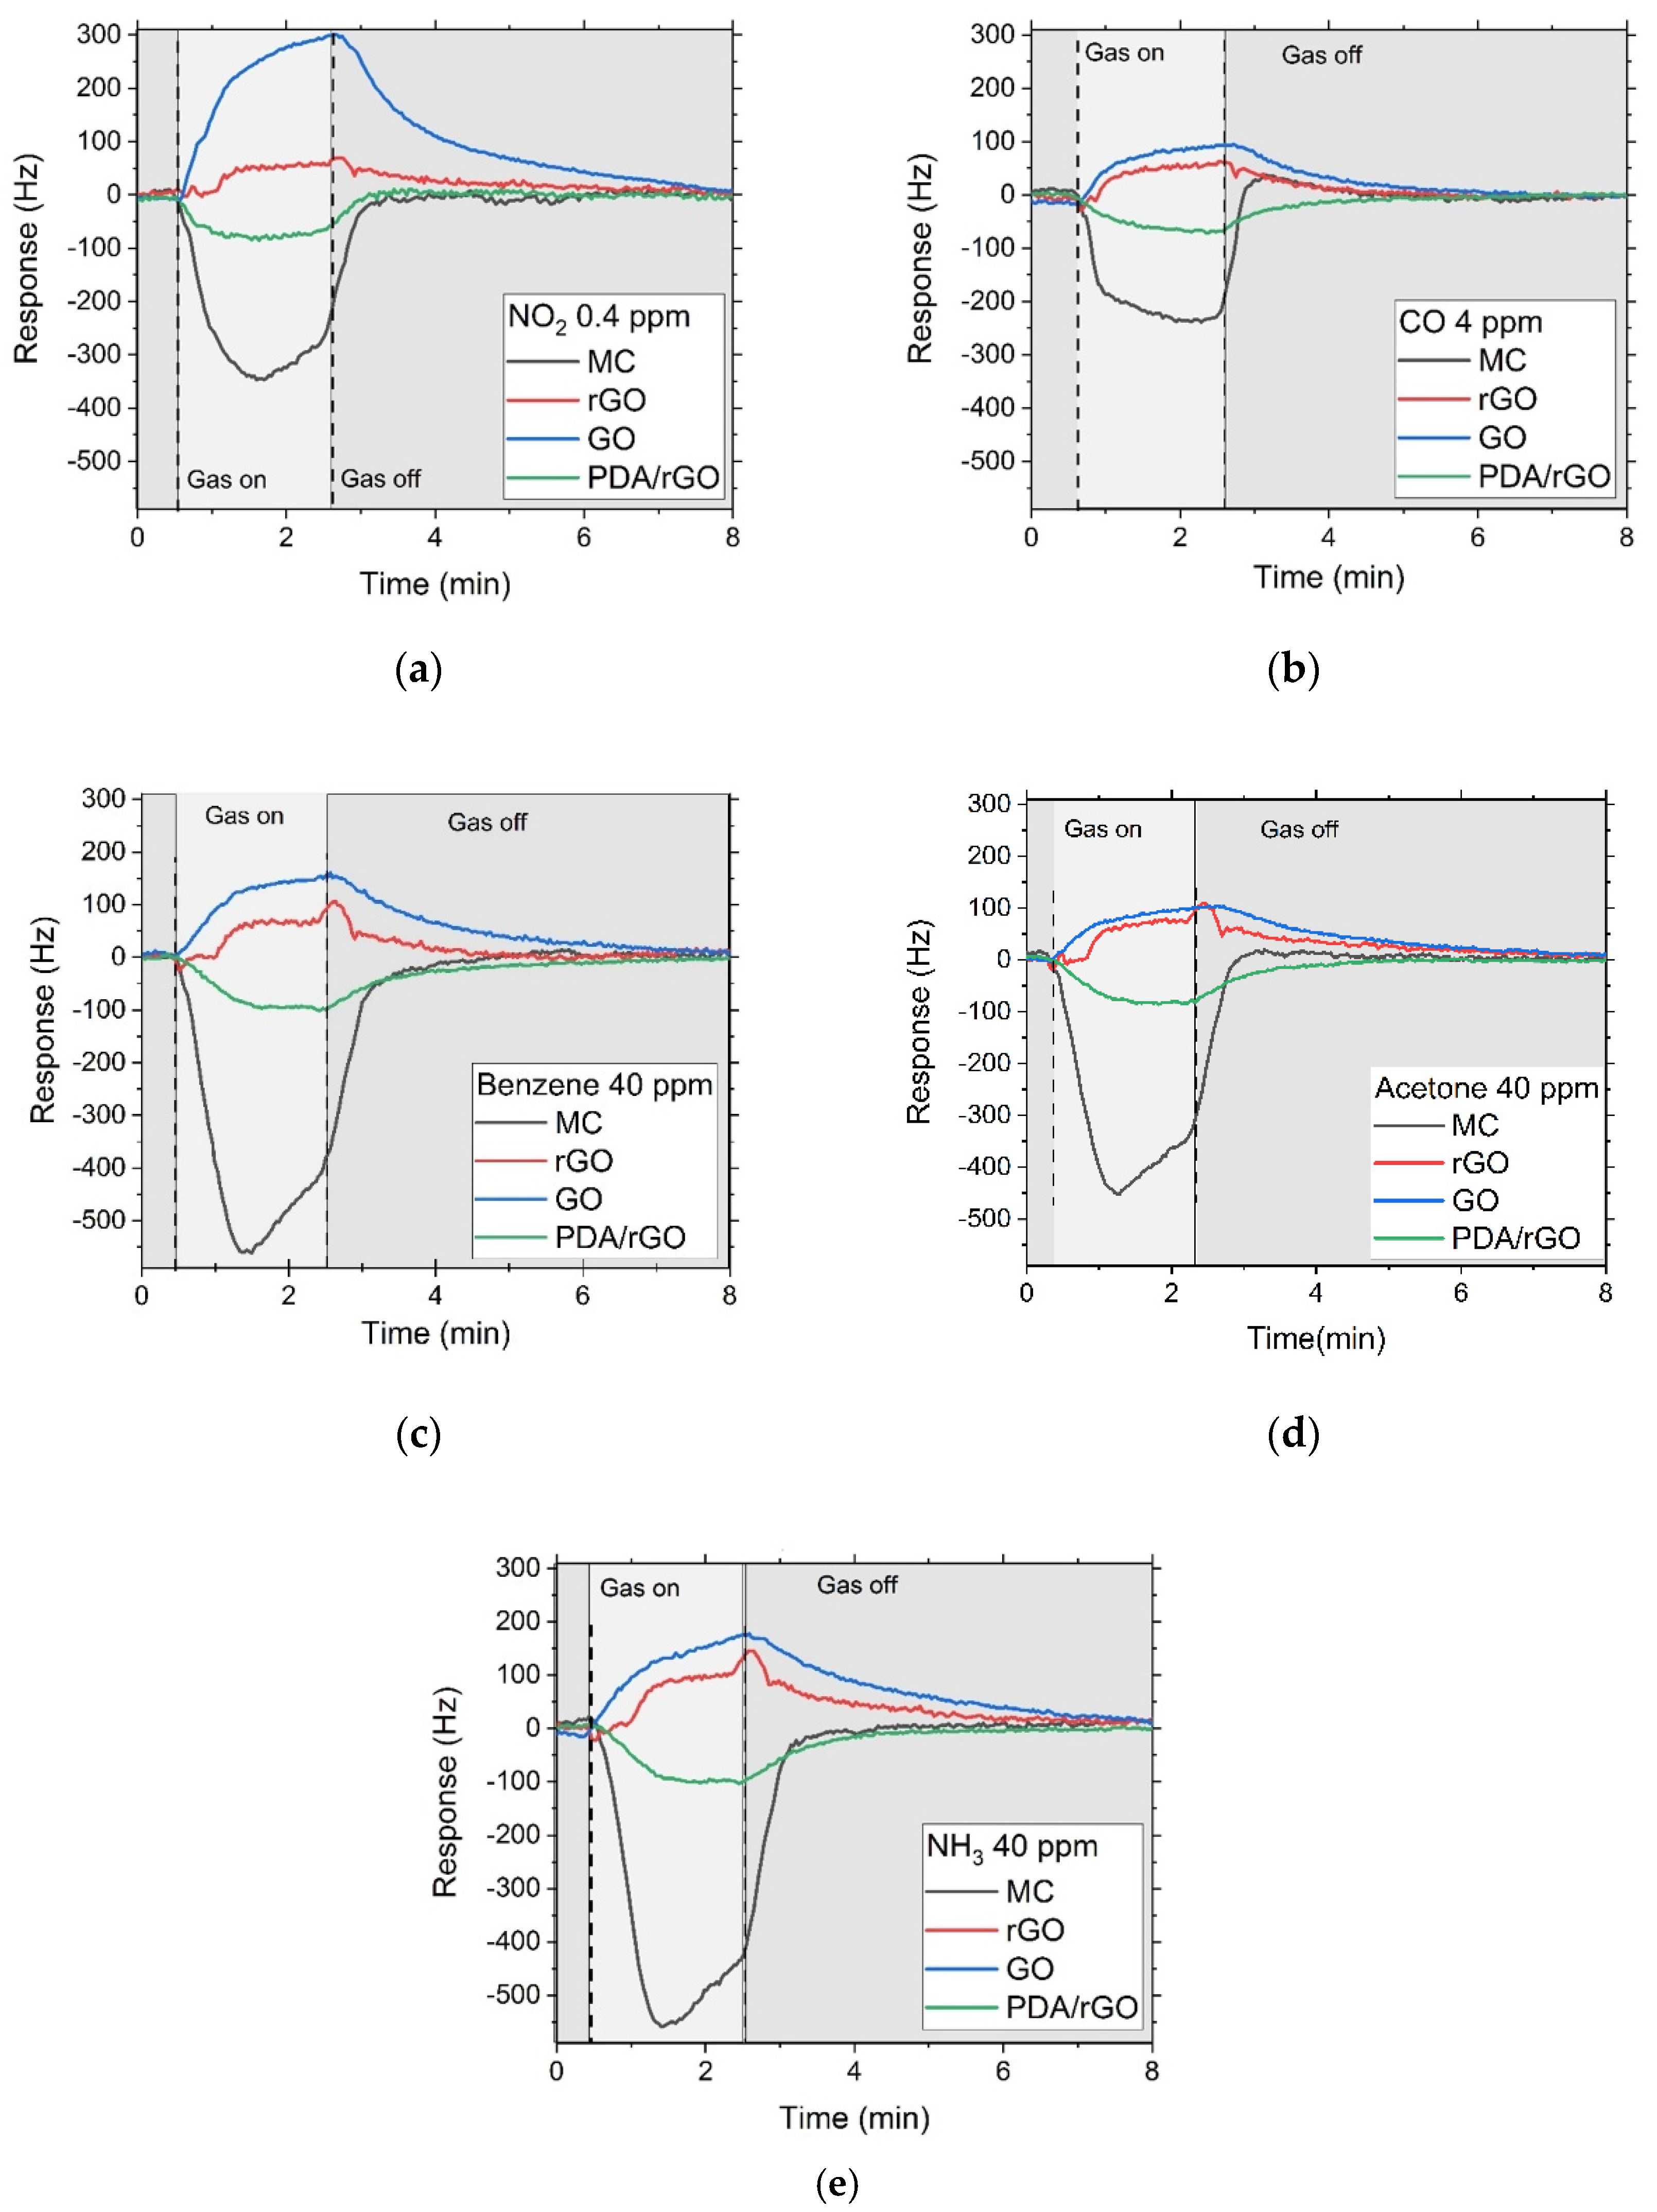
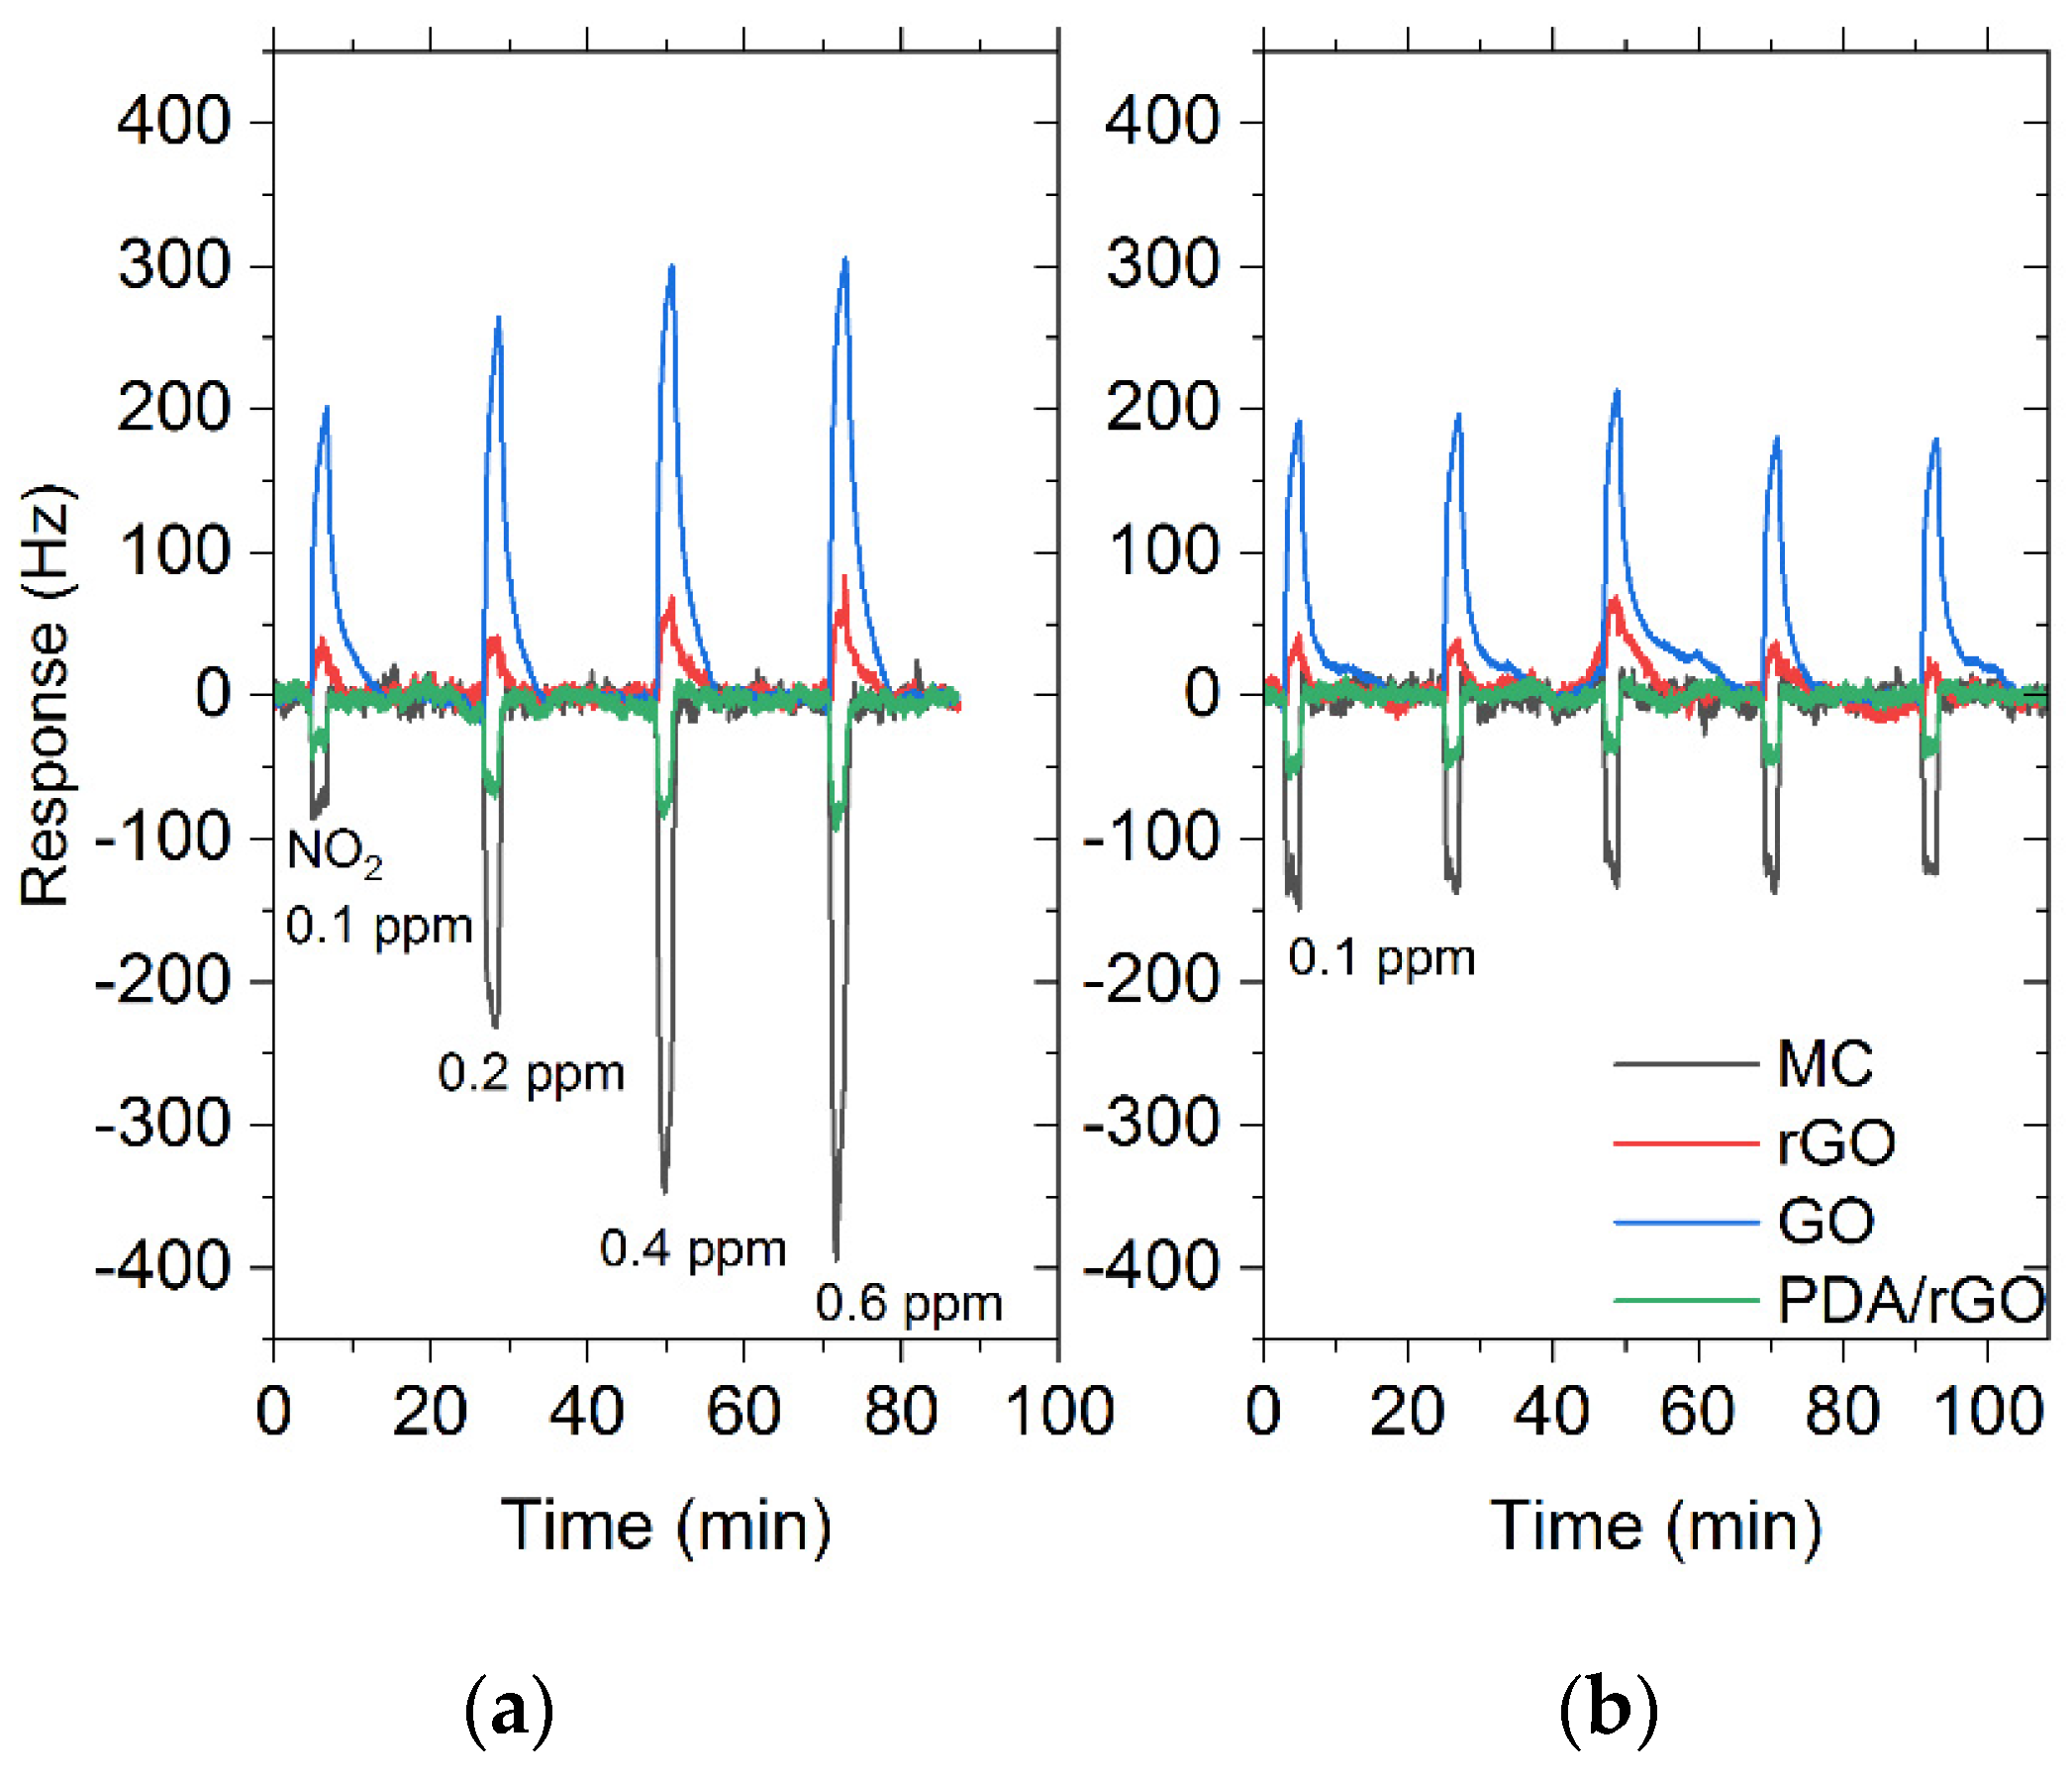
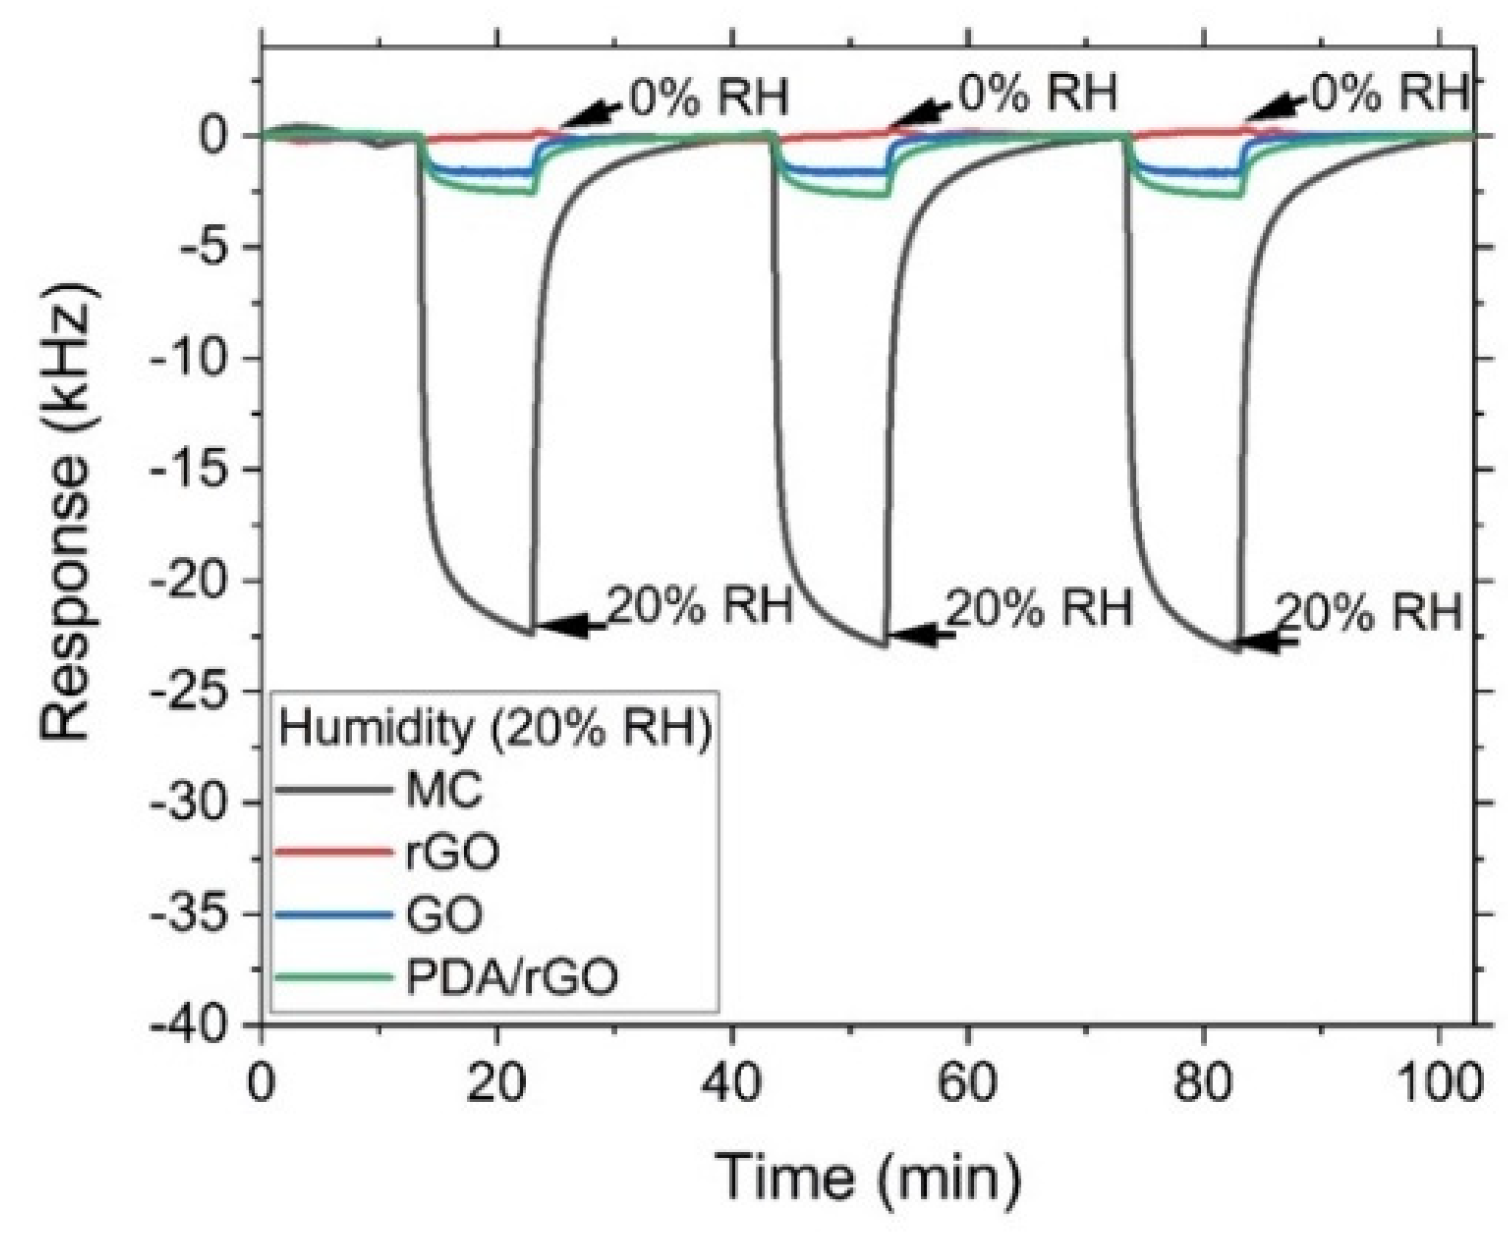
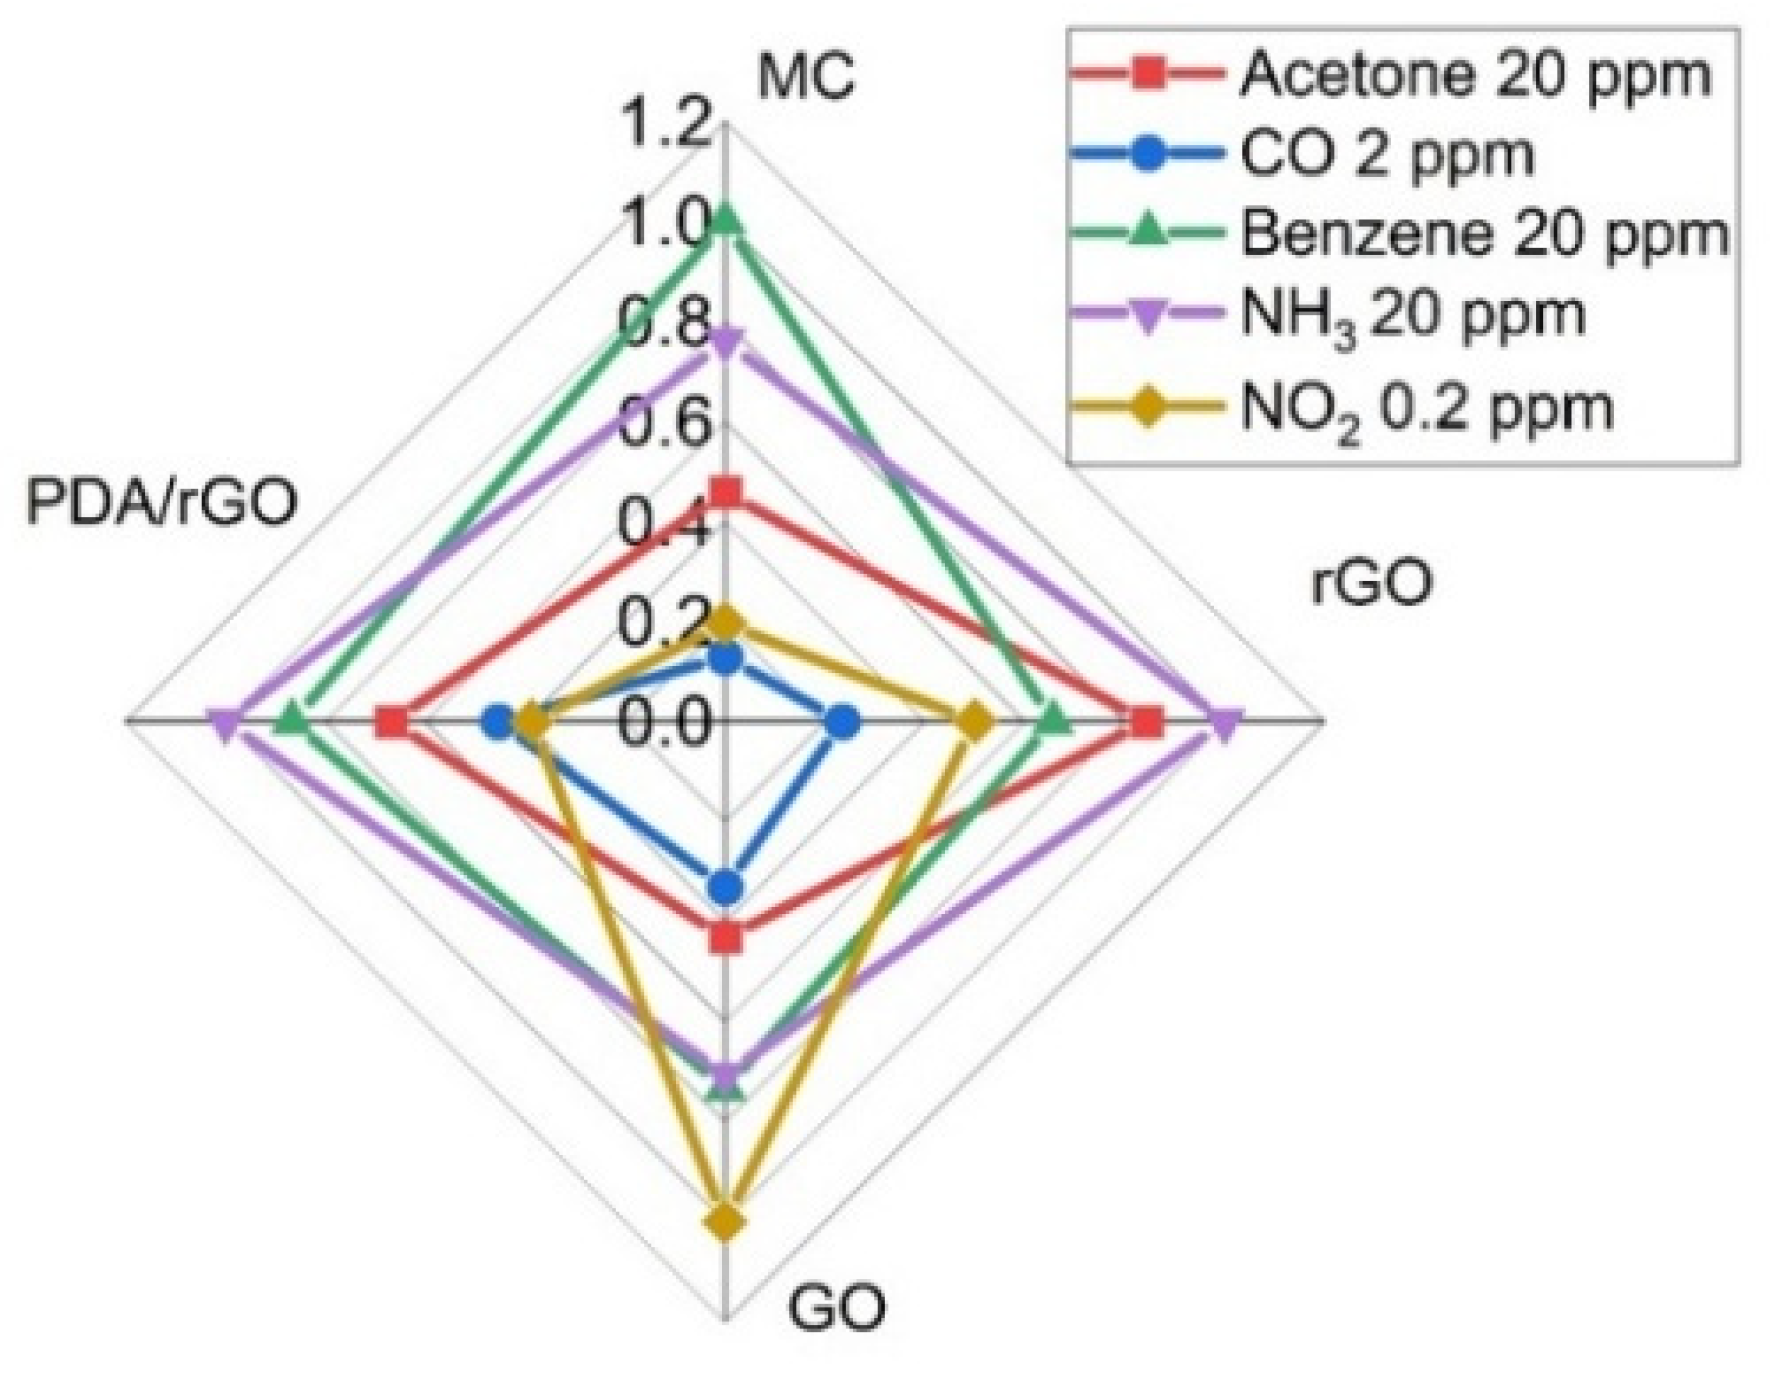
3.3. Gas Sensor Characterization
3.4. Statistical Treatment and Classification Analysis
4. Conclusions
Author Contributions
Funding
Institutional Review Board Statement
Informed Consent Statement
Data Availability Statement
Acknowledgments
Conflicts of Interest
Abbreviations
References
- Tan, X.; Han, L.; Zhang, X.; Zhou, W.; Li, W.; Qian, Y. A review of current air quality indexes and improvements under the multi-contaminant air pollution exposure. J. Environ. Manag. 2021, 279, 111681. [Google Scholar] [CrossRef] [PubMed]
- Chen, T.M.; Kuschner, W.G.; Gokhale, J.; Shofer, S. Outdoor air pollution: Nitrogen dioxide, sulfur dioxide, and carbon mon-oxide health effects. Am. J. Med. Sci. 2007, 333, 249–256. [Google Scholar] [CrossRef] [PubMed]
- Wang, C.; Yin, L.; Zhang, L.; Xiang, D.; Gao, R. Metal Oxide Gas Sensors: Sensitivity and Influencing Factors. Sensors 2010, 10, 2088–2106. [Google Scholar] [CrossRef] [PubMed] [Green Version]
- Han, X.; Naeher, L.P. A review of traffic-related air pollution exposure assessment studies in the developing world. Environ. Int. 2006, 32, 106–120. [Google Scholar] [CrossRef] [PubMed]
- SM, S.N.; Yasa, P.R.; Narayana, M.V.; Khadirnaikar, S.; Rani, P. Mobile monitoring of air pollution using low-cost sen-sors to visualize spatio-temporal variation of pollutants at urban hotspots. Sustain. Cities Soc. 2019, 44, 520–535. [Google Scholar] [CrossRef]
- Covington, J.A.; Marco, S.; Persaud, K.C.; Schiffman, S.S.; Nagle, H.T. Artificial Olfaction in the 21st Century. IEEE Sens. J. 2021, 21, 12969–12990. [Google Scholar] [CrossRef]
- Shaw, C.; Boulic, M.; Longley, I.; Mitchell, T.; Pierse, N.; Howden-Chapman, P. The association between indoor and outdoor NO2 levels: A case study in 50 residences in an urban neighbourhood in New Zealand. Sustain. Cities Soc. 2020, 56, 102093. [Google Scholar] [CrossRef]
- Shea, K.M.; Truckner, R.T.; Weber, R.W.; Peden, D. Climate change and allergic disease. J. Allergy Clin. Immunol. 2008, 122, 443–453. [Google Scholar] [CrossRef]
- Bahos, F.A.; Sainz-Vidal, A.; Sánchez-Pérez, C.; Saniger, J.M.; Gràcia, I.; Saniger-Alba, M.M.; Matatagui, D. ZIF Nanocrystal-Based Surface Acoustic Wave (SAW) Electronic Nose to Detect Diabetes in Human Breath. Biosensors 2018, 9, 4. [Google Scholar] [CrossRef] [Green Version]
- Vanotti, M.; Poisson, S.; Soumann, V.; Quesneau, V.; Brandès, S.; Desbois, N.; Yang, J.; André, L.; Gros, C.P.; Blondeau-Patissier, V. Influence of interfering gases on a carbon monoxide differential sensor based on SAW devices functionalized with cobalt and copper corroles. Sens. Actuators B Chem. 2021, 332, 129507. [Google Scholar] [CrossRef]
- Zhu, H.; Xie, D.; Lin, S.; Zhang, W.; Yang, Y.; Zhang, R.; Shi, X.; Wang, H.; Zhang, Z.; Zu, X.; et al. Elastic loading enhanced NH3 sensing for surface acoustic wave sensor with highly porous nitrogen doped diamond like carbon film. Sens. Actuators B Chem. 2021, 344, 130175. [Google Scholar] [CrossRef]
- Matatagui, D.; López-Sánchez, J.; Peña, A.; Serrano, A.; del Campo, A.; de la Fuente, O.R.; Carmona, N.; Navarro, E.; Marín, P.; Horrillo, M.D.C. Ultrasensitive NO2 gas sensor with insignificant NH3-interference based on a few-layered mesoporous graphene. Sens. Actuators B Chem. 2021, 335, 129657. [Google Scholar] [CrossRef]
- Raj, V.B.; Nimal, A.T.; Tomar, M.; Sharma, M.U.; Gupta, V. Novel scheme to improve SnO2/SAW sensor performance for NO2 gas by detuning the sensor oscillator frequency. Sens. Actuators B Chem. 2015, 220, 154–161. [Google Scholar] [CrossRef]
- Rana, L.; Gupta, R.; Tomar, M.; Gupta, V. ZnO/ST-Quartz SAW resonator: An efficient NO2 gas sensor. Sens. Actuators B Chem. 2017, 252, 840–845. [Google Scholar] [CrossRef]
- Hung, T.-T.; Chung, M.-H.; Chiu, J.-J.; Yang, M.-W.; Tien, T.-N.; Shen, C.-Y. Poly(4-styrenesulfonic acid) doped polypyrrole/tungsten oxide/reduced graphene oxide nanocomposite films based surface acoustic wave sensors for NO sensing behavior. Org. Electron. 2021, 88, 106006. [Google Scholar] [CrossRef]
- Rana, L.; Gupta, R.; Kshetrimayum, R.; Tomar, M.; Gupta, V. Fabrication of surface acoustic wave based wireless NO2 gas sensor. Surf. Coat. Technol. 2018, 343, 89–92. [Google Scholar] [CrossRef]
- Ghosh, A.; Zhang, C.; Shi, S.; Zhang, H. High temperature CO2 sensing and its cross-sensitivity towards H2 and CO gas using calcium doped ZnO thin film coated langasite SAW sensor. Sens. Actuators B Chem. 2019, 301, 126958. [Google Scholar] [CrossRef]
- Sayago, I.; Matatagui, D.; Fernández, M.J.; Fontecha, J.L.; Jurewicz, I.; Garriga, R.; Muñoz, E. Graphene oxide as sensitive layer in Love-wave surface acoustic wave sensors for the detection of chemical warfare agent simulants. Talanta 2016, 148, 393–400. [Google Scholar] [CrossRef]
- Matatagui, D.; Fernández, M.; Fontecha, J.; Sayago, I.; Gràcia, I.; Cane, C.; Horrillo, C.; Santos, J. Characterization of an array of Love-wave gas sensors developed using electrospinning technique to deposit nanofibers as sensitive layers. Talanta 2014, 120, 408–412. [Google Scholar] [CrossRef]
- Fragoso-Mora, J.; Matatagui, D.; Bahos, F.; Fontecha, J.; Fernandez, M.; Santos, J.; Sayago, I.; Gràcia, I.; Horrillo, M. Gas sensors based on elasticity changes of nanoparticle layers. Sens. Actuators B Chem. 2018, 268, 93–99. [Google Scholar] [CrossRef]
- Matatagui, D.; Fernández, M.; Fontecha, J.; Santos, J.; Gràcia, I.; Cane, C.; Horrillo, C. Propagation of acoustic waves in metal oxide nanoparticle layers with catalytic metals for selective gas detection. Sens. Actuators B Chem. 2015, 217, 65–71. [Google Scholar] [CrossRef]
- Raj, V.B.; Nimal, A.T.; Parmar, Y.; Sharma, M.U.; Gupta, V. Investigations on the origin of mass and elastic loading in the time varying distinct response of ZnO SAW ammonia sensor. Sens. Actuators B Chem. 2012, 166, 576–585. [Google Scholar]
- Raj, V.B.; Singh, H.; Nimal, A.; Tomar, M.; Sharma, M.; Gupta, V. Effect of metal oxide sensing layers on the distinct detection of ammonia using surface acoustic wave (SAW) sensors. Sens. Actuators B Chem. 2013, 187, 563–573. [Google Scholar] [CrossRef]
- Matatagui, D.; Bahos, F.A.; Gràcia, I.; Horrillo, M.D.C. Portable Low-Cost Electronic Nose Based on Surface Acoustic Wave Sensors for the Detection of BTX Vapors in Air. Sensors 2019, 19, 5406. [Google Scholar] [CrossRef] [Green Version]
- Park, S.Y.; Kim, Y.; Kim, T.; Eom, T.H.; Kim, S.Y.; Jang, H.W. Chemoresistive materials for electronic nose: Progress, perspectives, and challenges. InfoMat 2019, 1, 289–316. [Google Scholar] [CrossRef] [Green Version]
- El Kazzy, M.; Weerakkody, J.S.; Hurot, C.; Mathey, R.; Buhot, A.; Scaramozzino, N.; Hou, Y. An overview of artificial olfaction systems with a focus on surface plasmon resonance for the analysis of volatile organic compounds. Biosensors 2021, 11, 244. [Google Scholar] [CrossRef]
- Raj, V.B.; Singh, H.; Nimal, A.T.; Sharma, M.U.; Tomar, M.; Gupta, V. Distinct detection of liquor ammonia by ZnO/SAW sensor: Study of complete sensing mechanism. Sens. Actuators B Chem. 2017, 238, 83–90. [Google Scholar] [CrossRef]
- Tang, Y.; Xu, X.; Han, S.; Cai, C.; Du, H.; Zhu, H.; Zu, X.; Fu, Y. ZnO-Al2O3 nanocomposite as a sensitive layer for high performance surface acoustic wave H2S gas sensor with enhanced elastic loading effect. Sens. Actuators B Chem. 2020, 304, 127395. [Google Scholar] [CrossRef]
- Cruz, C.; Palomar, E.; Bravo, I.; Aleixandre, M. Behavioural patterns in aggregated demand response developments for commu-nities targeting renewables. Sustain. Cities Soci. 2021, 72, 103001. [Google Scholar] [CrossRef]
- Marczyński, P.; Szpakowski, A.; Tyszkiewicz, C.; Pustelny, T. Pattern Recognition Applied to Analysis of Gas Sensors’ Array Data. Acta Phys. Pol. A 2012, 122, 847–849. [Google Scholar] [CrossRef]
- Jha, S.K.; Yadava, R.D.S. Preprocessing of SAW Sensor Array Data and Pattern Recognition. IEEE Sens. J. 2009, 9, 1202–1208. [Google Scholar] [CrossRef]
- Singh, H.; Raj, V.B.; Kumar, J.; Durani, F.; Mishra, M.; Nimal, A.T.; Sharma, M.U. SAW mono sen-sor for identification of harmful vapors using PCA and ANN. Process. Saf. Environ. Prot. 2016, 102, 577–588. [Google Scholar] [CrossRef]
- García, M.; Fernández, M.; Fontecha, J.; Lozano, J.; Santos, J.; Aleixandre, M.; Sayago, I.; Gutiérrez, J.; Horrillo, M. Differentiation of red wines using an electronic nose based on surface acoustic wave devices. Talanta 2006, 68, 1162–1165. [Google Scholar] [CrossRef] [PubMed]
- Herrera-Chacon, A.; Campos, I.; González-Calabuig, A.; Torres, M.; del Valle, M. Coupling of Sensors and Machine Learning Algorithms in the Qualitative Analysis of Wine. Eng. Proc. 2021, 6, 50. [Google Scholar] [CrossRef]
- Ciosek, P.; Wróblewski, W. The analysis of sensor array data with various pattern recognition techniques. Sens. Actuators B Chem. 2006, 114, 85–93. [Google Scholar] [CrossRef]
- Zhang, W.; Tian, F.; Song, A.; Hu, Y. Research on electronic nose system based on continuous wide spectral gas sensing. Microchem. J. 2018, 140, 1–7. [Google Scholar] [CrossRef]
- Dang, L.; Tian, F.; Zhang, L.; Kadri, C.; Yin, X.; Peng, X.; Liu, S. A novel classifier ensemble for recognition of multiple indoor air contaminants by an electronic nose. Sens. Actuators A Phys. 2014, 207, 67–74. [Google Scholar] [CrossRef]
- Sisk, B.C.; Lewis, N.S. Estimation of chemical and physical characteristics of analyte vapors through analysis of the response data of arrays of polymer-carbon black composite vapor detectors. Sens. Actuators B Chem. 2003, 96, 268–282. [Google Scholar] [CrossRef]
- Feng, S.; Farha, F.; Li, Q.; Wan, Y.; Xu, Y.; Zhang, T.; Ning, H. Review on Smart Gas Sensing Technology. Sensors 2019, 19, 3760. [Google Scholar] [CrossRef] [Green Version]
- Al-Dayyeni, W.S.; Al-Yousif, S.; Taher, M.M.; Al-Faouri, A.W.; Tahir, N.M.; Jaber, M.M.; Ghabban, F.; Najm, I.A.; Alfadli, I.M.; Ameerbakhsh, O.Z.; et al. A Review on Electronic Nose: Coherent Taxonomy, Classification, Motivations, Challenges, Recommendations and Datasets. IEEE Access 2021, 9, 88535–88551. [Google Scholar] [CrossRef]
- Gutiérrez, J.; Horrillo, M.C. Advances in artificial olfaction. Sens. Appl. Talanta 2014, 124, 95–105. [Google Scholar] [CrossRef] [PubMed]
- de la O-Cuevas, E.; Alvarez-Venicio, V.; Badillo-Ramírez, I.; Islas, S.R.; Carreón-Castro, M.D.P.; Saniger, J.M. Graphenic substrates as modifiers of the emission and vibrational responses of interacting molecules: The case of BODIPY dyes. Spectrochim. Acta Part A Mol. Biomol. Spectrosc. 2020, 246, 119020. [Google Scholar] [CrossRef] [PubMed]
- Lu, G.; Ocola, L.E.; Chen, J. Reduced graphene oxide for room-temperature gas sen-sors. Nanotechnology 2009, 20, 445502. [Google Scholar] [CrossRef] [PubMed]
- Zhang, D.; Song, X.; Wang, Z.; Chen, H. Ultra-highly sensitive humidity sensing by polydopa-mine/graphene oxide nanostructure on quartz crystal microbalance. Appl. Surface Sci. 2021, 538, 147816. [Google Scholar] [CrossRef]
- Hallil, H.; Zhang, Q.; Flahaut, E.; Lachaud, J.-L.; Coquet, P.; Dejous, C.; Rebière, D. Guided SH-SAW sensor based on DWNTs sensitive material for VOCs and humidity detection. J. Integr. Circuits Syst. 2018, 13, 1–4. [Google Scholar] [CrossRef]


| Precision | Sensitivity | F1-Score | |
|---|---|---|---|
| Humidity | 1 | 0.94 | 0.97 |
| Interferents | 0.67 | 1 | 0.8 |
| NO2 | 1 | 1 | 1 |
| Accuracy | 0.95% |
| Sensitive Layer | Target Gas | Operating Frequency | Sensitivity | Detected ppm | Response Time | Detection Mechanics | Reference |
|---|---|---|---|---|---|---|---|
| SnO2 | NO2 | 433.9 Mhz | - | 20 ppm | 2 s | Elastic loading | [13] |
| ZnO | NO2 | 99.5 Mhz | 2.9 Hz/ppb | 400 ppb–16 ppm | - | Mass loading | [14] |
| PPy/WO/rGO | NO | 98 Hhz | 12 Hz/ppb | 5–110 ppb | <2min | Mass loading | [15] |
| PZT | NO2 | 99.4 Mhz | 9.6 Hz/ppm | 80–250 ppm | - | Mass loading | [16] |
| MC rGO GO PDA/rGO | NO2 | 160 Mhz | 10 Hz/ppb 7.5 Hz/ppb 75 Hz/ppb 30 Hz/ppb | 0.1–1 ppm | <1min | Mass loading Elastic loading Elastic loading Mass loading | This work |
Publisher’s Note: MDPI stays neutral with regard to jurisdictional claims in published maps and institutional affiliations. |
© 2022 by the authors. Licensee MDPI, Basel, Switzerland. This article is an open access article distributed under the terms and conditions of the Creative Commons Attribution (CC BY) license (https://creativecommons.org/licenses/by/4.0/).
Share and Cite
Cruz, C.; Matatagui, D.; Ramírez, C.; Badillo-Ramirez, I.; de la O-Cuevas, E.; Saniger, J.M.; Horrillo, M.C. Carbon SH-SAW-Based Electronic Nose to Discriminate and Classify Sub-ppm NO2. Sensors 2022, 22, 1261. https://doi.org/10.3390/s22031261
Cruz C, Matatagui D, Ramírez C, Badillo-Ramirez I, de la O-Cuevas E, Saniger JM, Horrillo MC. Carbon SH-SAW-Based Electronic Nose to Discriminate and Classify Sub-ppm NO2. Sensors. 2022; 22(3):1261. https://doi.org/10.3390/s22031261
Chicago/Turabian StyleCruz, Carlos, Daniel Matatagui, Cristina Ramírez, Isidro Badillo-Ramirez, Emmanuel de la O-Cuevas, José M. Saniger, and Mari Carmen Horrillo. 2022. "Carbon SH-SAW-Based Electronic Nose to Discriminate and Classify Sub-ppm NO2" Sensors 22, no. 3: 1261. https://doi.org/10.3390/s22031261