Author Contributions
Conceptualization, F.H., F.U. and O.P.; methodology, F.H., F.U. and O.P.; software, F.H., F.U. and O.P.; validation, F.H., F.U. and O.P.; formal analysis, F.H., F.U. and O.P.; investigation, F.H., F.U. and O.P.; resources, F.H., F.U. and O.P.; data curation, F.H., F.U. and O.P.; writing—original draft preparation, F.H., F.U. and O.P.; writing—review and editing, F.H., F.U., O.P., M.Ç., T.T., N.T., U.K., B.D. and F.M.; visualization, F.H., F.U. and O.P.; supervision, F.H., F.U. and O.P. All authors have read and agreed to the published version of the manuscript.
Figure 1.
The anatomy of the wrist.
Figure 1.
The anatomy of the wrist.
Figure 2.
Deep-learning based detection models using transfer learning.
Figure 2.
Deep-learning based detection models using transfer learning.
Figure 3.
Single-stage object detectors (RetinaNet, FSAF, etc.).
Figure 3.
Single-stage object detectors (RetinaNet, FSAF, etc.).
Figure 4.
Two-stage object detectors (Dynamic R-CNN, Faster R-CNN, etc.).
Figure 4.
Two-stage object detectors (Dynamic R-CNN, Faster R-CNN, etc.).
Figure 5.
PAA and Dynamic R-CNN bbox numbers according to different threshold values.
Figure 5.
PAA and Dynamic R-CNN bbox numbers according to different threshold values.
Figure 6.
Weight boxes fusion ensemble.
Figure 6.
Weight boxes fusion ensemble.
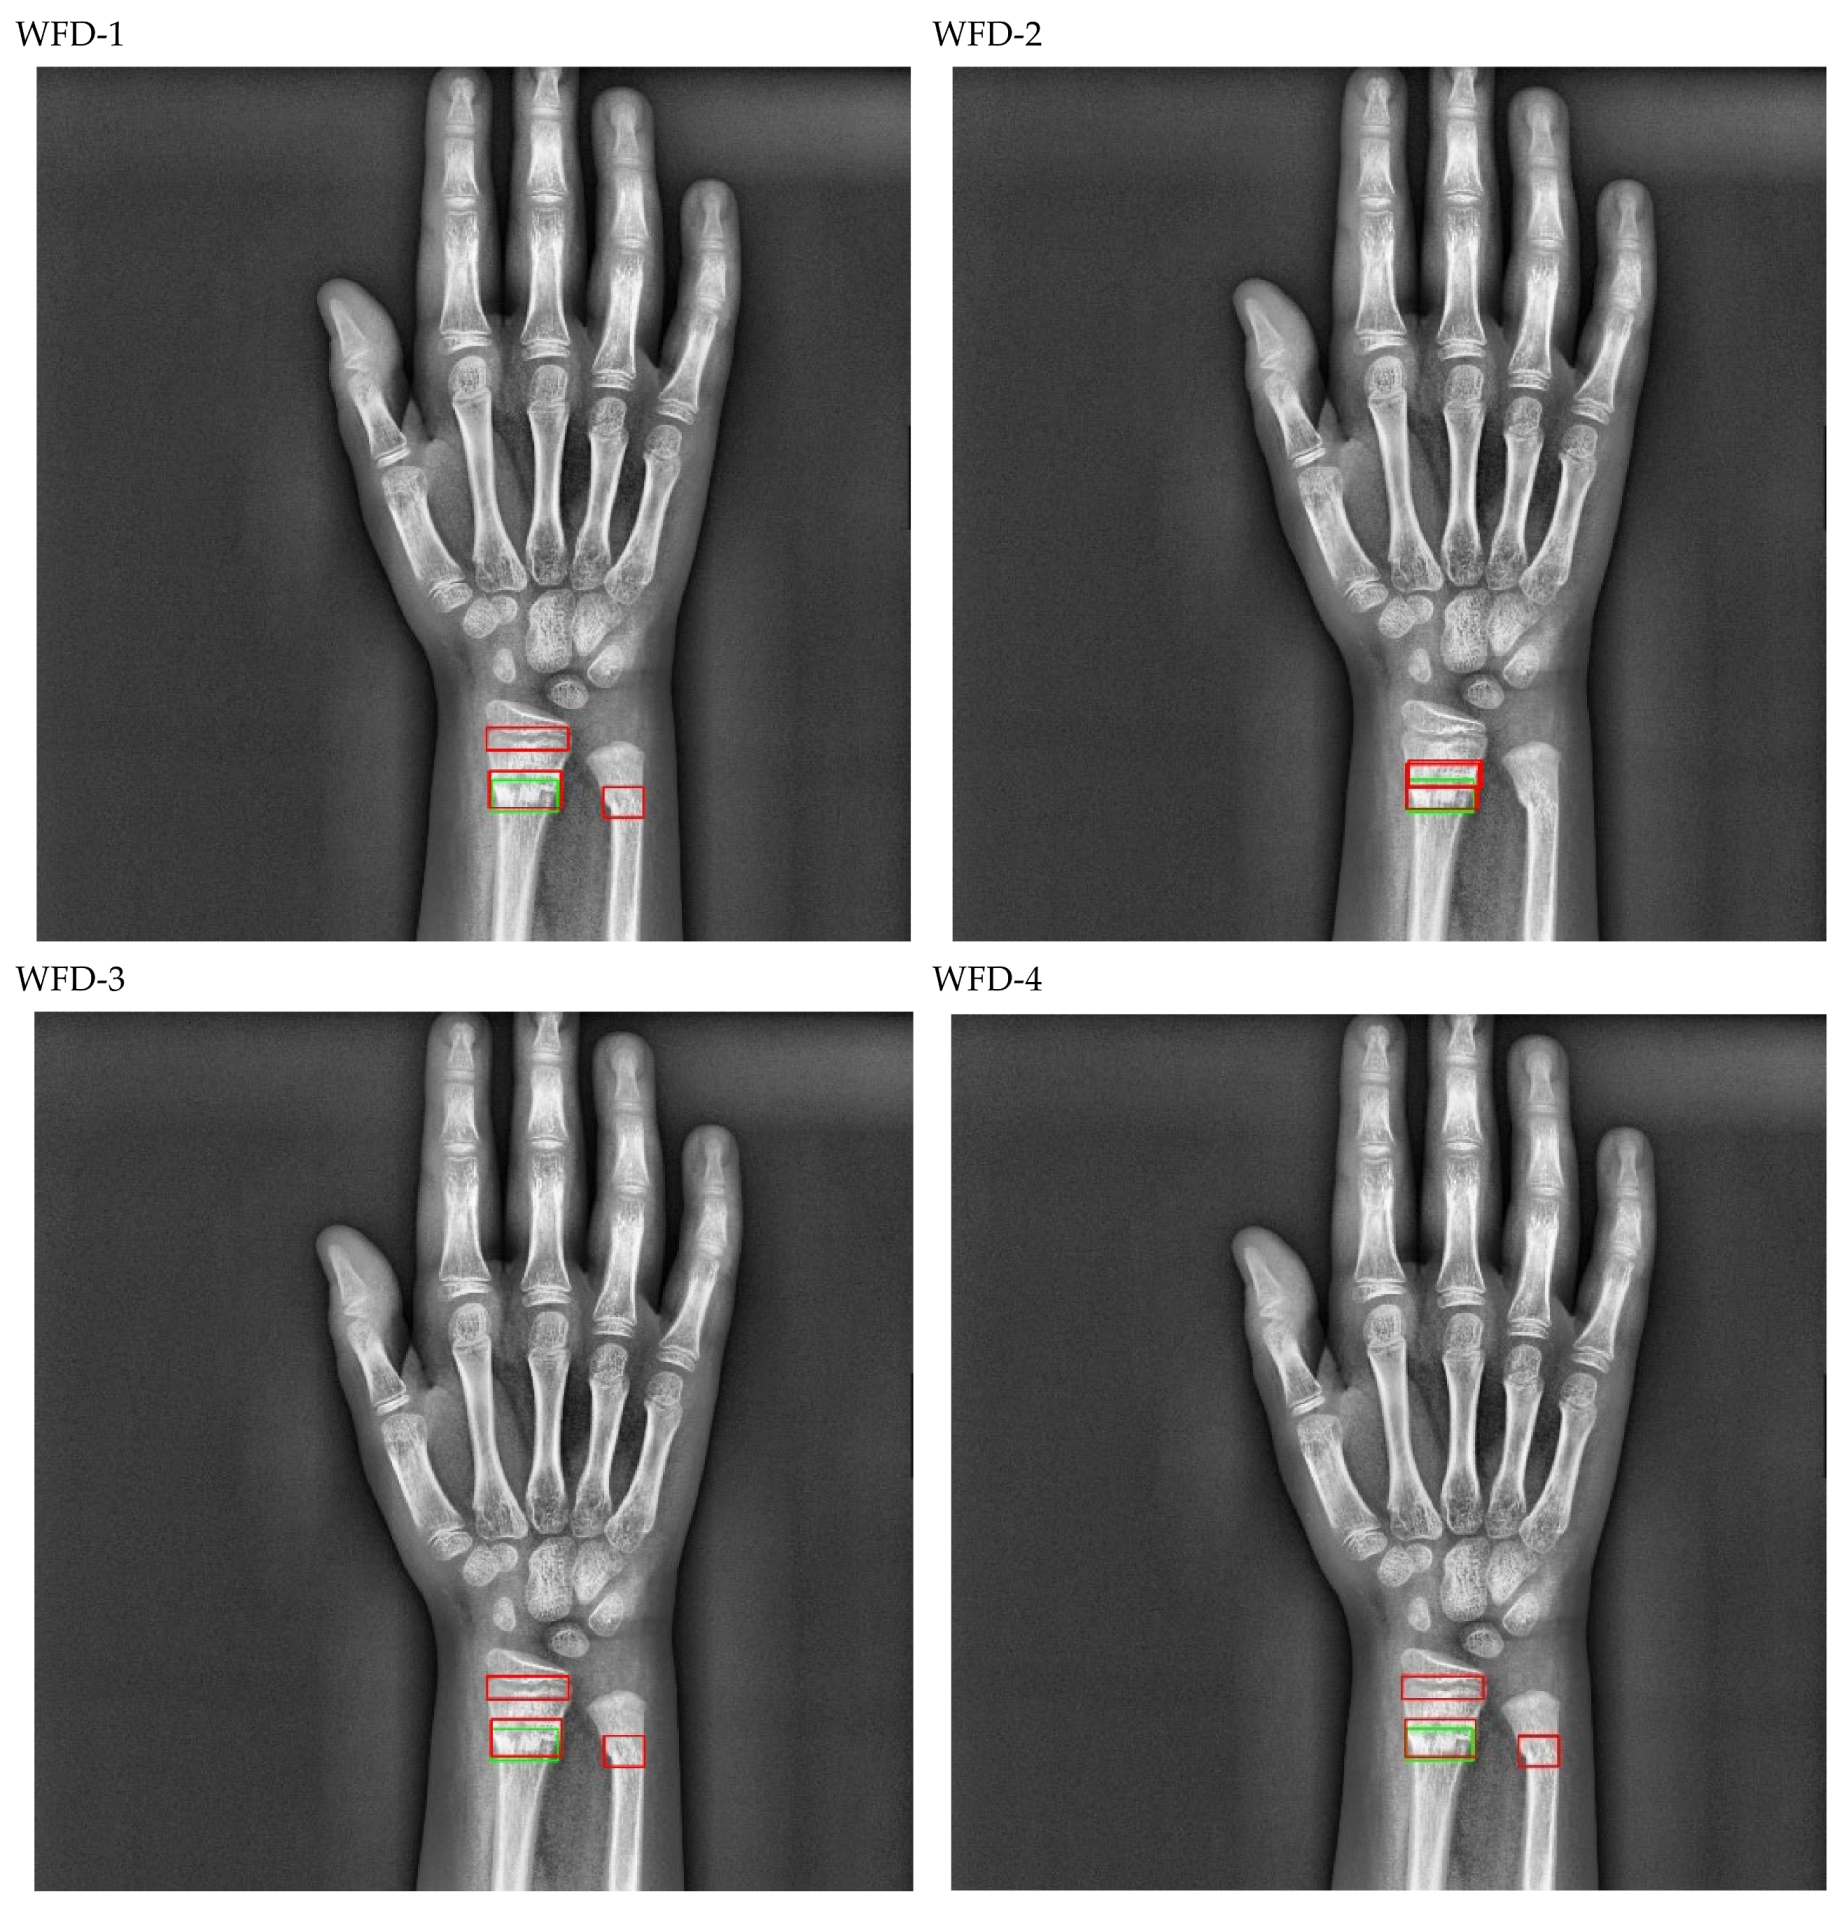
Figure 7.
WFD ensemble models based on weight boxes fusion.
Figure 7.
WFD ensemble models based on weight boxes fusion.
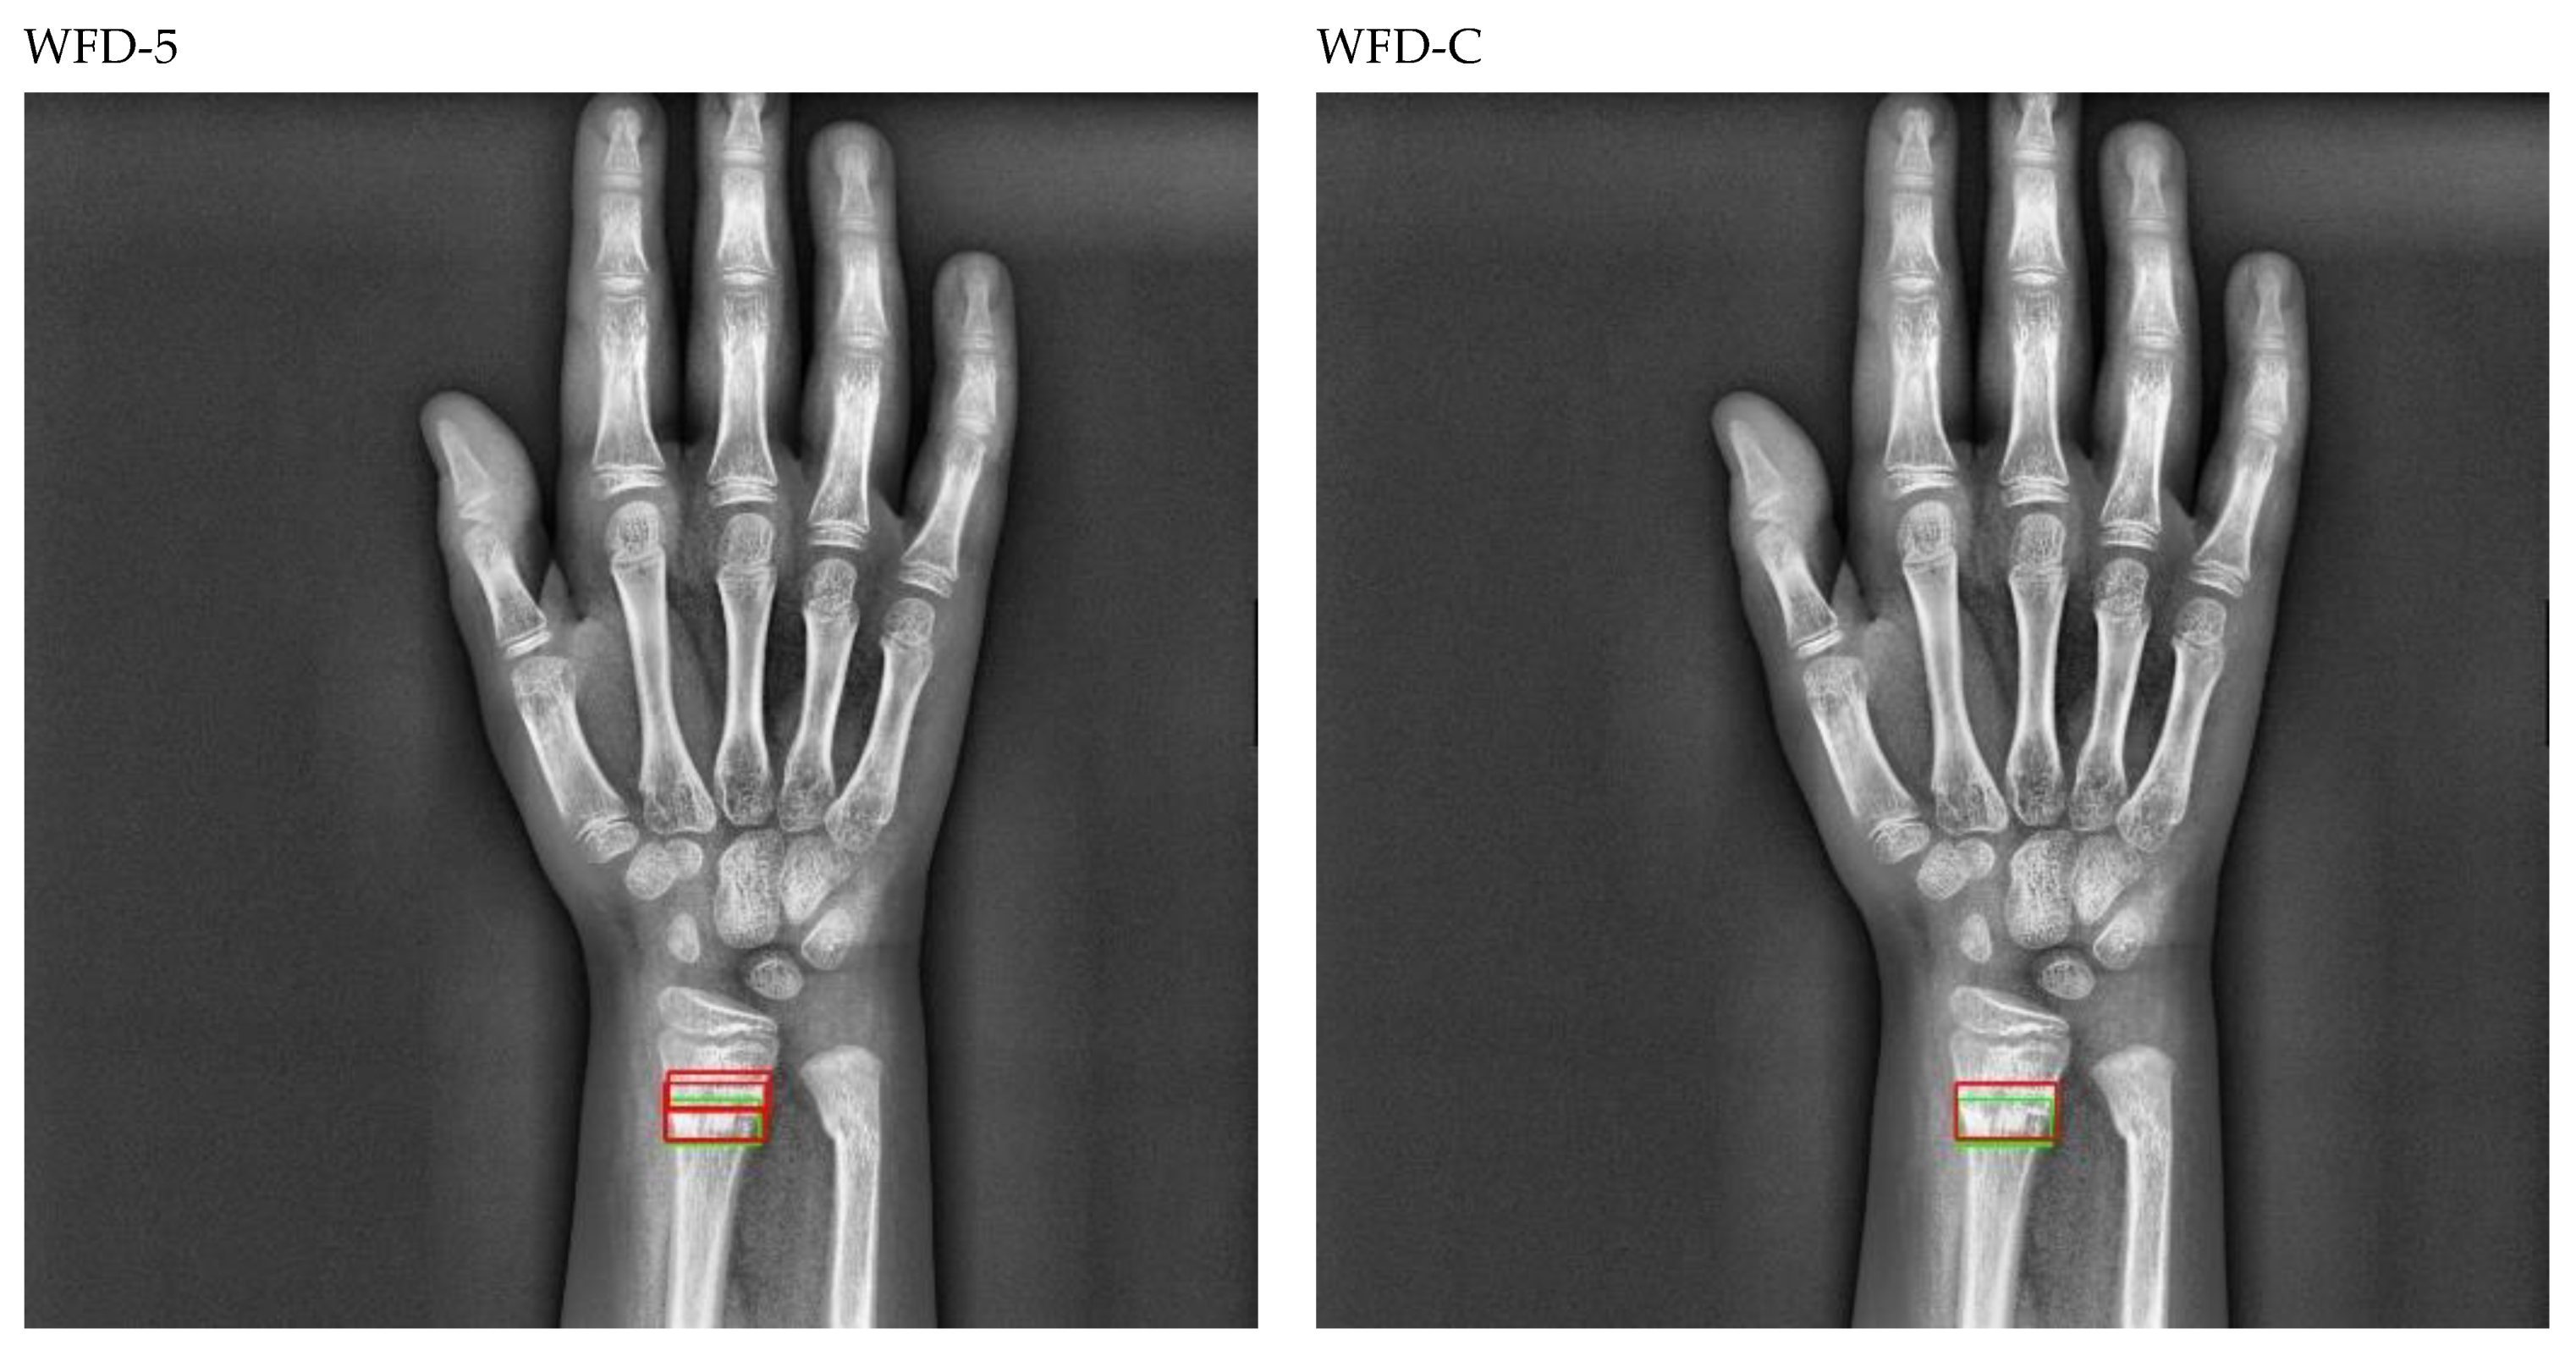
Figure 8.
Proposed WFD-C ensemble models based on weight boxes fusion.
Figure 8.
Proposed WFD-C ensemble models based on weight boxes fusion.
Figure 9.
The proposed models for fracture detection of wrist X-ray images.
Figure 9.
The proposed models for fracture detection of wrist X-ray images.
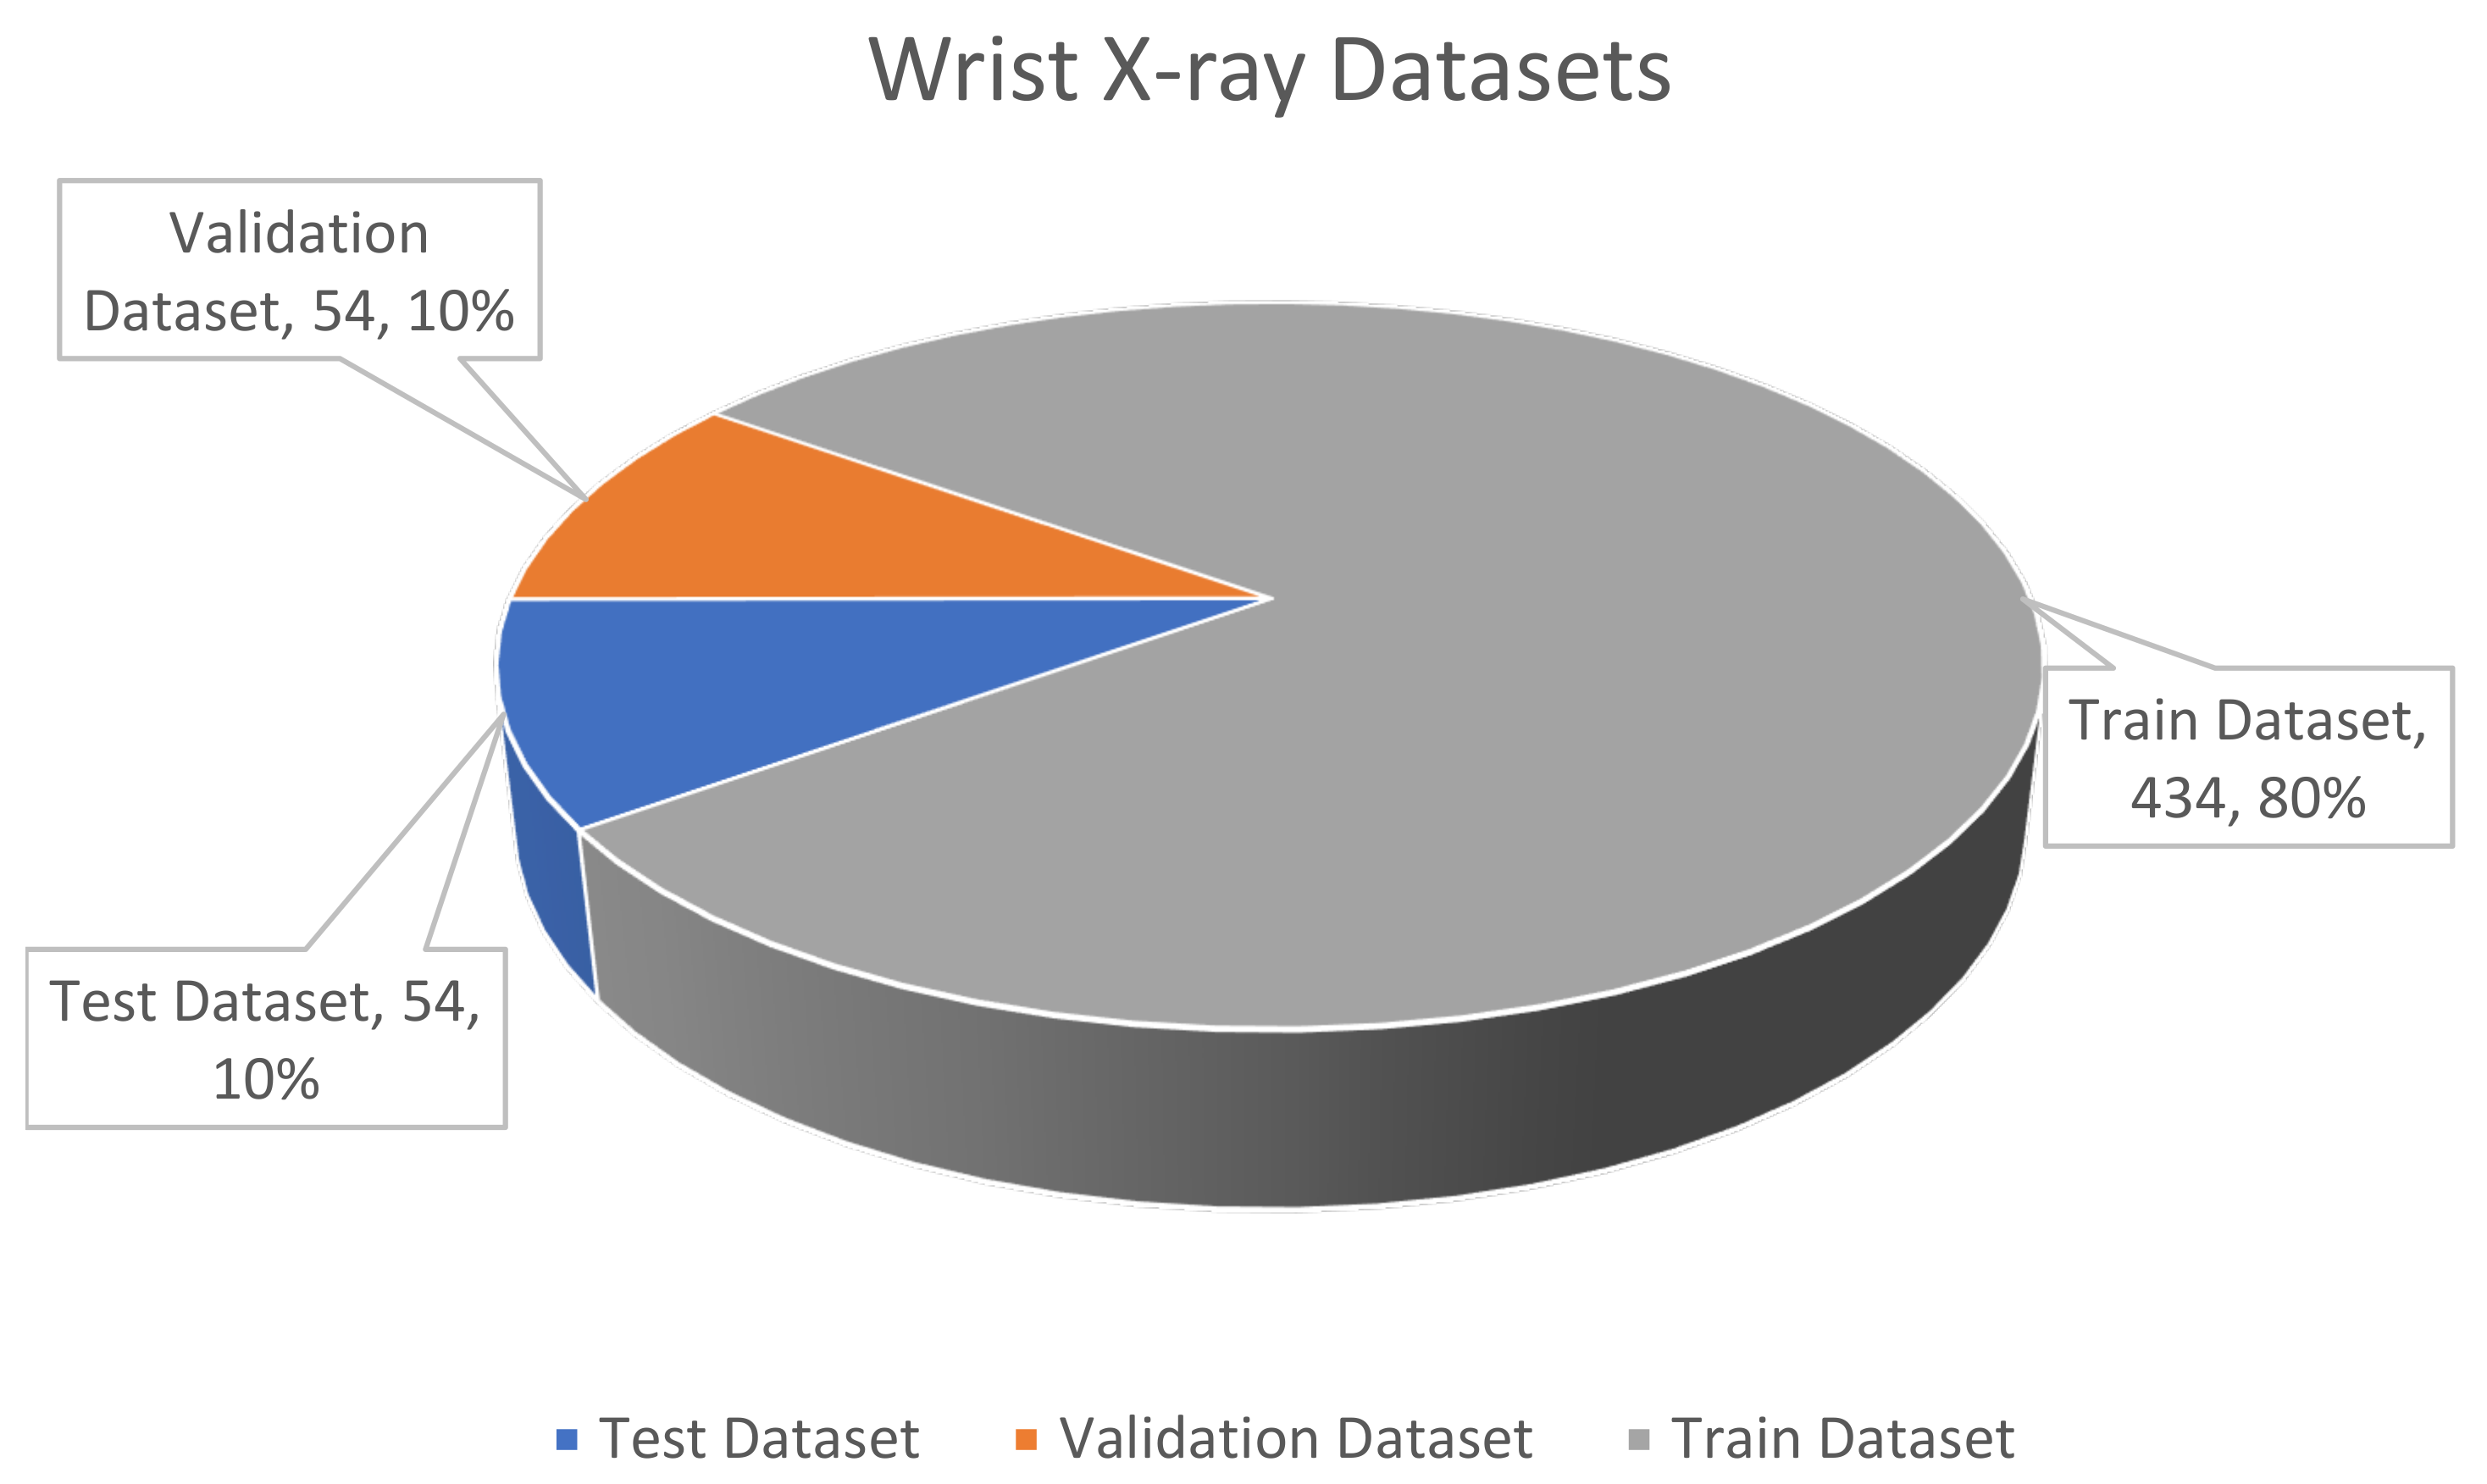
Figure 10.
The wrist X-ray dataset.
Figure 10.
The wrist X-ray dataset.
Figure 11.
The wrist X-ray images after data preprocessing.
Figure 11.
The wrist X-ray images after data preprocessing.
Figure 12.
The wrist X-ray images after data augmentation.
Figure 12.
The wrist X-ray images after data augmentation.
Figure 13.
Validation AP50 and AR results of detection models.
Figure 13.
Validation AP50 and AR results of detection models.
Figure 14.
Validation LRP-optimal threshold (LRPt), oLRPLoc (oLRPL), oLRPFP and oLRPFN results of detection models. (* with Aug.).
Figure 14.
Validation LRP-optimal threshold (LRPt), oLRPLoc (oLRPL), oLRPFP and oLRPFN results of detection models. (* with Aug.).
Figure 15.
Test AP50 and AR results of detection models.
Figure 15.
Test AP50 and AR results of detection models.
Figure 16.
Test LRP-optimal threshold (LRPt), oLRPLoc (oLRPL), oLRPFP and oLRPFN results of detection models. (* with Aug.).
Figure 16.
Test LRP-optimal threshold (LRPt), oLRPLoc (oLRPL), oLRPFP and oLRPFN results of detection models. (* with Aug.).
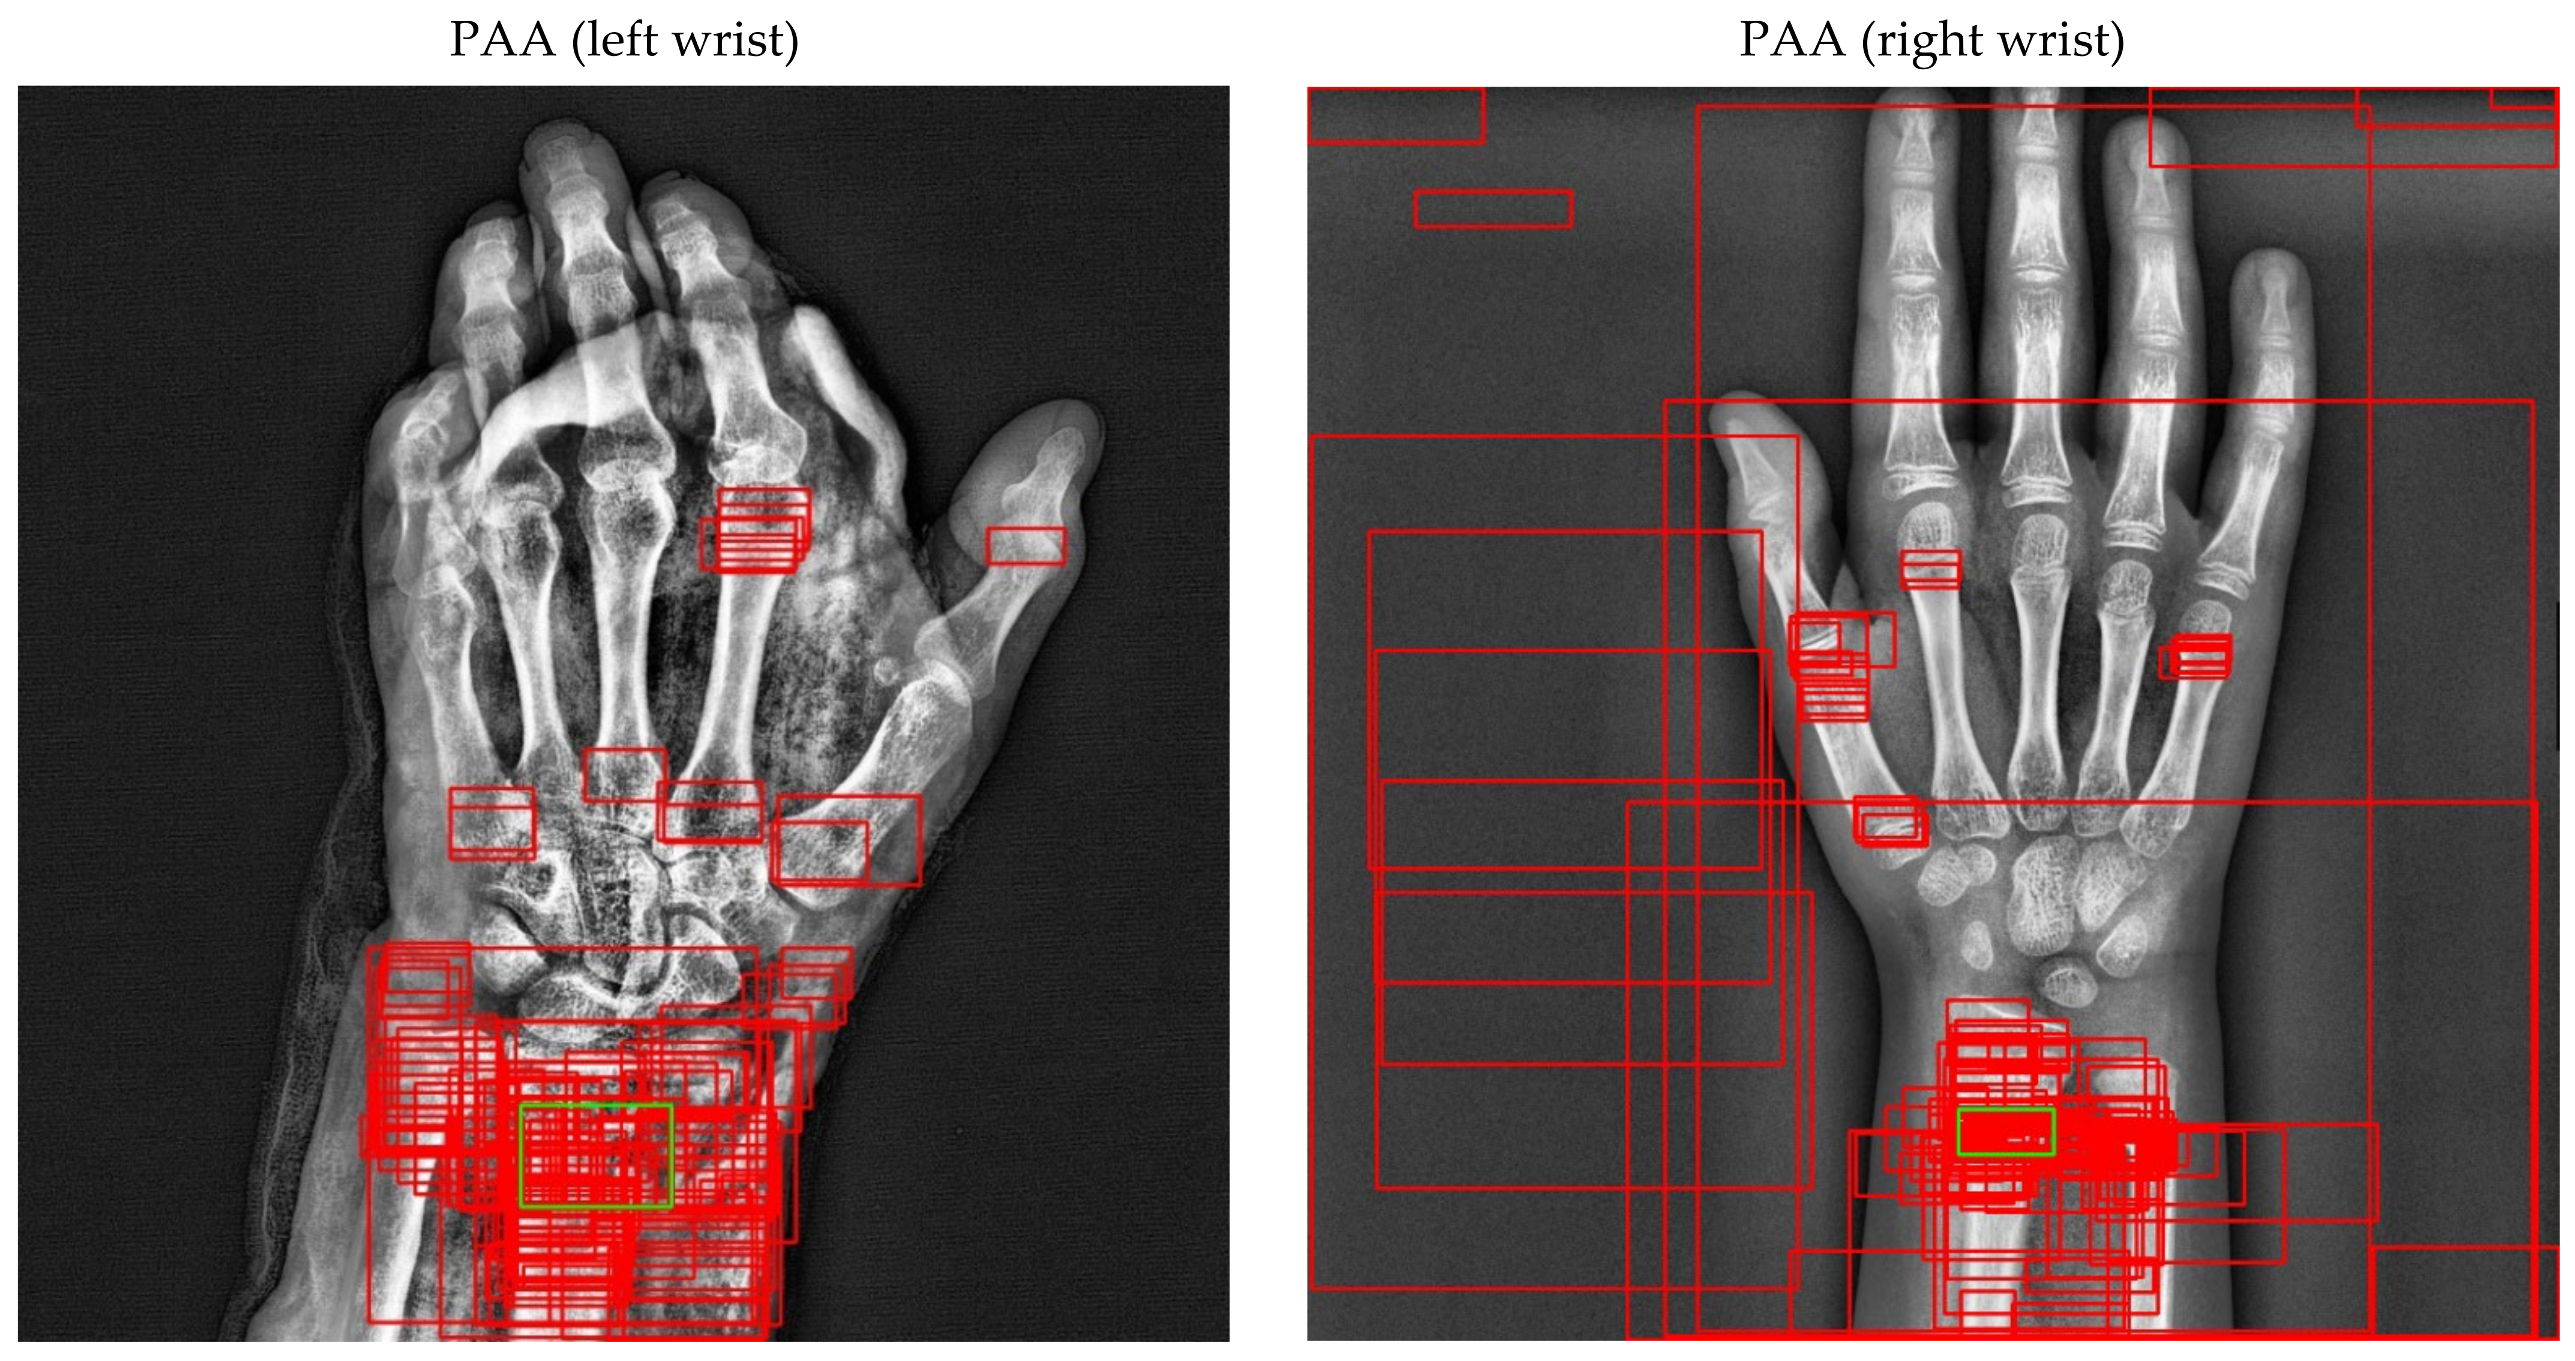
Figure 17.
Sample of left/right wrist fracture results [ground-truth bounding box (green), predicted bounding box (red)] for PAA (Best score of 20 models).
Figure 17.
Sample of left/right wrist fracture results [ground-truth bounding box (green), predicted bounding box (red)] for PAA (Best score of 20 models).
Figure 18.
Precision-recall curve of PAA (best score of 20 models).
Figure 18.
Precision-recall curve of PAA (best score of 20 models).
Figure 19.
Results (AP50, AR, LRP-optimal threshold (LRPt), oLRPLoc (oLRPL), oLRPFP and oLRPFN) of Ensemble Model (WFD-1, WFD-2, WFD-3, WFD-4, WFD-5, WFD-C).
Figure 19.
Results (AP50, AR, LRP-optimal threshold (LRPt), oLRPLoc (oLRPL), oLRPFP and oLRPFN) of Ensemble Model (WFD-1, WFD-2, WFD-3, WFD-4, WFD-5, WFD-C).
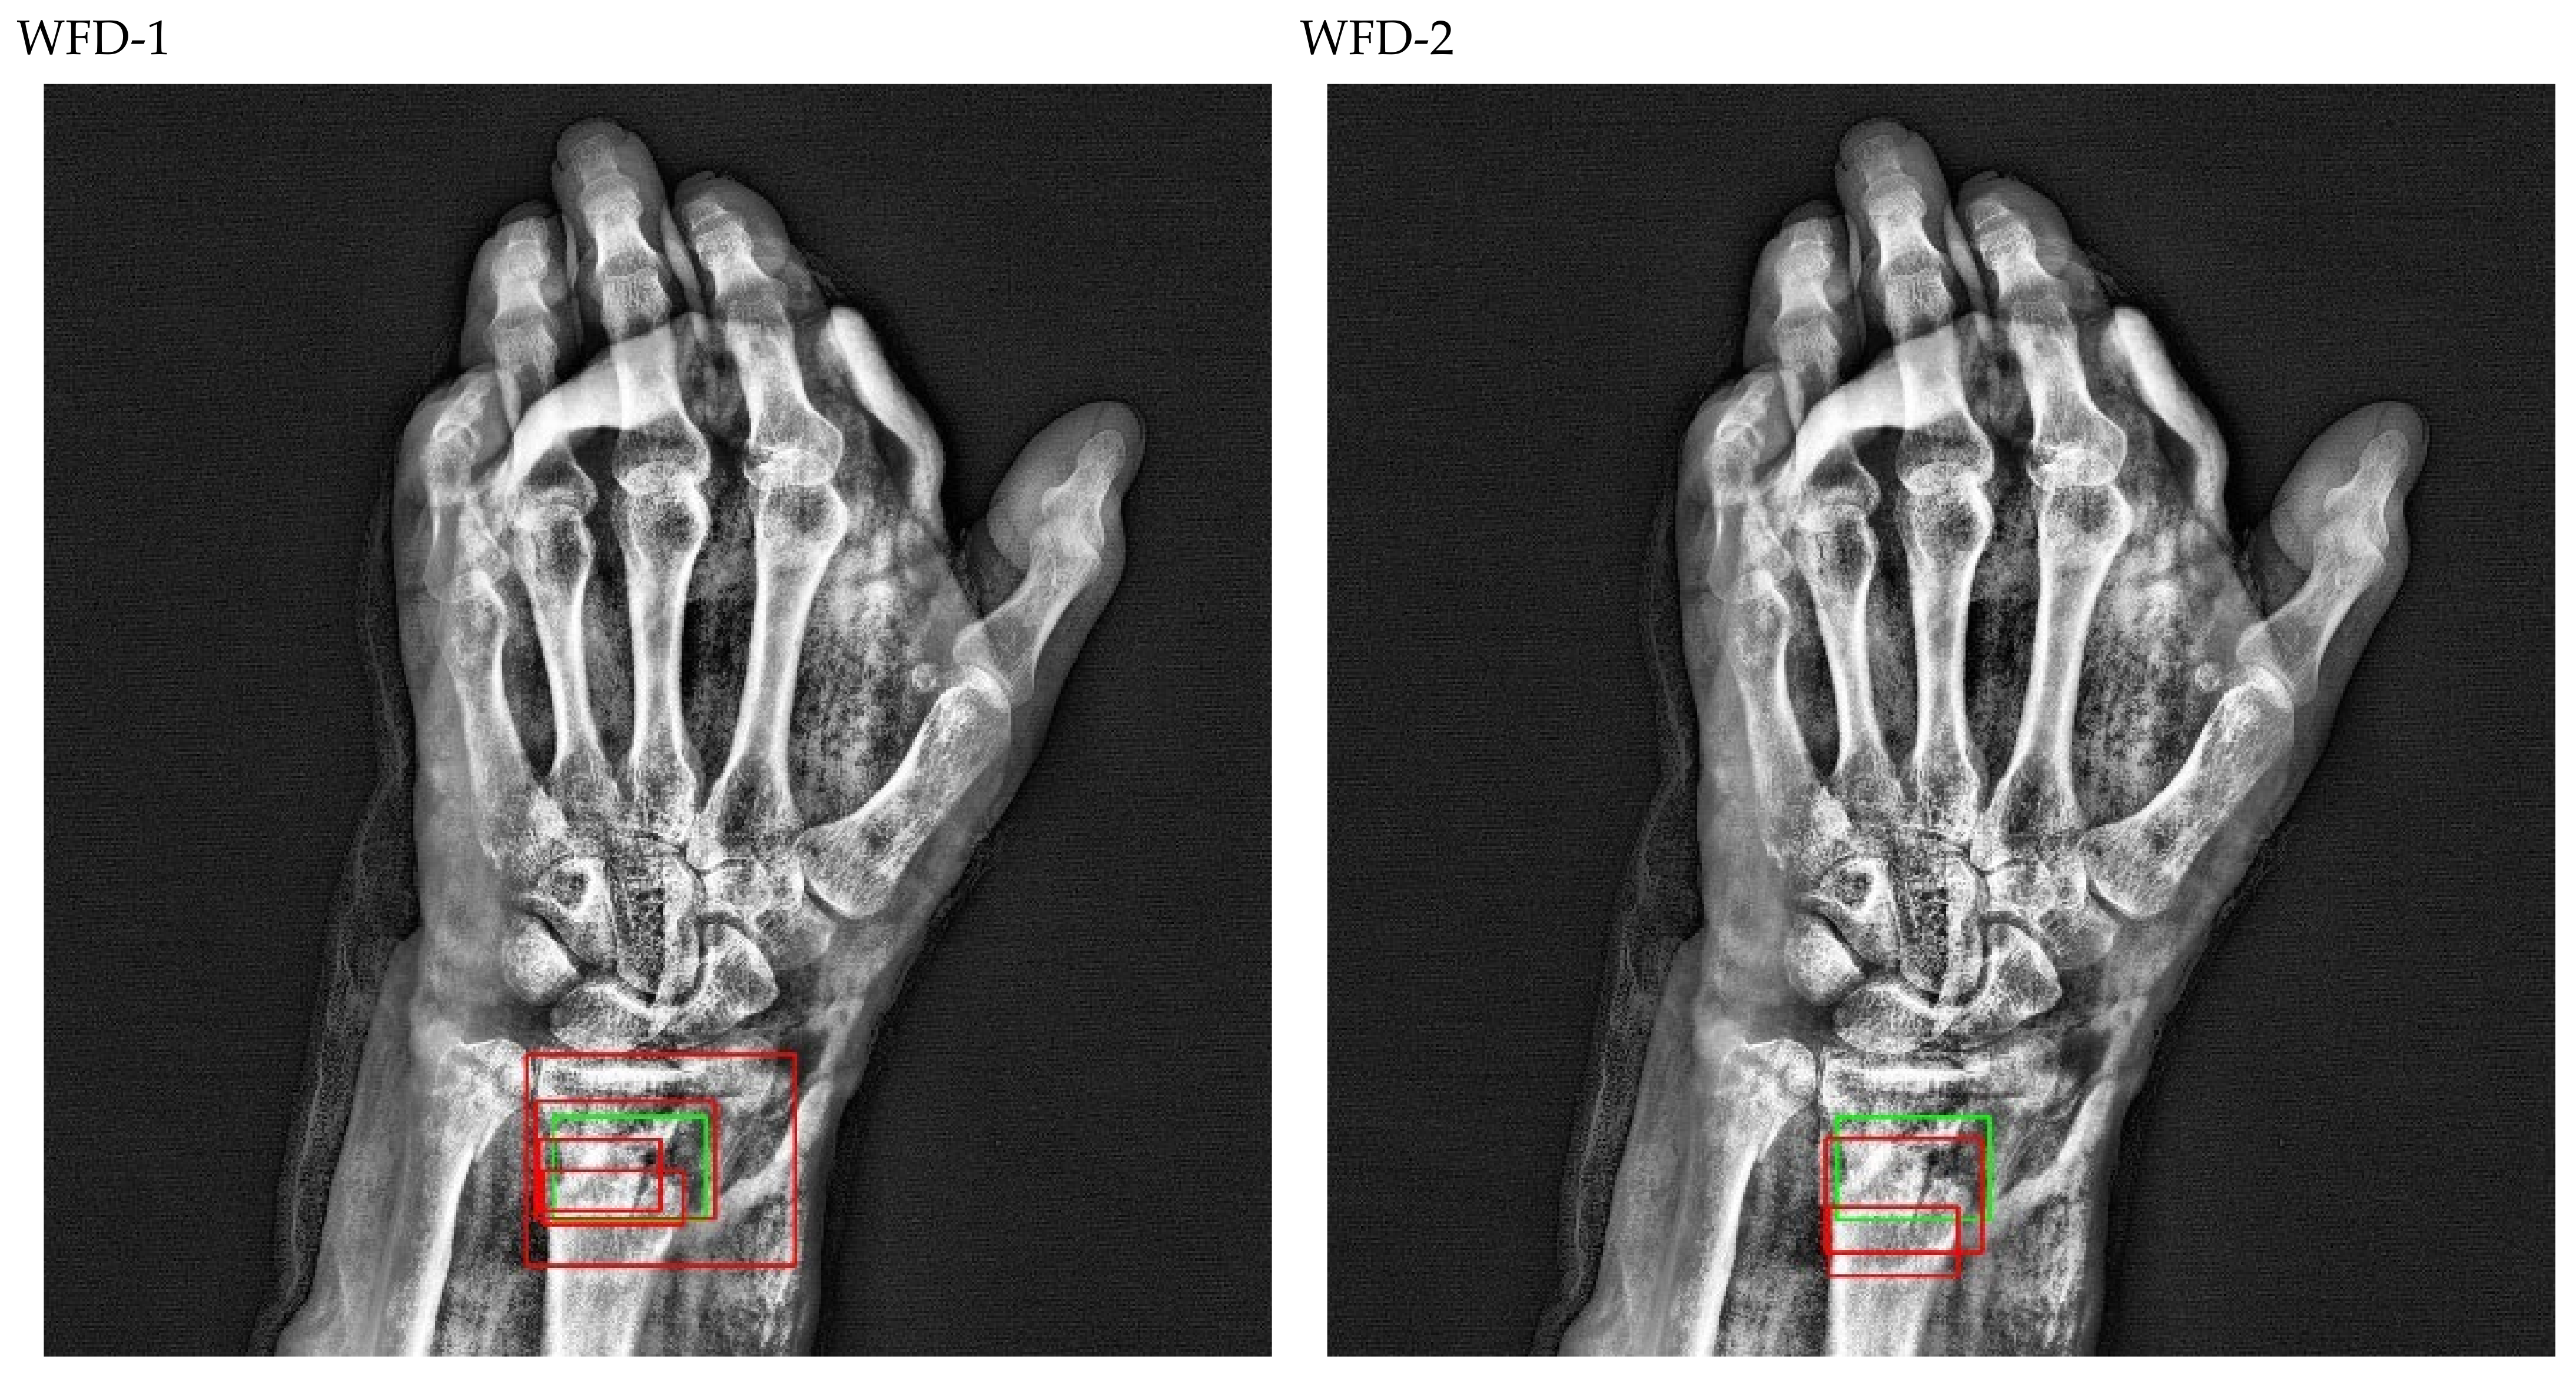
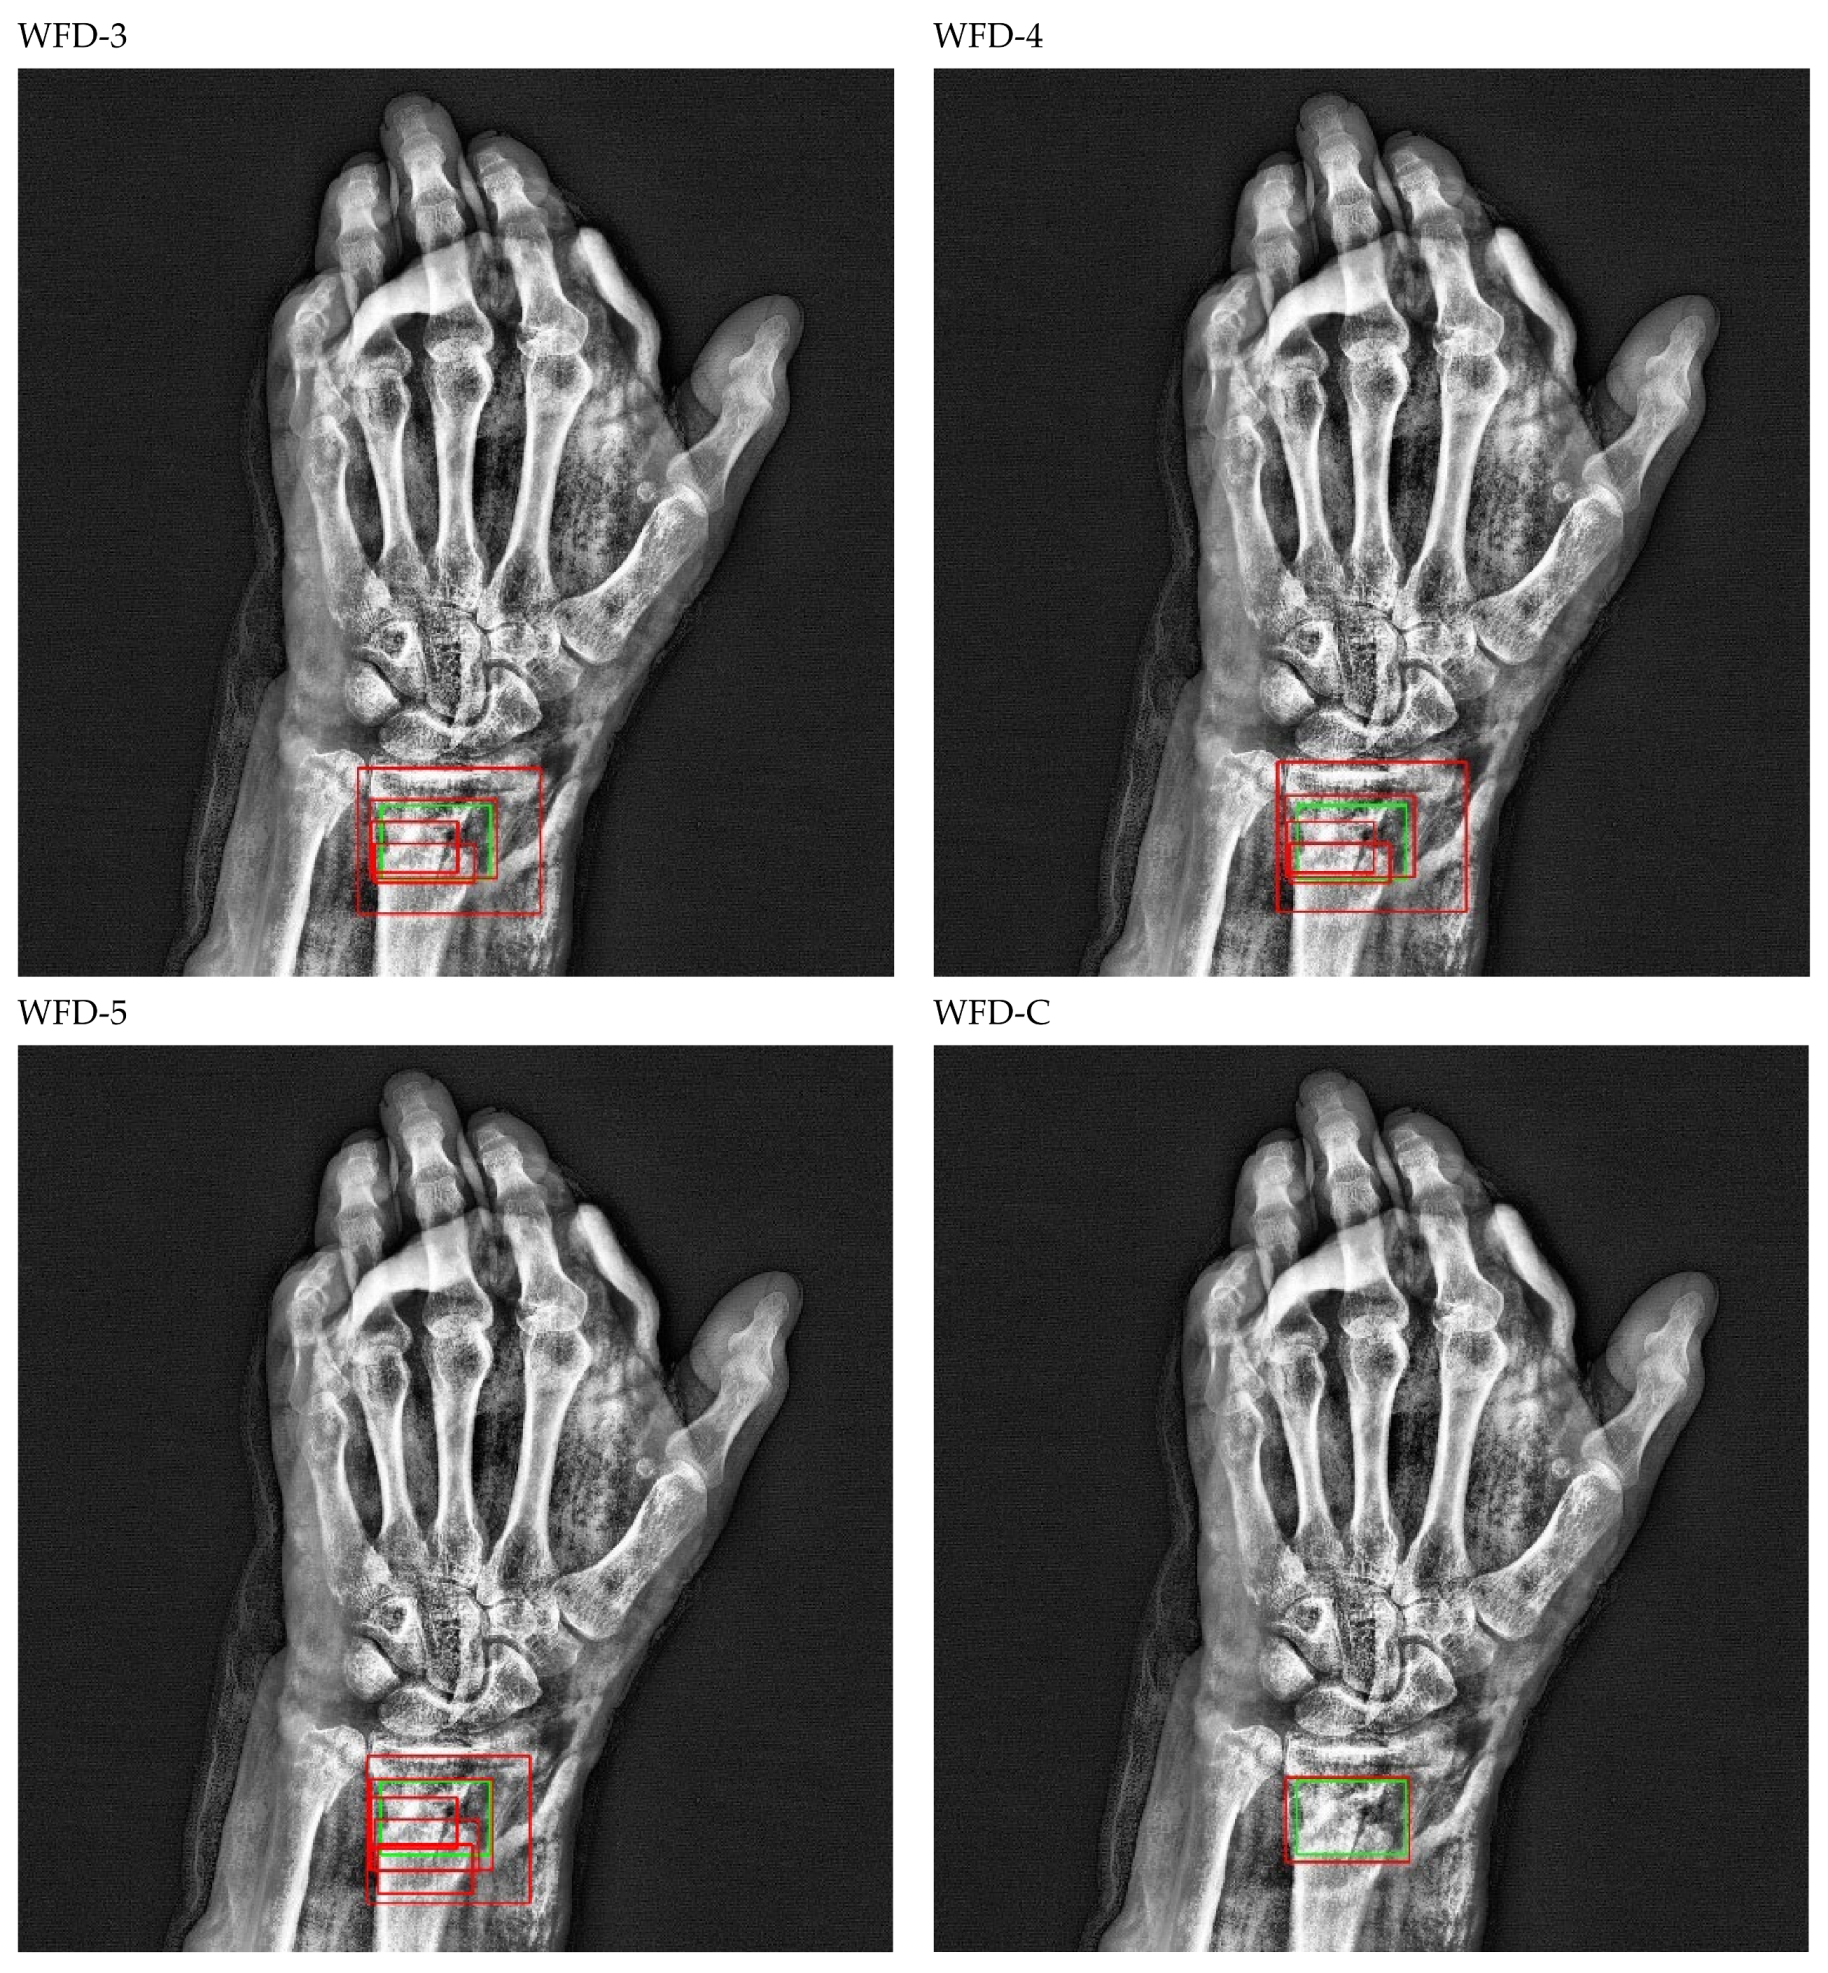
Figure 20.
Sample of right wrist fracture results [ground-truth bounding box (green), predicted bounding box (red)].
Figure 20.
Sample of right wrist fracture results [ground-truth bounding box (green), predicted bounding box (red)].
Figure 21.
Sample of left wrist fracture results [ground-truth bounding box (green), predicted bounding box (red)].
Figure 21.
Sample of left wrist fracture results [ground-truth bounding box (green), predicted bounding box (red)].
Figure 22.
Count of predicted bounding box.
Figure 22.
Count of predicted bounding box.
Figure 23.
Precision-recall curve of WFD-C (best score of ensemble models).
Figure 23.
Precision-recall curve of WFD-C (best score of ensemble models).
Table 1.
PAA and Dynamic R-CNN bbox numbers according to different threshold values.
Table 1.
PAA and Dynamic R-CNN bbox numbers according to different threshold values.
| Threshold Value | PAA Bbox | Dynamic R-CNN Bbox |
|---|
| 0.1 | 4317 | 291 |
| 0.2 | 1098 | 176 |
| 0.3 | 415 | 124 |
| 0.4 | 159 | 97 |
| 0.5 | 75 | 79 |
| 0.6 | 36 | 71 |
| 0.7 | 4 | 65 |
| 0.8 | 0 | 57 |
| 0.9 | 0 | 48 |
Table 2.
Submodels and weight coefficients of WFD ensemble models.
Table 2.
Submodels and weight coefficients of WFD ensemble models.
| Ensemble Models | Model-1 | Model-2 | Model-3 | Model-4 | Model-5 | Weight Coefficients |
|---|
| WFD-1 (single stage) | RegNet | FSAF | RetinaNet | SABL Rt.Net | PAA | (1, 5, 5, 5, 5) |
| WFD-2 (two stage) | DCN | SABL Fs. R-CNN | - | - | - | (2, 2) |
| WFD-3 (AP50) | RegNet | PAA | FSAF | Libra Rt.Net | - | (3, 3, 3, 4) |
| WFD-4 (AR) | RegNet | PAA | FSAF | SABL Rt.Net | - | (1, 3, 3, 1) |
| WFD-5 (LRP-opt.) | FSAF | Fs. R-CNN | DCN | Libra Rt.Net | RetinaNet | (2, 1, 4, 2, 3) |
| WFD-C (combo) | WFD-1 | WFD-3 | WFD-4 | WFD-5 | WFD-2 | (4, 4, 3, 5, 5) |
Table 3.
Details of wrist fracture dataset.
Table 3.
Details of wrist fracture dataset.
| X-ray Device | Samsung GC70 | Time Period of Collection | 2010–2020 |
|---|
| X-ray images and total fractures | 542, 569 | Specialist physicians | 1 radiologist, 2 orthopedists |
| Dataset (train, validation, test) | %80, %10, %10 | Fracture types | radius and ulna |
| Training data and fractures | 434, 459 | Patients (female, male, total) | 134, 141, 275 |
| Validation data and fractures | 54, 55 | Average age, pediatrics, adult | 45, 21, 254 |
| Test data and fractures | 54, 56 | Patients with fractures in both wrists (train, validation, test, total) | 10, 0, 1, 11 |
Table 4.
Evaluation metrics definition and calculations.
Table 4.
Evaluation metrics definition and calculations.
| Evaluation Metrics | Definition and Calculations |
|---|
| Intersection over Union (IOU) | area (BBoxp ∩ Bboxg)/area (BBoxp U Bboxg) |
| True Positive (TP) | IUO ≥ 0.5 |
| False Positive (FP) | IUO < 0.5 |
| False Negative (FN) | failing to detect Bboxg |
| True Negative (TN) | can’t be used (infinite) |
| Precision (P) | TP/(TP + FP) = TP/all detections |
| Recall (R) | TP/(TP + FN) = TP/all ground truths |
| Average Precision (AP) | under area of P-R curve |
| Average Recall (AR) | twice the under area of R-IOU curve |
| Optimal Localization Recall Precision (oLRP) | minimum achievable average matching error over the confidence scores |
Table 5.
Training loss and epoch results for the highest validation AP50 in detection models.
Table 5.
Training loss and epoch results for the highest validation AP50 in detection models.
| Models | Without Augmentation | With Augmentation |
|---|
| TB_Loss | T_Loss | TT | Best Epoch | TB_Loss | T_Loss | TT | Best Epoch |
|---|
| DCN Faster R-CNN | 0.0938 | 0.1821 | 174 | 6 | 0.0969 | 0.1839 | 174 | 5 |
| Dynamic R-CNN | 0.2978 | 0.5033 | 139 | 8 | 0.2664 | 0.4605 | 156 | 10 |
| Faster R-CNN | 0.0873 | 0.1573 | 126 | 10 | 0.0864 | 0.1634 | 137 | 12 |
| FSAF | 0.3142 | 0.5419 | 130 | 7 | 0.2605 | 0.4718 | 128 | 8 |
| RetinaNet | 0.3103 | 0.4987 | 120 | 16 | 0.348 | 0.576 | 120 | 8 |
| Libra RetinaNet | 0.5033 | 0.7278 | 131 | 8 | 0.5374 | 0.7813 | 130 | 6 |
| PAA | 0.3256 | 0.8387 | 127 | 6 | 0.33 | 0.834 | 104 | 7 |
| RegNet RetinaNet | 0.315 | 0.543 | 256 | 8 | 0.313 | 0.539 | 225 | 7 |
| SABL Faster R-CNN | 0.0536 | 0.2244 | 243 | 8 | 0.0501 | 0.2140 | 212 | 12 |
| SABL RetinaNet | 0.1034 | 0.3817 | 132 | 21 | 0.1857 | 0.6559 | 123 | 6 |
Table 6.
Validation AP50 and AR results of detection models.
Table 6.
Validation AP50 and AR results of detection models.
| Models | Without Augmentation | With Augmentation |
|---|
| AP50 | AR | AP50 | AR |
|---|
| DCN Faster R-CNN | 0.599 | 0.365 | 0.619 | 0.393 |
| Dynamic R-CNN | 0.77 | 0.416 | 0.777 | 0.375 |
| Faster R-CNN | 0.61 | 0.362 | 0.598 | 0.404 |
| FSAF | 0.579 | 0.415 | 0.684 | 0.46 |
| RetinaNet | 0.634 | 0.436 | 0.668 | 0.44 |
| Libra RetinaNet | 0.691 | 0.456 | 0.679 | 0.496 |
| PAA | 0.617 | 0.498 | 0.629 | 0.547 |
| RegNet RetinaNet | 0.609 | 0.458 | 0.685 | 0.471 |
| SABL Faster R-CNN | 0.632 | 0.429 | 0.658 | 0.386 |
| SABL RetinaNet | 0.67 | 0.436 | 0.67 | 0.456 |
Table 7.
Validation LRP-optimal threshold (LRPt), oLRPLoc (oLRPL), oLRPFP and oLRPFN results of detection models.
Table 7.
Validation LRP-optimal threshold (LRPt), oLRPLoc (oLRPL), oLRPFP and oLRPFN results of detection models.
| Models | Without Augmentation | With Augmentation |
|---|
| LRPt | oLRPL | oLRPFP | oLRPFN | oLRP | LRPt | oLRPL | oLRPFP | oLRPFN | oLRP |
|---|
| DCN Faster R-CNN | 0.681 | 0.309 | 0.216 | 0.473 | 0.824 | 0.506 | 0.318 | 0.261 | 0.382 | 0.815 |
| Dynamic R-CNN | 0.88 | 0.321 | 0.2 | 0.345 | 0.798 | 0.775 | 0.318 | 0.208 | 0.236 | 0.769 |
| Faster R-CNN | 0.553 | 0.329 | 0.404 | 0.382 | 0.851 | 0.641 | 0.311 | 0.319 | 0.418 | 0.827 |
| FSAF | 0.322 | 0.304 | 0.397 | 0.364 | 0.824 | 0.404 | 0.3 | 0.271 | 0.364 | 0.794 |
| RetinaNet | 0.441 | 0.317 | 0.2 | 0.418 | 0.814 | 0.439 | 0.304 | 0.25 | 0.4 | 0.804 |
| Libra RetinaNet | 0.465 | 0.295 | 0.159 | 0.327 | 0.756 | 0.437 | 0.273 | 0.234 | 0.345 | 0.752 |
| PAA | 0.503 | 0.31 | 0.443 | 0.382 | 0.842 | 0.552 | 0.28 | 0.314 | 0.364 | 0.783 |
| RegNet RetinaNet | 0.421 | 0.294 | 0.292 | 0.382 | 0.797 | 0.499 | 0.298 | 0.205 | 0.364 | 0.779 |
| SABL Faster R-CNN | 0.46 | 0.331 | 0.4 | 0.345 | 0.846 | 0.436 | 0.345 | 0.403 | 0.339 | 0.859 |
| SABL RetinaNet | 0.591 | 0.19 | 0.382 | 0.382 | 0.763 | 0.534 | 0.28 | 0.238 | 0.418 | 0.783 |
Table 8.
Test AP50 and AR results of detection models.
Table 8.
Test AP50 and AR results of detection models.
| Models | Without Augmentation | With Augmentation |
|---|
| AP50 | AR | AP50 | AR |
|---|
| DCN Faster R-CNN | 0.547 | 0.391 | 0.577 | 0.323 |
| Dynamic R-CNN | 0.63 | 0.341 | 0.654 | 0.323 |
| Faster R-CNN | 0.617 | 0.343 | 0.624 | 0.395 |
| FSAF | 0.739 | 0.398 | 0.746 | 0.412 |
| RetinaNet | 0.621 | 0.377 | 0.652 | 0.338 |
| Libra RetinaNet | 0.695 | 0.432 | 0.715 | 0.445 |
| PAA | 0.666 | 0.491 | 0.754 | 0.496 |
| RegNet RetinaNet | 0.713 | 0.452 | 0.74 | 0.468 |
| SABL Faster R-CNN | 0.622 | 0.427 | 0.595 | 0.402 |
| SABL RetinaNet | 0.613 | 0.386 | 0.65 | 0.404 |
Table 9.
Test LRP-optimal threshold (LRPt), oLRPLoc (oLRPL), oLRPFP and oLRPFN results of detection models.
Table 9.
Test LRP-optimal threshold (LRPt), oLRPLoc (oLRPL), oLRPFP and oLRPFN results of detection models.
| Models | Without Augmentation | With Augmentation |
|---|
| LRPt | oLRPL | oLRPFP | oLRPFN | oLRP | LRPt | oLRPL | oLRPFP | oLRPFN | oLRP |
|---|
| DCN Faster R-CNN | 0.69 | 0.343 | 0.306 | 0.554 | 0.883 | 0.47 | 0.335 | 0.364 | 0.375 | 0.848 |
| Dynamic R-CNN | 0.825 | 0.349 | 0.302 | 0.339 | 0.845 | 0.784 | 0.352 | 0.362 | 0.339 | 0.858 |
| Faster R-CNN | 0.644 | 0.339 | 0.308 | 0.357 | 0.839 | 0.54 | 0.35 | 0.419 | 0.357 | 0.869 |
| FSAF | 0.354 | 0.338 | 0.236 | 0.25 | 0.803 | 0.371 | 0.322 | 0.241 | 0.214 | 0.777 |
| RetinaNet | 0.343 | 0.357 | 0.359 | 0.268 | 0.851 | 0.376 | 0.376 | 0.286 | 0.286 | 0.862 |
| Libra RetinaNet | 0.6 | 0.321 | 0.094 | 0.482 | 0.824 | 0.443 | 0.333 | 0.196 | 0.339 | 0.81 |
| PAA | 0.516 | 0.309 | 0.296 | 0.321 | 0.798 | 0.56 | 0.310 | 0.184 | 0.286 | 0.766 |
| RegNet RetinaNet | 0.466 | 0.311 | 0.235 | 0.304 | 0.783 | 0.552 | 0.317 | 0.163 | 0.357 | 0.791 |
| SABL Faster R-CNN | 0.378 | 0.303 | 0.494 | 0.286 | 0.834 | 0.592 | 0.292 | 0.27 | 0.509 | 0.827 |
| SABL RetinaNet | 0.561 | 0.309 | 0.32 | 0.393 | 0.819 | 0.514 | 0.31 | 0.233 | 0.411 | 0.81 |
Table 10.
Results (AP50, AR, LRP-optimal threshold (LRPt), oLRPLoc (oLRPL), oLRPFP and oLRPFN) of Ensemble Model (WFD-1, WFD-2, WFD-3, WFD-4, WFD-5, WFD-C).
Table 10.
Results (AP50, AR, LRP-optimal threshold (LRPt), oLRPLoc (oLRPL), oLRPFP and oLRPFN) of Ensemble Model (WFD-1, WFD-2, WFD-3, WFD-4, WFD-5, WFD-C).
| Ensemble Models | AP50 | AR | LRPt | oLRPL | oLRPFP | oLRPFN | oLRP |
|---|
| WFD-1 | 0.8379 | 0.361 | 0.467 | 0.353 | 0.125 | 0.25 | 0.8 |
| WFD-2 | 0.776 | 0.346 | 0.47 | 0.341 | 0.174 | 0.296 | 0.806 |
| WFD-3 | 0.8327 | 0.398 | 0.452 | 0.322 | 0.13 | 0.286 | 0.77 |
| WFD-4 | 0.8338 | 0.382 | 0.511 | 0.3343 | 0.12 | 0.214 | 0.778 |
| WFD-5 | 0.8413 | 0.329 | 0.375 | 0.349 | 0.148 | 0.164 | 0.78 |
| WFD-C | 0.8639 | 0.33 | 0.357 | 0.349 | 0.158 | 0.143 | 0.77 |
Table 11.
Comparison with various amounts of wrist test datasets.
Table 11.
Comparison with various amounts of wrist test datasets.
| Model | Input | Dataset | Amount | AP50 | AR | LRPt | oLRPL |
|---|
| PAA | 800 × 800 × 3 | Gazi | 54 test | 0.754 | 0.496 | 0.56 | 0.310 |
| YOLOv3 | 750 × 750 × 3 | Gazi | 54 test | 0.531 | 0.298 | 0.164 | 0.378 |
| Proposed WFD-C | 800 × 800 × 3 | Gazi | 54 test | 0.8639 | 0.33 | 0.357 | 0.349 |
| PAA | 800 × 800 × 3 | Gazi | 54 test + 54 valid | 0.629 | 0.499 | 0.552 | 0.304 |
| YOLOv3 | 750 × 750 × 3 | Gazi | 54 test + 54 valid | 0.516 | 0.286 | 0.164 | 0.364 |
| Proposed WFD-C | 800 × 800 × 3 | Gazi | 54 test + 54 valid | 0.709 | 0.344 | 0.454 | 0.315 |
Table 12.
Inclusion/exclusion criteria for dataset.
Table 12.
Inclusion/exclusion criteria for dataset.
| Inclusion Criteria | Exclusion Criteria |
|---|
| Fracture labeling: Only fractures in the radius and ulna bones are labeled in Wrist. | Fracture labeling: other small bone (trapezoid, trapezium, scaphoid, capitate, hamate, triquetrum, pisiform, lunate) fractures in Wrist were not studied and ignored. |
| Image size: Images were rescaled to 800 × 800 × 3, and deep learning models supporting this size were used. | Image size: YOLO and other deep learning models that do not support 800 × 800 × 3 size were not used. |
| Data collection process: X-ray images of patients from the last 10 years (between 2010 and 2020) were used in 2020. | Data collection process: X-ray images of patients after 2020 were not used. |
| Number of fractures: there are 570 fractures in 542 images. Thus, there are multiple fracture ones in an image. | Number of fractures: images with not just one fracture, but one and/or more than one fracture were used. |
| The number of patients with fractures in both hands is 11. The distribution of these patients is 10 in Train and 1 in Test. | The patient with a fracture in both hands was not included in the validation. |
| The number of patients under the age of 12 and adults are 21 and 254, respectively. There is heterogeneity in these patient numbers. | There is no homogeneity, that is, an equal distribution, in the number of patients under the age of 12 and adults. |
| One radiologist and 2 orthopedists were jointly involved in the labeling of the fractures. | No more than 3 physicians were used in the labeling of fractures. There is no difference of opinion in the labeling of physicians. |
| In the Dataset distribution, the number of fractures per image is highest in the train dataset. | In the distribution of the dataset, the number of fractures per image was not considered to be equal in the train, validation and test dataset. |
| In the dataset, the number of females is 134 and the number of males is 141. | Equality in the number of males and females was not considered in the dataset. |
| The images in the dataset are 7% pair (right, left), 43% right hand, 50% left hand. | Equality was not observed in the number of pairs, right-handed and left-handed images in the dataset. |
| Since the graphics card in the local PC hardware used in the study is 4 GB, object detection models that support this are used in MMDetection. | In the study, models that support a graphics card higher than 4 GB from the object detection model-hands in MMDetection could not be used. |


