
Fast and Sensitive Determination of Bioflavonoids Using a New Analytical System Based on Label-Free Silver Triangular Nanoplates

 , ,
, , 
Abstract
:1. Introduction
2. Materials and Methods
2.1. Reagents and Instruments
2.2. AgTNPs Synthesis
2.3. Procedure
2.4. Sample Pretreatment
3. Results
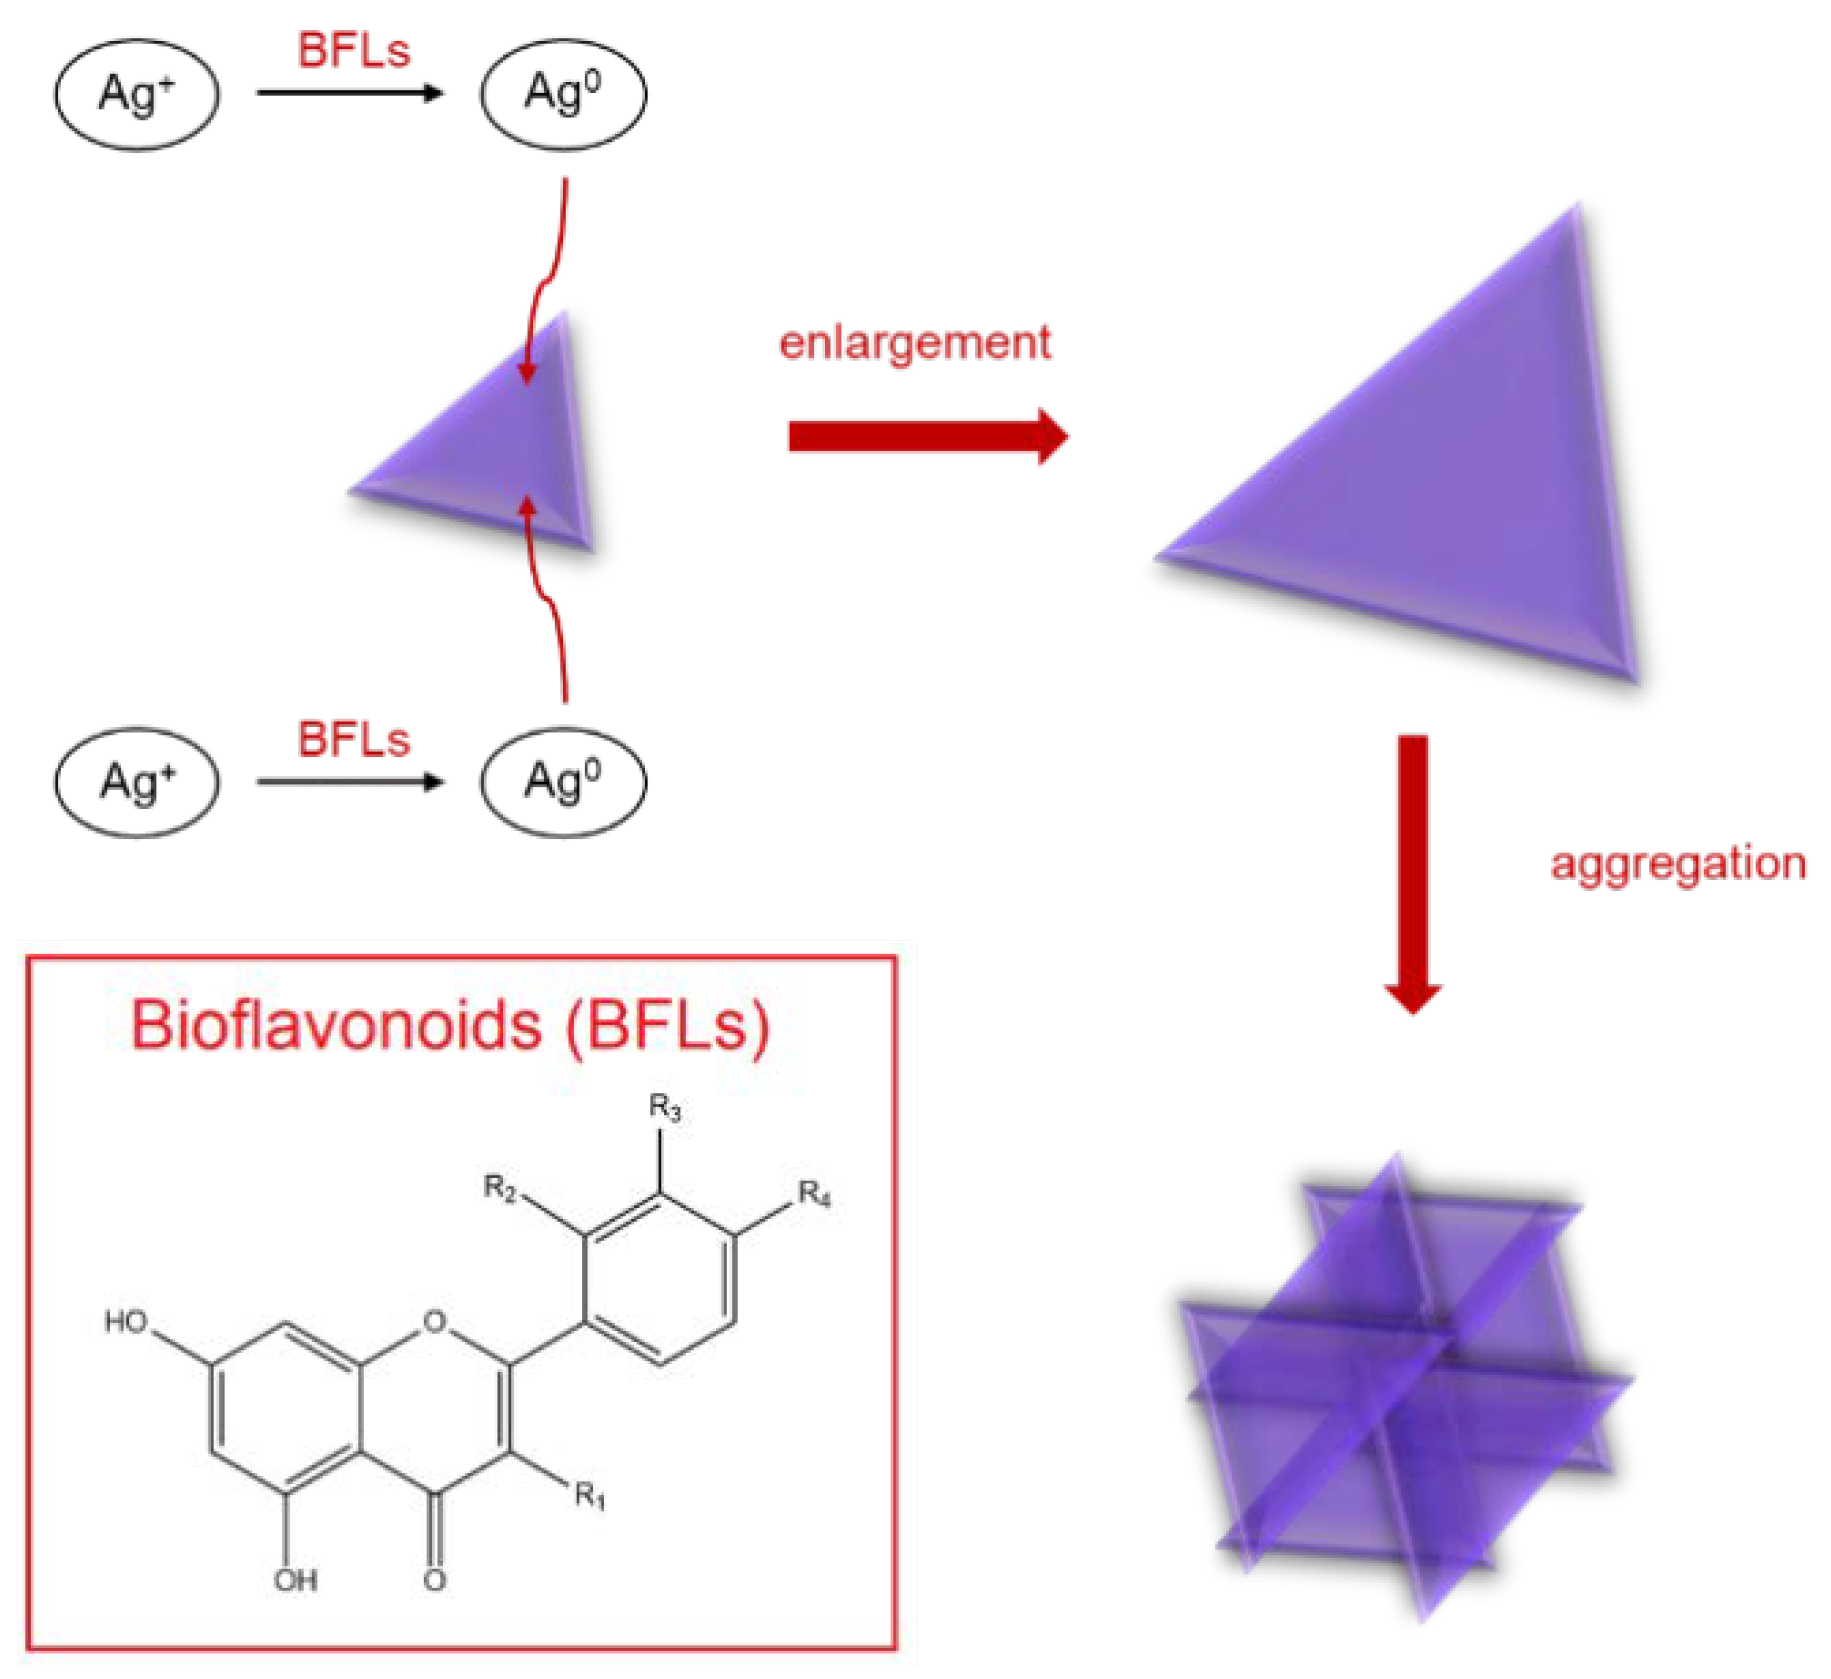
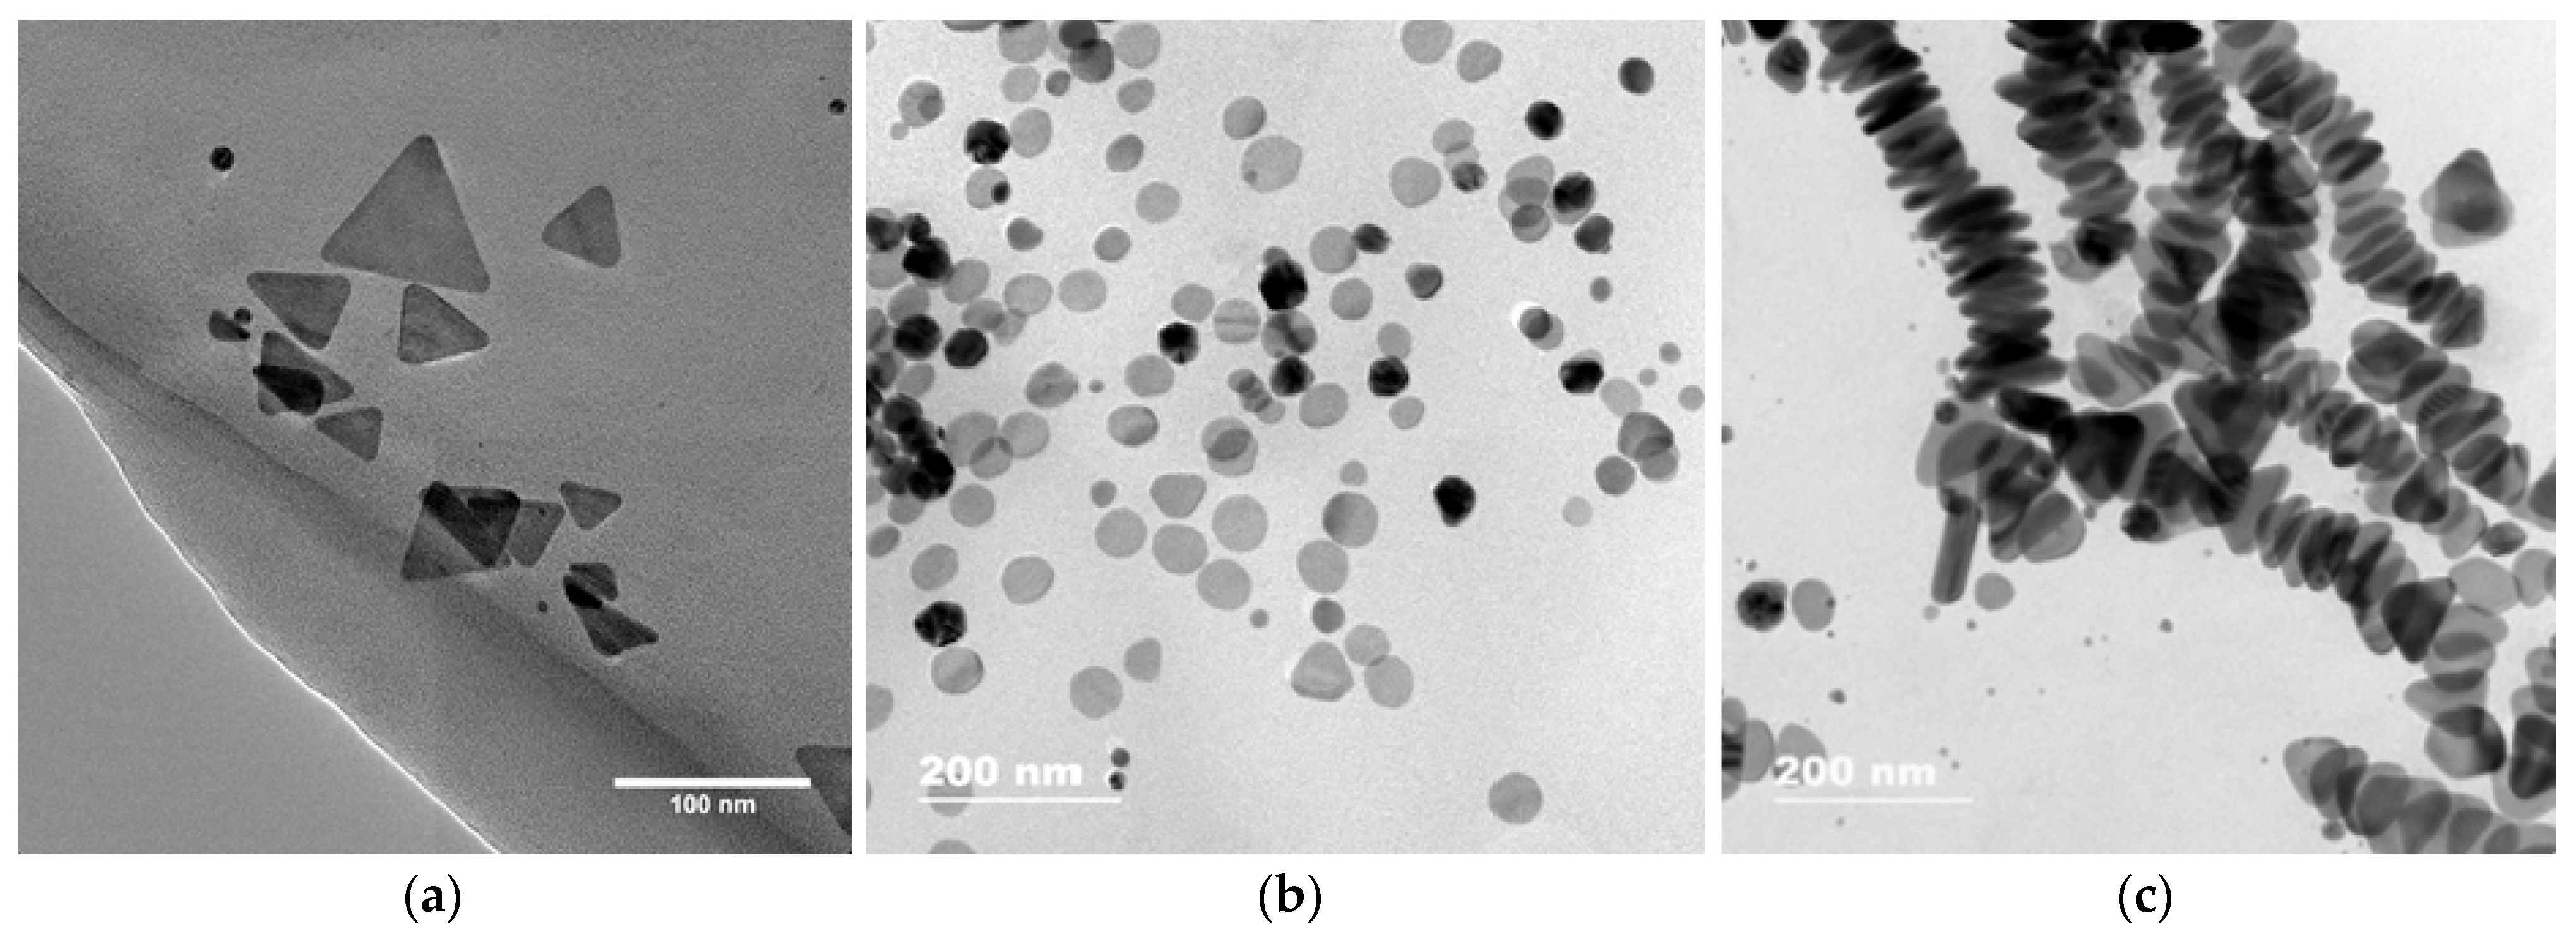
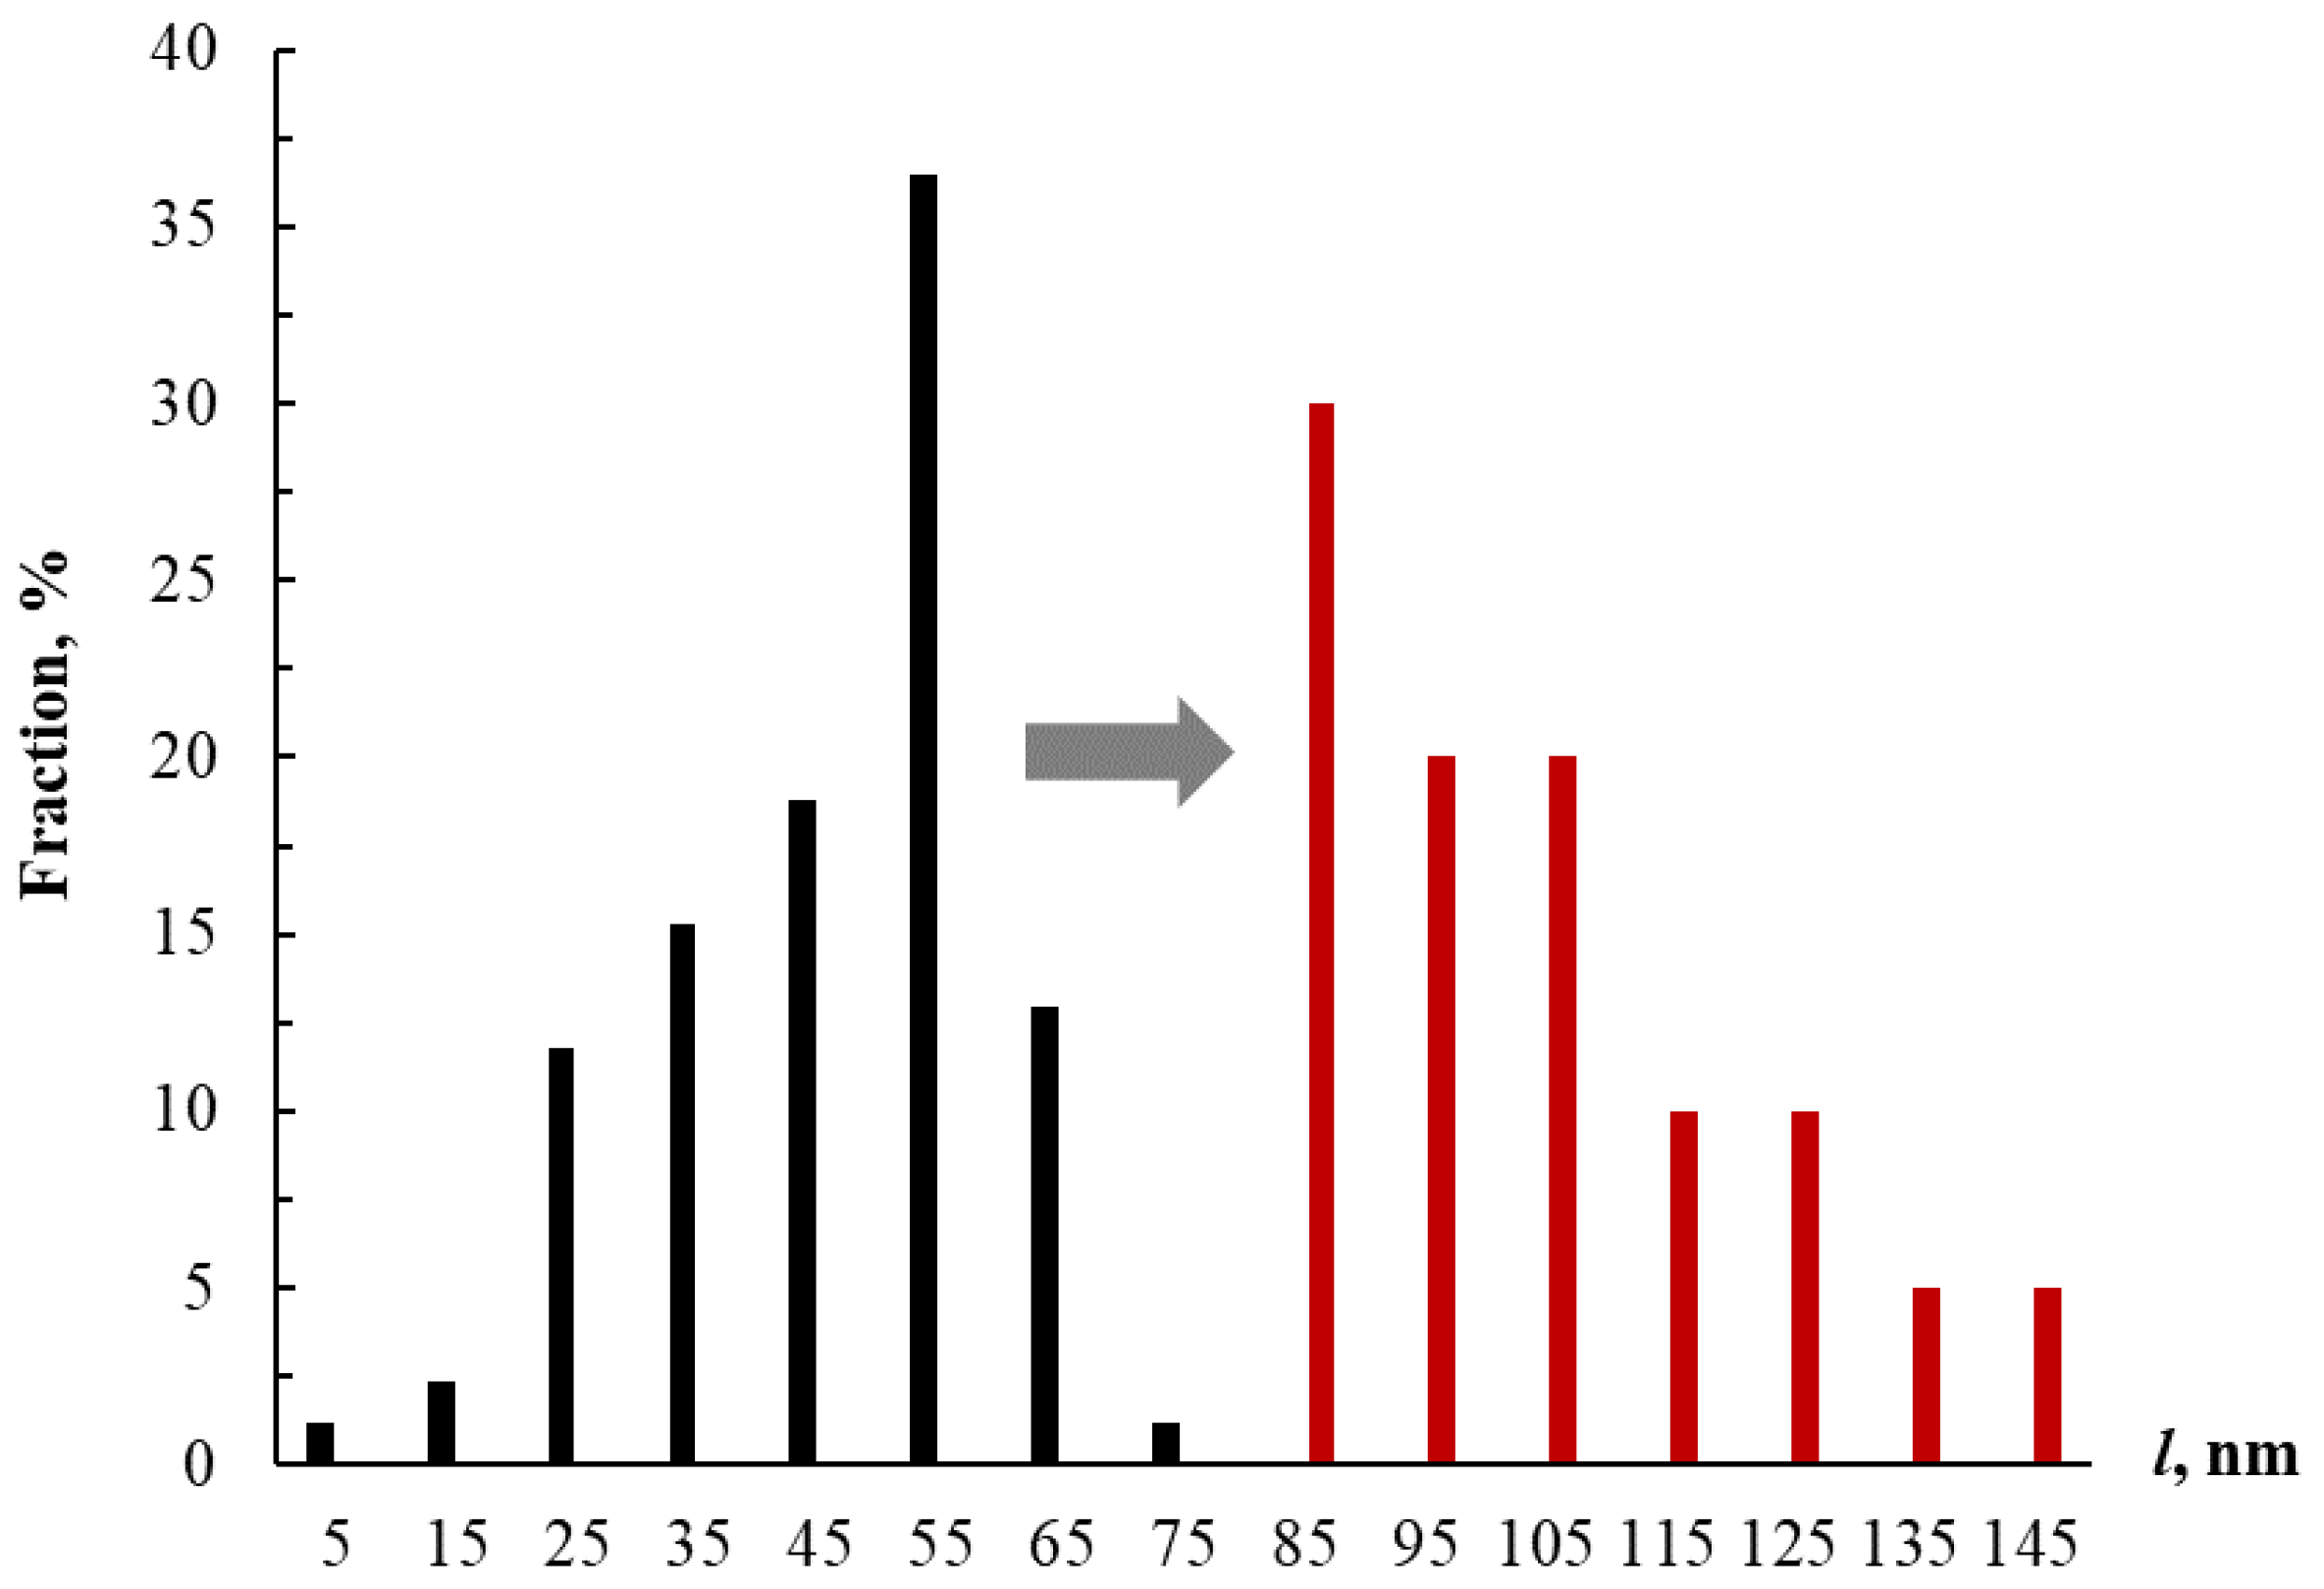
3.1. Interaction between Label-Free Silver Triangular Nanoplates and Bioflavonoids in the Presence of Silver(I) Nitrate
3.1.1. Effect of Nanoparticle Concentration
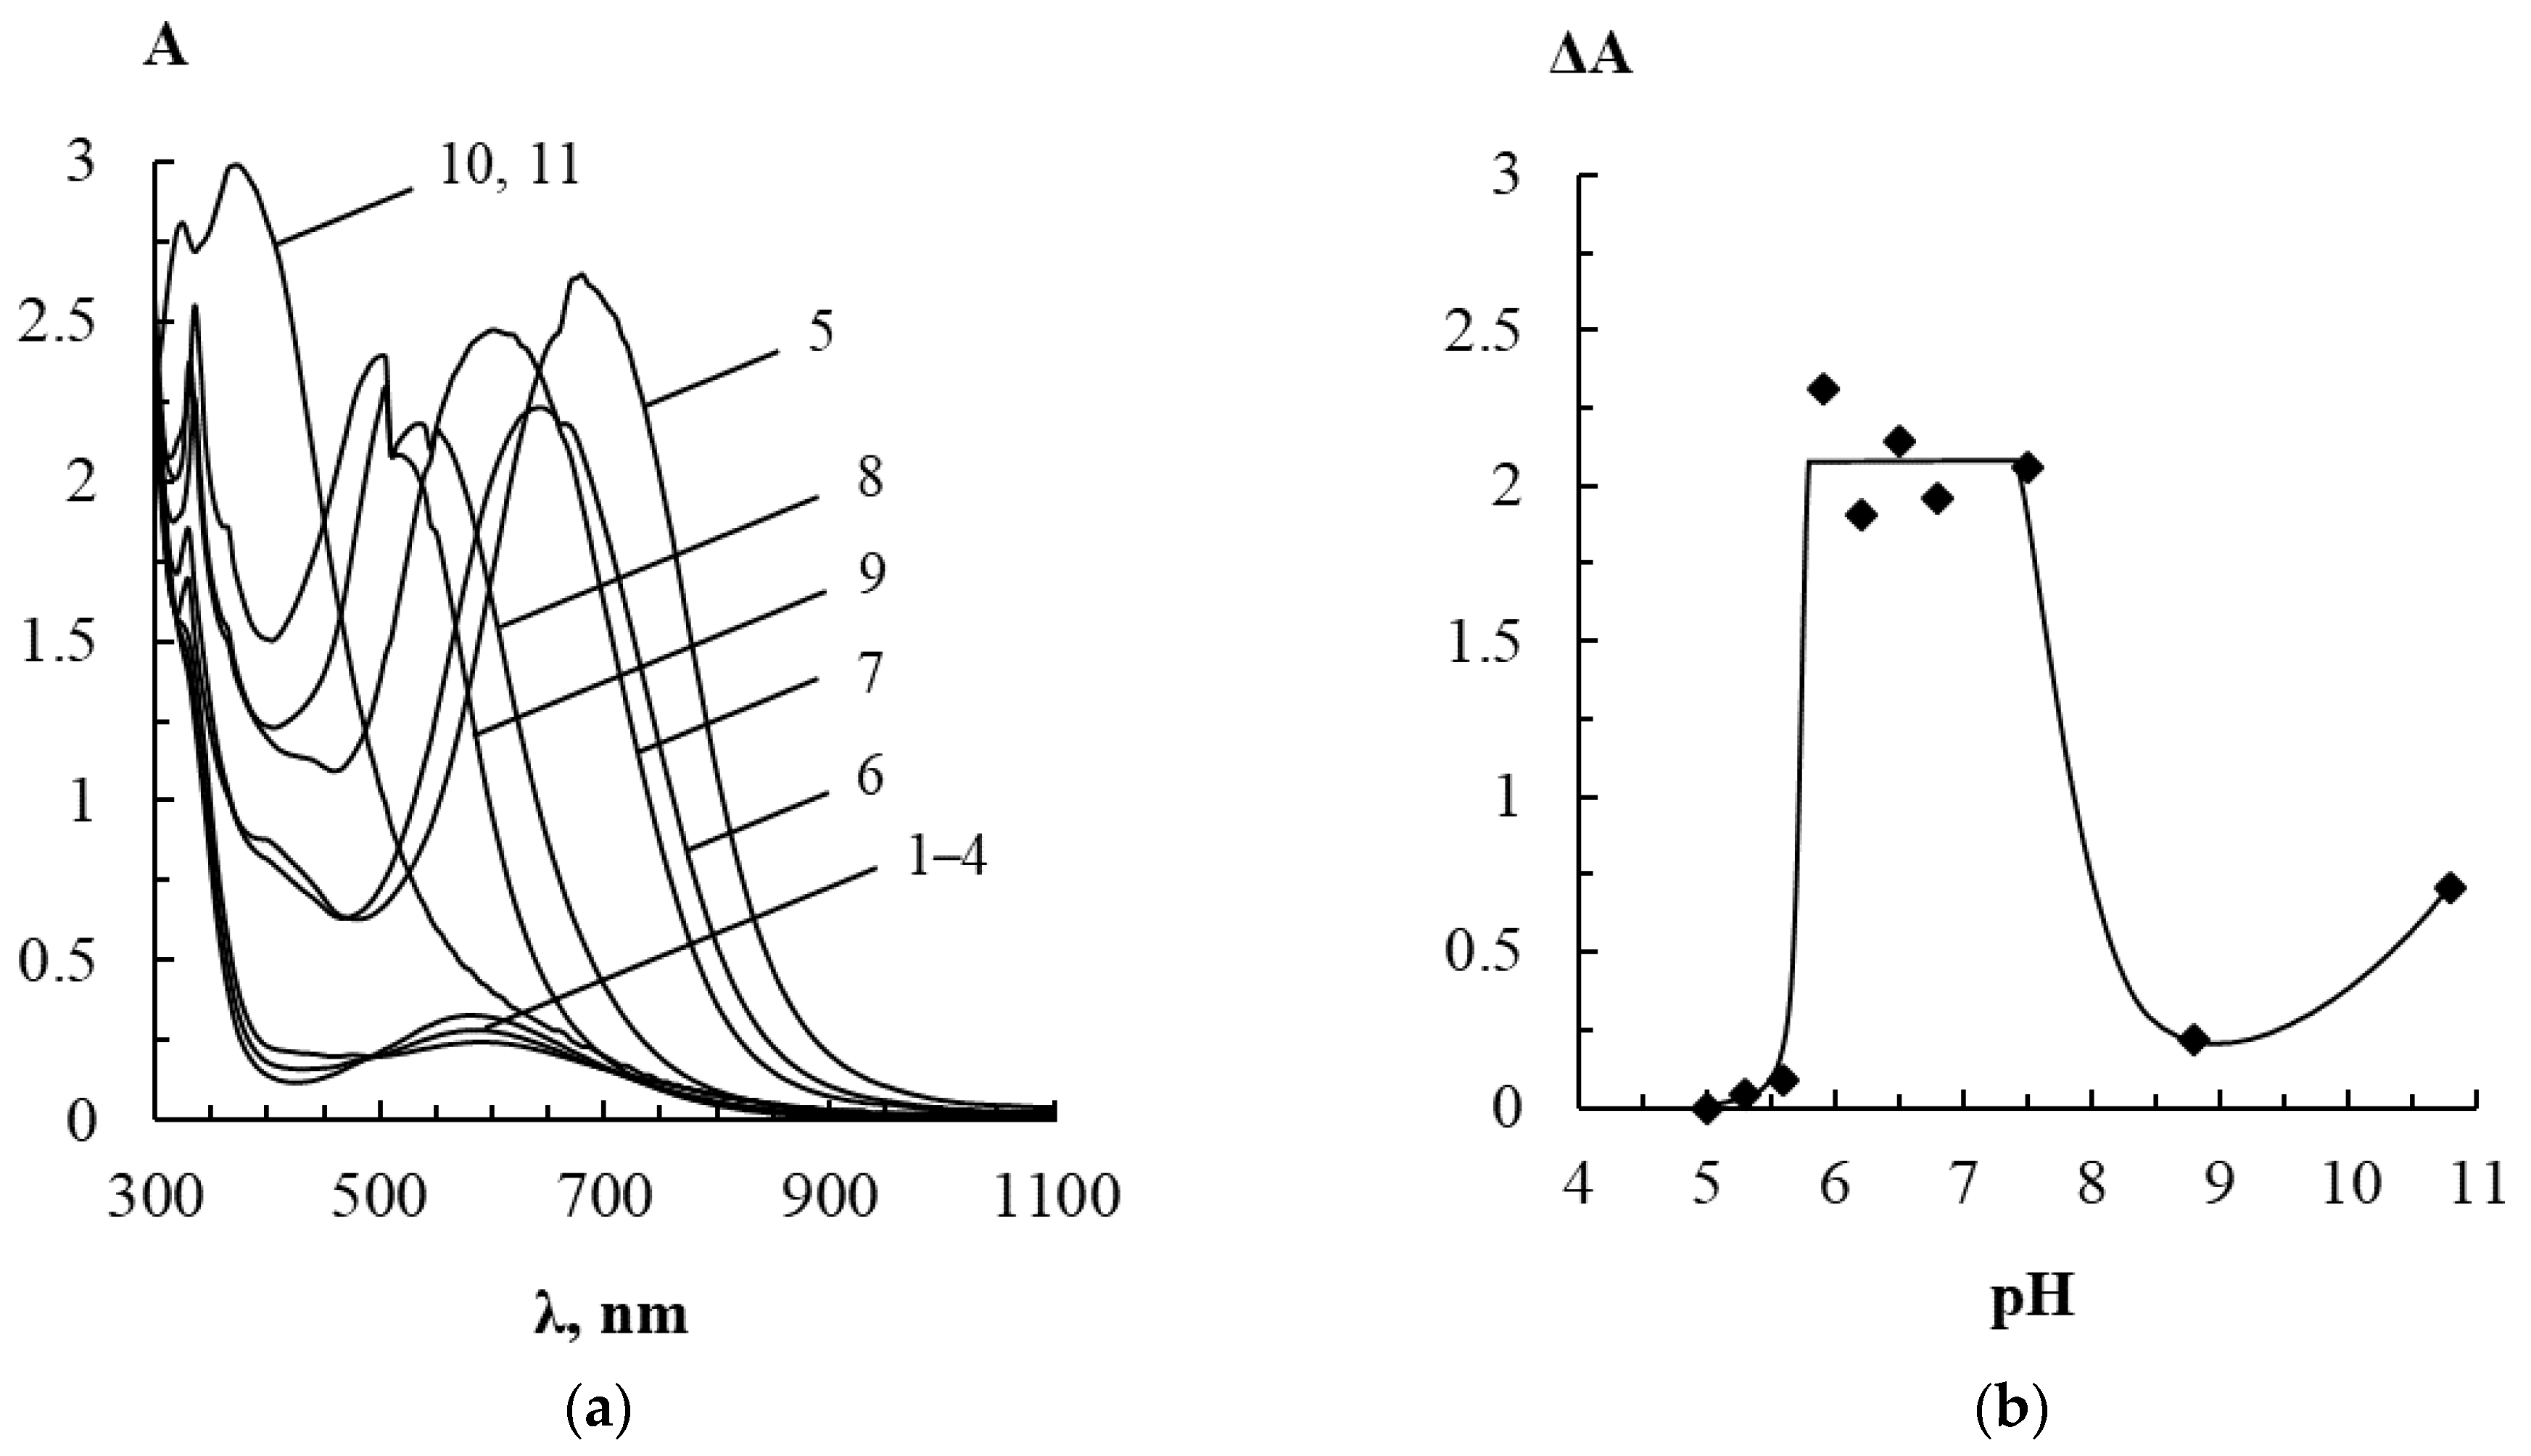
3.1.2. Effect of pH
3.1.3. Effect of Interaction Time
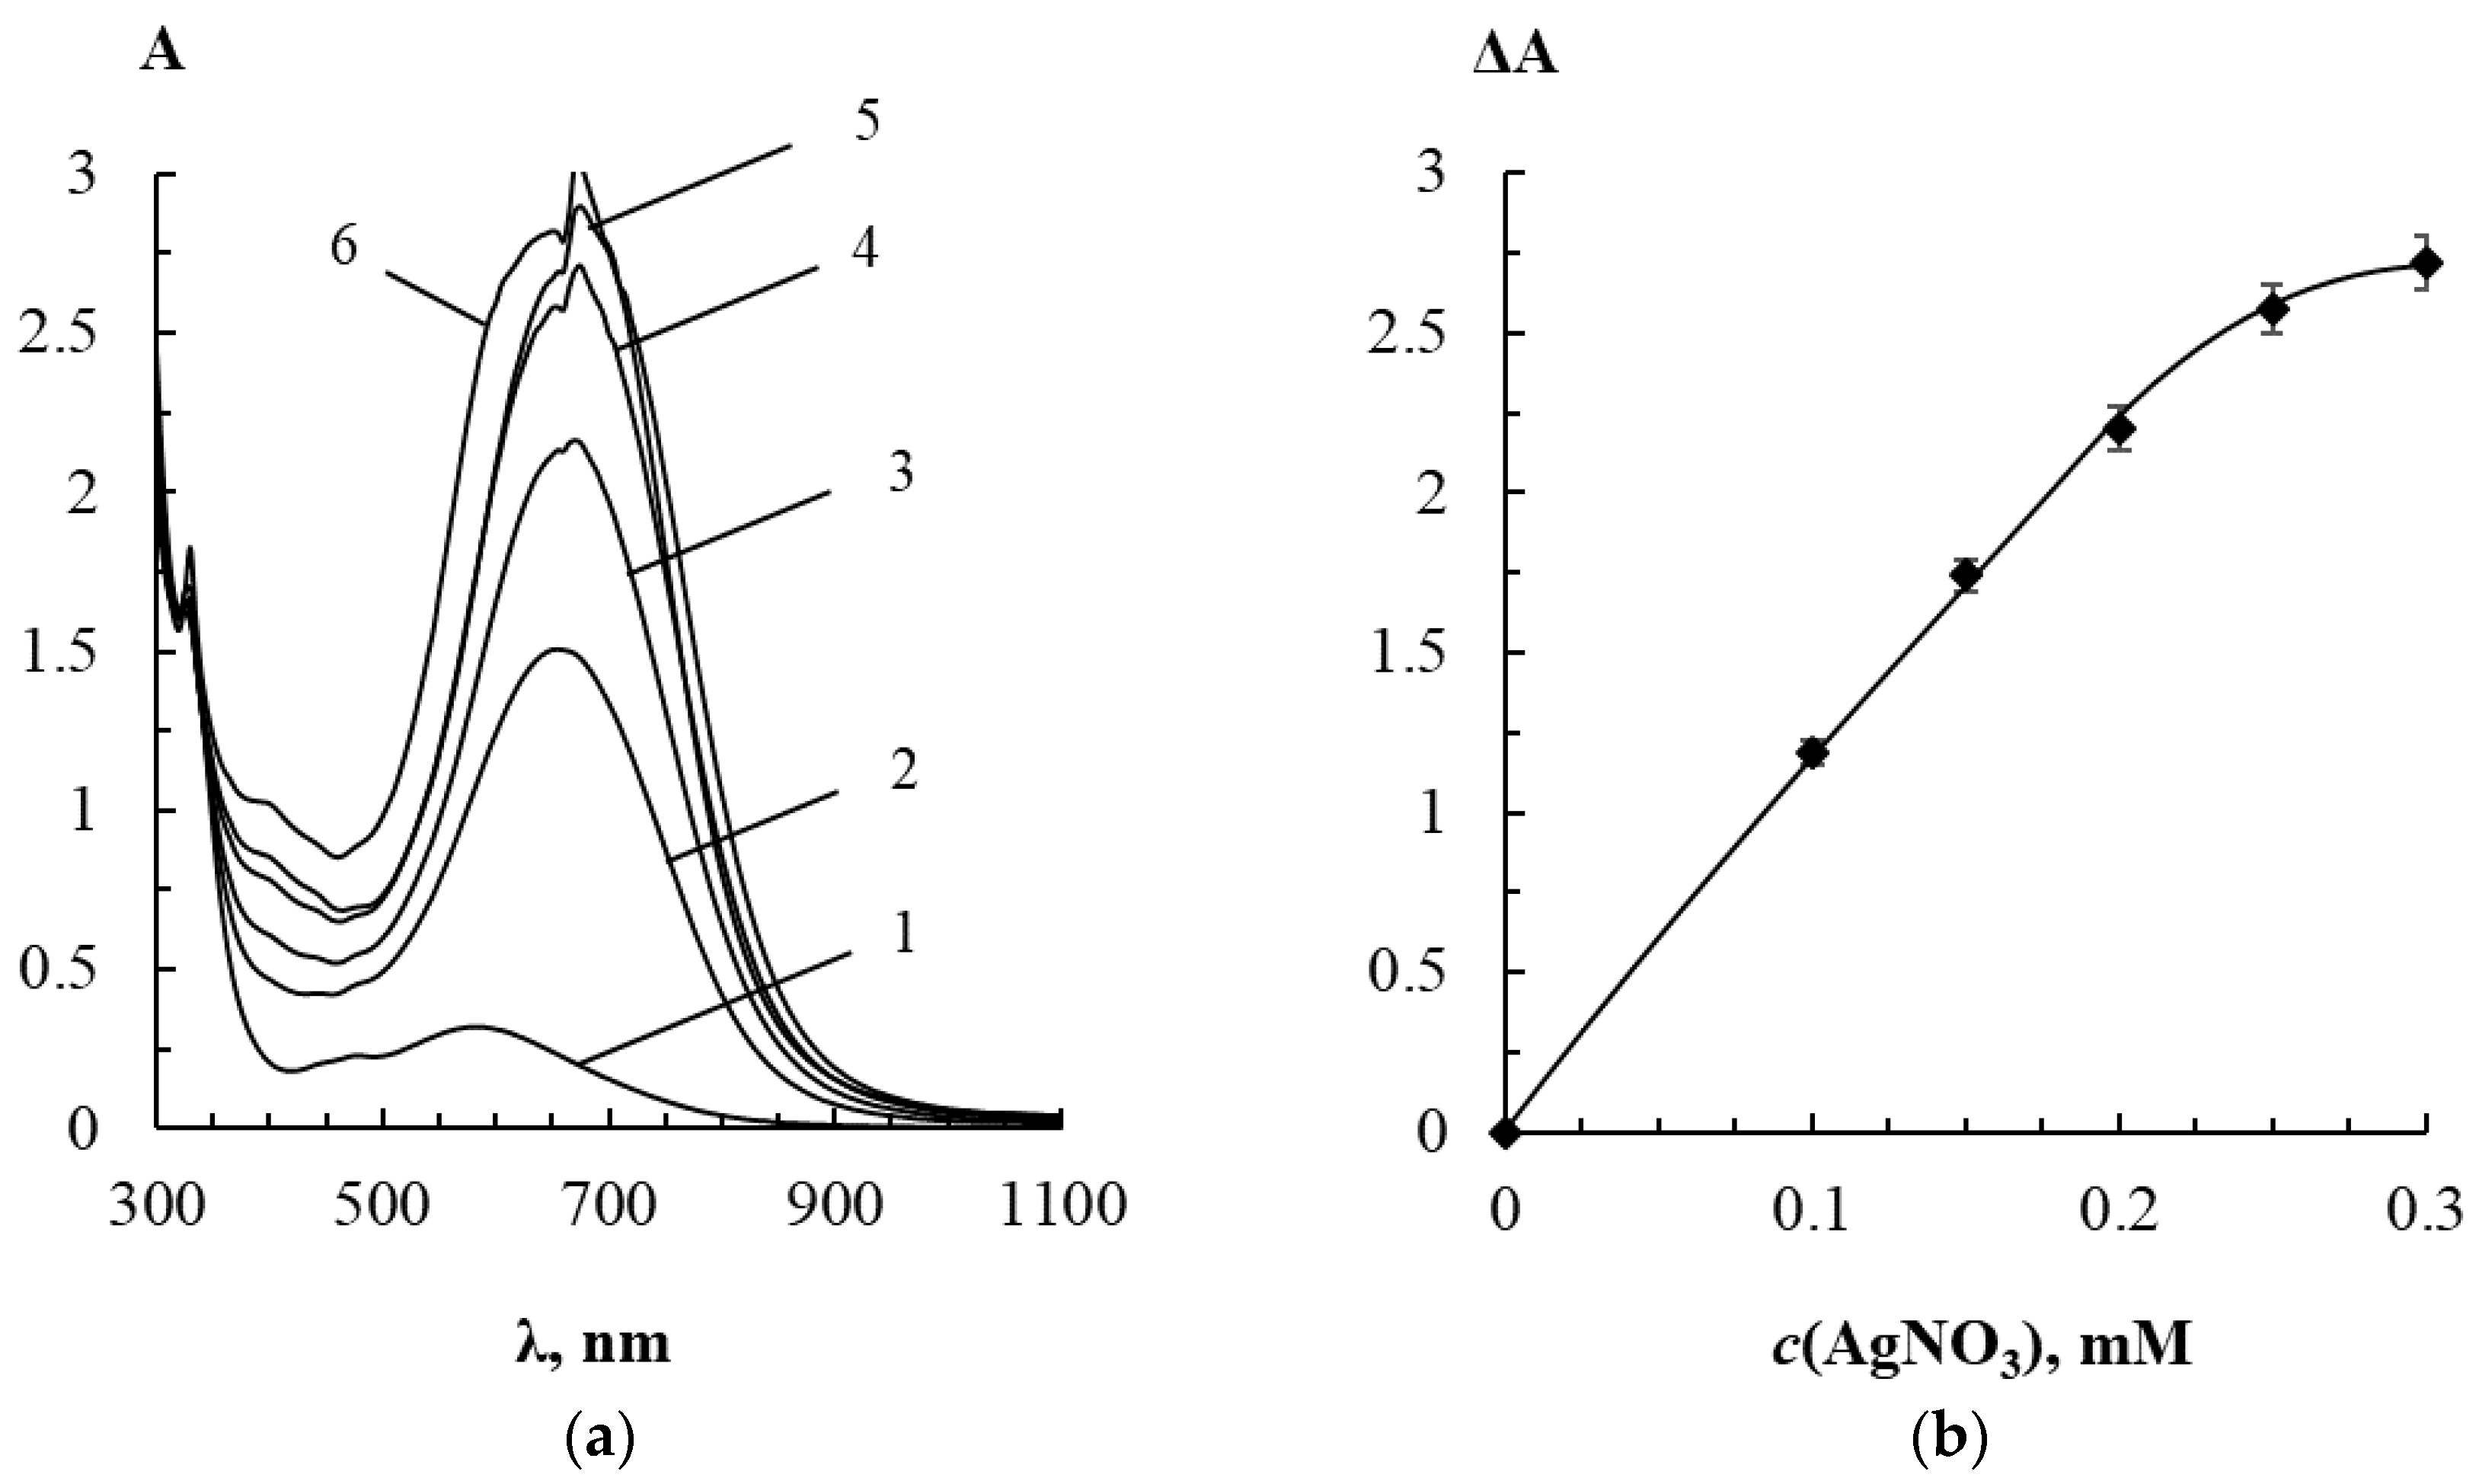
3.1.4. Effect of Silver(I) Nitrate Concentration
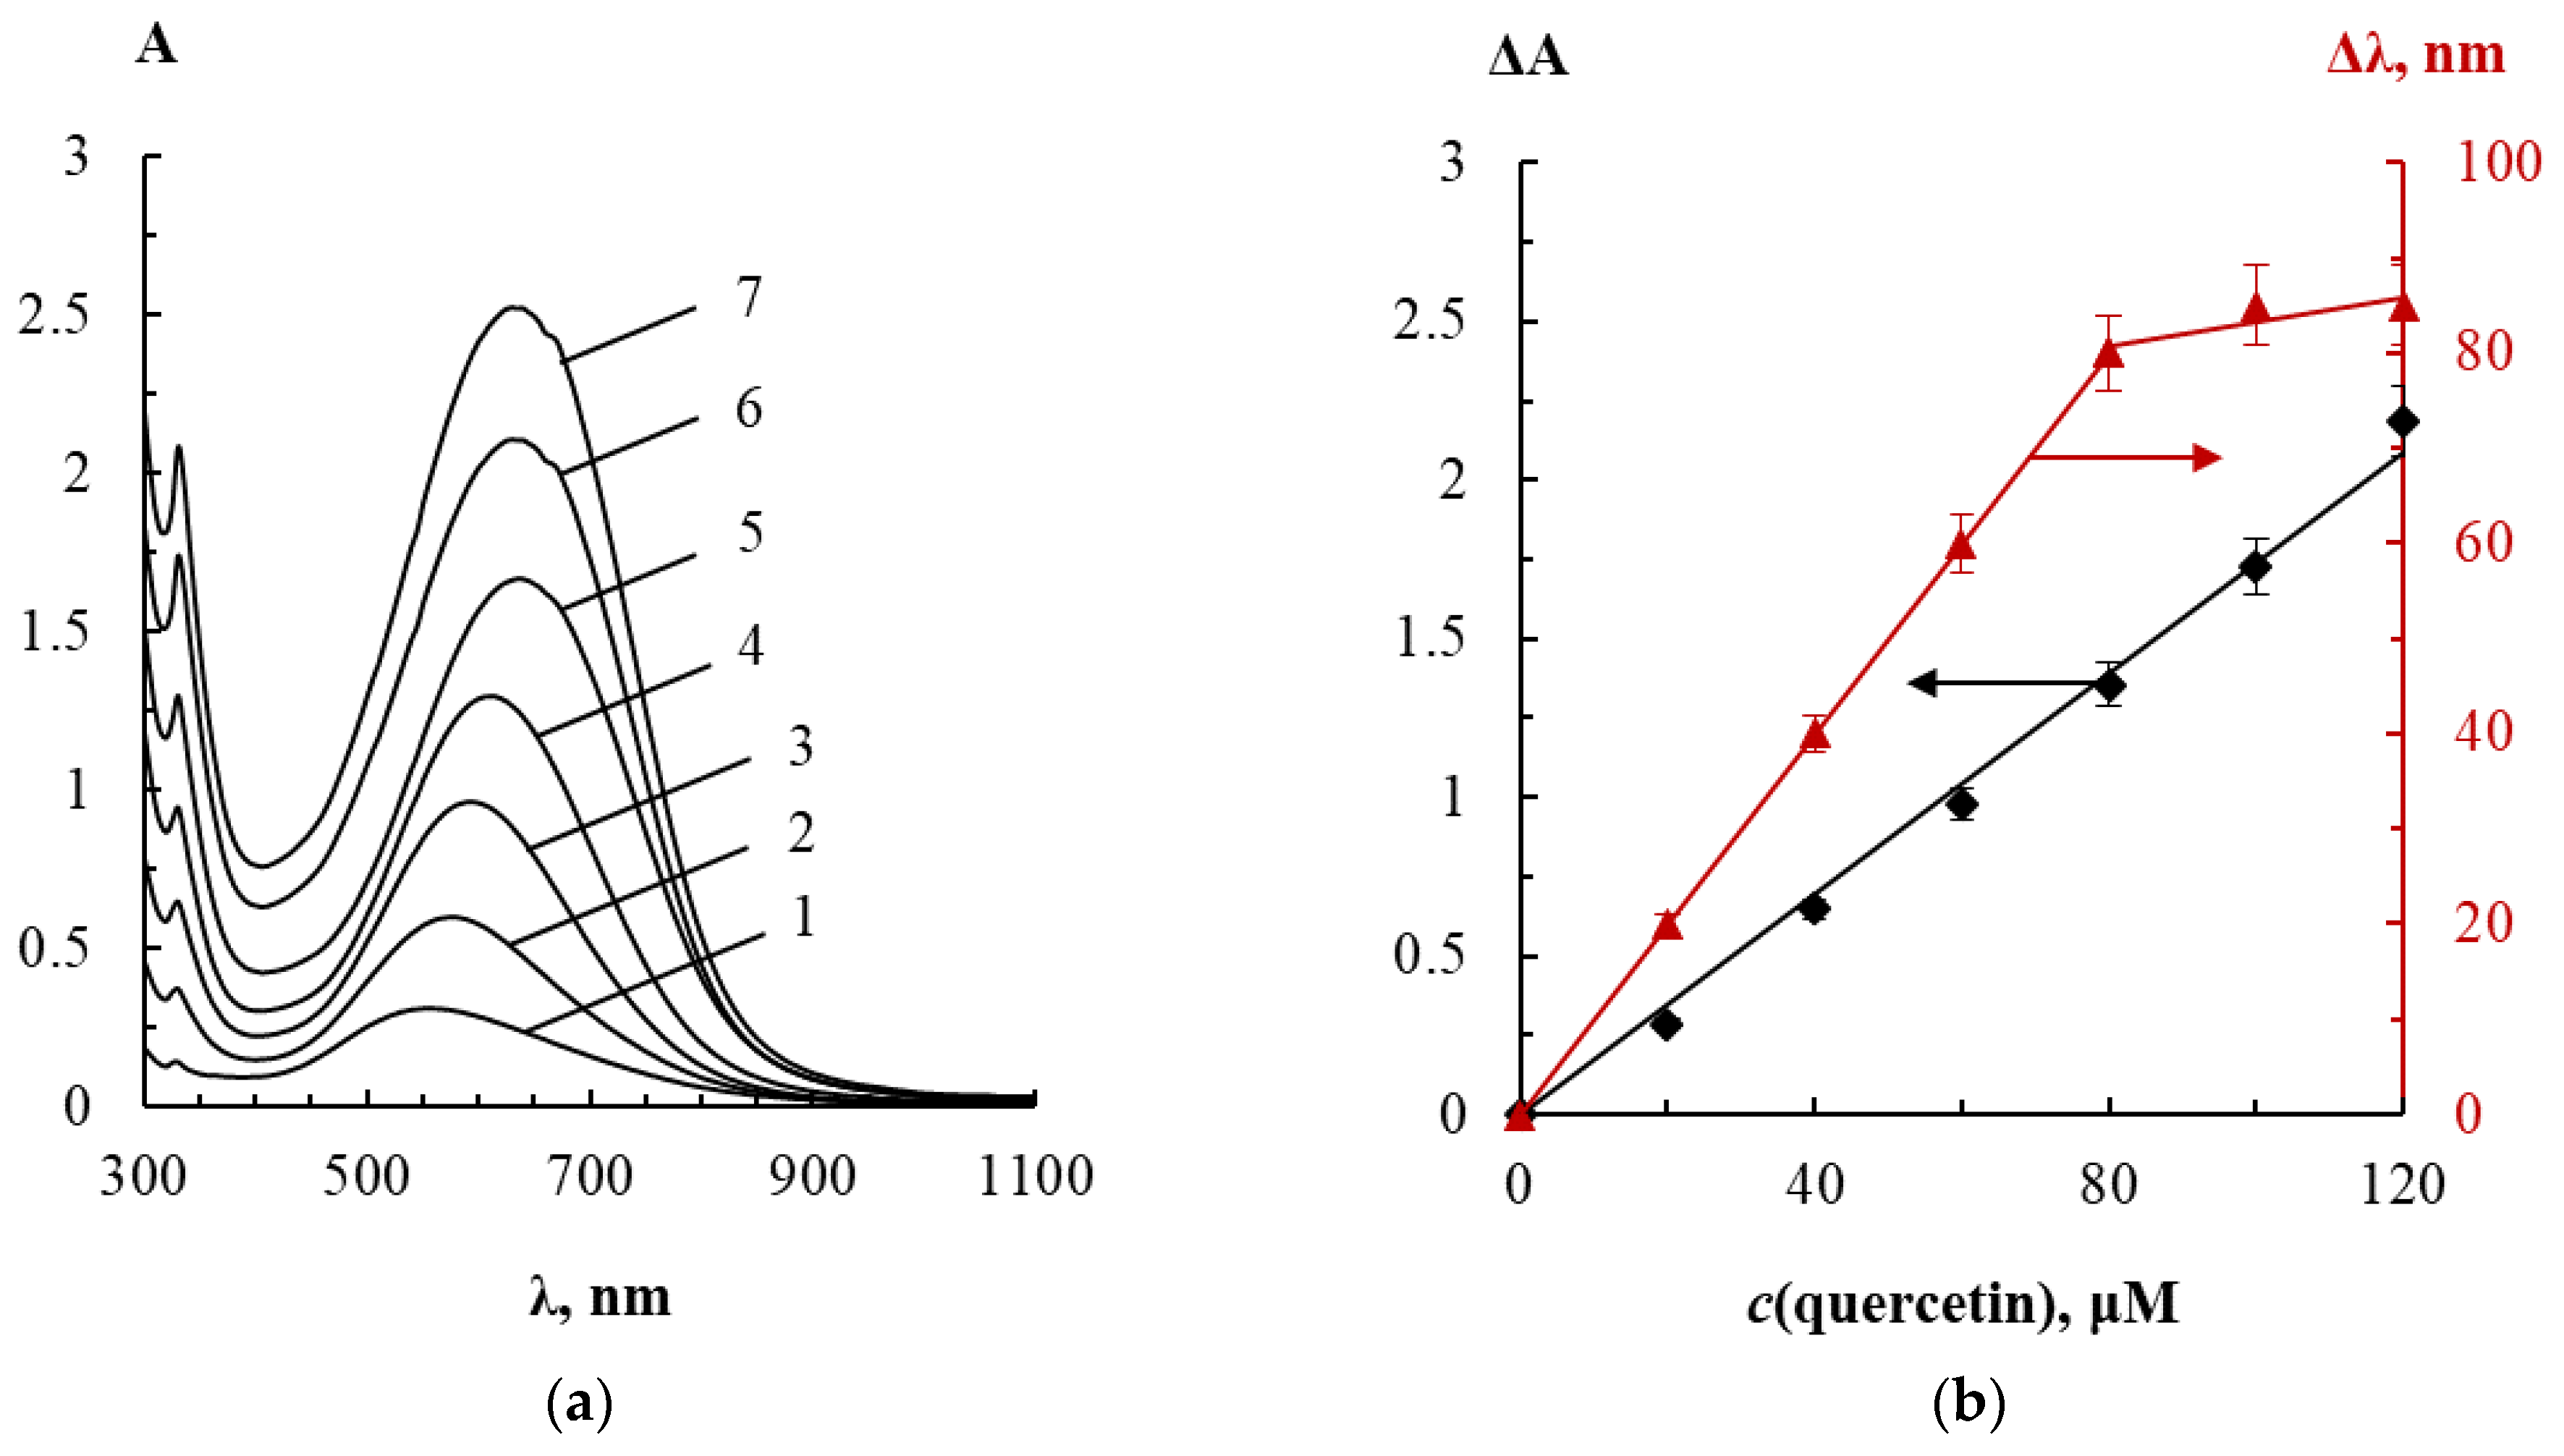
3.2. Spectrophotometric Determination of Bioflavonoids
3.2.1. Analytical Performance
3.2.2. Analytical Performance
3.2.3. Sample Analysis
4. Discussion
5. Conclusions
Author Contributions
Funding
Institutional Review Board Statement
Informed Consent Statement
Data Availability Statement
Acknowledgments
Conflicts of Interest
References
- Sammani, M.S.; Clavijo, S.; Cerdà, V. Recent, advanced sample pretreatments and analytical methods for flavonoids determination in different samples. TrAC Trends Anal. Chem. 2021, 138, 116220. [Google Scholar] [CrossRef]
- Gutorova, S.V.; Apyari, V.V.; Kalinin, V.I.; Furletov, A.A.; Tolmacheva, V.V.; Gorbunova, M.V.; Dmitrienko, S.G. Composable paper-based analytical devices for determination of flavonoids. Sens. Actuators B Chem. 2021, 331, 129398. [Google Scholar] [CrossRef]
- Robards, K.; Antolovich, M. Analytical chemistry of fruit bioflavonoids. A review. Analyst 1997, 122, 11R–34R. [Google Scholar] [CrossRef]
- Blasa, M.; Candiracci, M.; Accorsi, A.; Piacentini, M.P.; Piatti, E. Honey flavonoids as protection agents against oxidative damage to human red blood cells. Food Chem. 2007, 104, 1635–1640. [Google Scholar] [CrossRef]
- Meena, N.L.; Verma, P.; Pande, R.; Kumar, M.; Watts, A.; Gupta, O.P. Bioavailability and Nutritional Analysis of Flavonoids. In Plant Phenolics in Sustainable Agriculture; Lone, R., Shuab, R., Kamili, A.N., Eds.; Springer: Singapore, 2020; pp. 135–156. [Google Scholar]
- Belikov, V.G. Farmacevticheskaya Khimiya (Pharmaceutical Chemistry). In Spetsialnaya Farmacevticheskaya Khimiya (Special Pharmaceutical Chemistry); Medpress: Pyatigorsk, Russia, 2003; Volume 2, pp. 1–437. [Google Scholar]
- Kurkin, V.A.; Pravdivtseva, O.E.; Shaikhutdinov, I.K.; Kurkina, A.V.; Volkova, N.A. Quantitative determination of total flavonoids in blood-red hawthorn fruit. Pharm. Chem. J. 2020, 54, 36–39. [Google Scholar] [CrossRef]
- Fedenko, V.S.; Shemet, S.A.; Landi, M. UV-vis spectroscopy and colorimetric models for detecting anthocyanin-metal complexes in plants: An overview of in vitro and in vivo techniques. J. Plant Physiol. 2017, 212, 13–28. [Google Scholar] [CrossRef]
- Wang, C.-H.; Huang, C.-C.; Chen, W.; Lai, Y.-S. The chemical aspects of Raman spectroscopy: Statistical structure-spectrum relationship in the analyses of bioflavonoids. J. Food Drug Anal. 2020, 28, 45–53. [Google Scholar] [CrossRef]
- Turco, J.F.; do Nascimento, C.L.; de Lima, V.A.; Torres, Y.R. Could antioxidant capacity and flavonoid content of ethanolic extracts of geopropolis from Brazilian native bees be estimated from digital photos and NIR Spectra? Microchem. J. 2020, 157, 105031. [Google Scholar] [CrossRef]
- Corradini, E.; Foglia, P.; Giansanti, I.; Gubbiotti, I.; Samperi, R.; Lagana, A. Flavonoids: Chemical properties and analytical methodologies of identification and quantitation in foods and plants. Nat. Prod. Res. 2011, 25, 469–495. [Google Scholar] [CrossRef]
- Huang, Y.; Tang, G.; Zhang, T.; Fillet, M.; Crommen, J.; Jiang, Z. Supercritical fluid chromatography in traditional Chinese medicine analysis. J. Pharm. Biomed. Anal. 2018, 147, 65–80. [Google Scholar] [CrossRef]
- De Villiers, A.; Venter, P.; Pasch, H. Recent advances and trends in the liquid-chromatography—Mass spectrometry analysis of flavonoids. J. Chromatogr. A 2016, 1430, 16–78. [Google Scholar] [CrossRef] [PubMed]
- Olech, M.; Pietrzak, W.; Nowak, R. Characterization of free and bound phenolic acids and flavonoid aglycones in Rosa Rugosa thunb. leaves and achenes using LC-ESI-MS/MS-MRM methods. Molecules 2020, 25, 1804. [Google Scholar] [CrossRef] [PubMed] [Green Version]
- Formisano, C.; Rigano, D.; Lopatriello, A.; Sirignano, C.; Ramaschi, G.; Arnoldi, L.; Riva, A.; Sardone, N.; Taglialatela-Scafati, O. Detailed phytochemical characterization of bergamot polyphenolic fraction (BPF) by UPLC-DAD-MS and LC-NMR. J. Agric. Food Chem. 2019, 67, 3159–3167. [Google Scholar] [CrossRef] [PubMed]
- Kumar, B.R. Application of HPLC and ESI-MS techniques in the analysis of phenolic acids and flavonoids from green leafy vegetables (GLVs). J. Pharm. Anal. 2017, 7, 349–364. [Google Scholar] [CrossRef]
- Li, G.; Zeng, X.; Xie, Y.; Cai, Z.; Moore, J.C.; Yuan, X.; Cheng, Z.; Ji, G. Pharmacokinetic properties of isorhamnetin, kaempferol and quercetin after oral gavage of total flavones of Hippophae rhamnoides L. in rats using a UPLC-MS method. Fitoterapia 2012, 83, 182–191. [Google Scholar] [CrossRef]
- Gotti, R. Capillary electrophoresis of phytochemical substances in herbal drugs and medicinal plants. J. Pharm. Biomed. Anal. 2011, 55, 775–801. [Google Scholar] [CrossRef]
- Gan, Z.; Chen, Q.; Fu, Y.; Chen, G. Determination of bioactive constituents in Flos Sophorae Immaturus and Cortex Fraxini by capillary electrophoresis in combination with far infrared-assisted solvent extraction. Food Chem. 2012, 130, 1122–1126. [Google Scholar] [CrossRef]
- Xu, J.; Zhang, H.; Chen, G. Carbon nanotube/polystyrene composite electrode for microchip electrophoretic determination of rutin and quercetin in Flos Sophorae Immaturus. Talanta 2007, 73, 932–937. [Google Scholar] [CrossRef]
- Zielińska, D.; Nagels, L.; Piskuła, M.K. Determination of quercetin and its glucosides in onion by electrochemical methods. Anal. Chim. Acta 2008, 617, 22–31. [Google Scholar] [CrossRef] [PubMed]
- Wang, M.Y.; Zhang, D.E.; Tong, Z.W.; Xu, X.Y.; Yang, X.J. Voltammetric behavior and the determination of quercetin at a flowerlike Co3O4 nanoparticles modified glassy carbon electrode. J. Appl. Electrochem. 2011, 41, 189–196. [Google Scholar] [CrossRef]
- Chaiyo, S.; Siangproh, W.; Apilux, A.; Chailapakul, O. Highly selective and sensitive paper-based colorimetric sensor using thiosulfate catalytic etching of silver nanoplates for trace determination of copper ions. Anal. Chim. Acta 2015, 866, 75–83. [Google Scholar] [CrossRef] [PubMed]
- Apyari, V.V.; Dmitrienko, S.G.; Gorbunova, M.V.; Furletov, A.A.; Zolotov, Y.A. Gold and silver nanoparticles in optical molecular absorption spectroscopy. J. Anal. Chem. 2019, 74, 21–32. [Google Scholar] [CrossRef]
- Hou, X.Y.; Chen, S.; Tang, J.; Long, Y.F. Visual determination of trace cysteine based on promoted corrosion of triangular silver nanoplates by sodium thiosulfate. Spectrochim. Acta A Mol. Biomol. Spectrosc. 2014, 125, 285–289. [Google Scholar] [CrossRef]
- Yang, X.-H.; Ling, J.; Peng, J.; Cao, Q.-E.; Ding, Z.-T.; Bian, L.-C. A colorimetric method for highly sensitive and accurate detection of iodide by finding the critical color in a color change process using silver triangular nanoplates. Anal. Chim. Acta 2013, 798, 74–81. [Google Scholar] [CrossRef] [PubMed]
- Jouyban, A.; Rahimpour, E. Optical sensors based on silver nanoparticles for determination of pharmaceuticals: An overview of advances in the last decade. Talanta 2020, 217, 121071. [Google Scholar] [CrossRef]
- Kappi, F.A.; Tsogas, G.Z.; Giokas, D.L.; Christodouleas, D.C.; Vlessidis, A.G. Colorimetric and visual read-out determination of cyanuric acid exploiting the interaction between melamine and silver nanoparticles. Microchim. Acta 2014, 181, 623–629. [Google Scholar] [CrossRef]
- Szilagyi, I.; Trefalt, G.; Tiraferri, A.; Maroni, P.; Borkovec, M. Polyelectrolyte adsorption, interparticle forces, and colloidal aggregation. Soft Matter 2014, 10, 2479–2502. [Google Scholar] [CrossRef] [Green Version]
- Terenteva, E.A.; Apyari, V.V.; Kochuk, E.V.; Dmitrienko, S.G.; Zolotov, Y.A. Use of silver nanoparticles in spectrophotometry. J. Anal. Chem. 2017, 72, 1138–1154. [Google Scholar] [CrossRef]
- Ortega, F.; Arce, V.B.; Garcia, M.A. Nanocomposite starch-based films containing silver nanoparticles synthesized with lemon juice as reducing and stabilizing agent. Carbohydr. Polym. 2021, 252, 117208. [Google Scholar] [CrossRef]
- Métraux, G.S.; Mirkin, C.A. Rapid thermal synthesis of silver nanoprisms with chemically tailorable thickness. Adv. Mater. 2005, 17, 412–415. [Google Scholar] [CrossRef]
- Teerasong, S.; Jinnarak, A.; Chaneam, S.; Wilairat, P.; Nacapricha, D. Poly(vinyl alcohol) capped silver nanoparticles for antioxidant assay based on seed-mediated nanoparticle growth. Talanta 2017, 170, 193–198. [Google Scholar] [CrossRef] [PubMed]
- Terenteva, E.A.; Apyari, V.V.; Dmitrienko, S.G.; Zolotov, Y.A. Formation of plasmonic silver nanoparticles by flavonoid reduction: A comparative study and application for determination of these substances. Spectrochim. Acta A Mol. Biomol. Spectrosc. 2015, 151, 89–95. [Google Scholar] [CrossRef] [PubMed]
- Frank, A.J.; Cathcart, N.; Maly, K.E.; Kitaev, V. Synthesis of silver nanoprisms with variable size and investigation of their optical properties: A first-year undergraduate experiment exploring plasmonic nanoparticles. J. Chem. Educ. 2010, 87, 1098–1101. [Google Scholar] [CrossRef]
- Firuzi, O.; Lacanna, A.; Petrucci, R.; Marrosu, G.; Saso, L. Evaluation of the antioxidant activity of flavonoids by «ferric reducing antioxidant power» assay and cyclic voltammetry. Biochim. Biophys. Acta (BBA) Gen. Subj. 2005, 1721, 174–184. [Google Scholar] [CrossRef]
- Volikakis, G.J.; Efstathiou, C.E. Determination of rutin and other flavonoids by flow-injection/adsorptive stripping voltammetry using nujol-graphite and diphenylether-graphite paste electrodes. Talanta 2000, 51, 775–785. [Google Scholar] [CrossRef]
- Yan, Y.; Li, L.; Zhang, H.; Du, F.; Meng, Y.; Shuang, S.; Wang, R.; Song, S.; Dong, C. Carbon dots for ratiometric fluorescence detection of morin. Spectrochim. Acta A Mol. Biomol. Spectrosc. 2021, 256, 119751. [Google Scholar] [CrossRef]
- Soylak, M.; Ozdemir, B.; Yilmaz, E. An environmentally friendly and novel amine-based liquid phase microextraction of quercetin in food samples prior to its determination by UV-Vis spectrophotometry. Spectrochim. Acta A Mol. Biomol. Spectrosc. 2020, 243, 118806. [Google Scholar] [CrossRef]
- Sinduja, B.; John, S.A. Sensitive determination of rutin by spectrofluorimetry using carbon dots synthesized from a non-essential amino acid. Spectrochim. Acta A Mol. Biomol. Spectrosc. 2018, 193, 486–491. [Google Scholar] [CrossRef]


| Chemical Name | MW, g mol−1 | Structure | lgP a | E0 b, V |
|---|---|---|---|---|
| Chrysin | 254.241 | 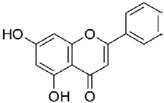 | 2.88 | 1.0 (pH 7) |
| Morin | 302.238 | 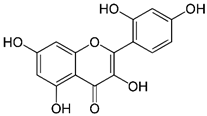 | 1.61 | 0.25 (pH 7) |
| Naringenin | 272.256 | 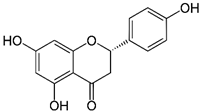 | 3.19 | 0.89 (pH 3.6) |
| Naringin | 580.540 | 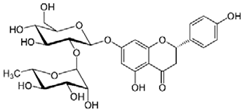 | 2.73 | 0.39 (pH 5) |
| Quercetin | 302.236 |  | 2.07 | 0.23 (pH 7.4) |
| Rutin | 610.521 | 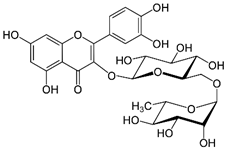 | 1.95 | 0.26 (pH 7.4) |
| Taxifolin | 304.254 |  | 1.82 | 0.22 (pH 7.4) |
| Analyte | Calibration Curve Equation (c, μM) | LOD, μM | Determination Range, µM | RSD a, % | RSD b, % |
|---|---|---|---|---|---|
| Morin | ΔA = 0.0222·c (r2 = 0.997) | 0.9 | 3–120 | 3 | 10 |
| Rutin | ΔA = 0.0173·c (r2 = 0.999) | 1.2 | 4–120 | 3 | 10 |
| Quercetin | ΔA = 0.0174·c (r2 = 0.994) | 1.2 | 4–120 | 3 | 10 |
| Taxifolin | ΔA = 0.0099·c (r2 = 0.995) | 2.0 | 6–120 | 4 | 11 |
| Analyte | Sample | Present Method | Alternative Method a | ||
|---|---|---|---|---|---|
| Found | RSD, % | Found | RSD, % | ||
| Quercetin | Onion peel | (38 ± 5) mg g−1 | 5.3 | (44 ± 3) mg g−1 | 2.7 |
| Hawthorn tincture | (6.0 ± 0.9) mg L−1 | 6.0 | (6.3 ± 0.5) mg L−1 | 3.2 | |
| Calendula tincture | (17 ± 2) mg L−1 | 4.7 | (18 ± 1) mg L−1 | 2.2 | |
| Rutin | Ascorutin drug | (145 ± 15) mg g−1 | 4.2 | (151 ± 9) mg g−1 | 2.4 |
| Analyte | Method | LOD, μM | Determination Range, μM | Reference |
|---|---|---|---|---|
| Morin | Diffuse reflectance spectroscopy | 17 | 53–330 | [2] |
| Fluorimetry | 0.3 | 14.5–32.5 | [38] | |
| Present method | 0.9 | 3–120 | This study | |
| Quercetin | Diffuse reflectance spectroscopy | 8 | 25–330 | [2] |
| Spectrophotometry | 0.23 | - | [39] | |
| Present method | 1.2 | 4–120 | This study | |
| Rutin | Fluorimetry | 0.2 | 0.5–15 | [40] |
| Present method | 1.2 | 4–120 | This study | |
| Taxifolin | Diffuse reflectance spectroscopy | 46 | 142–330 | [2] |
| Present method | 2.0 | 6–120 | This study |
Publisher’s Note: MDPI stays neutral with regard to jurisdictional claims in published maps and institutional affiliations. |
© 2022 by the authors. Licensee MDPI, Basel, Switzerland. This article is an open access article distributed under the terms and conditions of the Creative Commons Attribution (CC BY) license (https://creativecommons.org/licenses/by/4.0/).
Share and Cite
Furletov, A.; Apyari, V.; Garshev, A.; Dmitrienko, S.; Zolotov, Y. Fast and Sensitive Determination of Bioflavonoids Using a New Analytical System Based on Label-Free Silver Triangular Nanoplates. Sensors 2022, 22, 843. https://doi.org/10.3390/s22030843
Furletov A, Apyari V, Garshev A, Dmitrienko S, Zolotov Y. Fast and Sensitive Determination of Bioflavonoids Using a New Analytical System Based on Label-Free Silver Triangular Nanoplates. Sensors. 2022; 22(3):843. https://doi.org/10.3390/s22030843
Chicago/Turabian StyleFurletov, Aleksei, Vladimir Apyari, Alexey Garshev, Stanislava Dmitrienko, and Yury Zolotov. 2022. "Fast and Sensitive Determination of Bioflavonoids Using a New Analytical System Based on Label-Free Silver Triangular Nanoplates" Sensors 22, no. 3: 843. https://doi.org/10.3390/s22030843
APA StyleFurletov, A., Apyari, V., Garshev, A., Dmitrienko, S., & Zolotov, Y. (2022). Fast and Sensitive Determination of Bioflavonoids Using a New Analytical System Based on Label-Free Silver Triangular Nanoplates. Sensors, 22(3), 843. https://doi.org/10.3390/s22030843