1. Introduction
Spectral imaging allows spectral information to be acquired across the electromagnetic spectrum [
1]. While an ordinary camera can only capture light in the visible spectrum, spectral imaging can capture the infrared region of the EM spectrum, visible spectrum, ultraviolet, and x-rays, as well as different combinations of the four. Spectral imaging is divided into different categories depending upon the number of spectral bands used, the width of the spectral bands and the gaps between them, and the spectral resolution. These abstractly defined categories are known as Multi-Spectral Imaging (MSI) and Hyper-Spectral Imaging (HSI). MSI generally collects spectral data from up to ten different generally noncontiguous bands, while HSI collects spectral data from hundreds of bands with a high spectral resolution. The use of spectral imaging was first proposed in 1985 by Goetz [
2] for remote sensing of Earth. Currently, spectral imaging is being used in many different areas of scientific research and engineering applications. Satellite-based remote sensing [
3], agriculture [
4], the defense industry [
5], medical diagnostics [
6], and food inspection [
7] are just a few examples of situations in which the use of spectral imaging is very popular. Diffusely reflected EM waves contain specific object signatures depending upon the temperature and material of the reflecting surfaces in the scene [
8]. In other applications, reflected signatures are captured by a camera and then fed into a Machine Learning (ML) algorithm to detect and classify the objects present in the scene [
9].
A common problem with imaging technology is that optical sensors have a much lower dynamic range (DR) than real-world scenes [
10]. Theoretically, the DR of a camera is defined as the ratio between the highest and lowest intensities that the camera can record. However, it is practically impossible to use the whole DR as per the definition–the low-intensity values have a very poor signal-to-noise ratio (SNR). It is necessary to define a minimum acceptable SNR for individual applications; this is known as ‘foot-room’ [
11]. A common approach to solving this problem is using multiple exposures of the same scene. This multi-exposure approach was first developed in the late 80s [
12,
13] and early 90s [
14]. Since then, the multi-exposure method has been widely used to increase the DR of imaging to produce more visually realistic images [
15,
16,
17,
18,
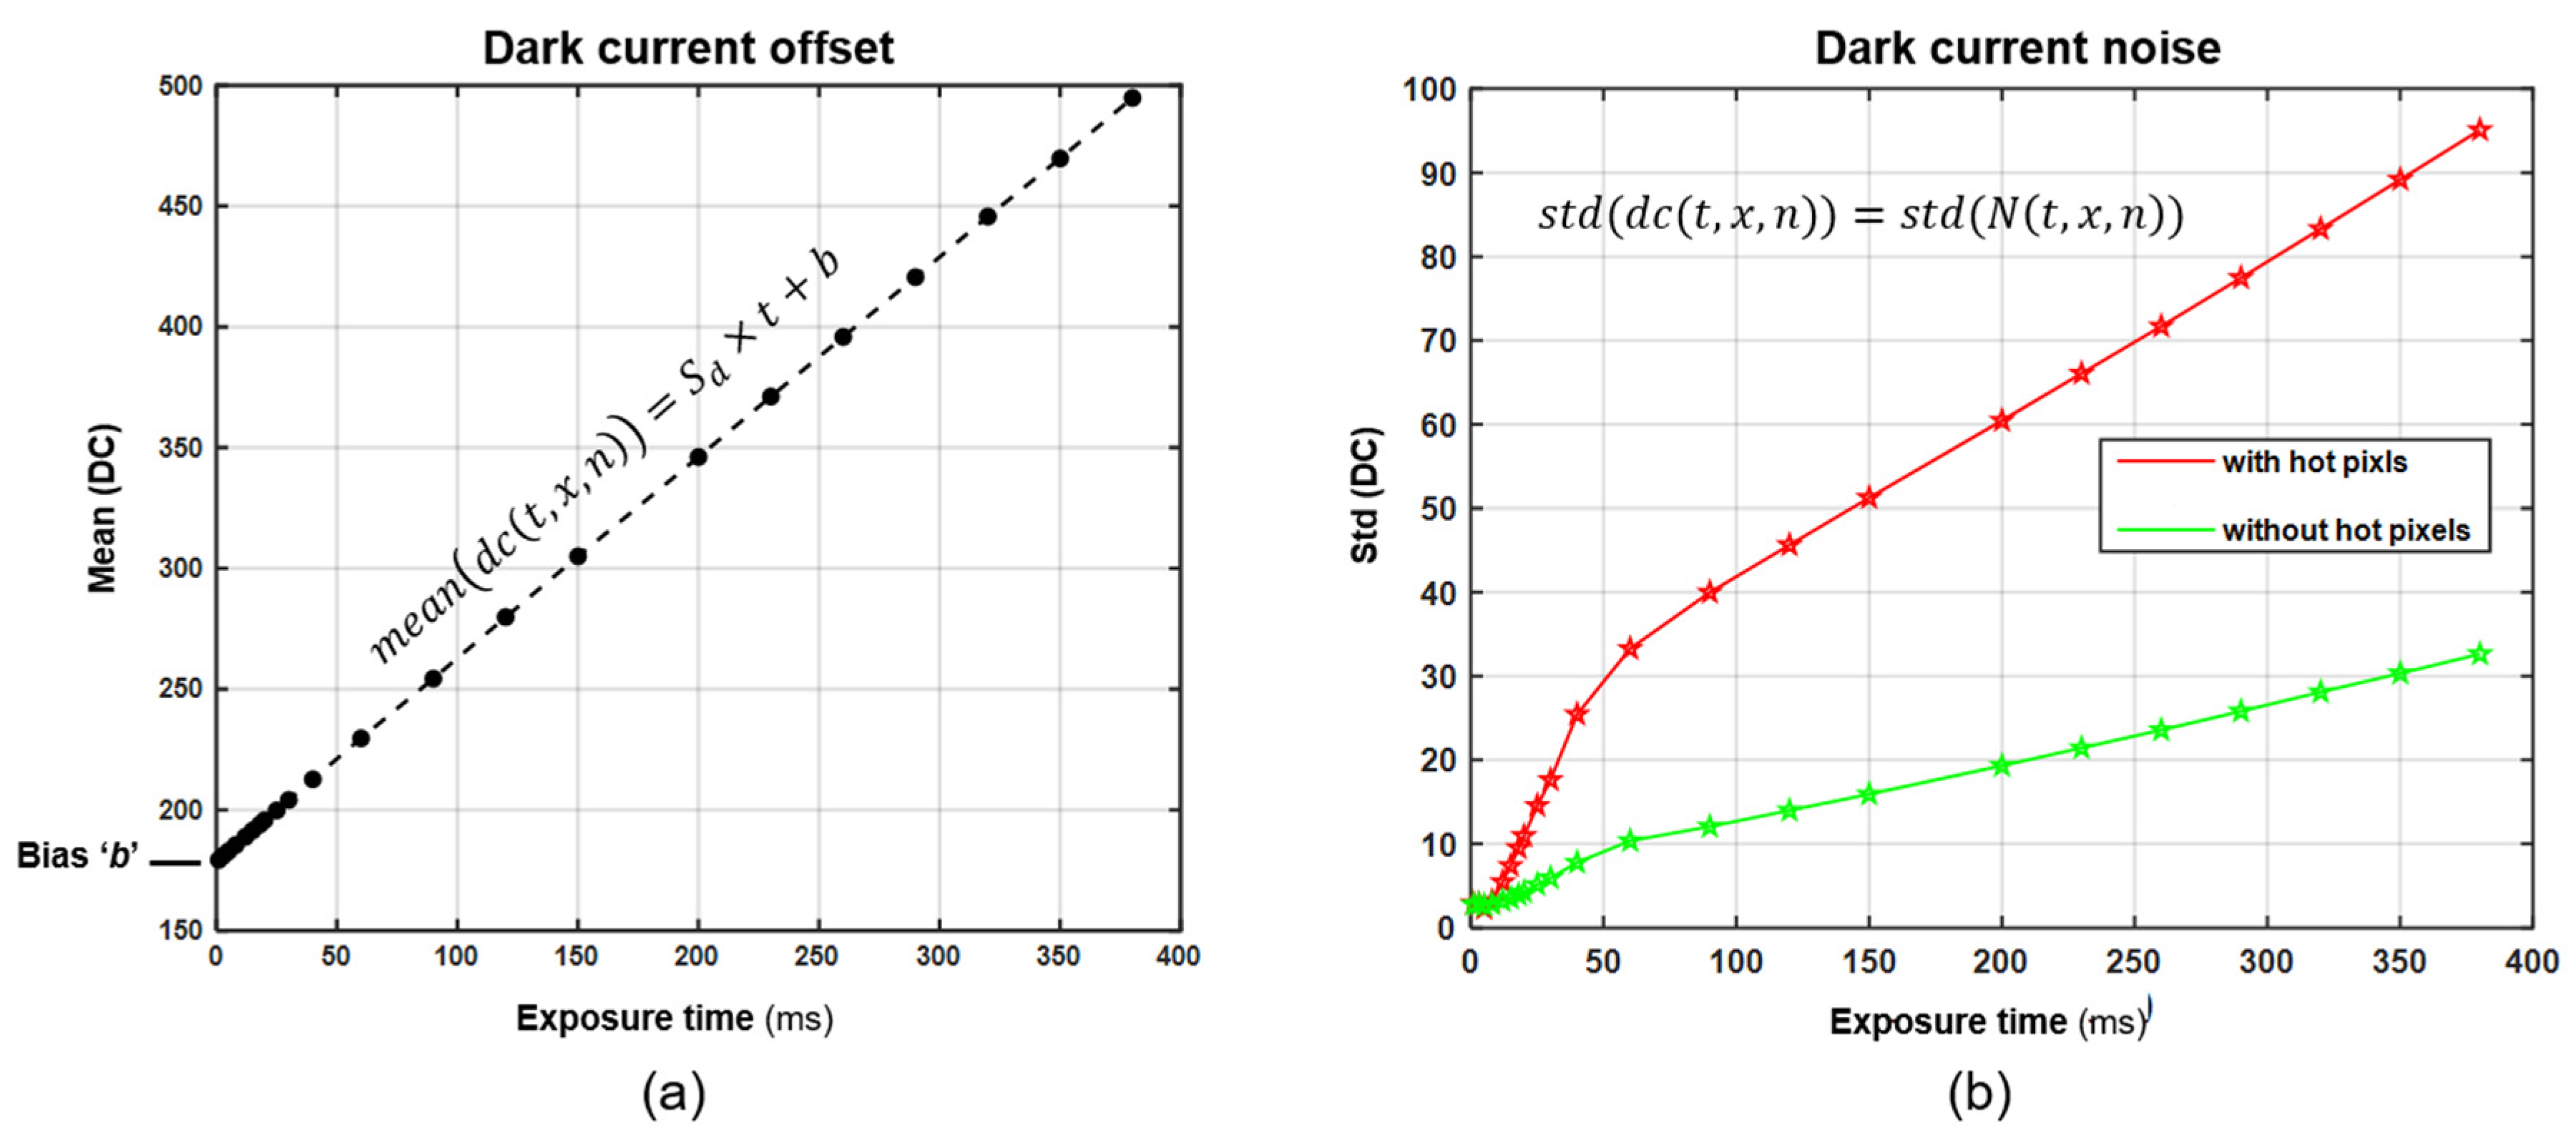
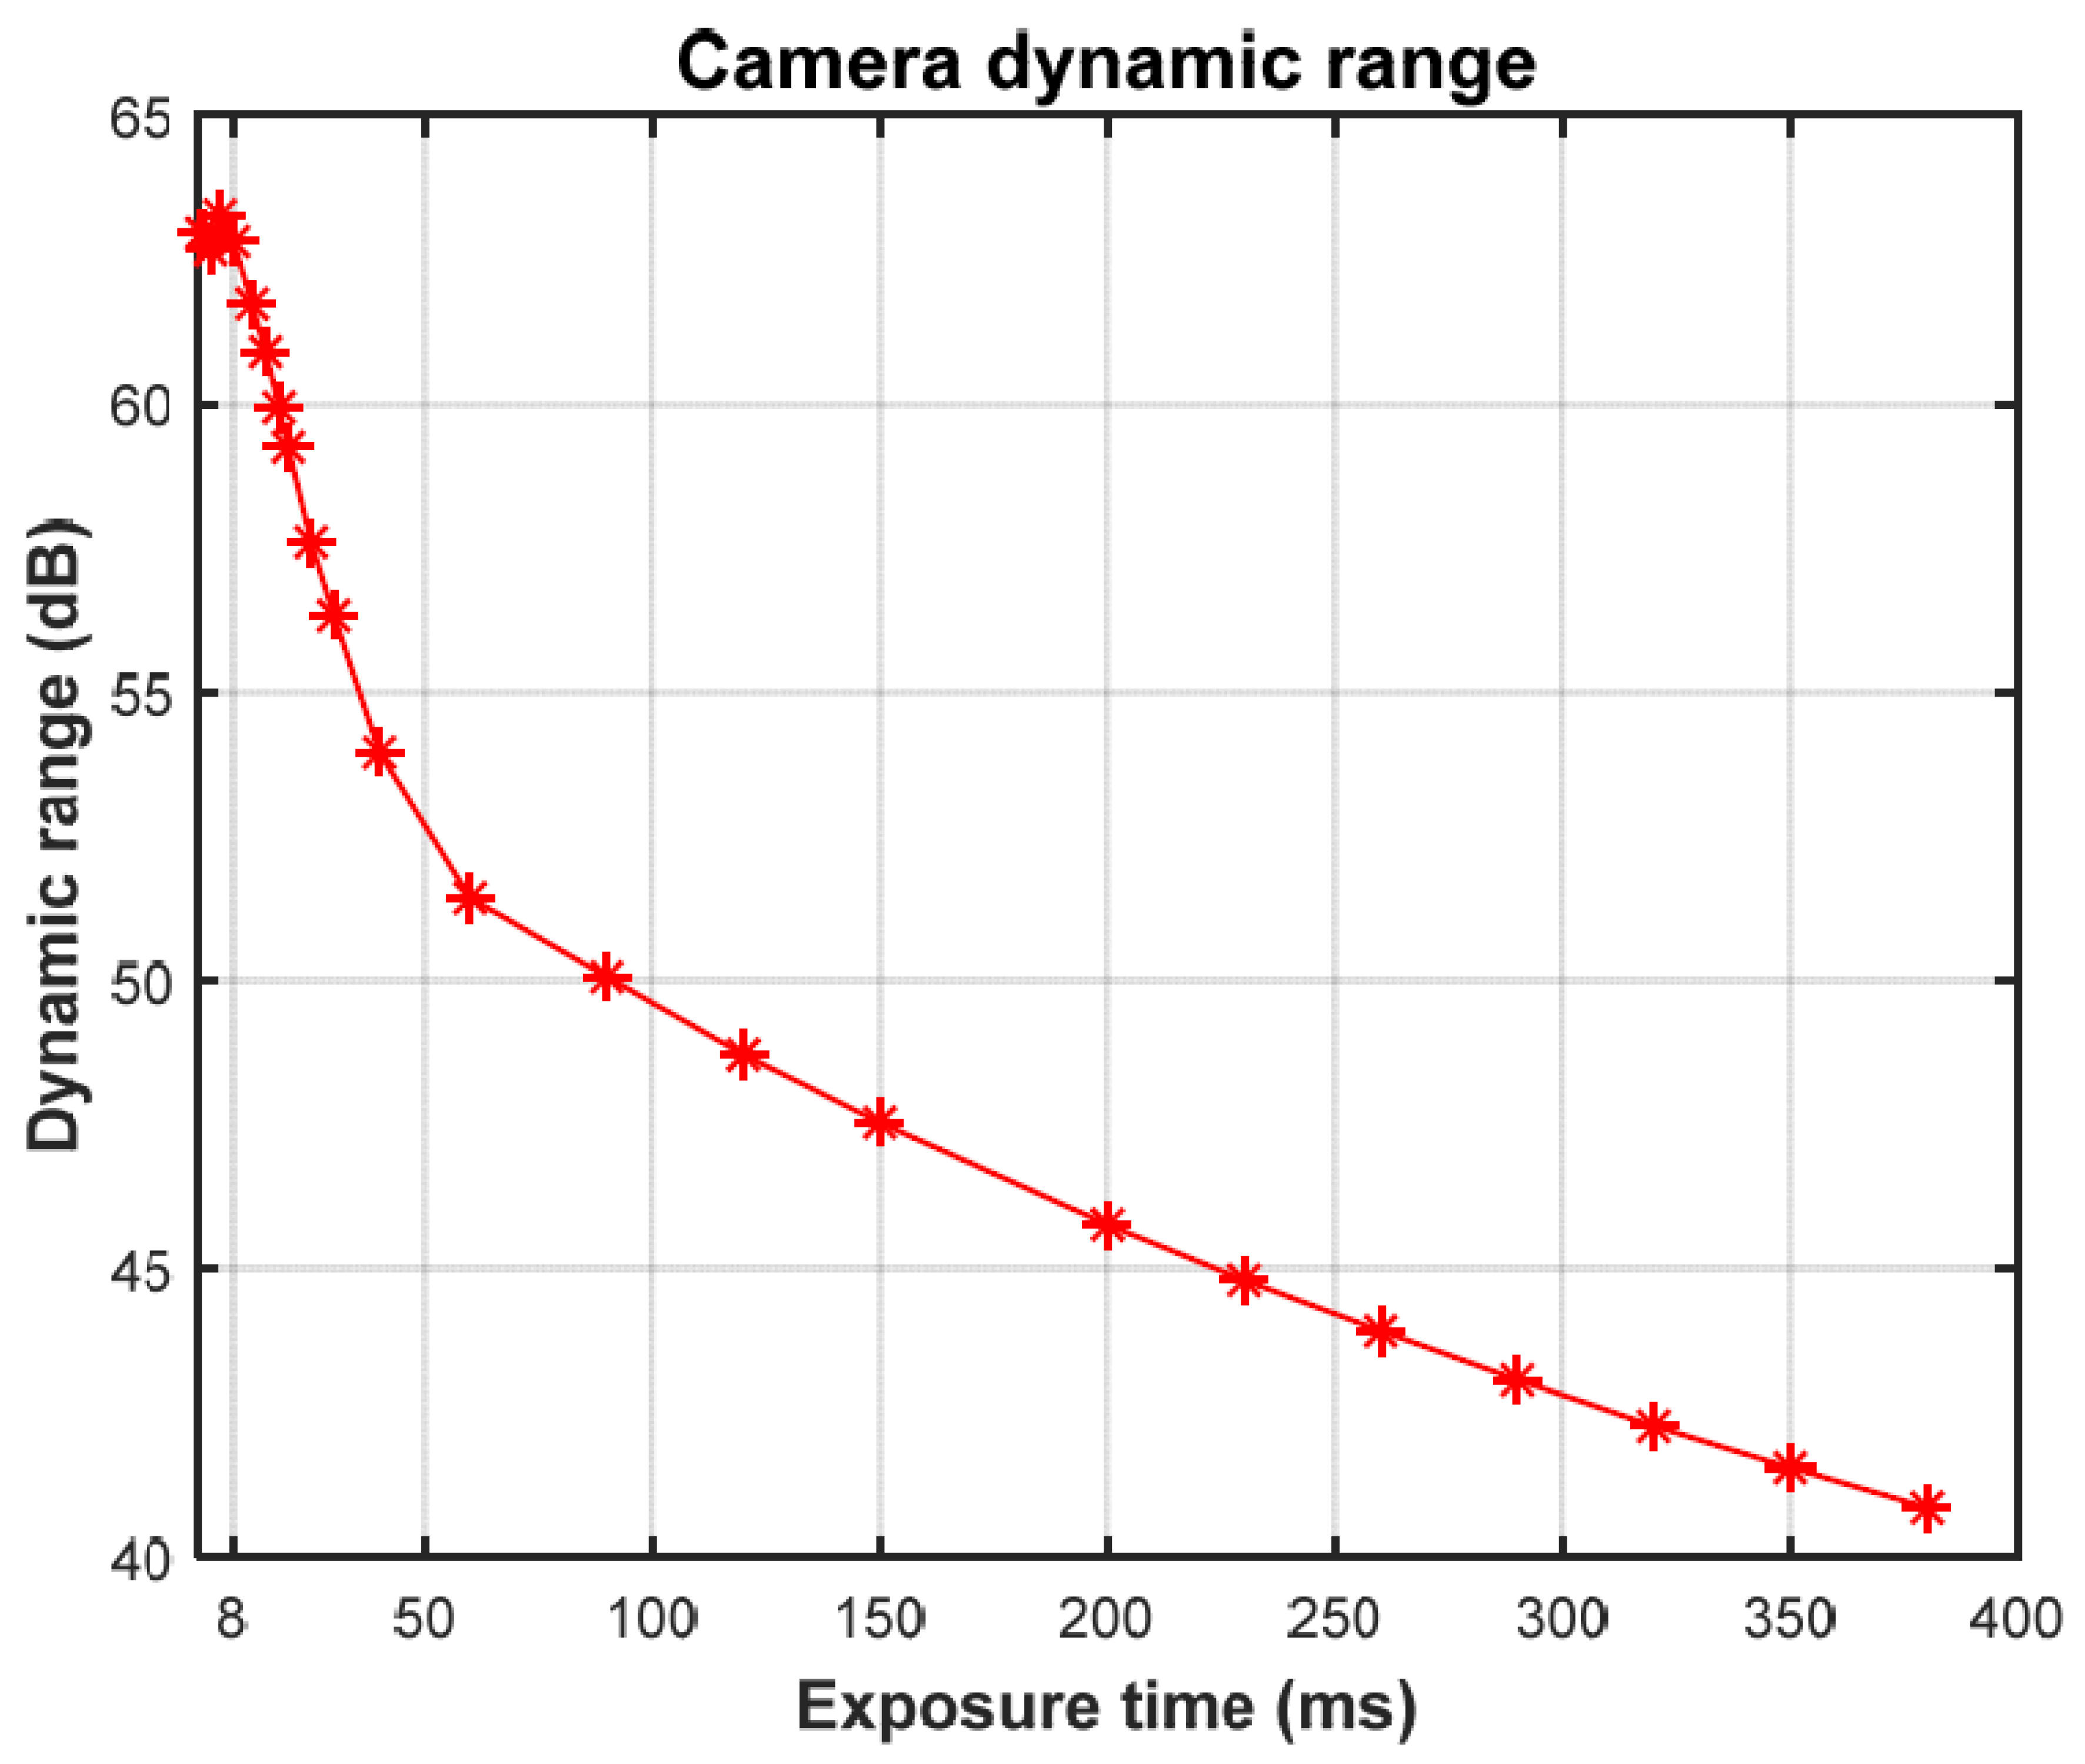
19]. Previous studies report the use of the multi-exposure method in visible spectrum imaging where CCD or CMOS silicon-based photodetectors are used. For short-wave infrared (SWIR) imaging, indium gallium arsenide (InGaAs) sensors are used. InGaAs cameras typically have spectral ranges from 900 to 1700 nm but can be sensitive up to 2500 nm. InGaAs photodetectors have their own drawbacks that mean they are generally incapable of high-precision low-light imaging. These limitations are ‘read noise’ and ‘dark current’ (DC). Read noise is the fundamental uncertainty in measurement, and DC is the exposure time and temperature-dependent thermal phenomena generated by the spontaneous movements of electrons. InGaAs-based cameras use Peltier cooling modules to minimize DC; however, the order of magnitude of the noise sources in InGaAs sensors is much higher than the usual levels for silicon-based cameras. As exposure time increases, DC increases linearly and occupies more of the remaining DR of the SWIR camera.
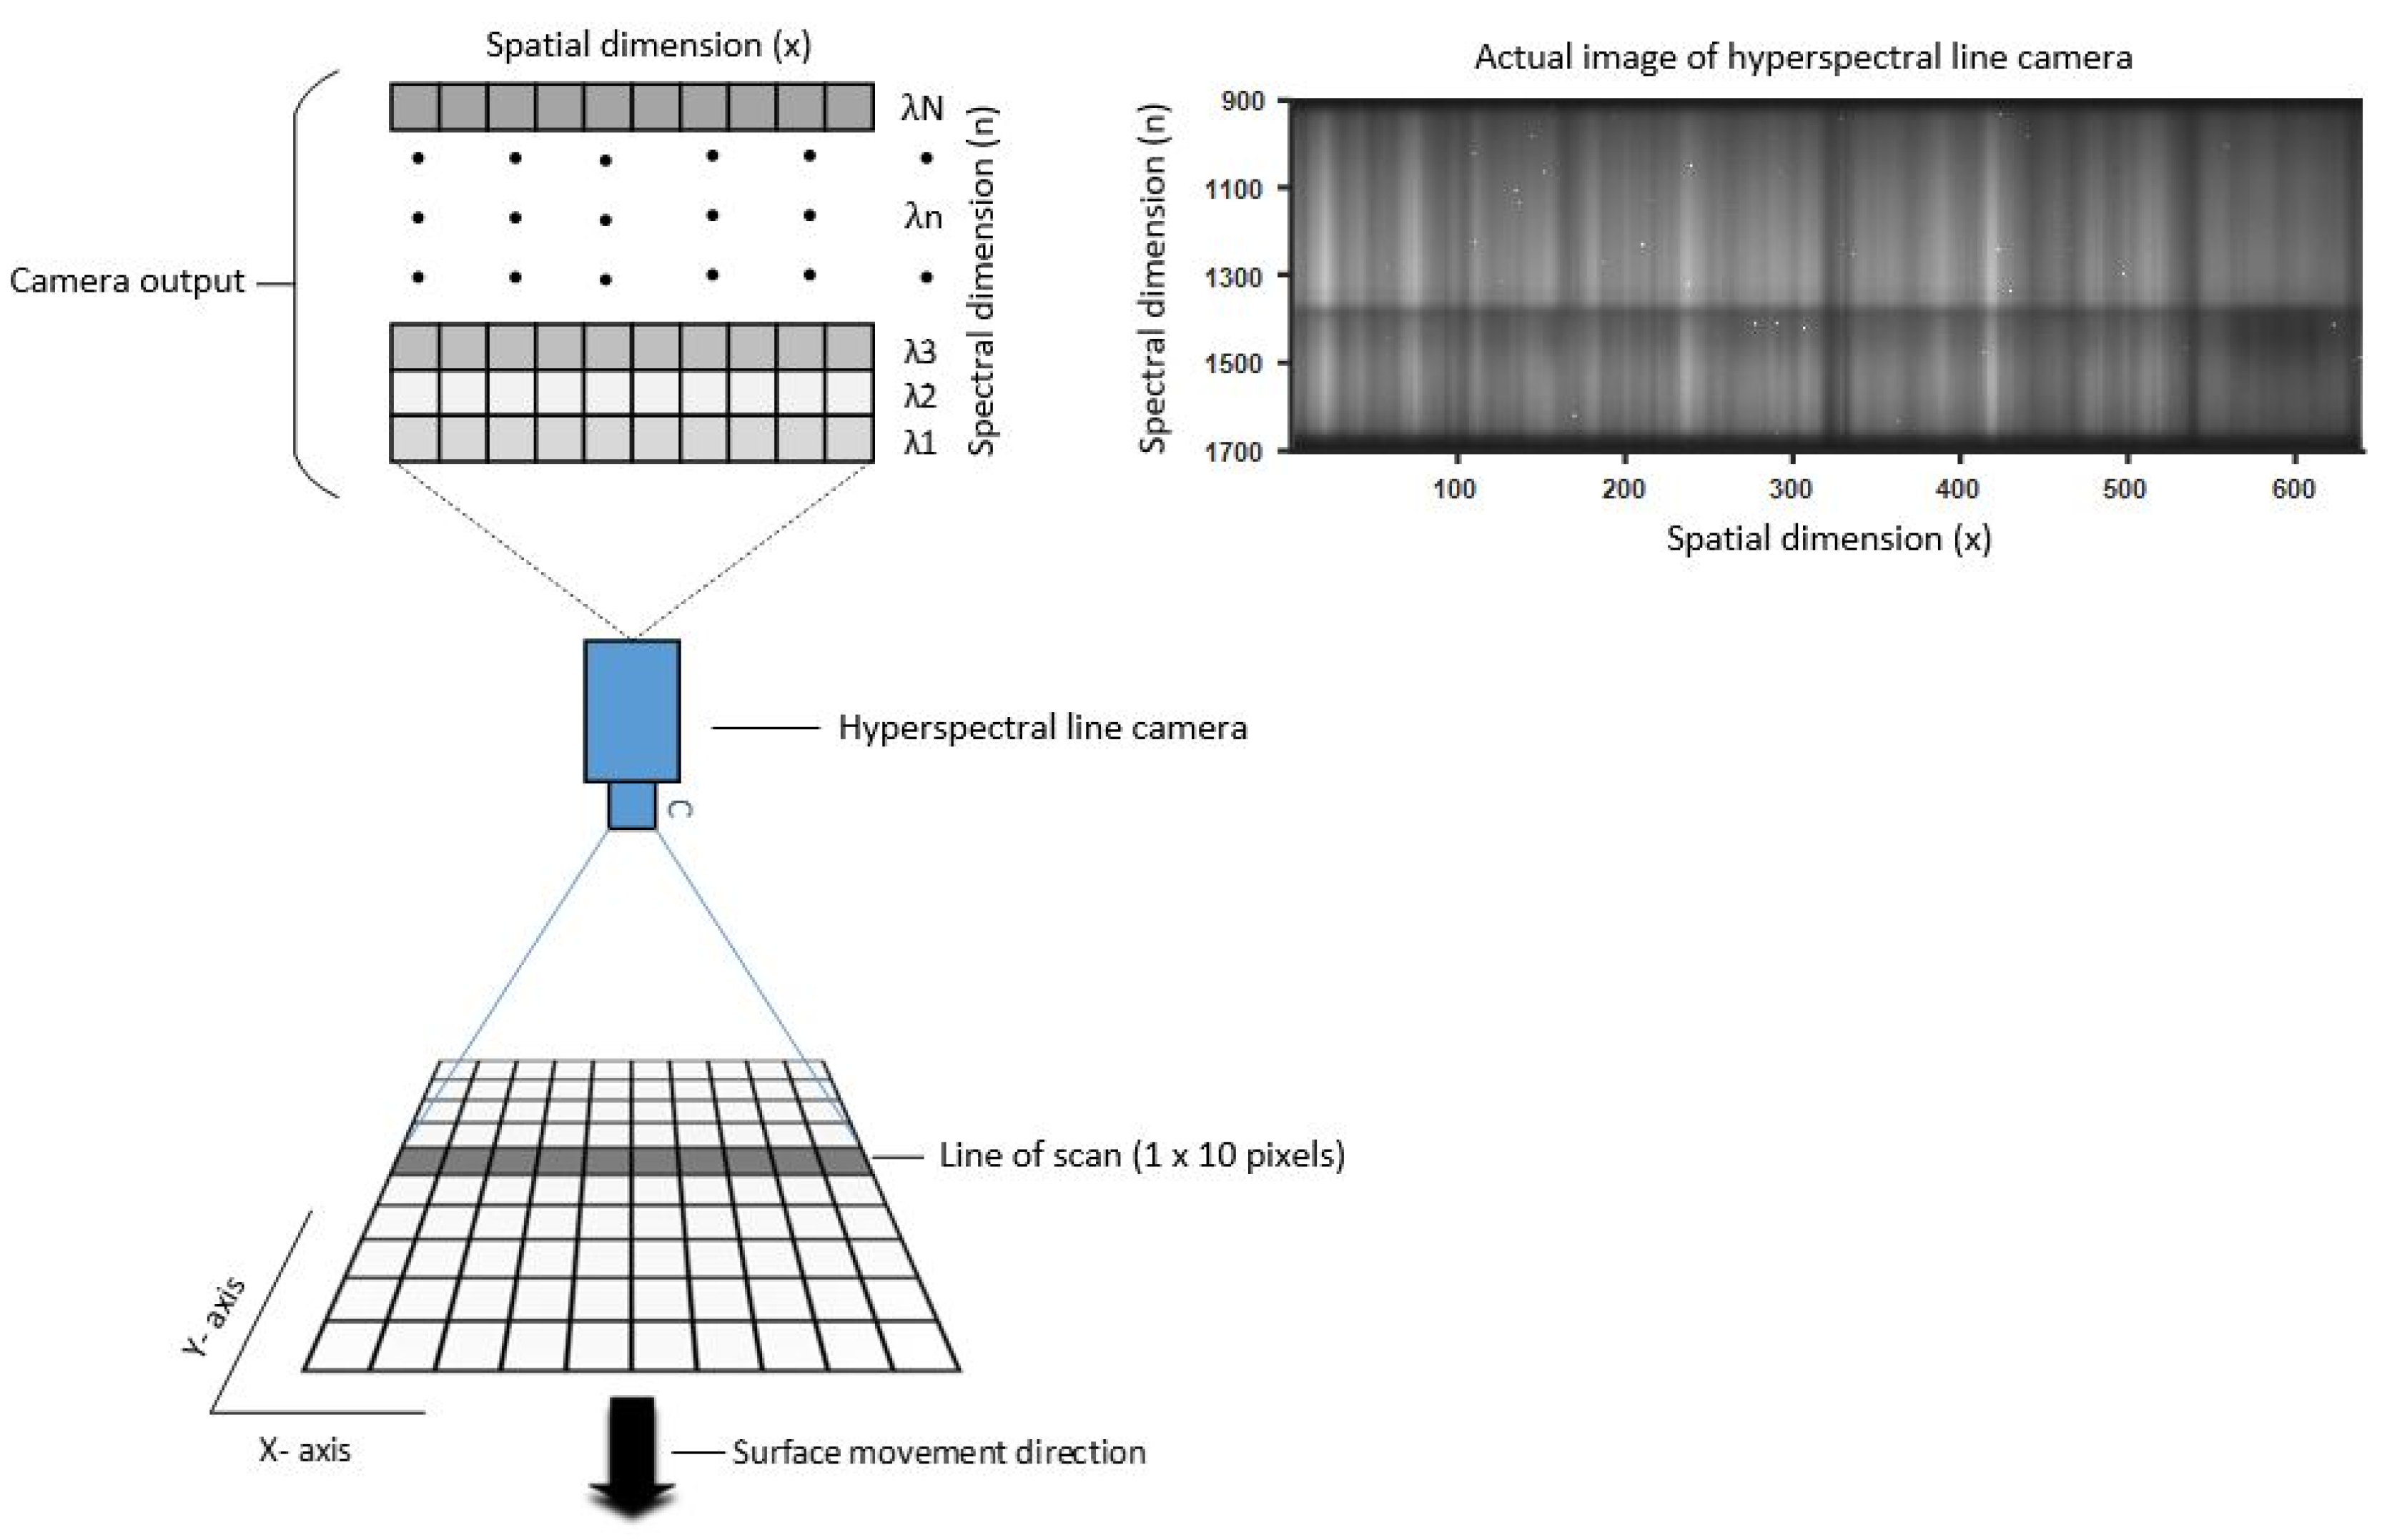
Figure 1 depicts how a hyperspectral line camera reads a signal from a surface or material. For each imaging shot, the camera reads a scan line and sends the data to a PC. To scan a whole surface, either the camera or the object being scanned (here along the
y-axis) must be able to move.
In this article, we argue that the widely known multi-exposure approach can be adapted for InGaAs-based hyperspectral line cameras to increase the DR of hyperspectral SWIR imaging. The aim is to improve the SNR of low-intensity measurements in the presence of DC while avoiding saturation at high intensities. Unlike existing multi-exposure fusion algorithms, the proposed algorithm incorporates DC modeling, which cannot be ignored for InGaAs-based sensors. We also include a criterion for measurements to have a minimum SNR. This criterion defines the foot-room for all measurements. Any signal below the foot-room has an SNR that is too low to be considered reliable. This foot-room is non-usable space in the DR. The usable DR beyond the foot-room and up to the saturation level is referred to in this paper as ‘effective DR’.
In the next section, we present the materials and methods used in this work, followed by the results and discussion. The paper ends with a conclusion and list of references.
3. Results and Analysis
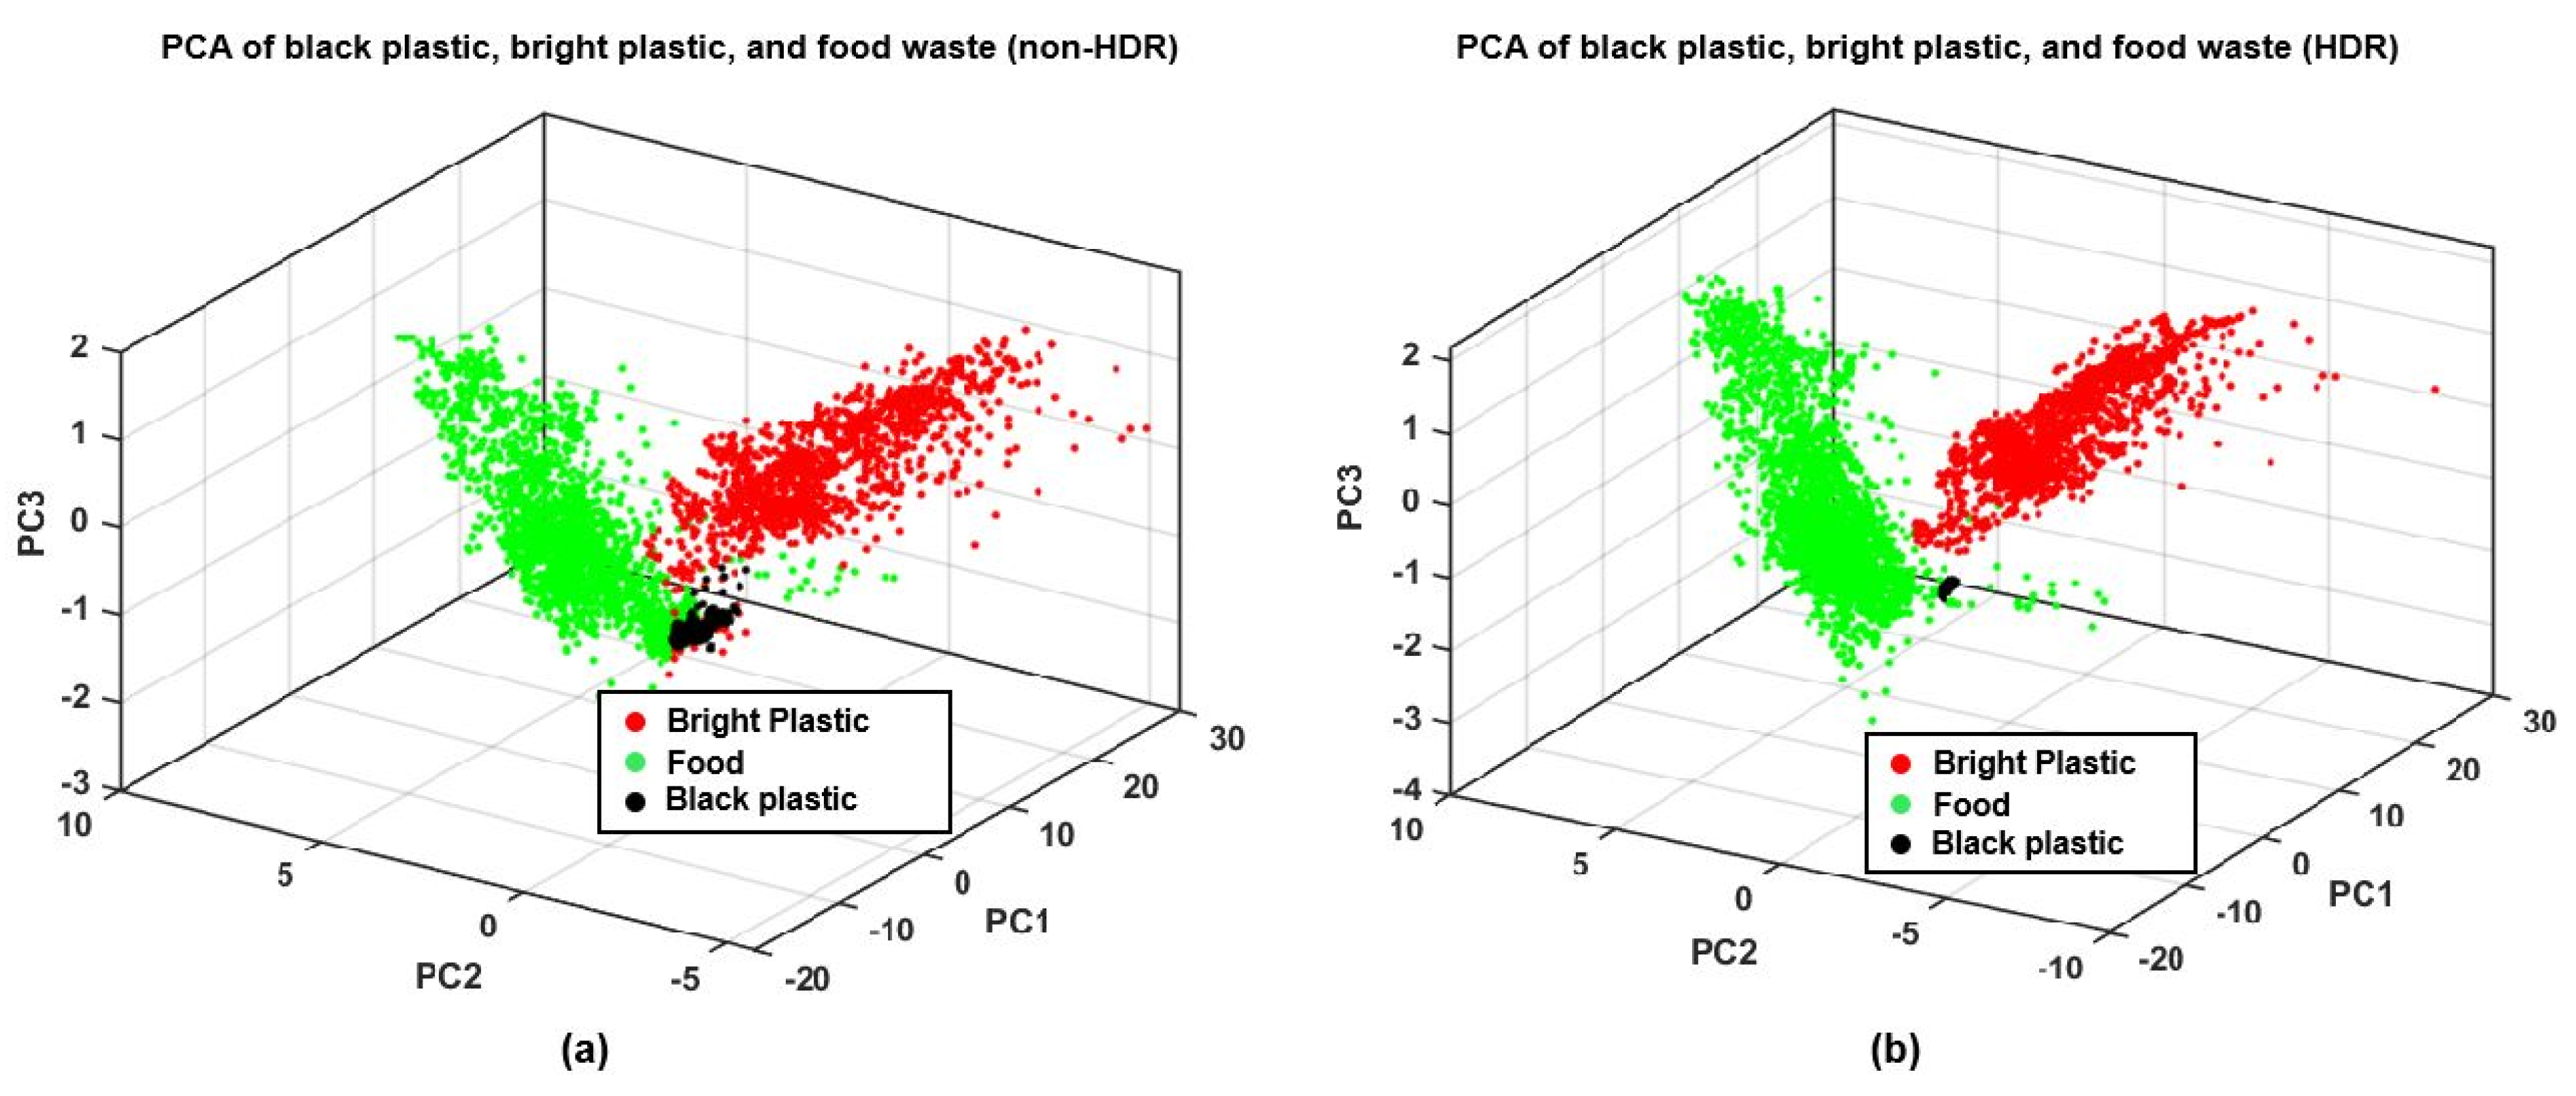
For test case 1, PCA of food and plastic measurements was performed for both HDR and non-HDR data. For the PCA shown in
Figure 11, the black plastic and bright plastic classes were treated separately for visualizing data clusters. The plastic collected from the waste for sampling had small traces of decomposed food, and the food samples may also have had some impurities, so 5% of outlying data were removed from all three classes.
Figure 11a shows the PCA of the non-HDR data, and
Figure 11b shows the PCA of the HDR data.
For the training and testing of classifiers, both plastic classes were treated as a single plastic class. However, we kept track of the plastic classes to later analyze which is more prone to be wrongly classified as food waste. Approximately 80% of the randomly mixed data vectors for all three classes from the PCAs shown in
Figure 11 were used to train two SVM classifiers–one for non-HDR data and one for HDR data. Approximately 20% of the randomly mixed data vectors were used to test the classifiers.
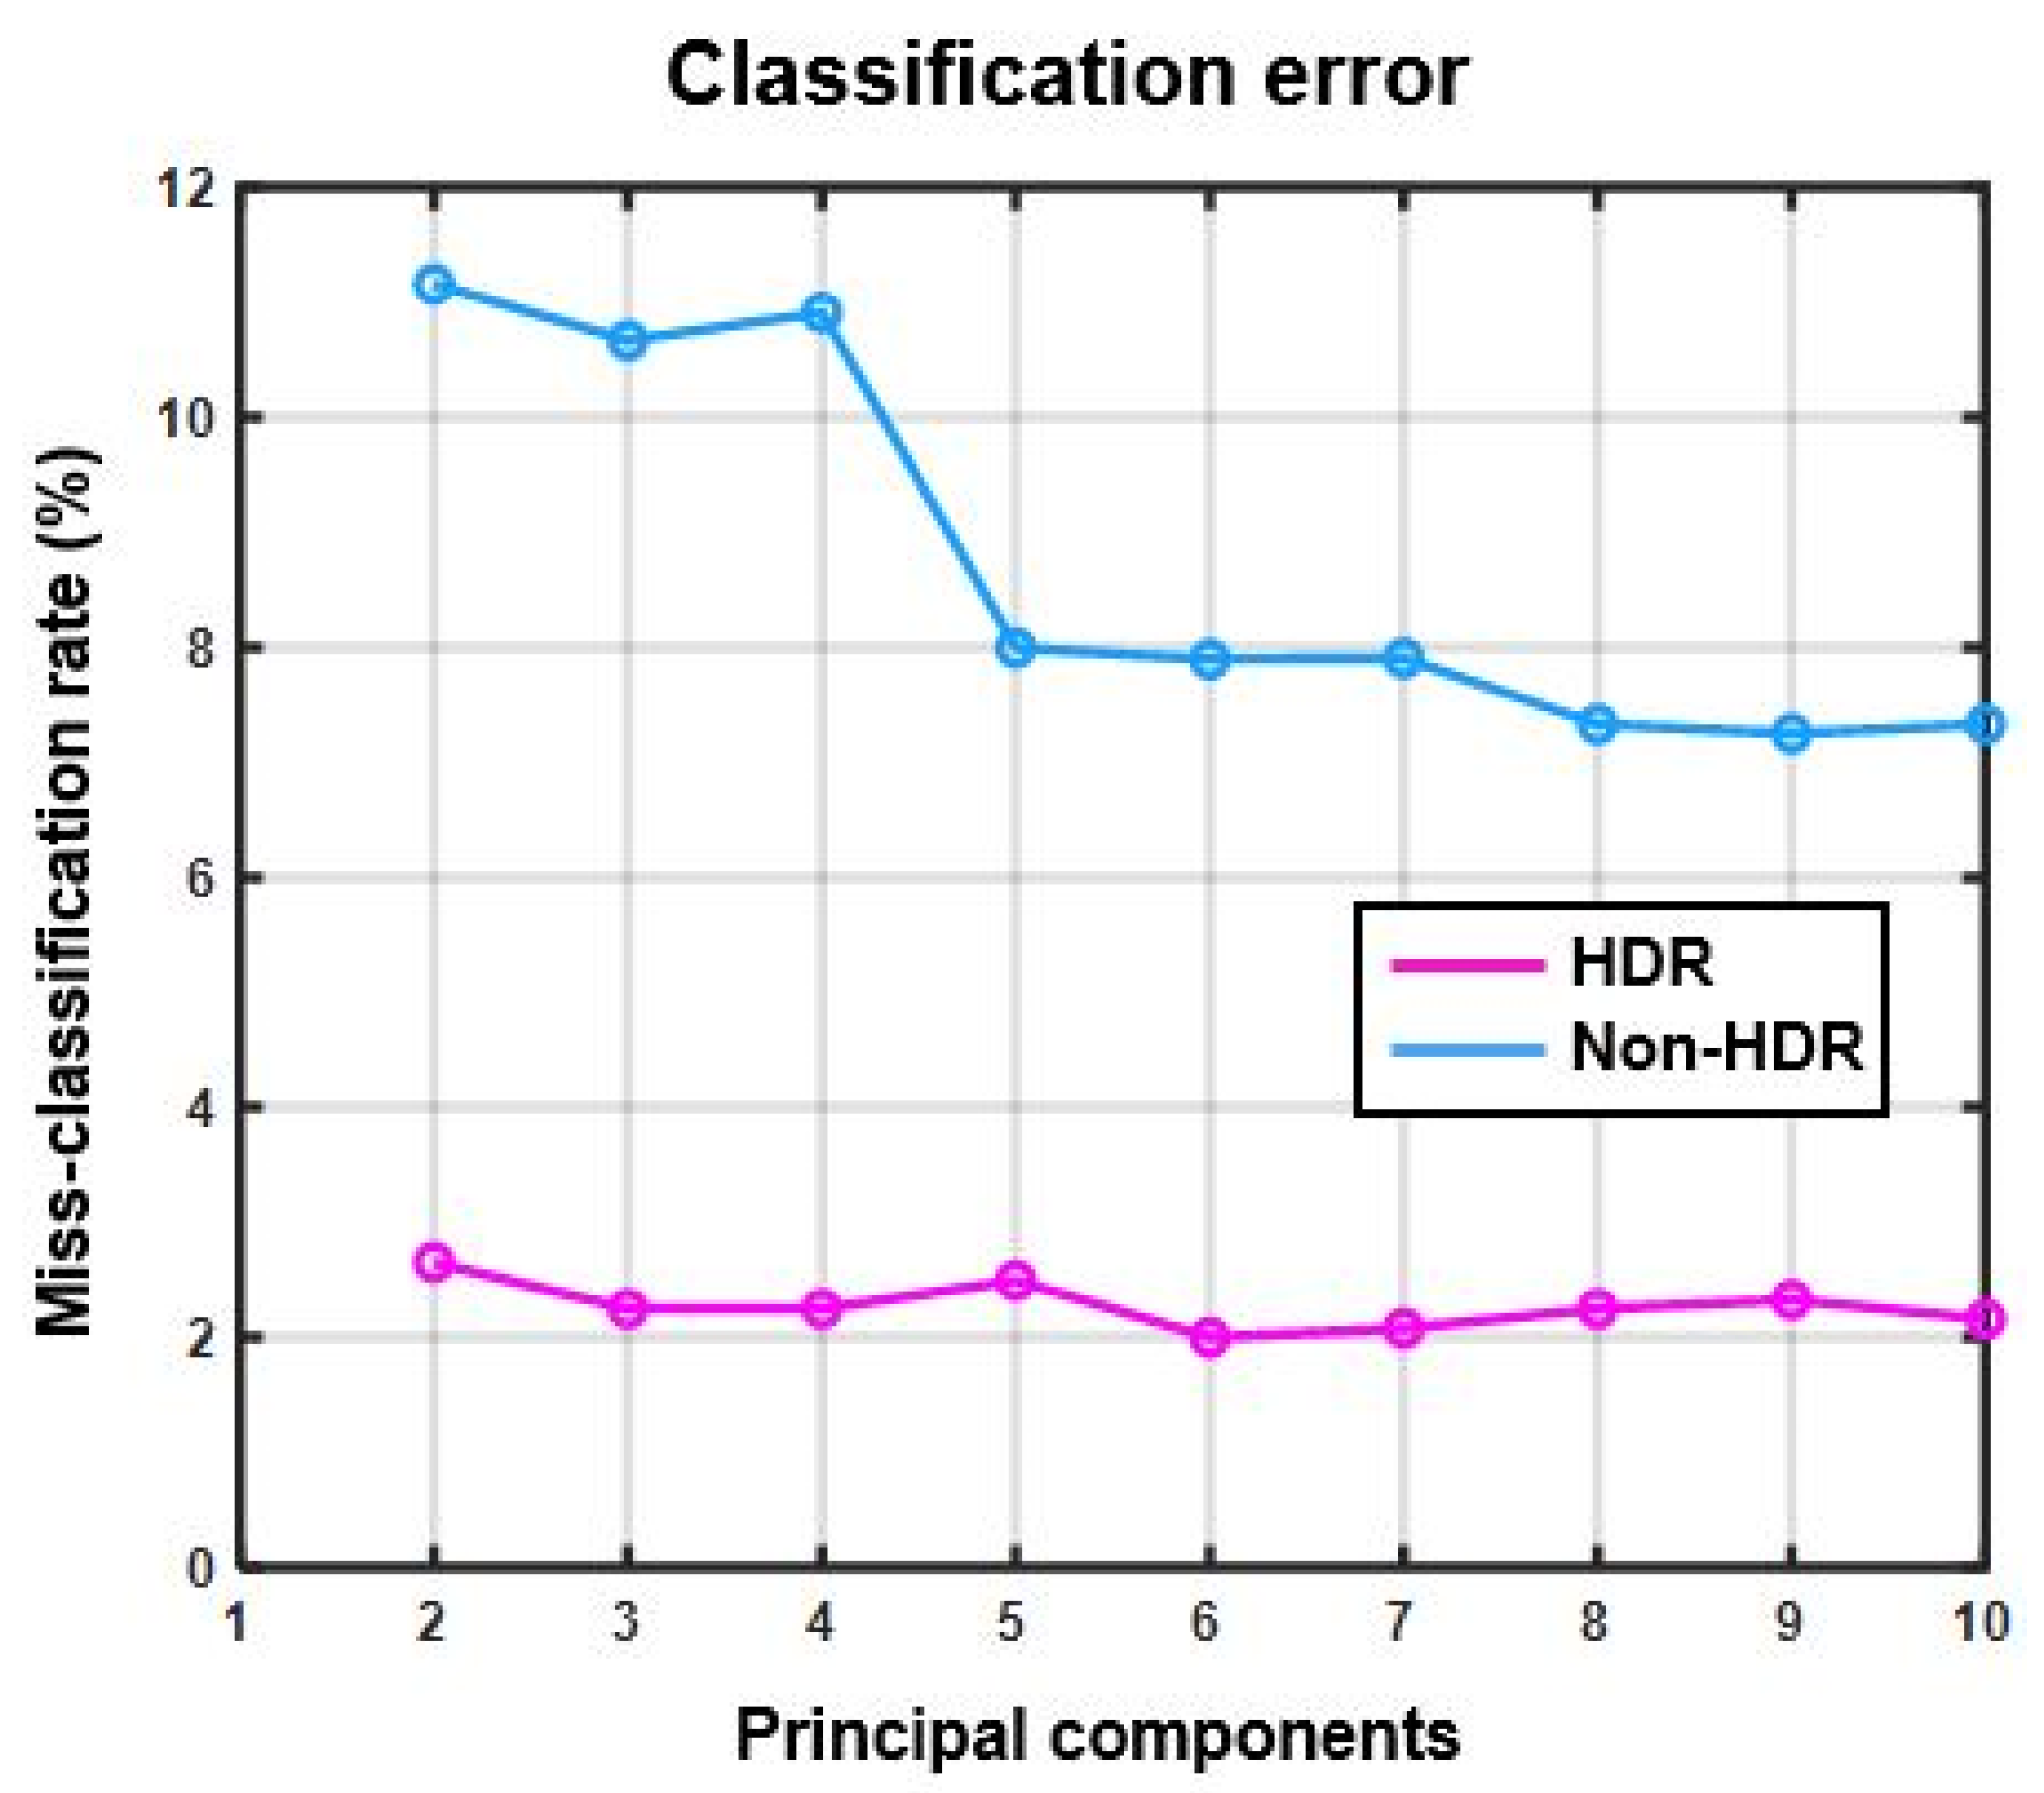
Figure 12 shows the miss-classification rate of SVM classifiers for both non-HDR and HDR data with respect to the increasing number of principal components added as inputs to the classifiers.
Figure 12 shows the percentage of plastic wrongly classified as food waste or vice versa, but it does not provide any information on how much the black or bright plastics contribute to the overall error rate individually. In
Table 6, confusion matrices are presented to show the results of classifiers for non-HDR and HDR data with three, four, and five principal components. In the confusion matrices, it is possible to see the exact number of black or bright plastics that were wrongly classified as food waste and vice versa.
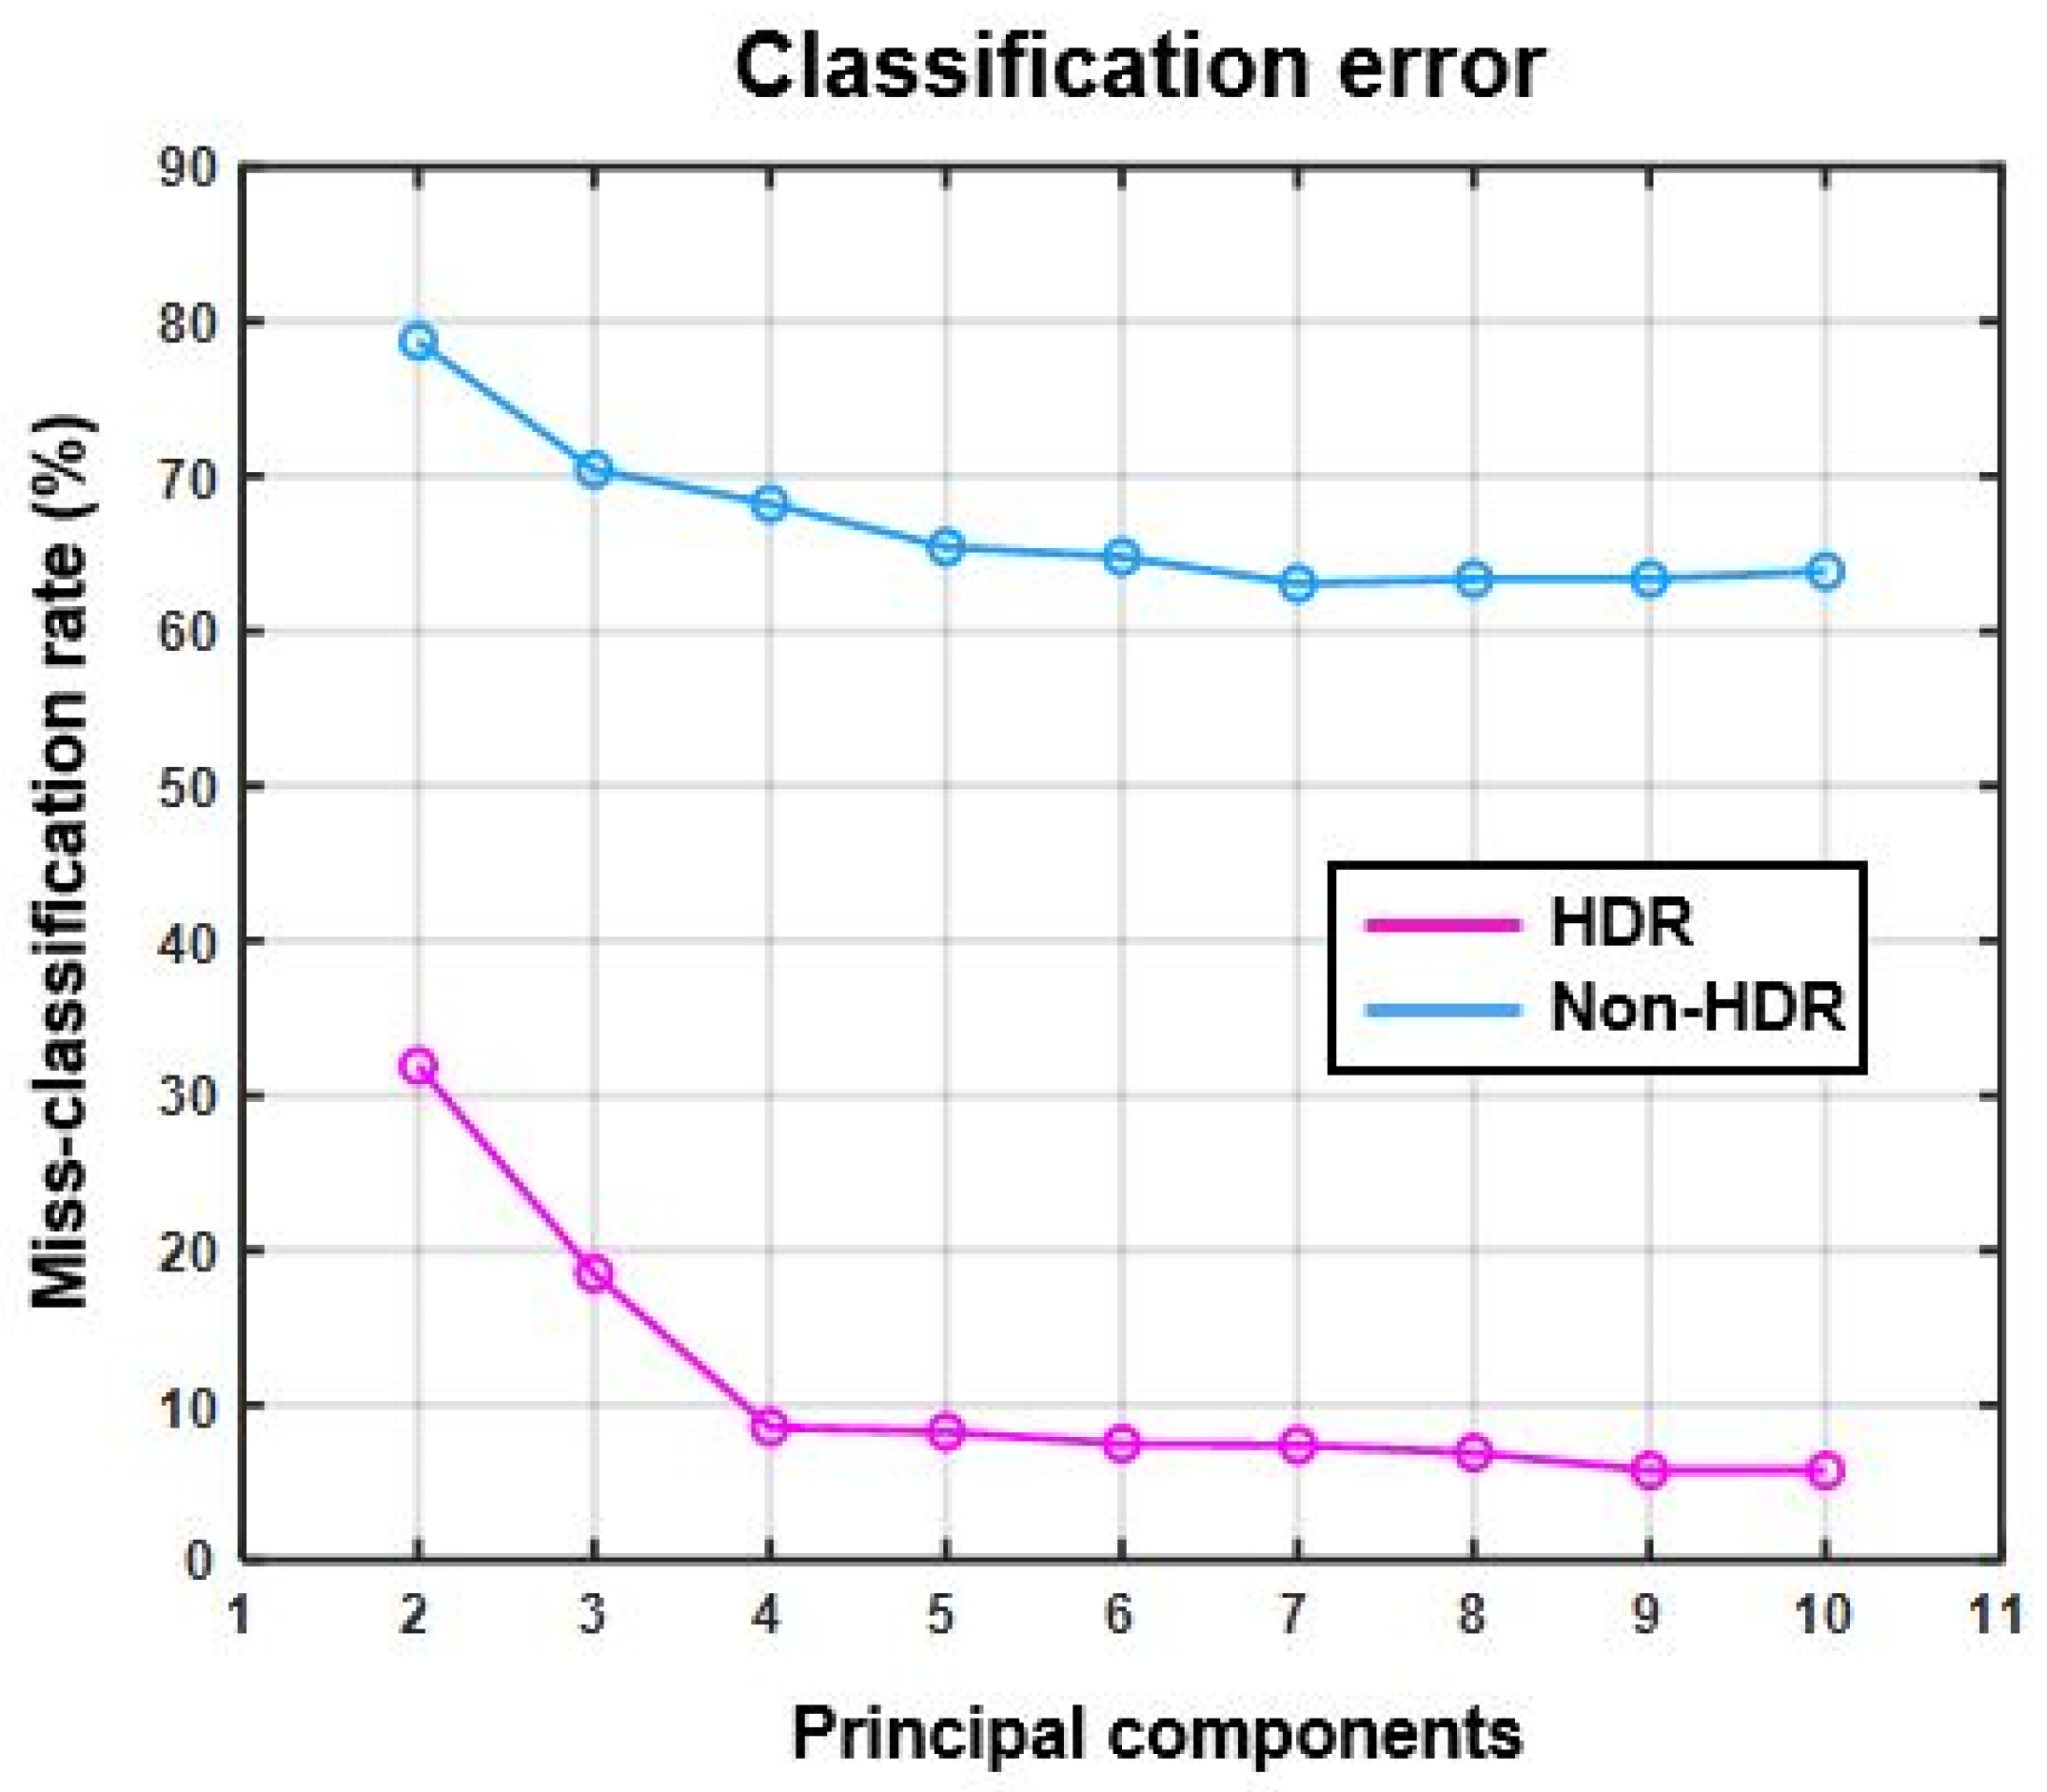
Figure 13 shows the misclassification rate for HDR and non-HDR data for the test case 2 where the different recyclable polymers and black plastic were to be classified.
In
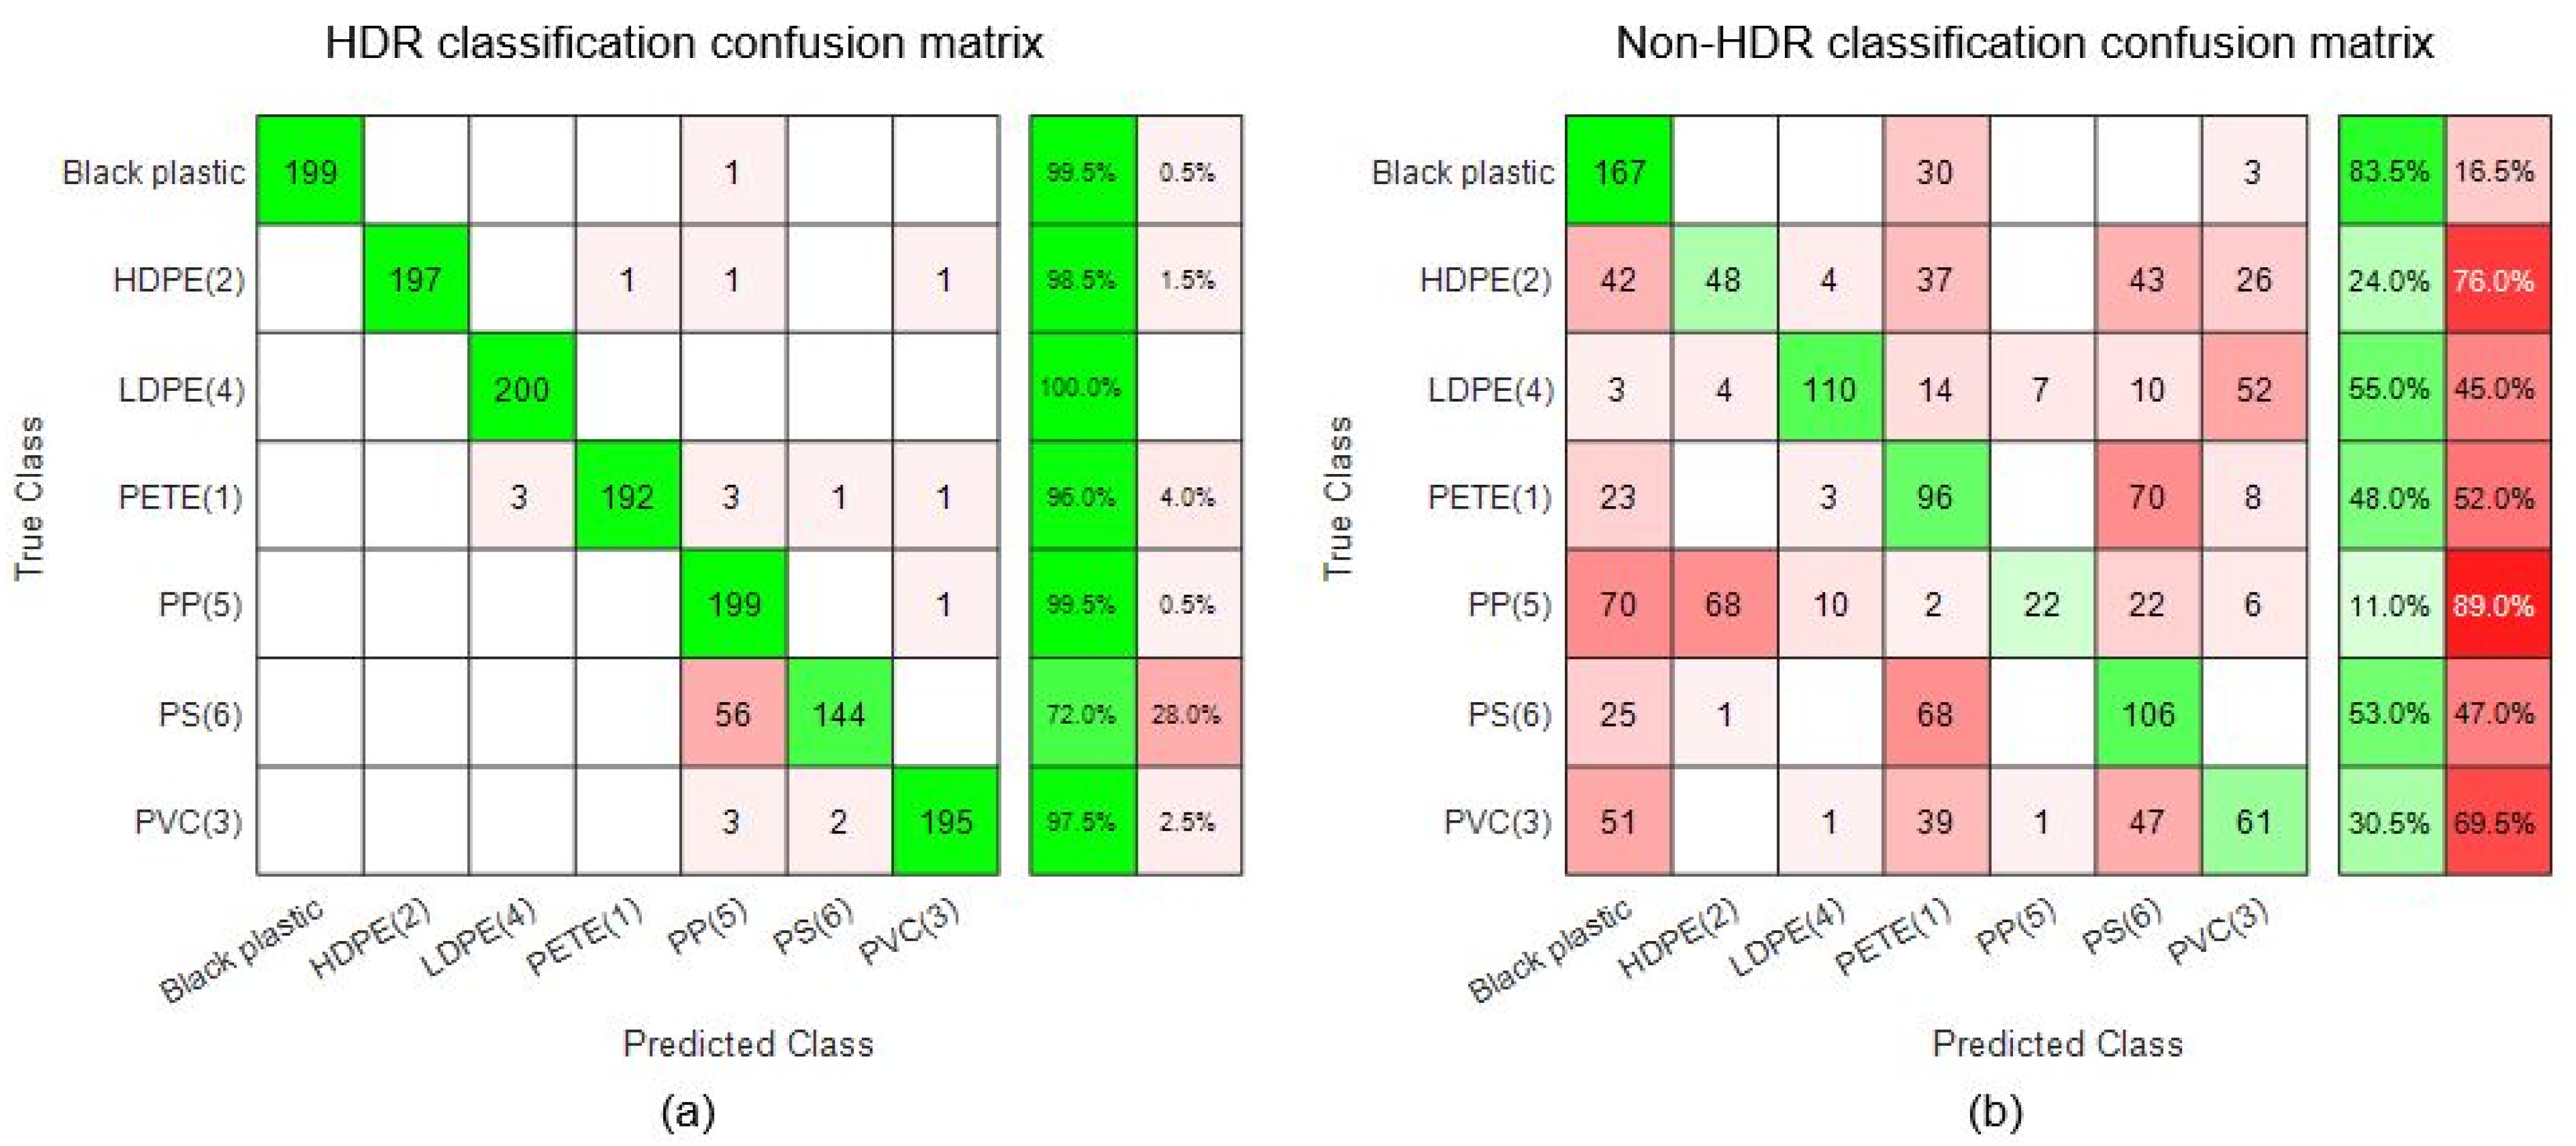
Figure 14, confusion matrices are presented to show the results of classification for the test case 2 where it is possible to see exactly how many vectors of one class are wrongly classified as the members of other classes.
Figure 14 also shown the accuracy of classification per each class.
4. Discussion
In this study we proposed a multi-exposure method to increase the DR of hyperspectral imaging by line cameras such as the Specim Fx17. The detection of plastic in food waste and polymer classification were used as test case applications, as they present good examples of scenarios in which the DR of a scene can get greater than that of spectral cameras. Throughout this study, special attention was given to black plastic, which is known for its low reflectivity and spectral properties, unlike bright plastics. Black plastics are often made of complex material mixes and are colored black by carbon fillers [
26]. These carbon fillings make them difficult to detect in the SWIR region. In
Section 2.8 and
Section 2.9, the DR of waste samples and the hyperspectral camera are calculated experimentally.
Figure 7c and
Figure 8 show that the camera does not have enough DR to capture all the meaningful spectral details present in the scene in a single exposure. For polymer classification case the DR of scene was even higher (59 dB). A soft solution was needed to enable the hyperspectral camera to image the scenes with a greater DR than that of the camera itself. In
Section 2.10, a multi-exposure method is proposed that can considerably extend the effective DR of hyperspectral imaging by line cameras. In the case of the Specim Fx17, the method allows the camera to meaningfully capture scenes with DR up to 73 dB using multiple exposures, where the camera has an effective DR of approximately 43 dB. This extension was achieved using 27 images taken with exposure times from 1 to 466 ms. With the Specim Fx17 camera, the fastest exposure time is 1 ms. Using this shortest exposure time, it is possible to further extend the effective DR up to 134 dB if needed. A minimum SNR of 20 dB was assumed for the calculations of effective DR. The camera, with its effective DR of 43 dB, was unable to correctly measure the 56 dB and 59 dB range of light intensities generated from reflections in the food waste and polymer samples, respectively. With the extended effective DR using multi exposures, the same method could not only measure the reflections but also provide a saturation margin of 17 dB. The corresponding saturation margin for non-HDR imaging was 3 dB in case 1, a consequence of selecting a single exposure time. To create robustness against large variations in DR from real-world scenarios, a sufficient saturation margin must be provided.
The use of the proposed multi-exposure method also results in better detection and classification of materials present in a scene. In
Figure 11a, the non-HDR data of the three classes (food, black plastic, and bright plastic) are more scattered and intermixed than the HDR data of the same classes in
Figure 11b. In general, the compact class clusters with small intraclass distances and large interclass distances result in better classification than the comparatively scattered and overlapping clusters.
Figure 12 shows the miss-classification rate as a percentage of two SVM classifiers trained and tested with HDR and non-HDR data. The miss-classification rate of the classifier trained and tested with HDR data is lower than for the classifier trained and tested with non-HDR data. This shows that the use of the multi-exposure method for measuring the spectral reflection with hyperspectral line cameras results in better detection and classification of materials present in a scene with a wider DR than for the hyperspectral camera used.
For test case 1, the HDR and non-HDR data sets were randomly shuffled before being divided into a training set (~80%) and testing set (1200 vectors from all three classes). The testing set was ordered such that the first five hundred vectors were food waste vectors, the second five hundred were bright plastic vectors, and the last two hundred were black plastic vectors. The confusion matrices presented in
Table 6, show that from the HDR data for any number of principal components used for training, black plastic was never classified as food waste and vice versa. We were able to detect and classify black plastic in food waste with 100% accuracy. This high accuracy was achieved since there was no need to identify the plastics by the type of polymer. Polymer identification from SWIR spectroscopy of black plastics is known to be a difficult case [
26]. There were a small number of food waste vectors wrongly classified as bright plastics and vice versa, but overall the miss-classification rate for the HDR data was always lower than for the non-HDR data.
The test application case 2 was included in the final stage of this study with the prime purpose to test the applicability and robustness of the proposed method. The polymer classification results of HDR and non-HDR data are shown in
Figure 13 and
Figure 14 where the classification success rate of non-HDR data was lower than even 40%. On the other hand, the classification success rate for HDR data was about 95%. The black plastic was treated as a separate.
However, there are shortcomings in this work that limit the empirical evidence for DR being a cause of miss-classification. The black plastic samples contained only one type of black plastic that is used as a container for cooked meals in Swedish superstores. The samples should have included a larger variety of polymers, reflectivity, etc. This study is also limited in size due to its small sample space. However, it becomes more evident that DR is an important consideration for hyperspectral imaging when the mathematical model of DR is analyzed. We argue in this paper that the most common definition of DR is not a satisfactory measure of a hyperspectral camera’s ability to handle large variations of intensity. Instead, we have formulated an effective DR that also includes a requirement for lowest accepted SNR.
Another issue is the high number of exposures (27) used to generate the HDR data in this study. That many exposures of a single line in an industrial application would be very inefficient and very expensive in terms of computation. The number of exposures can be optimized statistically or with the addition of an online algorithm to estimate the minimum required exposures for a given scene. However, optimizing the number of exposures was beyond the scope of this study.


