Abstract
Ag-doped WO3 (Ag–WO3) films were deposited on a soda-lime glass substrate via a facile spray pyrolysis technique. The surface roughness of the films varied between 0.6 nm and 4.3 nm, as verified by the Atomic Force Microscopy (AFM) studies. Ammonia (NH3)-sensing measurements of the films were performed for various concentrations at an optimum sensor working temperature of 200 °C. Enrichment of oxygen vacancies confirmed by X-ray Photoelectron Spectroscopy (XPS) in 1% Ag–WO3 enhanced the sensor response from 1.06 to 3.29, approximately 3 times higher than that of undoped WO3. Limit of detection (LOD) up to 500 ppb is achieved for 1% Ag–WO3, substantiating the role of Ag in improving sensor performance.
1. Introduction
Various types of gas sensors, including chemoreceptive-, ionization-, acoustic-, and resonant-based sensors are gaining more attention in different sectors, such as environmental monitoring, food safety, medical diagnosis, and industrial applications [1,2,3]. Among these, chemoreceptive-based metal oxide semiconductors (MOx) have received tremendous interest in gas sensing due to their high surface/volume ratio, as the gas reaction process is a surface phenomenon. Different MOx, such as ZnO, SnO2, WO3, and TiO2 [4,5] have been extensively studied for gas-sensing applications. Tungsten oxide (WO3) has emerged as a potential MOx to detect the gases, such as NH3, H2, NO2, CO, and alcohol vapors, because of their inherent properties, including excellent electrical conductivity, sensitivity, and selectivity [6,7]. To enhance the sensing performance further, doping is considered one of the possible approaches. Transition metal doping, such as Cr, Cu, Ag, and Pd, would induce the defects causing enrichment of oxygen vacancies via hole compensation mechanism. These metals act as promoters and increase the sensing properties via spill-over effect or Fermi-level mechanisms [8,9,10]. Godbole et al. [11] reported the NH3-sensing properties of Pd/WO3 films with the response of 0.27 at a working temperature of 225 °C. Lu et al. [12] presented studies on NO2-sensing properties of Ag–WO3 nanoparticles and reported high sensitivity and better selectivity. Xu et al. [13] obtained a superior sensor response for Ag–WO3 core-shell nanostructures towards alcohol vapor at a working temperature of 340 °C. All these studies have shown that metal incorporated into WO3 has enhanced the sensor performance.
In this regard, we have illustrated the NH3-sensing performance of Ag–WO3 films via the spray pyrolysis deposition technique. Ag is a noble metal that enhances the sensor response of WO3 due to electronic sensitization mechanism [14]. Due to large area deposition, ease of operation, and cost effectiveness, spray pyrolysis is chosen to deposit films in this report. The availability of literature is scarce on Ag–WO3 for NH3 sensing, and one of the works published is on hydrothermal technique [14]. To the best of our knowledge, no reports on spray-deposited Ag–WO3 films are accessible for NH3 sensing. Therefore, our attempt has proved the possibility of these films for NH3 sensing by spray pyrolysis. Though the literature is available on NH3 sensing by metal-doped WO3, the majority of the sensors work at high temperatures (>250 °C) and the reported detection limit is high [14,15,16]. Ammonia (NH3), a reducing gas, is a major pollutant from the automobiles, fertilizer, and mining industries. According to the OSHA (Occupational Health and Safety Administration) report, the permissible limit for NH3 is 35 ppm for 15 min [17]. High exposure to the gas for a long time will trigger lung- and kidney-related diseases, causing incurable damage to human health. In this context, we aimed to lower the operating temperature and detection limit, which are essential for the sensing applications. Thus, in the current work, we have reported spray-pyrolyzed Ag–WO3 films as a promising candidate for NH3 sensing at a working temperature of 200 °C with the detection limit of 500 ppb.
2. Experimental
Undoped and silver-doped tungsten oxide films (Ag–WO3) were synthesized by the spray pyrolysis method. For undoped WO3, ammonium metatungstate hydrate (99.99% purity) is dissolved in double-distilled water and a homogeneous solution is obtained. For Ag doping, silver nitrate was taken as a precursor, and doping was done at a 1 wt.%, 3 wt.%, and 5 wt.% ratio. Solution concentration was maintained at 0.01 M. Deposition parameters, such as substrate temperature and flow rate, were kept constant at 400 °C and 1 mL/min, respectively.
Crystal structure and phase identification were performed via Rigaku SmartLab X-ray diffractometer with Cu Kα radiation at 40 kV, 30 mA. Raman analysis was performed using a Horiba JOBINYVON LabRAM HR spectrometer for the confirmation of structure. Morphological studies were performed via Innova SPM Atomic Force Microscope (AFM). AXIS ULTRA X-ray Photoelectron Spectroscope is used for oxidation state and composition studies. Gas sensing was conducted via dc probe measurements in an enclosed chamber (2.96 × 104 cm3 by vol.) by purging synthetic air (79% N2 + 21% O2) and NH3 to the sample. The flow of gas was controlled using programmable mass flow controllers (MFCs), and the overall flow was kept constant at 500 sccm. I-V measurements were performed via Keithley source meter 2450 using silver paste electrodes. Sensor response of the films was evaluated using the equation, (). Ra and Rg suggest the film resistance in air and target gas (NH3), respectively. Schematic representation of film synthesis and ammonia-sensing measurements of Ag–WO3 film is represented in the Figure 1.
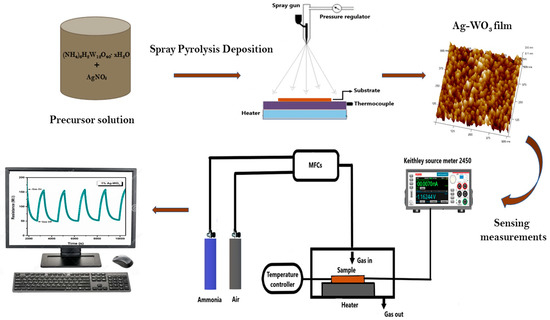
Figure 1.
Schematic illustration of film deposition and ammonia sensing measurements of Ag–WO3.
3. Results and Discussion
3.1. Structural and Morphological Analysis
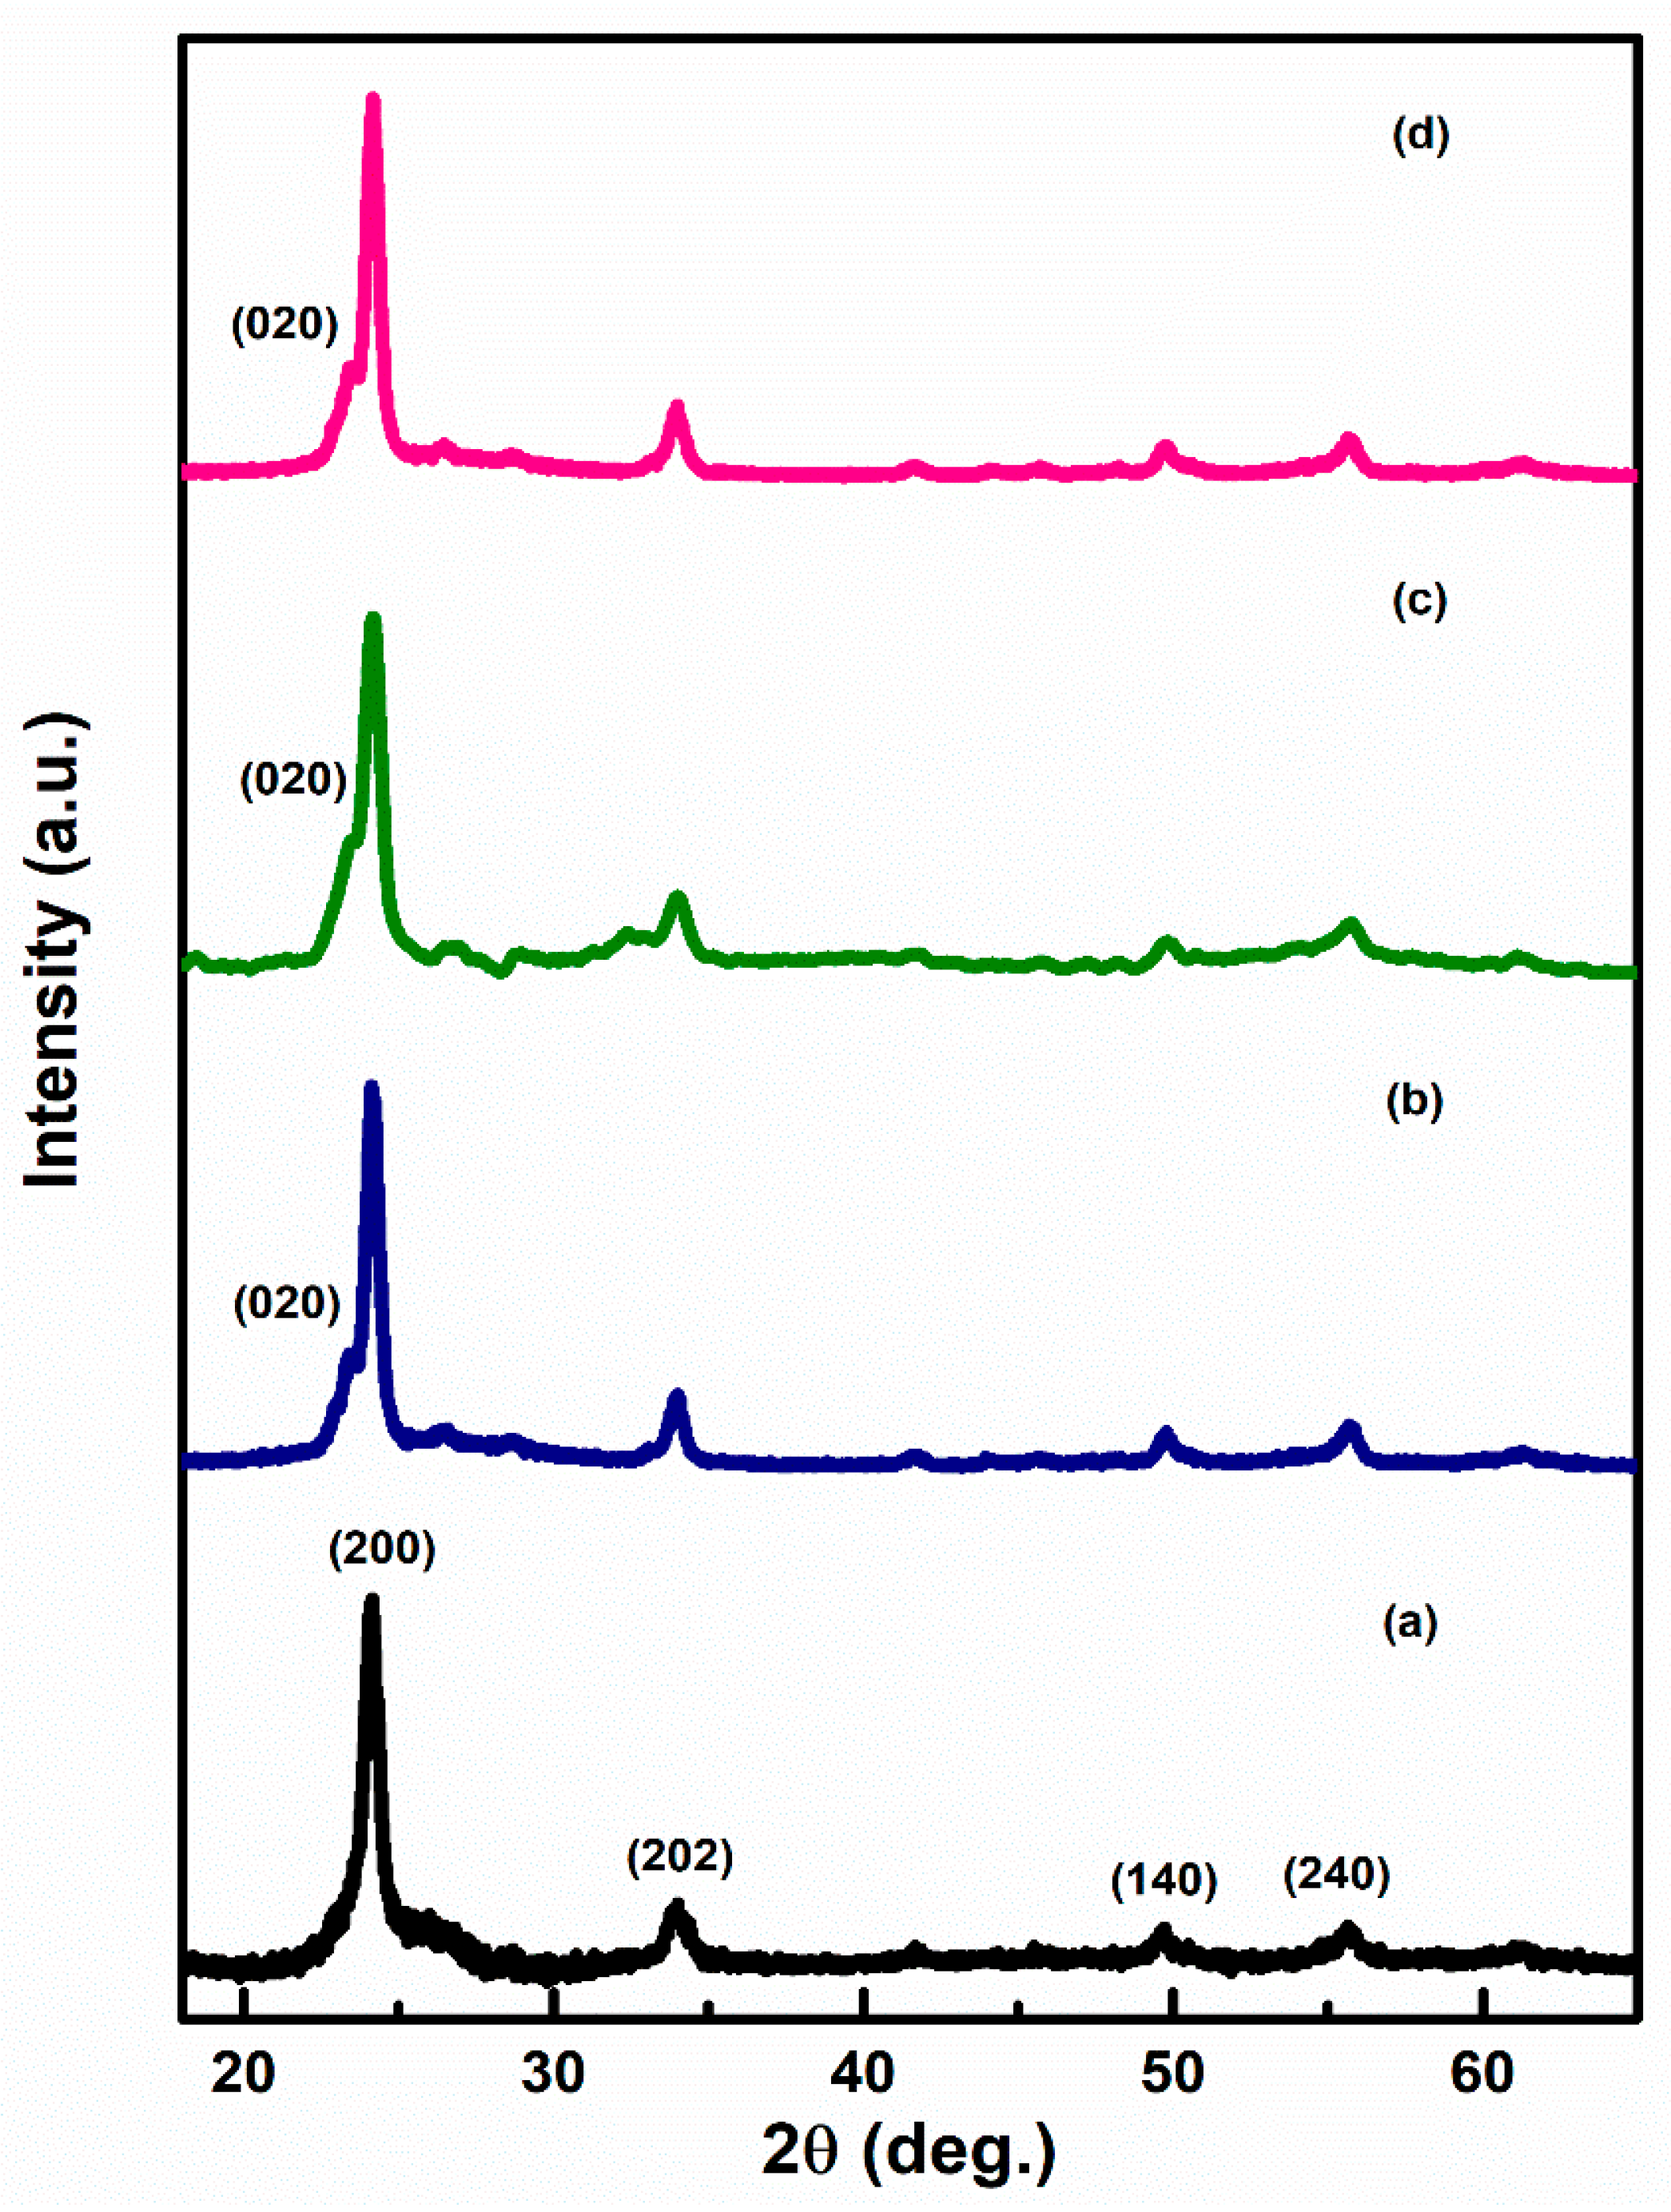
Figure 2a–d represents the XRD pattern of Ag–WO3 films at varied Ag doping levels. Diffraction peaks at the angles 24.1°, 33.9°, 49.6°, and 55.6° correspond to (200), (202), (140), and (240) planes, indicating monoclinic phase (γ-WO3) of WO3 films (JCPDS card no. 43–1035) [12,18]. The appearance of sharp diffraction peaks implies that the deposited films have high crystallinity. The absence of any further peaks in the spectra endorsed the non-existence of any impurity phase in the prepared Ag–WO3 films. All the films exhibited ‘a’ axis preferential orientation, i.e., along (200) plane. Evolution of (020) peak centered at 23.4° is observed upon addition of Ag into WO3. The introduction of Ag formed new nucleating centers for WO3, ultimately retaining monoclinic structure. The crystallite size of the films was determined by employing the Scherrer formula [19] and it varies from 11.5 nm to 14.7 nm. The dislocation density and microstrain [19] were also evaluated and are presented in Table 1.
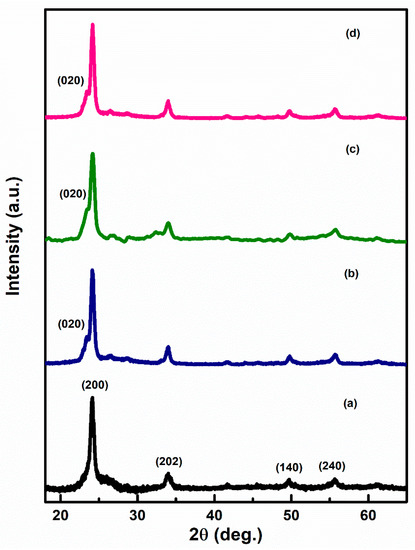
Figure 2.
XRD pattern of (a) 0%, (b) 1%, (c) 3%, and (d) 5%, Ag–WO3 films.

Table 1.
Structural and morphological parameters of Ag–WO3 films.
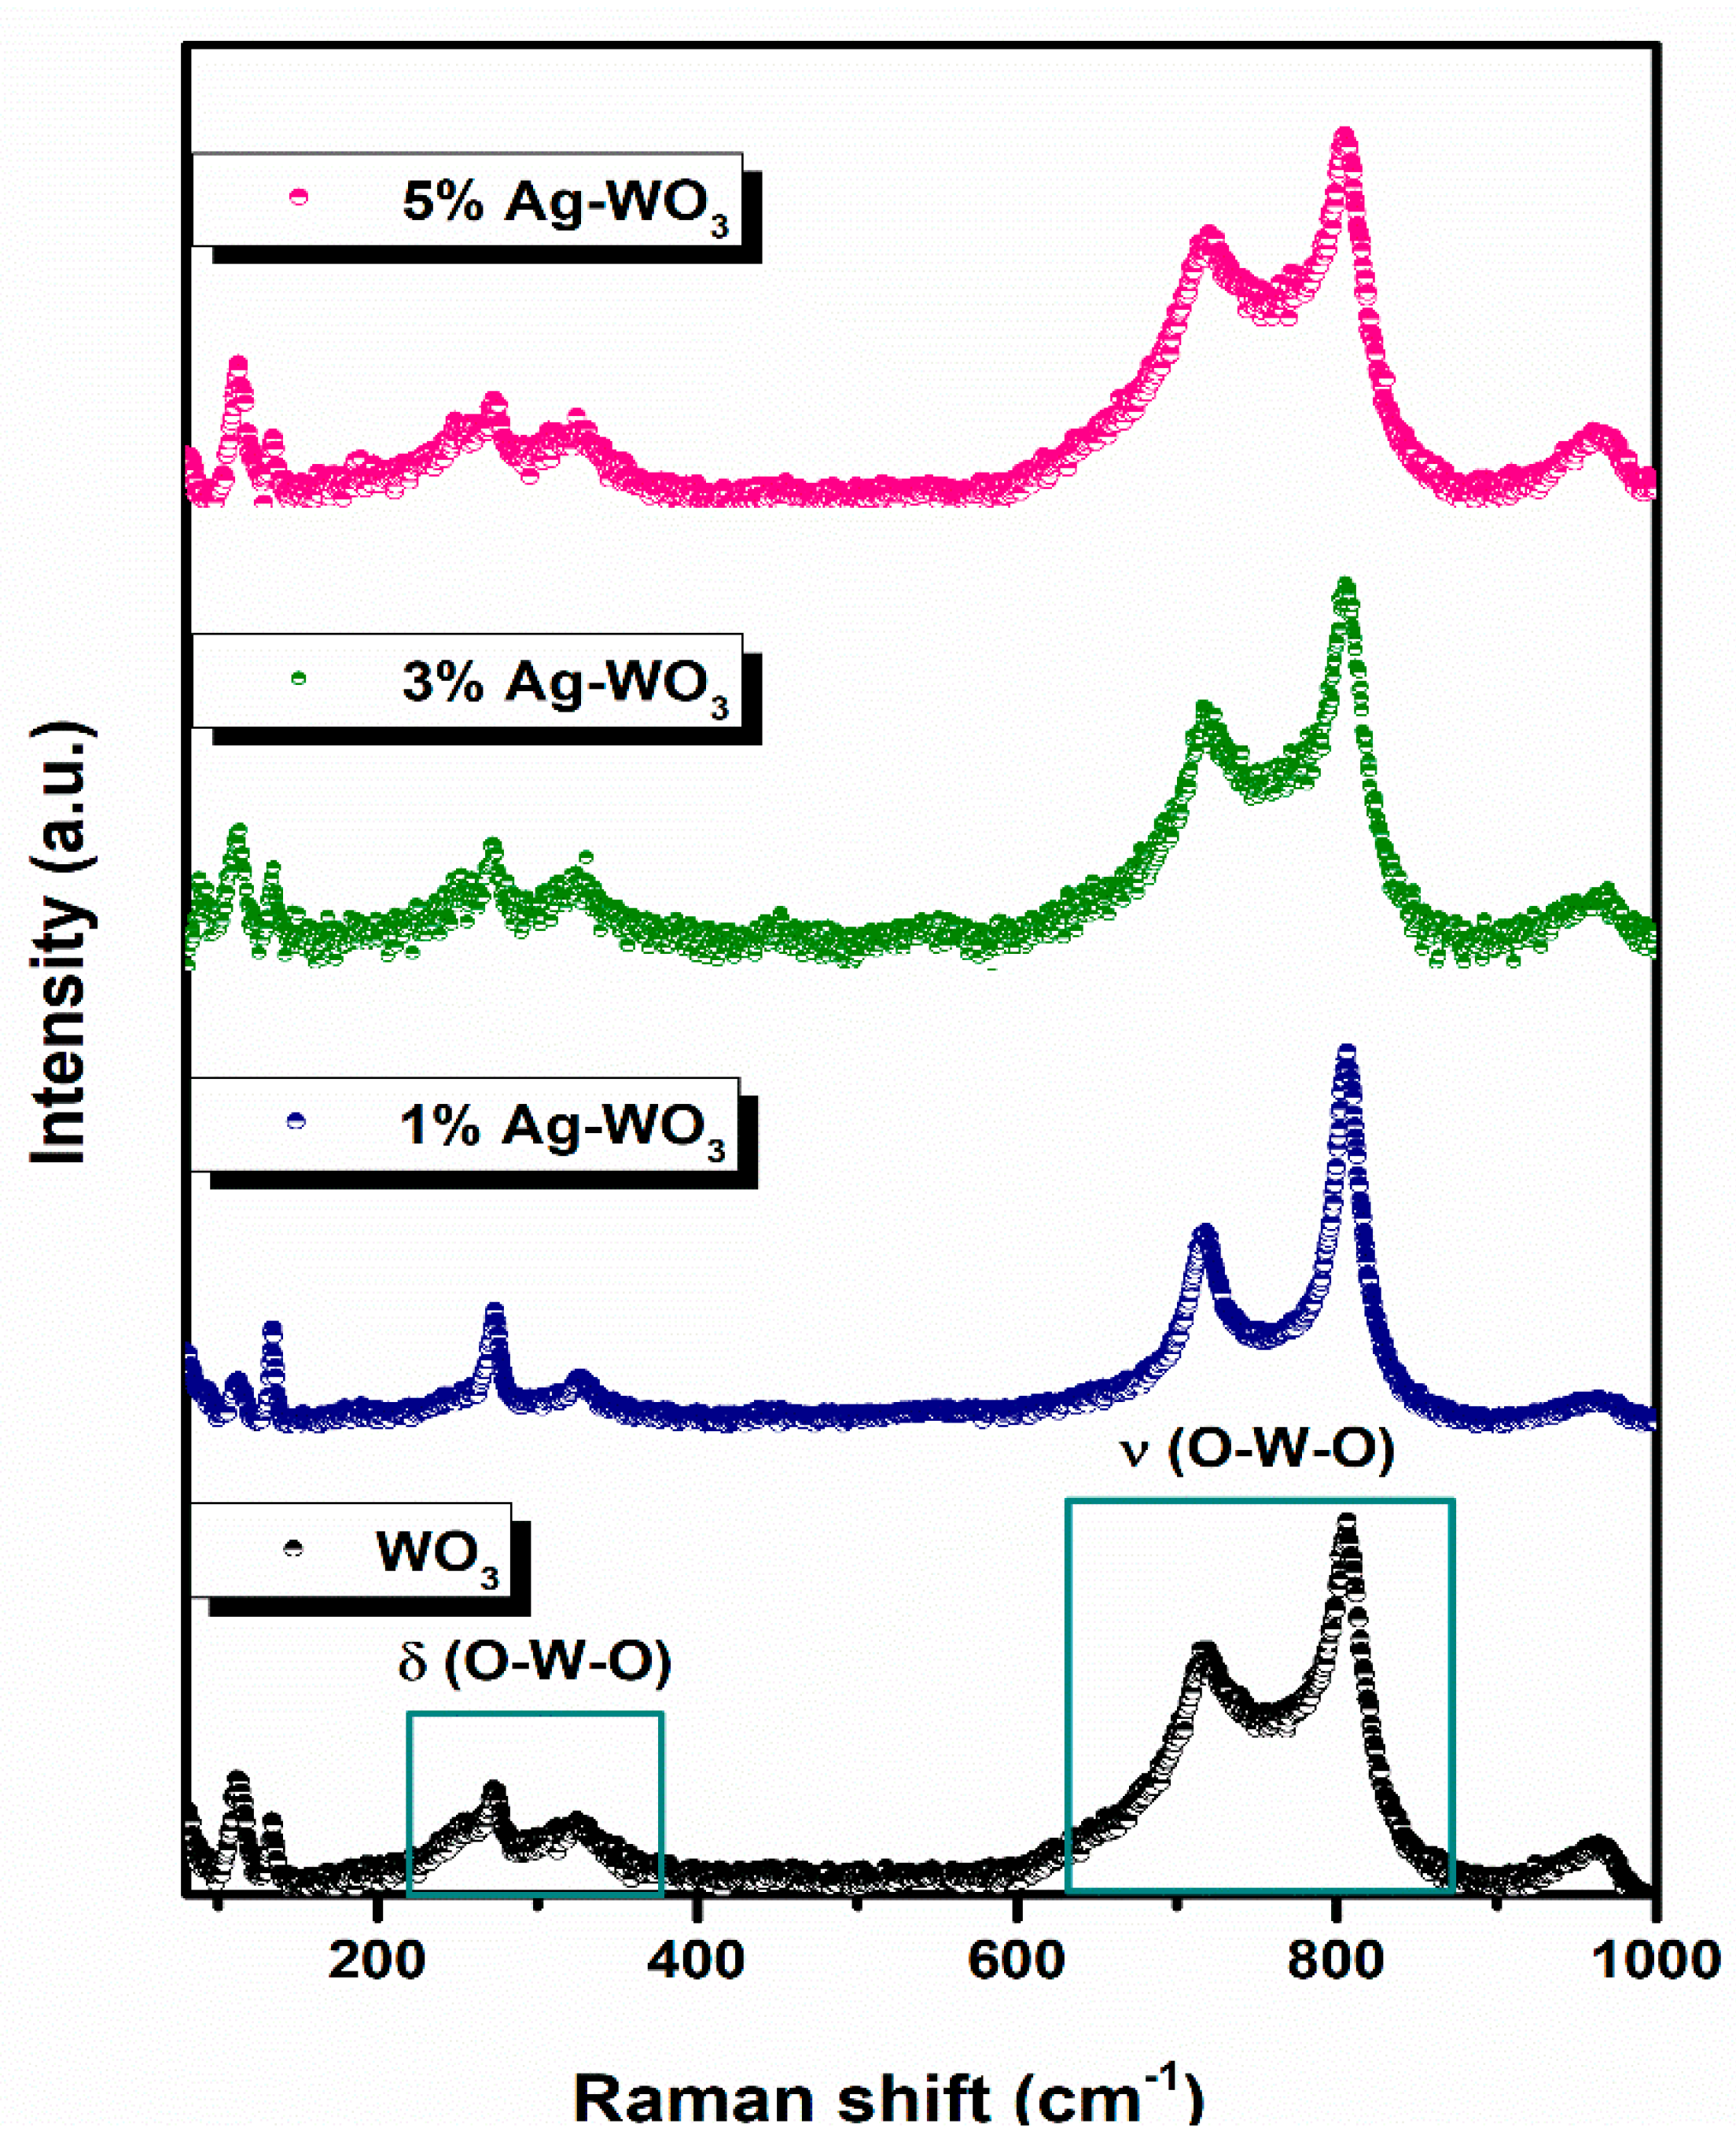
Since triclinic and monoclinic phases of WO3 exhibit the same set of XRD peaks, we have conducted Raman measurements for further confirmation [20,21]. Figure 3 illustrates the Raman spectra of Ag–WO3 films excited with the 532 nm laser source. Clear visibility of peaks at ~112 cm−1, ~134 cm−1, ~270 cm−1, ~325 cm−1, ~719 cm−1, ~806 cm−1, and ~963 cm−1, attributed to the different modes of vibrations in the WO3 lattice. Peaks corresponding to ~719 cm−1 and ~806 cm−1 represent the asymmetric and symmetric stretching vibrational modes (νas and νs) of O–W–O bonds and these are often referred to as the strongest monoclinic WO3 modes [22]. Peaks located at ~270 cm−1 and ~325 cm−1 attribute to the O–W–O bending vibrational modes (δ) and peaks below 200 cm−1 contribute to the lattice vibrational modes [23]. All the films exhibit a peak at ~963 cm−1, which can be ascribed to the symmetric stretching vibration of terminal W=O bonds possibly associated with the clusters on the film surface [24,25]. The frequency of vibration of the W=O bond is predicted to be higher than that of the W–O bond since the W–O single bond is weaker than the W=O double bond. Raman measurements confirmed the monoclinic phase of Ag–WO3 films.
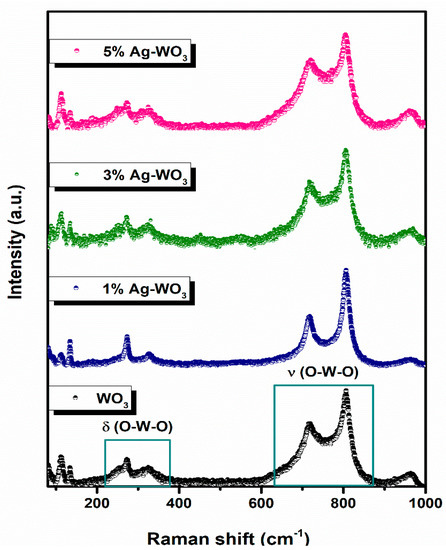
Figure 3.
Raman spectra of Ag–WO3 films.
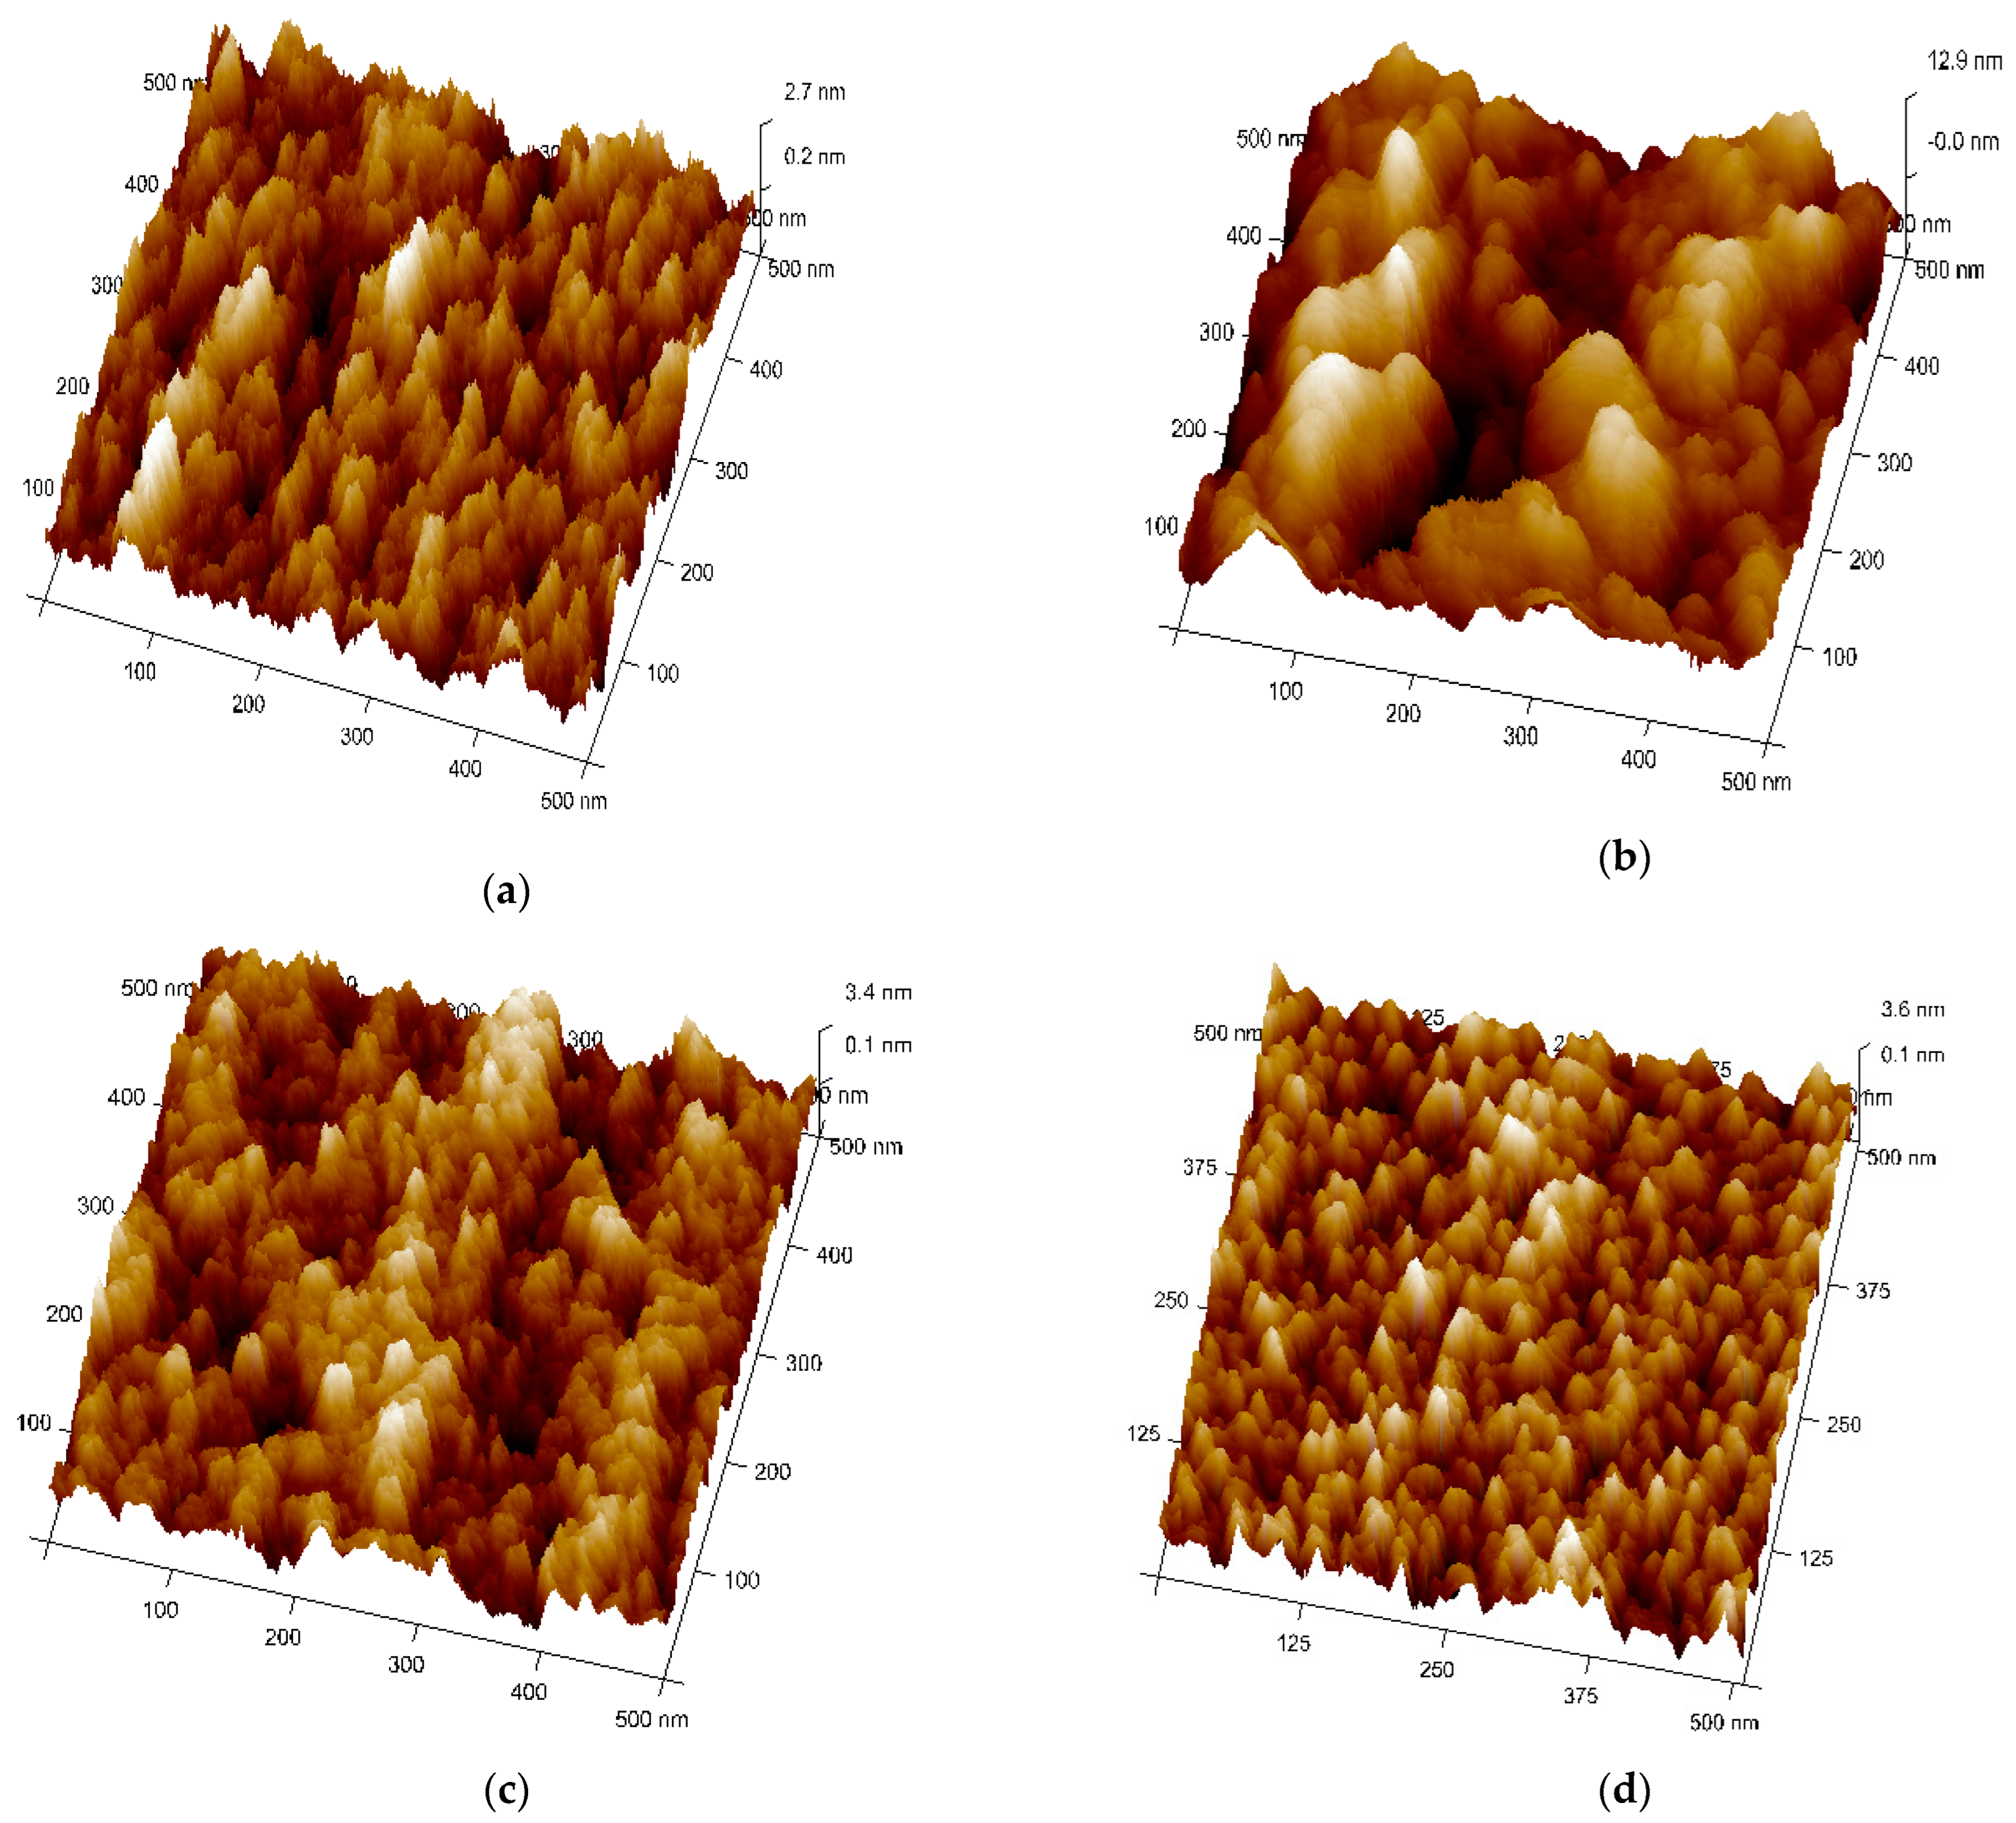
Figure 4a–d shows the topography and microstructures (3D view) of Ag–WO3 films examined by AFM in tapping mode configuration. All the samples were scanned in the area of 0.5 × 0.5 µm2. Figure 4b represents the topographical view of 1% Ag–WO3. It suggests the coalescence of grains upon Ag incorporation forming larger globules of particles with the presence of voids. At 3% and 5%, Ag doping (Figure 4c,d), well-separated smaller grains are visible with almost uniform distribution. RMS surface roughness of the films was evaluated using NanoScope Analysis software and given in Table 1. Upon Ag doping, the roughness value of the films varied, and for 1% Ag–WO3 higher value of roughness was recorded.
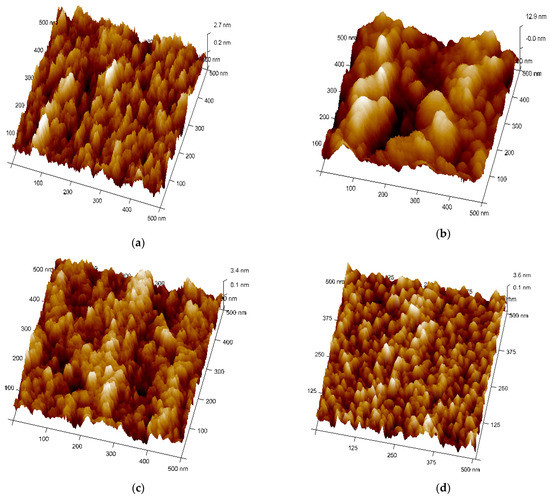
Figure 4.
Topographical view of Ag–WO3 films at (a) 0%, (b) 1%, (c) 3%, and (d) 5% Ag concentrations.
3.2. XPS Studies
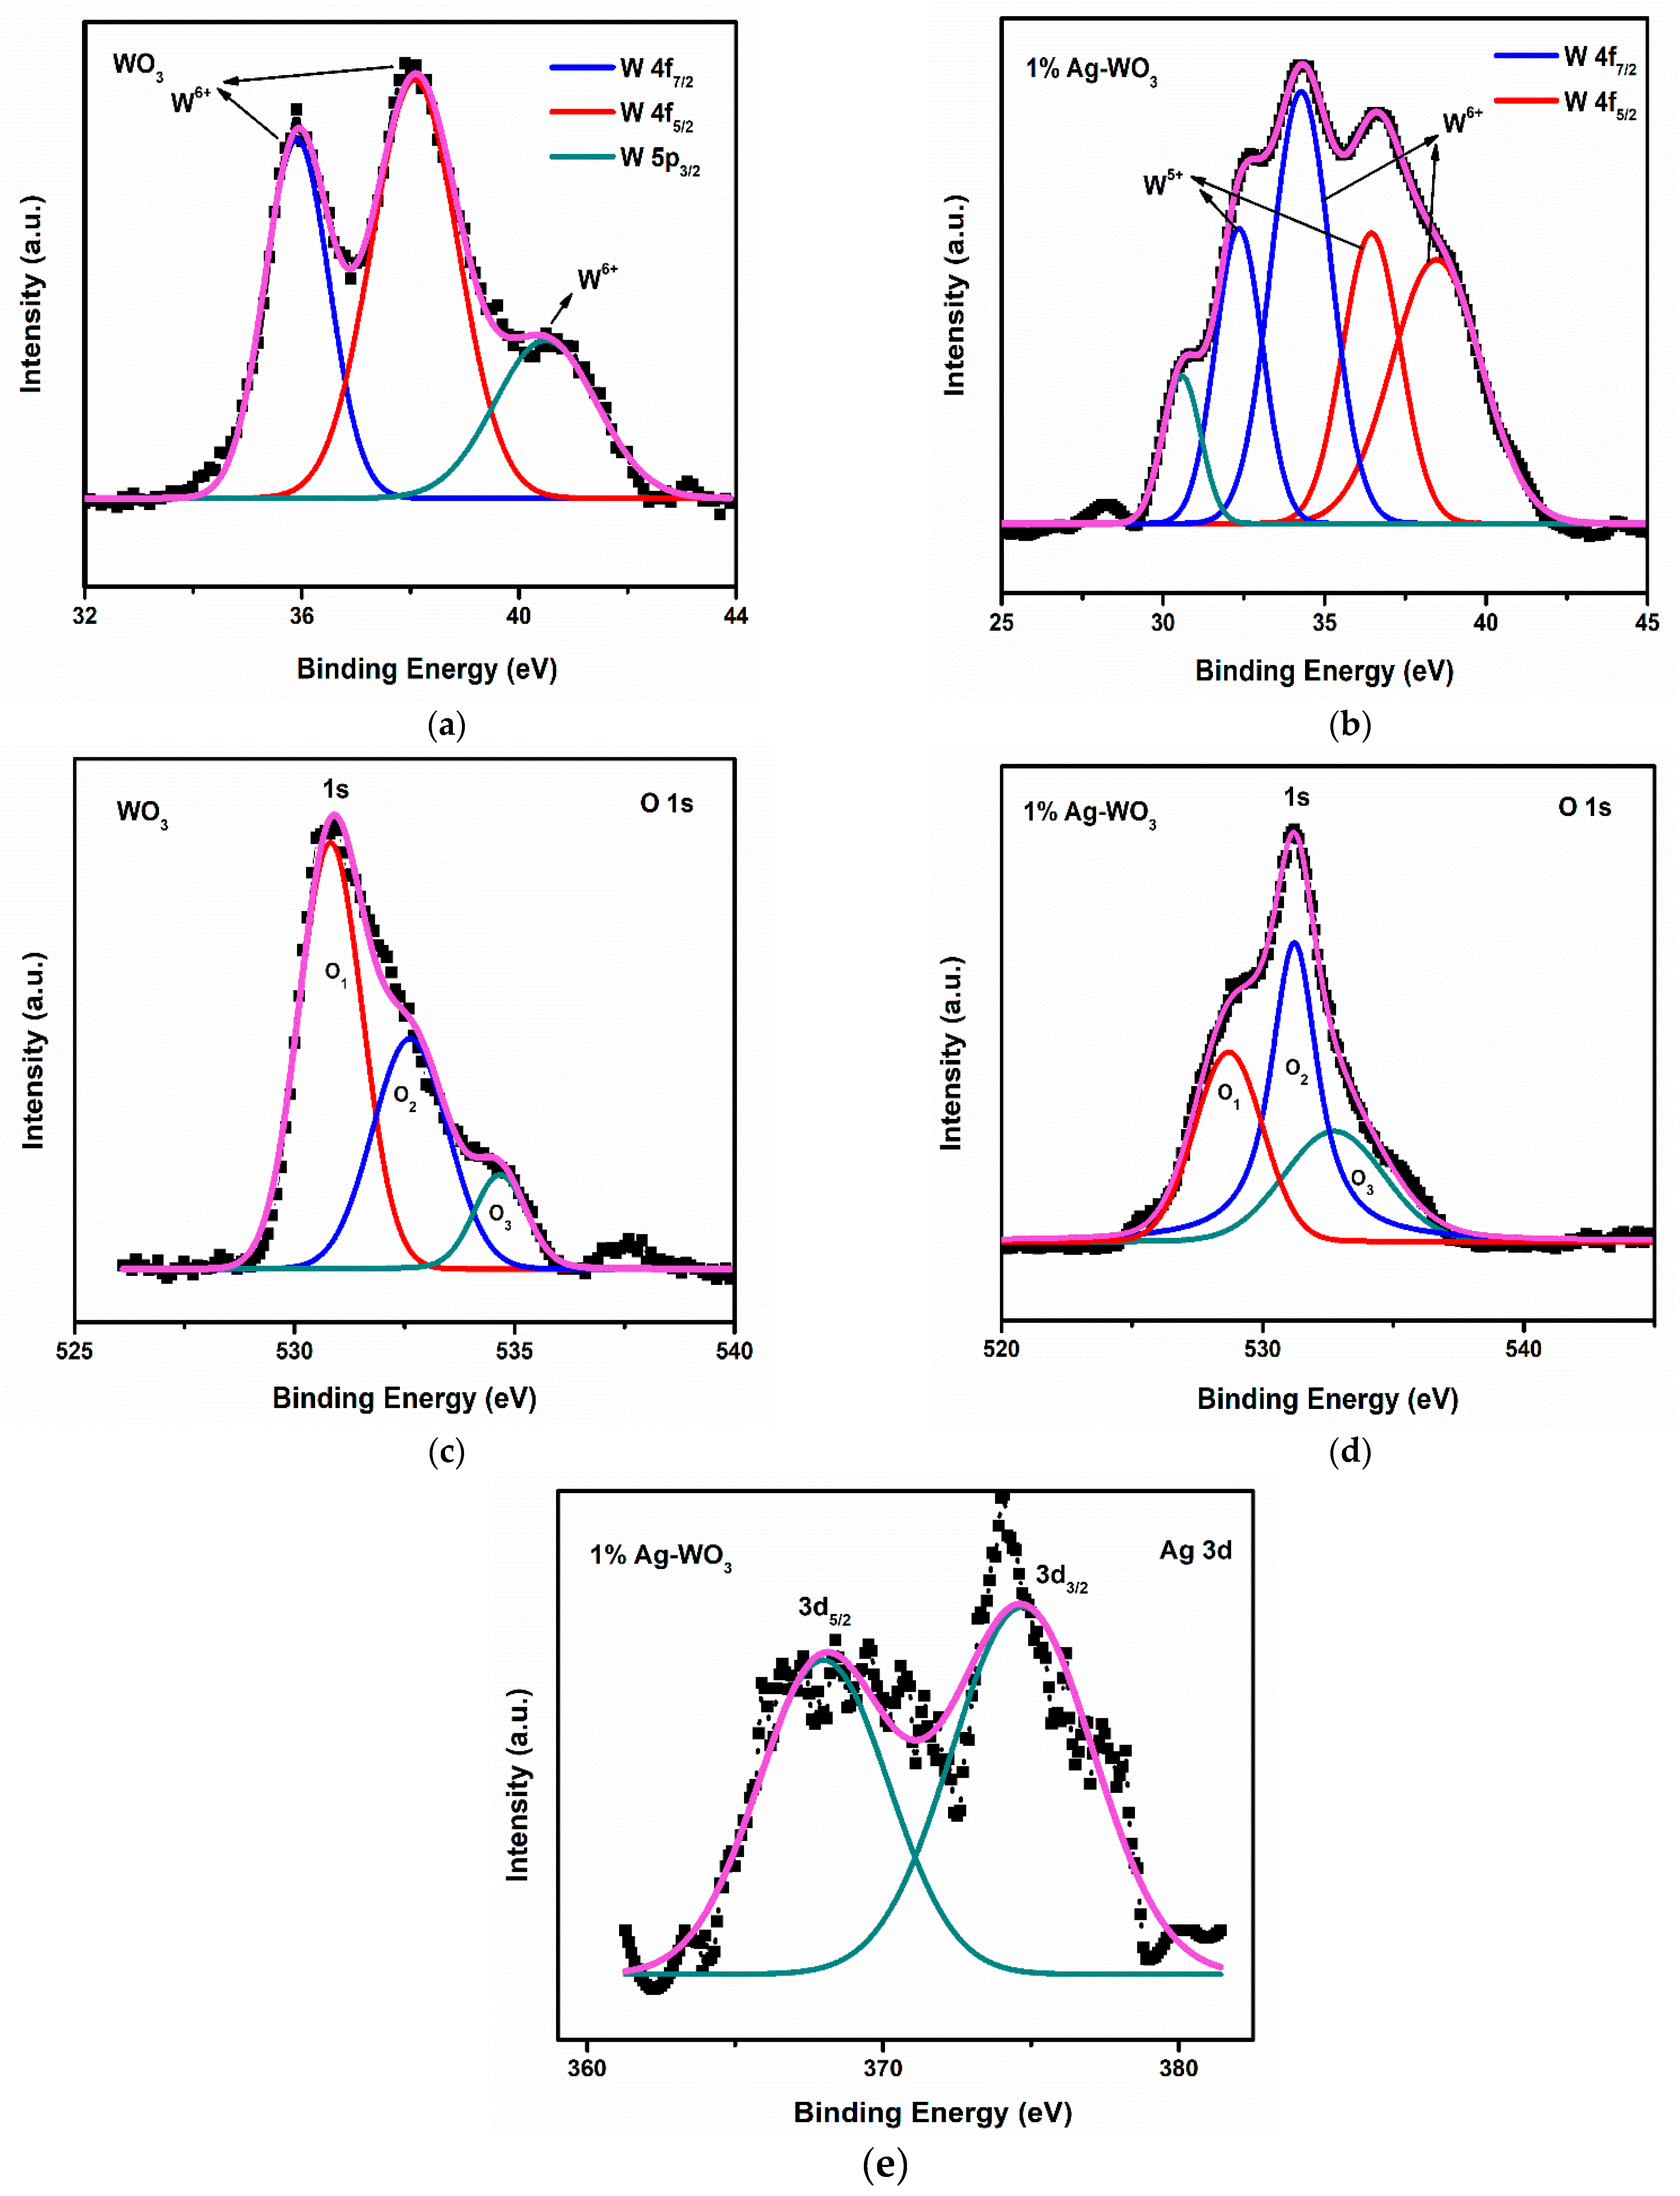
Elemental composition and chemical state of Ag–WO3 films (at 0% and 1% Ag conc.) were examined via the XPS technique. Figure 5a shows the deconvoluted spectra of W 4f split into spin-orbit doublet, namely W 4f7/2 and W 4f5/2 located at the binding energies (Eb) of 35.9 eV and 38.1 eV, respectively, in undoped WO3 film. These represent the +6 oxidation state of W and another satellite peak at 40.5 eV indicates the W 5p3/2 component corresponding to the same oxidation state [26]. The incorporation of Ag into WO3 has led to the formation of +6 and +5 oxidation states of W as depicted in Figure 5b. Deconvolution of W 4f in Figure 5b has resulted in two pairs of doublets viz. one at 34.2 eV and 38.4 eV equivalent to W 4f7/2 and W 4f5/2, respectively, for the +6 oxidation state of tungsten, and other pairs of doublets comprised of W 4f7/2 and W 4f5/2 centered at 32.4 eV and 36.5 eV are comparable to the +5 oxidation state of tungsten [27]. The peak positioned at 30.6 eV was assigned to the metallic tungsten [28]. If oxygen vacancy is present, electron density near neighboring W atoms intensifies, causing higher screening of its nucleus and consequently, the 4f energy level is predicted to be at lower Eb [23,27]. In the present studies, the shoulder associated with the W 4f is generated as a result of electrons emitted from W atoms near oxygen vacancies, and hence W atom has an oxidation state less than +6, resulting in the formation of sub-stoichiometric WO3−x.
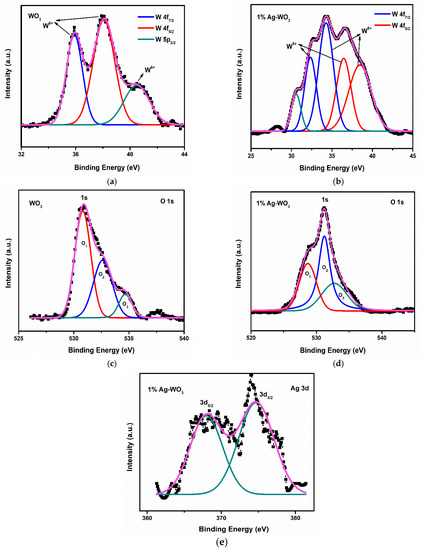
Figure 5.
(a–e): XPS spectra of W, O, and Ag core levels in WO3 and 1% Ag–WO3 films.
The deconvolution of O 1s spectra has produced 3 peaks (O1, O2, and O3) in both WO3 and 1% Ag–WO3 films (Figure 5c,d) respectively. O1 centered at Eb of 530.8 eV and 528.7 eV in WO3 and 1% Ag–WO3 respectively, was ascribed to O2− in the lattice. Similarly, O2 centered at 532.6 eV and 531.2 eV denote the lattice oxygen associated with the oxygen-deficient regions near W ions, which are generally referred to as oxygen vacancies (Vo) [29,30]. Area ratio of oxygen vacancies is estimated from peak area calculations as given below:
Vo for WO3 and 1% Ag–WO3 was found 35% and 45%, respectively. Hence, the studies inferred that oxygen vacancies increased by 10% in 1% Ag–WO3. The least intense peaks centered at 534.7 eV and 532.8 eV, respectively in WO3 and 1% Ag–WO3, connected to the adsorbed oxygen species (, ) [30]. Figure 5e represents the characteristic peaks of Ag at Eb of 368 eV and 374.5 eV contributes to Ag 3d5/2 and Ag 3d3/2, respectively, in 1% Ag–WO3. These peaks are assigned to the Ag0/Ag1+ states of silver [28,31].
3.3. Gas Sensing Properties
Operation temperature for WO3 towards NH3 was fixed by purging gas at various temperatures and calculating subsequent sensor response as presented in Figure 6a,b. Figure 6a represents the obtained graph for sensor current versus time wherein 5.03 ppm NH3 is purged at 5 different temperatures: 100 °C, 150 °C, 175 °C 200 °C, and 250 °C. An increase in temperature causes an increase in the sensor current, demonstrating the semiconducting nature of the WO3 films. At 100 °C, the graph shows a straight line, denoting no response for NH3 due to the low thermal energy of the gas required for the chemisorption process. Low response was noted at 150 °C and 175 °C. An increase in the temperature to 200 °C has shown maximum response, and thereafter the response has decreased as indicated in Figure 6b. With the enhancement in the temperature, WO3 started to respond, as enough thermal energy is provided for the surface reaction to occur by overcoming the activation energy barrier [32]. After the maximum response, a reduction in the sensing performance at 250 °C is due to the lower adsorption capability of gas molecules. In addition, it is observable that baseline stability was lost above 200 °C (Figure 6a). Hence, 200 °C is considered a suitable operating temperature for all the deposited films, and further studies were conducted at the same temperature.
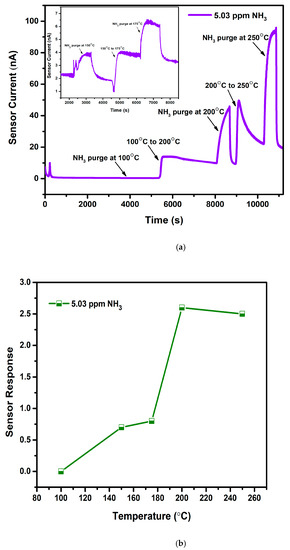
Figure 6.
(a): Temperature optimization plot of WO3 film at 100 °C, 200 °C, and 250 °C (Inset: At 150 °C and 175 °C). (b): Sensor response vs. temperature plot for WO3 film.
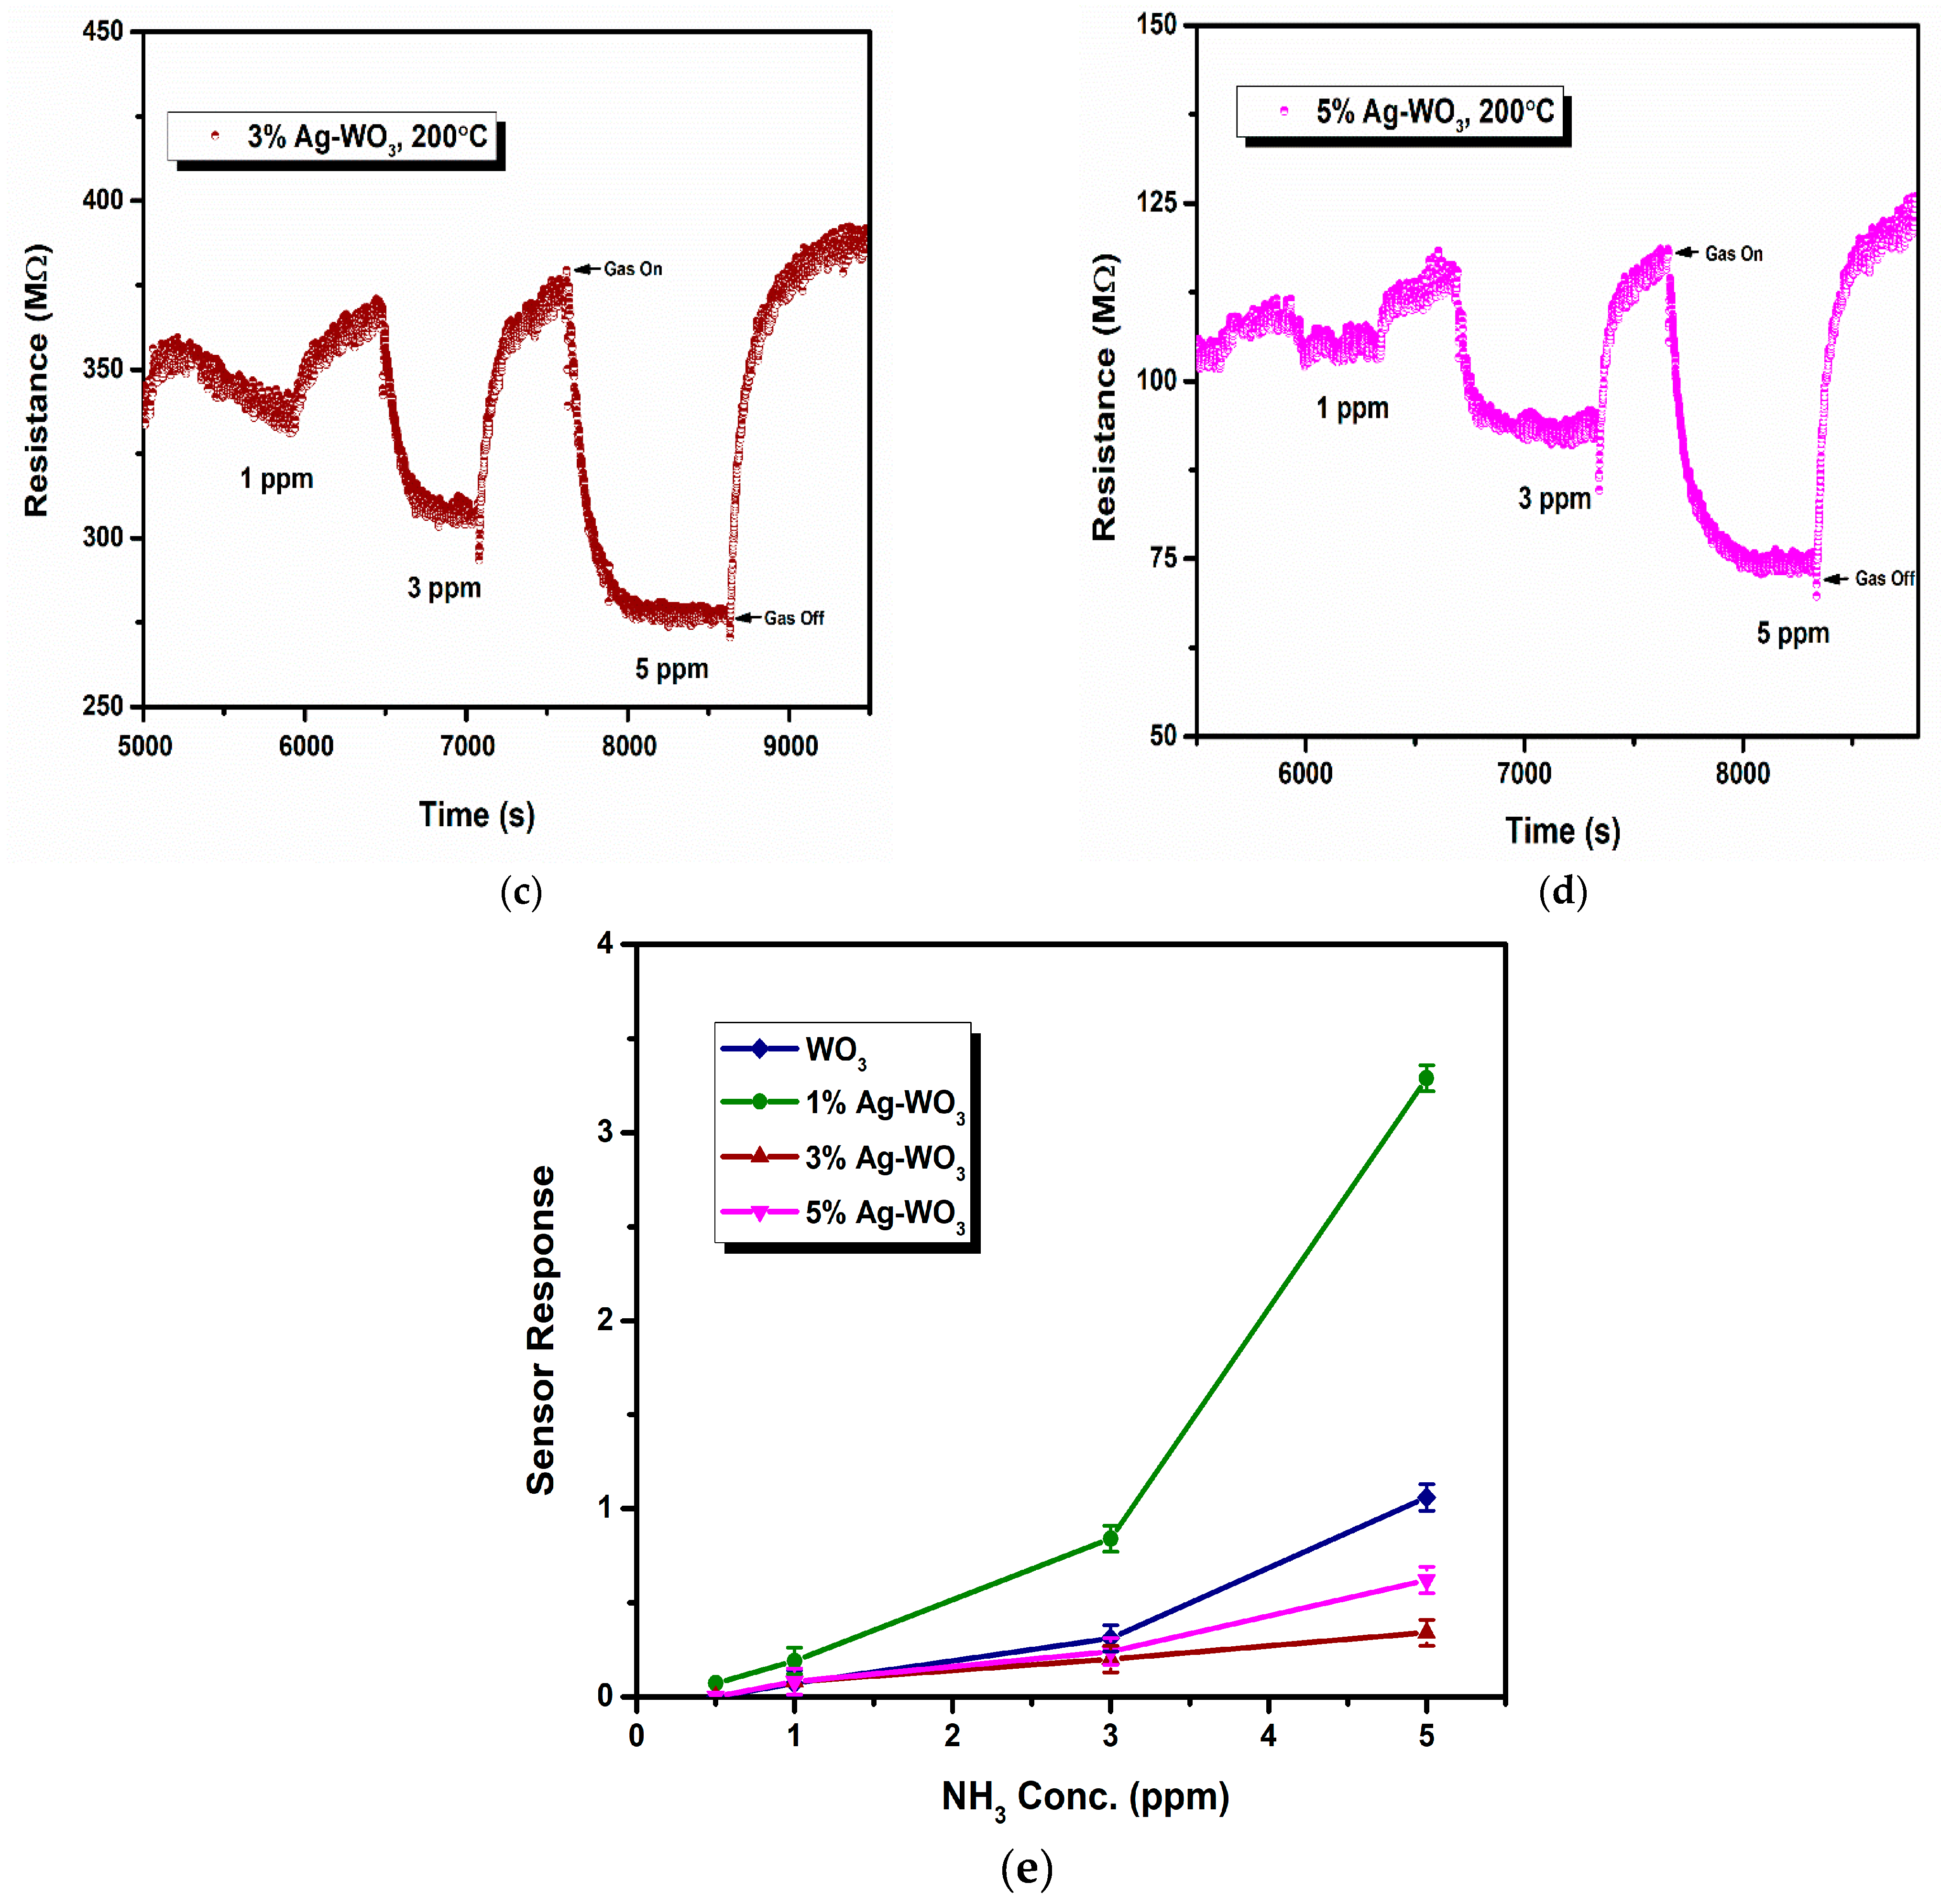
Sensor response, rate of response, and recovery () are the essential parameters that determine the efficiency of any sensor. Figure 7a–d depicts the transient response curves of Ag–WO3 films (0%, 1%, 3% and 5% Ag conc.) for different NH3 concentrations. Figure 7e shows the variation of sensor response with the NH3 concentration. The sensor response for 5 ppm NH3 was found to be 1.06, 3.29, 0.34, and 0.62 with the standard error of ±0.07 for undoped, 1%, 3%, and 5% Ag-doped WO3 films, respectively. The highest response was recorded for 1% Ag–WO3 with the of 5.5 min and of 7.9 min. Doping of Ag reduced the detection limit from 1 ppm to 0.5 ppm (500 ppb) in 1% Ag–WO3. ‘Ag’, being a noble metal, acts as a catalyst due to chemical sensitization and also causes electronic sensitization due to the interaction between Ag and WO3, which might have induced the enhancement in the sensor response of the WO3 film [9]. AFM studies revealed that 1% Ag–WO3 showed higher surface roughness value (Table 1) compared to other Ag concentrations. Surface roughness is one of the parameters that can increase the surface to volume ratio of the films and thereby enhances the gas adsorption capacity [33]. M. Kumar et al. [34] and J. M. Lee et al. [33] observed similar results for CO and H2-gas sensing, respectively. Augmentation in the sensing performance of 1% Ag–WO3 could be accredited to improved oxygen vacancies upon Ag doping, which is confirmed by XPS analysis and also higher surface roughness and void formation on the film surface is proven by AFM, providing a greater number of adsorption centers for NH3 [22,35]. Nevertheless, a decrease in sensor response beyond 1% Ag doping is connected to lower surface roughness of the films and catalytic efficiency of Ag, indicating that while Ag inclusion improves sensing performance, increasing the doping concentration above the optimum level may reduce catalytic efficiency [27]. Also, XPS revealed the possibility of Ag2O formation upon Ag doping. When Ag concentration exceeds 1%, Ag2O amounts might increase and cause an increase in the depletion layer width, deteriorating the sensor response of the films.
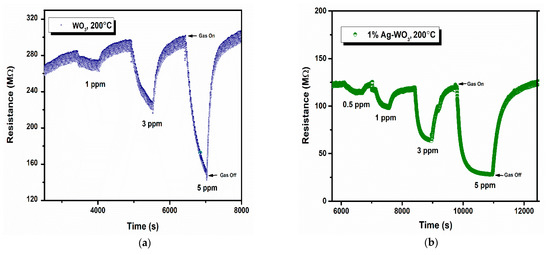
Figure 7.
(a–d): Transient response curves of Ag–WO3 films and (e) sensor response of the films at various NH3 concentrations with error bars.
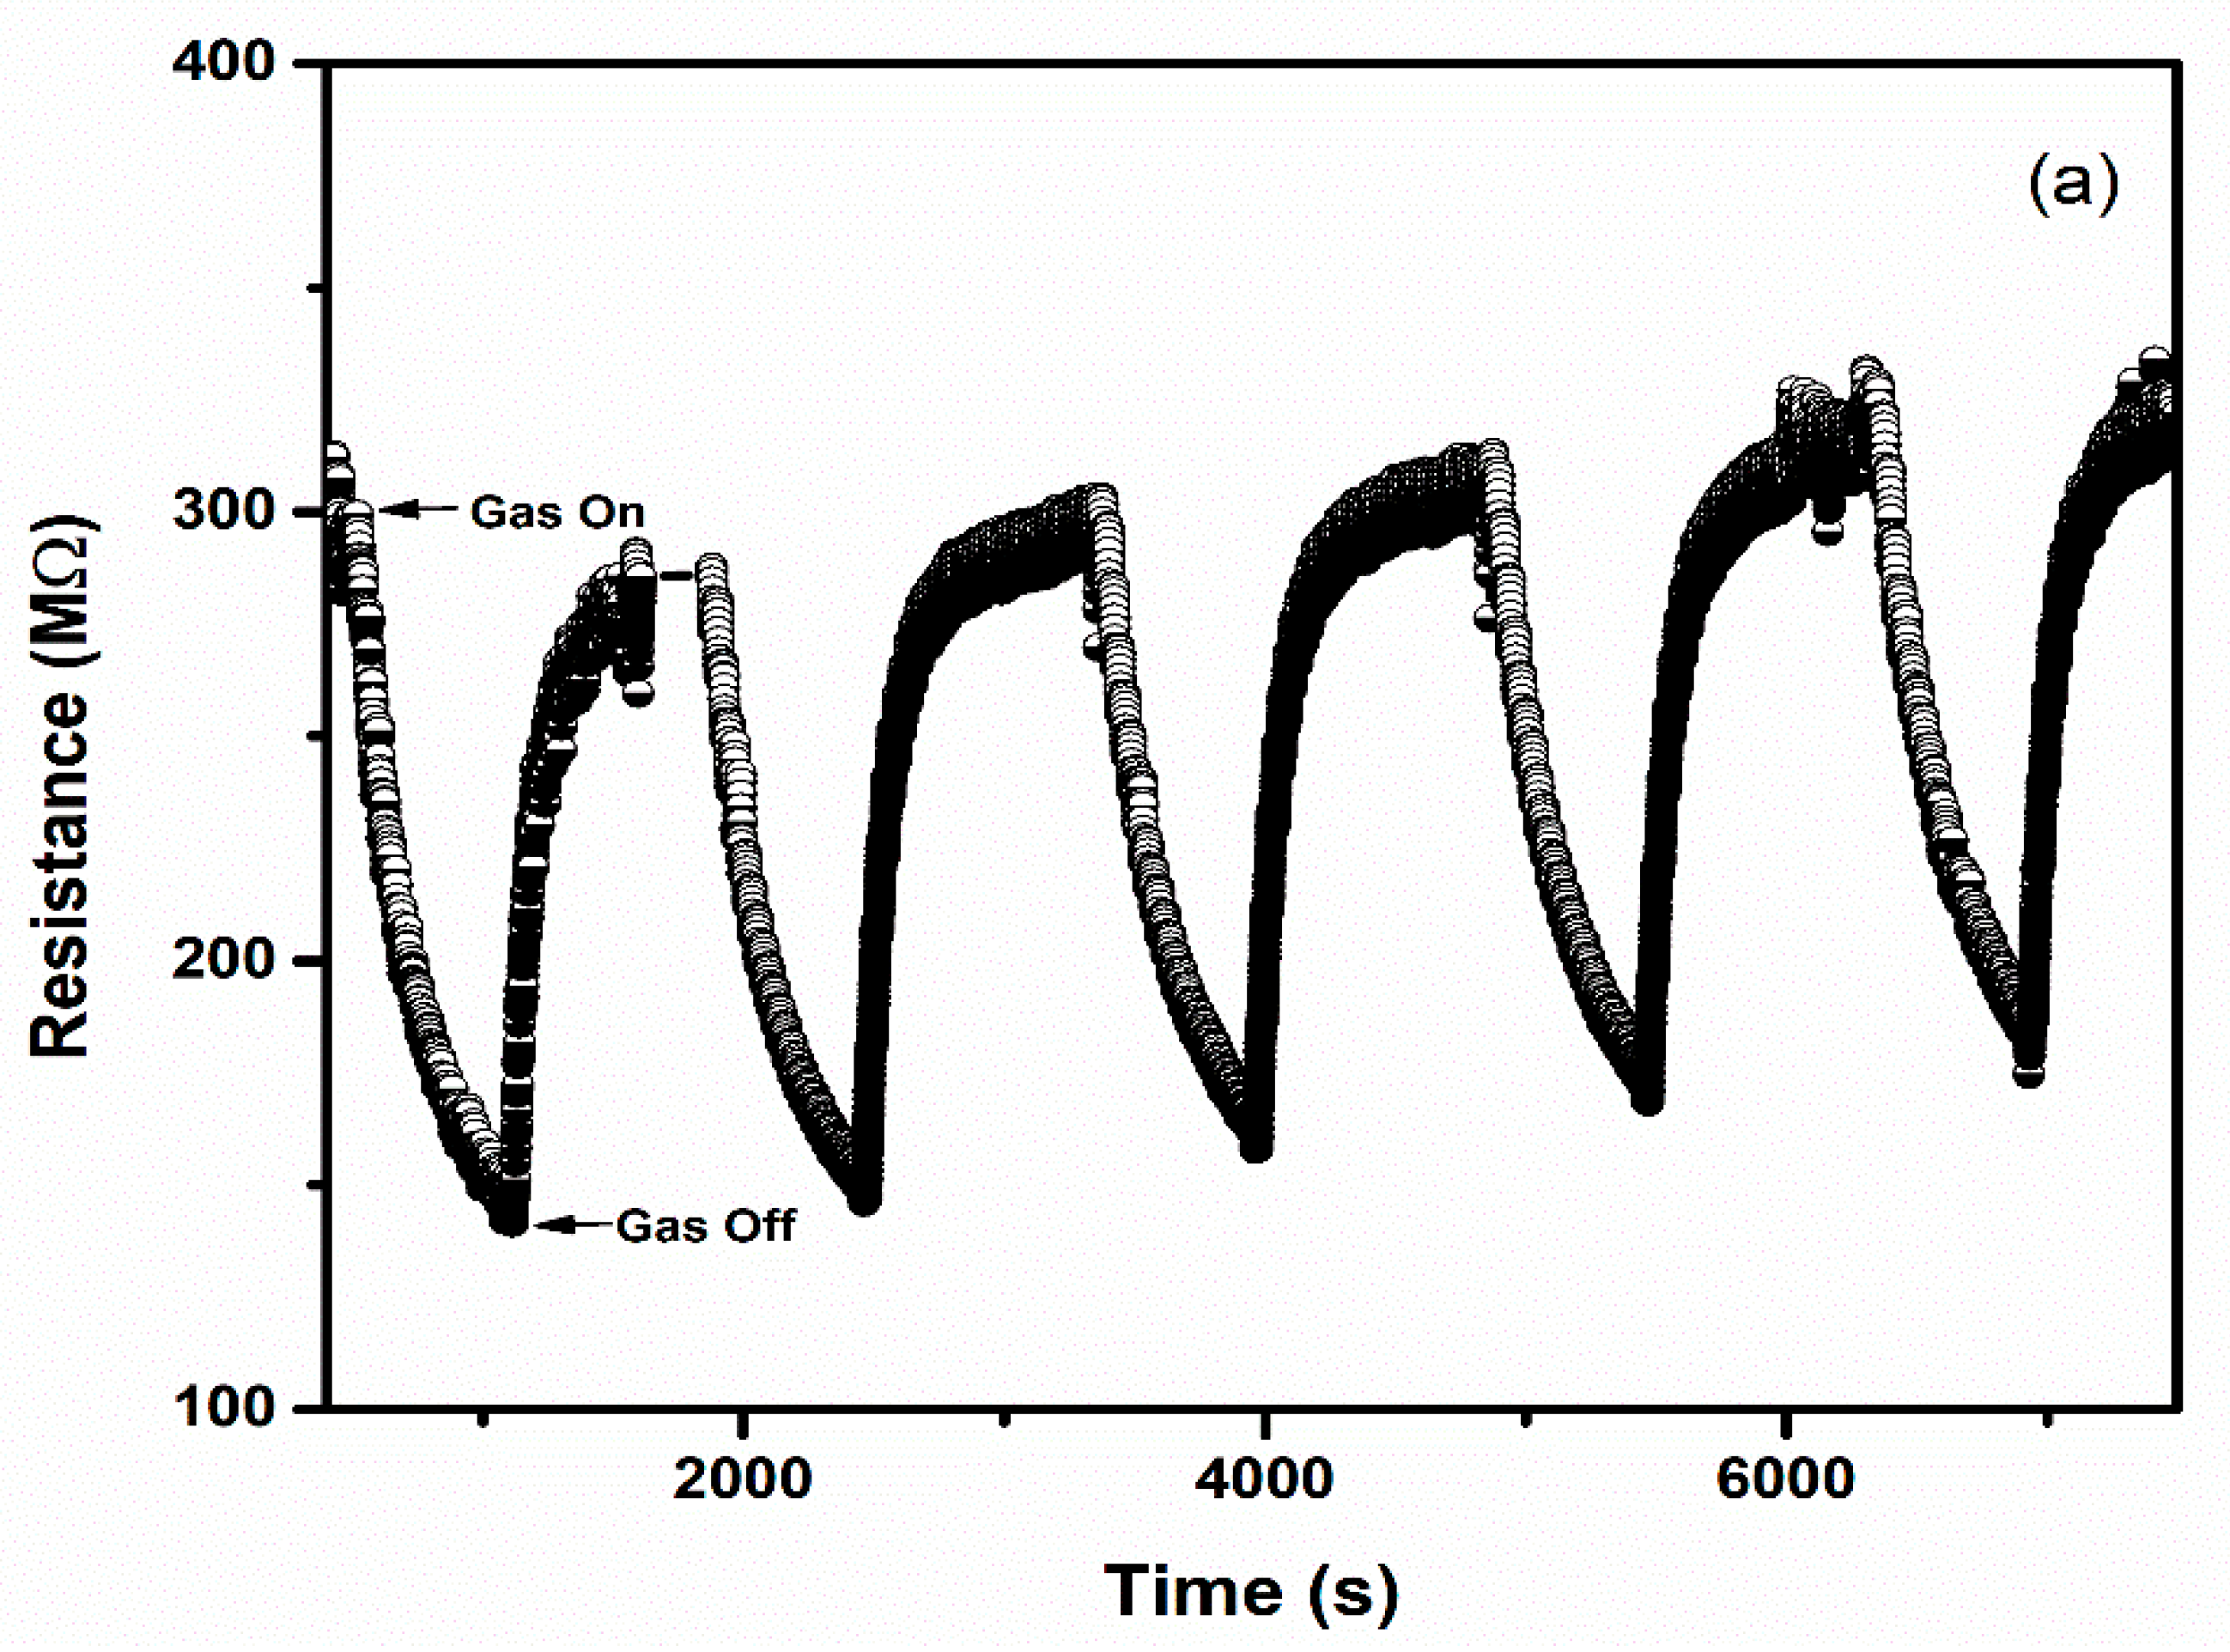
Selectivity and repeatability are the key factors that decide the performance of the sensors. Figure 8 represents the bar graph elucidating sensor responses of WO3 and 1% Ag–WO3 films towards various gases. These films are tested at a 5-ppm concentration towards NH3, CO, CH4, and NO2. Both films showed the highest response to NH3 indicating the selective nature of the deposited films towards ammonia among other gases. Repeatability measurements of about 5 cycles were performed for both WO3 and 1% Ag–WO3 films, shown in Figure 9a,b. Almost repeatable sensing characteristics were obtained 5 times for NH3 purge at 5 ppm concentration, implying the stable response of the films. In comparison, sensing properties of the current work with the previously reported literature is given in Table 2. The WO3 nanoflakes synthesized via spray pyrolysis detected the lowest NH3 concentration to be up to 120 ppm at 150 °C [36], while the V-WO3 films synthesized by soft chemical route exhibited a detection limit of 100 ppm towards NH3 at 300 °C [37]. The Cr–WO3 nanosheets synthesized by acidification with impregnation process detected 2 ppm NH3 at 400 °C [38], whereas the WO3–Fe2O3 nanocomposites by hydrothermal synthesis demonstrated NH3 detection of 25 ppm at 300 °C [39]. In the present work, we were able to achieve lowest detection limit of 500 ppb towards NH3 gas, keeping an operating temperature of 200 °C, which is a significant improvement in the sensing performance compared to the literature presented in Table 2.
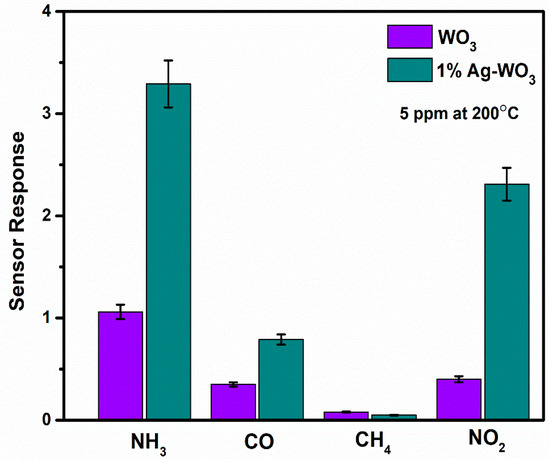
Figure 8.
Representation of selectivity studies for WO3 and 1% Ag–WO3 with error bars.
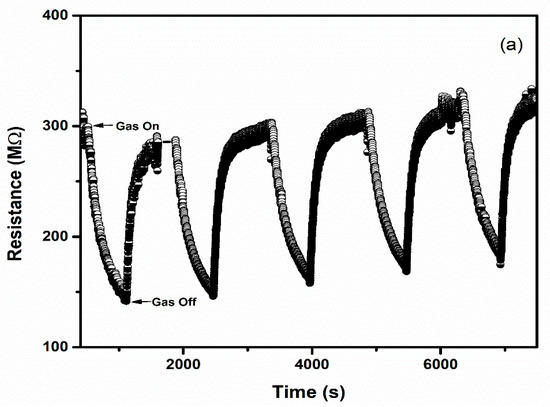
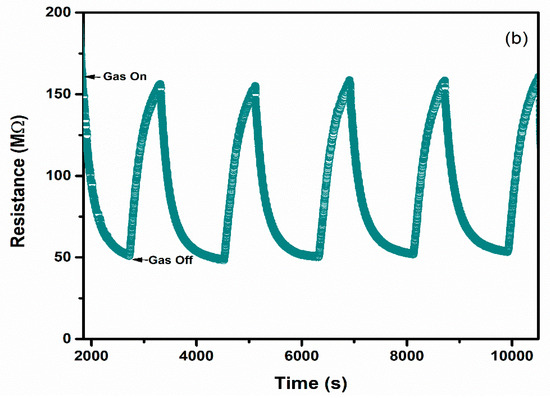
Figure 9.
Repeatable sensing characteristics of (a) WO3 (b) 1% Ag–WO3 at 5 ppm NH3 concentration.
Table 2.
NH3-sensing properties of the present work and reported in the literature.
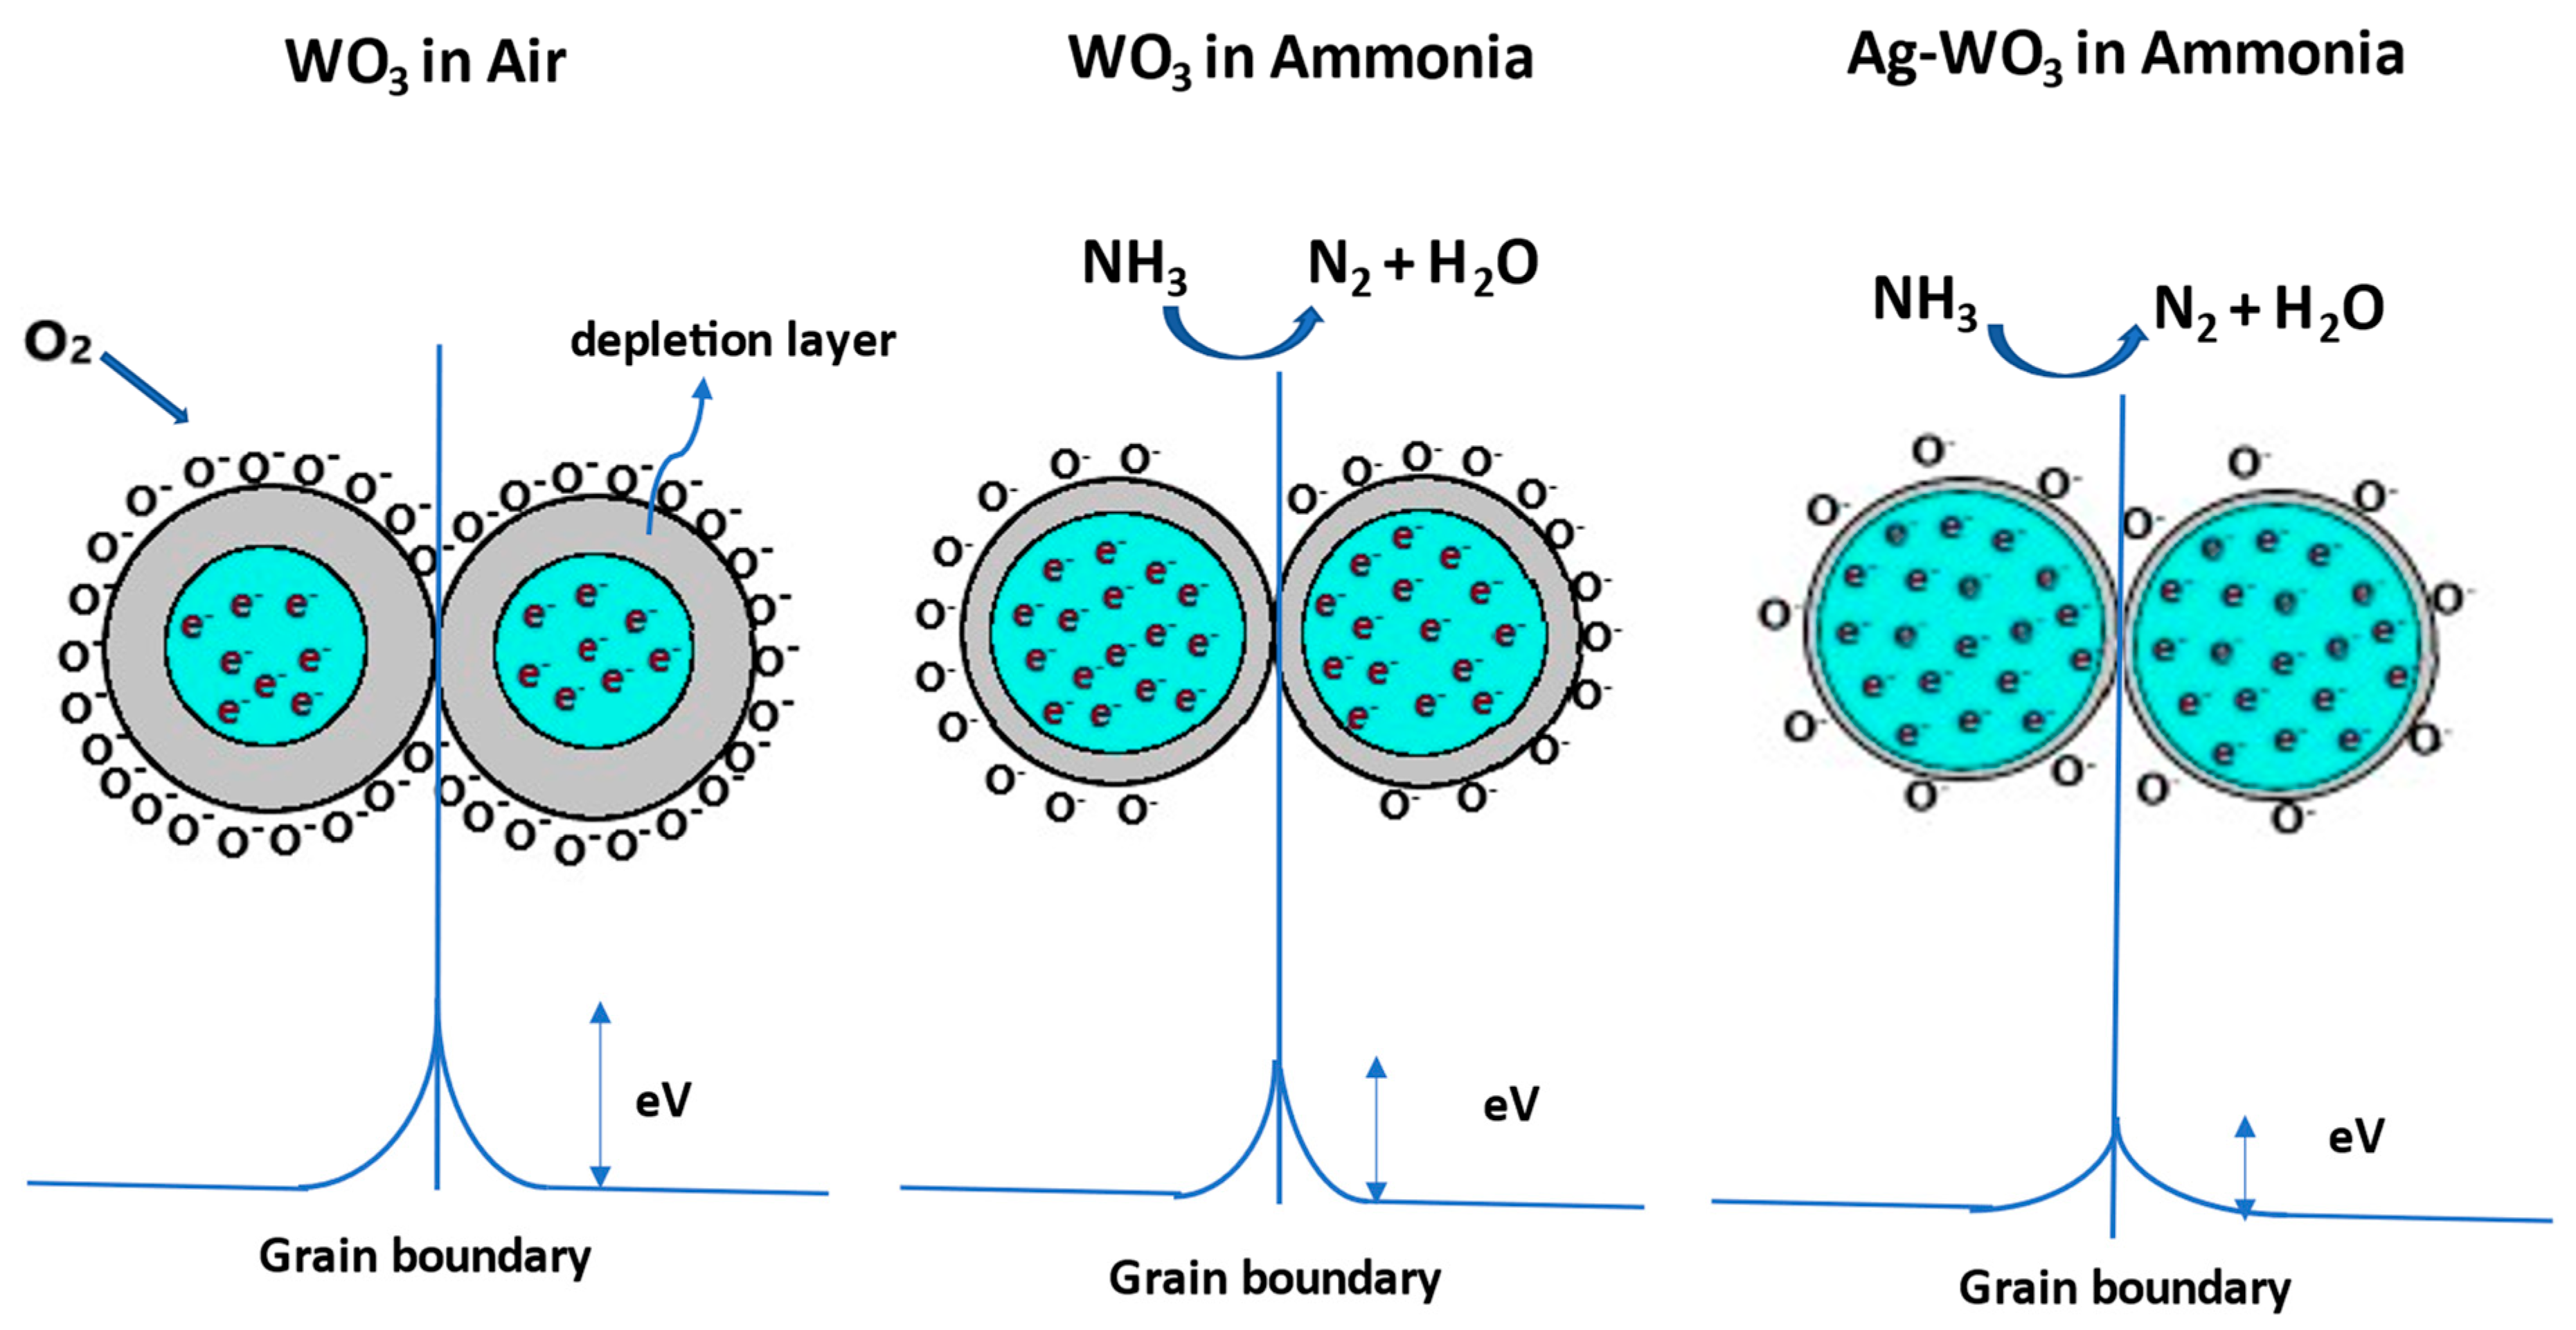
The well-known gas detection mechanism of metal oxide gas sensors involves the resistance variations caused by the chemisorption of gas molecules on the sensor surface. Depending on the operating temperature, WO3 exposure to the synthetic air produces molecular/atomic oxygen ions (). Electron transfer from the surface of the WO3 to the adsorbed oxygen species creates a band bending region called the depletion layer, resulting in a decrease in the carrier concentration of the film and an increase in the resistance. Later, when WO3 is subjected to NH3 exposure, the depletion layer width decreases due to the release of electrons back to the WO3. As Ag–WO3 is exposed to NH3, the depletion layer further decreases due to the electronic sensitization mechanism giving rise to an increment in carrier concentration and a reduction in surface resistance. Figure 10 illustrates the schematic representation of the sensing mechanism. Specific reactions involved in the process are governed by the equations given below [14,35]:
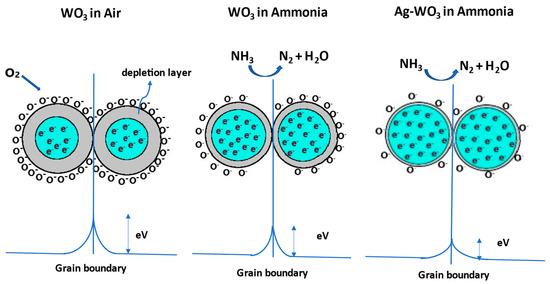
Figure 10.
Sensing mechanism involved between the grains of WO3 and Ag–WO3 films.
4. Conclusions
Spray pyrolyzed Ag–WO3 films were investigated for NH3 sensing at different concentrations. XRD spectra depicted the monoclinic phase of deposited films, which was further verified by Raman analysis. Oxygen vacancies, higher surface roughness, and void-like structures of 1% Ag–WO3 contributed to enhancement in the sensor response value. Selectivity studies of WO3 and 1% Ag–WO3 towards NH3, NO2, CH4, and CO exhibited an excellent response to NH3 compared to other gases. Spray deposited Ag–WO3, as a unique approach for NH3 sensing, produced a superior response at a low operating temperature of 200 °C with a detection limit in the sub-ppm levels.
Author Contributions
Conceptualization, P.P.; methodology, A., A.A. (Albin Antony) and I.V.S.; software, B., K.K.N. and K.B.V.; validation, A., B. and S.C.; formal analysis, A., A.A. (Aninamol Ani), I.V.S. and S.C.; investigation, A.; resources, P.P. and I.V.S.; data curation, A.A. (Aninamol Ani), A.A. (Albin Antony), I.V.S., K.K.N. and K.B.V.; writing—original draft preparation, A.; writing-review and editing, K.B.V.; visualization, A.A. (Albin Antony); supervision, P.P.; project administration, P.P.; funding acquisition, P.P. All authors have read and agreed to the published version of the manuscript.
Funding
This research was funded by Manipal Academy of Higher Education, Manipal (Grant no.: MAHE/DREG/PhD/IMF/2019) And The APC was funded by Manipal Academy of Higher Education, Manipal.
Institutional Review Board Statement
Not Applicable.
Informed Consent Statement
Not Applicable.
Data Availability Statement
The data presented in this study are available on request from the corresponding author.
Acknowledgments
Poornesh P acknowledges Manipal Academy of Higher Education, Manipal for funding the research project through Intramural Funding (Grant no.: MAHE/DREG/PhD/IMF/2019). Anusha acknowledges the Indian Nano electronics User Program (INUP), supported by the Ministry of Human Resource Development (MHRD), Govt. of India, located at the Indian Institute of Science, Bengaluru for providing the facilities to carry out a part of the work.
Conflicts of Interest
The authors declare that they have no conflict of interest.
References
- Vinayakumar, K.B.; Martins, M.; Gaspar, J.; Hutter, T. Ionization Potential Tunable Pyroelectric Ambient Pressure Multi-Gas Detection Platform. In Proceedings of the IEEE International Conference on Micro Electro Mechanical Systems, Gainesville, FL, USA, 25–29 January 2021; pp. 795–798. [Google Scholar]
- Qi, X.; Liu, J.; Liang, Y.; Li, J.; He, S. The response mechanism of surface acoustic wave gas sensors in real time. Jpn. J. Appl. Phys. 2019, 58, 014001. [Google Scholar] [CrossRef]
- Vinayakumar, K.B.; Gund, V.; Lambert, N.; Lodha, S.; Lal, A. Enhanced lithium niobate pyroelectric ionizer for chip-scale ion mobility-based gas sensing. In Proceedings of the 2016 IEEE Sensors, Orlando, FL, USA, 30 October–3 November 2016; pp. 3–5. [Google Scholar]
- Liu, H.; Shen, W.; Chen, X. A room temperature operated ammonia gas sensor based on Ag-decorated TiO2 quantum dot clusters. RSC Adv. 2019, 9, 24519–24526. [Google Scholar] [CrossRef] [Green Version]
- Ravichandran, K.; Santhosam, A.J.; Sridharan, M. Effect of tungsten doping on the ammonia vapour sensing ability of ZnO thin films prepared by a cost effective simplified spray technique. Surf. Interfaces 2020, 18, 100412. [Google Scholar] [CrossRef]
- Jeevitha, G.; Abhinayaa, R.; Mangalaraj, D.; Ponpandian, N.; Meena, P.; Mounasamy, V.; Madanagurusamy, S. Porous reduced graphene oxide (rGO)/WO3 nanocomposites for the enhanced detection of NH3 at room temperature. Nanoscale Adv. 2019, 1, 1799–1811. [Google Scholar] [CrossRef] [Green Version]
- Tesfamichael, T.; Piloto, C.; Arita, M.; Bell, J. Fabrication of Fe-doped WO3 thin films for NO2 sensing at lower operating temperature. Sens. Actuators B Chem. 2015, 221, 393–400. [Google Scholar] [CrossRef] [Green Version]
- Nakarungsee, P.; Srirattanapibul, S.; Issro, C.; Tang, I.M.; Thongmee, S. High performance Cr doped ZnO by UV for NH3 gas sensor. Sens. Actuators A Phys. 2020, 314, 112230. [Google Scholar] [CrossRef]
- Yu, H.; Li, J.; Li, Z.; Tian, Y.; Yang, Z. Enhanced formaldehyde sensing performance based on Ag@WO3 2D nanocomposite. Powder Technol. 2019, 343, 1–10. [Google Scholar] [CrossRef]
- Zeng, Y.; Hua, Z.; Tian, X.; Li, X.; Qiu, Z.; Zhang, C.; Wang, M.; Li, E. Selective detection of methanol by zeolite/Pd-WO3 gas sensors. Sens. Actuators B Chem. 2018, 273, 1291–1299. [Google Scholar] [CrossRef]
- Godbole, R.; Godbole, V.; Bhagwat, S. Palladium enriched tungsten oxide thin films: An efficient gas sensor for hazardous gases. Eur. Phys. J. B 2019, 92, 78. [Google Scholar] [CrossRef]
- Lu, R.; Zhong, X.; Shang, S.; Wang, S.; Tang, M. Effects of sintering temperature on sensing properties of WO3 and Ag–WO3 electrode for NO2 sensor. R. Soc. Open Sci. 2018, 5, 1–11. [Google Scholar] [CrossRef] [Green Version]
- Xu, L.; Yin, M.L.; Liu, S. Superior sensor performance from Ag@WO3 core-shell nanostructure. J. Alloys Compd. 2015, 623, 127–131. [Google Scholar] [CrossRef]
- Yuan, Z.; Zhang, J.; Meng, F.; Li, Y.; Li, R.; Chang, Y.; Zhao, J.; Han, E.; Wang, S. Highly Sensitive Ammonia Sensors Based on Ag-Decorated WO3 Nanorods. IEEE Trans. Nanotechnol. 2018, 17, 1252–1258. [Google Scholar] [CrossRef]
- Castillo, C.; Cabello, G.; Chornik, B.; Huentupil, Y.; Buono-Core, G.E. Characterization of photochemically grown Pd loaded WO3 thin films and its evaluation as ammonia gas sensor. J. Alloys Compd. 2020, 825, 154166. [Google Scholar] [CrossRef]
- Van Tong, P.; Hoa, N.D.; Van Duy, N.; Le, D.T.T.; Van Hieu, N. Enhancement of gas-sensing characteristics of hydrothermally synthesized WO3 nanorods by surface decoration with Pd nanoparticles. Sens. Actuators B Chem. 2016, 223, 453–460. [Google Scholar] [CrossRef]
- National Institute for Occupational Safety and Health; Centers for Disease Control; U.S. Department of Health and Human Services. Occupational Safety and Health Guideline for Ammonia. In Occupational Safety and Health Guidelines; U.S. Department of Health and Human Services: Washington, DC, USA, 1992; pp. 1–7. [Google Scholar]
- Kumar, N.; Sidhu, G.K.; Kumar, R. Correlation of synthesis parameters to the phase segregation and lattice strain in tungsten oxide nanoparticles. Mater. Res. Express 2019, 6, 075019. [Google Scholar] [CrossRef]
- Khemiri, N.; Khalfallah, B.; Abdelkader, D.; Kanzari, M. X-ray Diffraction Spectroscopy Studies of CuIn2n+1 S3n+2 Thin Films. J. Thin Film Sci. Technol. 2014, 3, 7–12. [Google Scholar] [CrossRef]
- Jia, Q.; Ji, H.; Bai, X. Selective sensing property of triclinic WO3 nanosheets towards ultra-low concentration of acetone. J. Mater. Sci. Mater. Electron. 2019, 30, 7824–7833. [Google Scholar] [CrossRef]
- Díaz-Reyes, J.; Castillo-Ojeda, R.; Galván-Arellano, M.; Zaca-Moran, O. Characterization of WO3 thin films grown on silicon by HFMOD. Adv. Condens. Matter Phys. 2013, 2013, 591787. [Google Scholar] [CrossRef] [Green Version]
- Xu, L.; Yin, M.L.; Liu, S. Agx@WO3 core-shell nanostructure for LSP enhanced chemical sensors. Sci. Rep. 2014, 4, 1–7. [Google Scholar] [CrossRef] [Green Version]
- Bittencourt, C.; Llobet, E.; Ivanov, P.; Vilanova, X.; Correig, X.; Silva, M.A.P.; Nunes, L.A.O.; Pireaux, J.J. Ag induced modifications on WO3 films studied by AFM, Raman and x-ray photoelectron spectroscopy. J. Phys. D Appl. Phys. 2004, 37, 3383–3391. [Google Scholar] [CrossRef]
- Shigesato, Y.; Murayama, A.; Kamimori, T.; Matsuhiro, K. Characterization of evaporated amorphous WO3 films by Raman and FTIR spectroscopies. Appl. Surf. Sci. 1988, 34, 804–811. [Google Scholar] [CrossRef]
- Ex, C.; Juan, S.; Km, M.; Claudio, S.; Manuel, S.; Av, U. Obtaining of films of tungsten trioxide (WO3) by resistive heating of a tungsten filament. Superf. Vacío 2008, 21, 12–17. [Google Scholar]
- Cai, G.-F.; Wang, X.-L.; Zhou, D.; Zhang, J.-H.; Xiong, Q.-Q.; Gu, C.-D.; Tu, J.-P. Hierarchical structure Ti-doped WO3 film with improved electrochromism in visible-infrared region. RSC Adv. 2013, 3, 6896–6905. [Google Scholar] [CrossRef]
- Wang, Y.; Cui, X.; Yang, Q.; Liu, J.; Gao, Y.; Sun, P.; Lu, G. Preparation of Ag-loaded mesoporous WO3 and its enhanced NO2 sensing performance. Sens. Actuators B Chem. 2016, 225, 544–552. [Google Scholar] [CrossRef]
- Adilakshmi, G.; Reddy, R.S.; Reddy, A.S.; Reddy, P.S.; Reddy, C.S. Ag-doped WO3 nanostructure films for organic volatile gas sensor application. J. Mater. Sci. Mater. Electron. 2020, 31, 12158–12168. [Google Scholar] [CrossRef]
- Ta, T.K.H.; Tran, T.N.H.; Tran, Q.M.N.; Pham, D.P.; Pham, K.N.; Cao, T.T.; Kim, Y.S.; Tran, D.L.; Ju, H.; Phan, B.T. Surface Functionalization of WO3 Thin Films with (3-Aminopropyl)triethoxysilane and Succinic Anhydride. J. Electron. Mater. 2017, 46, 3345–3352. [Google Scholar] [CrossRef]
- Yu, W.; Shen, Z.; Peng, F.; Lu, Y.; Ge, M.; Fu, X.; Sun, Y.; Chen, X.; Dai, N. Improving gas sensing performance by oxygen vacancies in sub-stoichiometric WO3−x. RSC Adv. 2019, 9, 7723–7728. [Google Scholar] [CrossRef] [Green Version]
- Baig, U.; Gondal, M.A.; Rehman, S.; Akhtar, S. Facile synthesis, characterization of nano-tungsten trioxide decorated with silver nanoparticles and their antibacterial activity against water-borne gram-negative pathogens. Appl. Nanosci. 2020, 10, 851–860. [Google Scholar] [CrossRef]
- Zhang, G.; Li, C.; Cheng, F.; Chen, J. ZnFe2O4 tubes: Synthesis and application to gas sensors with high sensitivity and low-energy consumption. Sens. Actuators B Chem. 2007, 120, 403–410. [Google Scholar] [CrossRef]
- Kumar, M.; Singh, B.; Yadav, P.; Bhatt, V.; Kumar, M.; Singh, K.; Abhyankar, A.C.; Kumar, A.; Yun, J.-H. Effect of structural defects, surface roughness on sensing properties of Al doped ZnO thin films deposited by chemical spray pyrolysis technique. Ceram. Int. 2017, 43, 3562–3568. [Google Scholar] [CrossRef]
- Lee, J.M.; Lee, W. Effects of surface roughness on hydrogen gas sensing properties of single Pd nanowires. J. Nanosci. Nanotechnol. 2011, 11, 2151–2154. [Google Scholar] [CrossRef] [PubMed]
- Arun Kumar, K.D.; Valanarasu, S.; Ponraj, J.S.; Fernandes, B.J.; Shkir, M.; AlFaify, S.; Murahari, P.; Ramesh, K. Effect of Er doping on the ammonia sensing properties of ZnO thin films prepared by a nebulizer spray technique. J. Phys. Chem. Solids 2020, 144, 109513. [Google Scholar] [CrossRef]
- Kolhe, P.S.; Mutadak, P.; Maiti, N.; Sonawane, K.M. Synthesis of WO3 nanoflakes by hydrothermal route and its gas sensing application. Sens. Actuators A Phys. 2020, 304, 111877. [Google Scholar] [CrossRef]
- Jiménez, I.; Vilà, A.M.; Calveras, A.C.; Morante, J.R. Gas-sensing properties of catalytically modified WO3 with copper and vanadium for NH3 detection. IEEE Sens. J. 2005, 5, 385–390. [Google Scholar] [CrossRef]
- Wang, S.; Zhang, H.; Li, H.; Wu, R.; Hua, Z.; Wu, Y.; Tian, X. NH3 sensing properties with Cr-loaded WO3 nanosheets. Chem. Lett. 2020, 49, 1421–1425. [Google Scholar] [CrossRef]
- Dien, N.D.; Phuoc, L.H.; Hien, V.X.; Vuong, D.D.; Chien, N.D. Hydrothermal Synthesis and Ammonia Sensing Properties of WO3/Fe2O3 Nanorod Composites. J. Electron. Mater. 2017, 46, 3309–3316. [Google Scholar] [CrossRef]


Publisher’s Note: MDPI stays neutral with regard to jurisdictional claims in published maps and institutional affiliations. |
© 2022 by the authors. Licensee MDPI, Basel, Switzerland. This article is an open access article distributed under the terms and conditions of the Creative Commons Attribution (CC BY) license (https://creativecommons.org/licenses/by/4.0/).