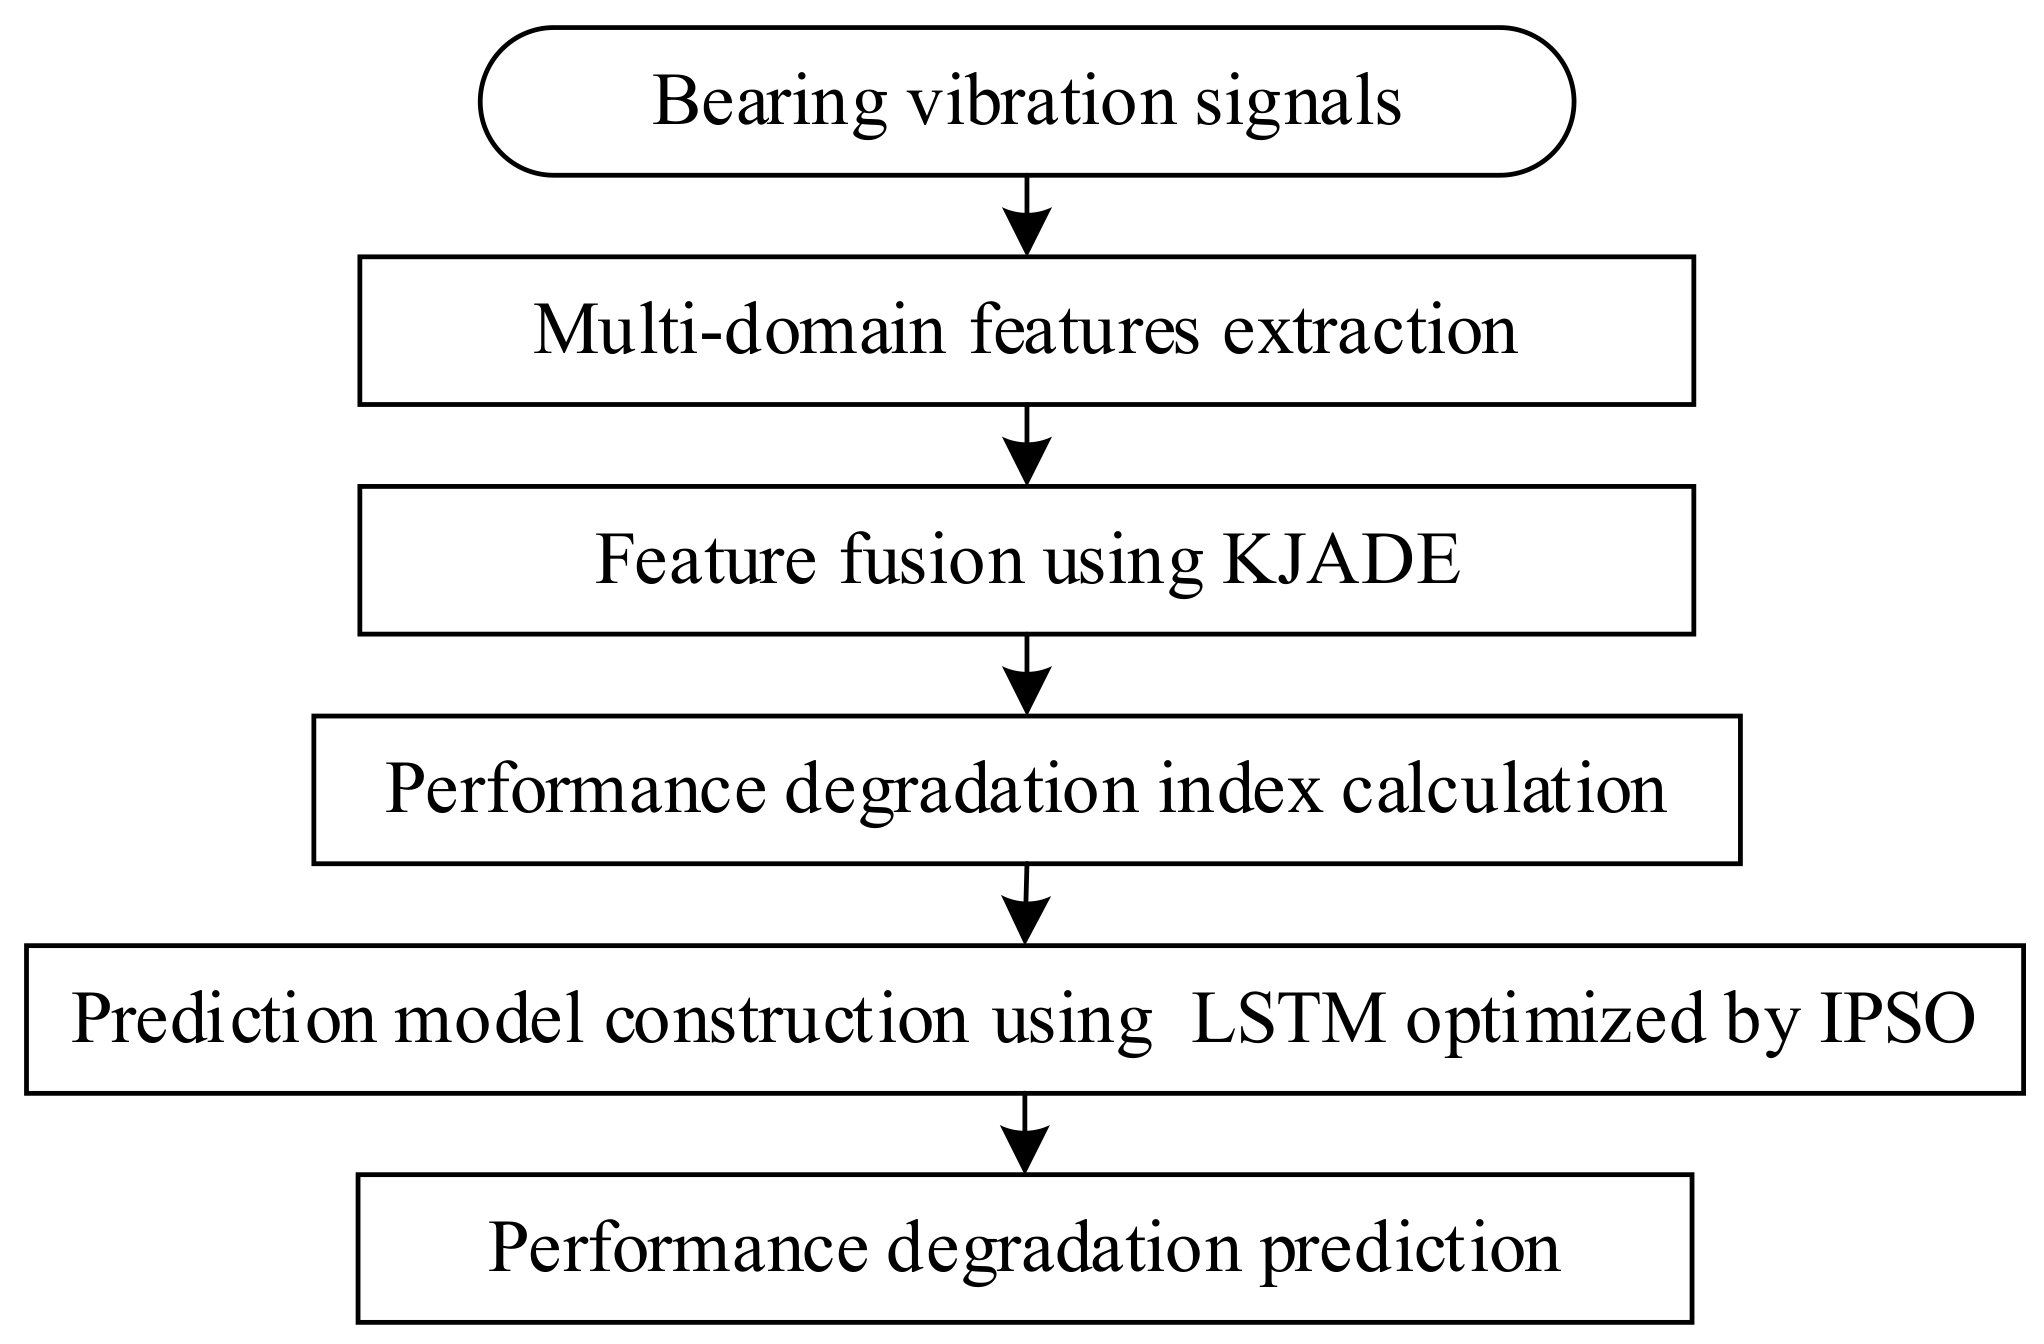
4.1. Case 1
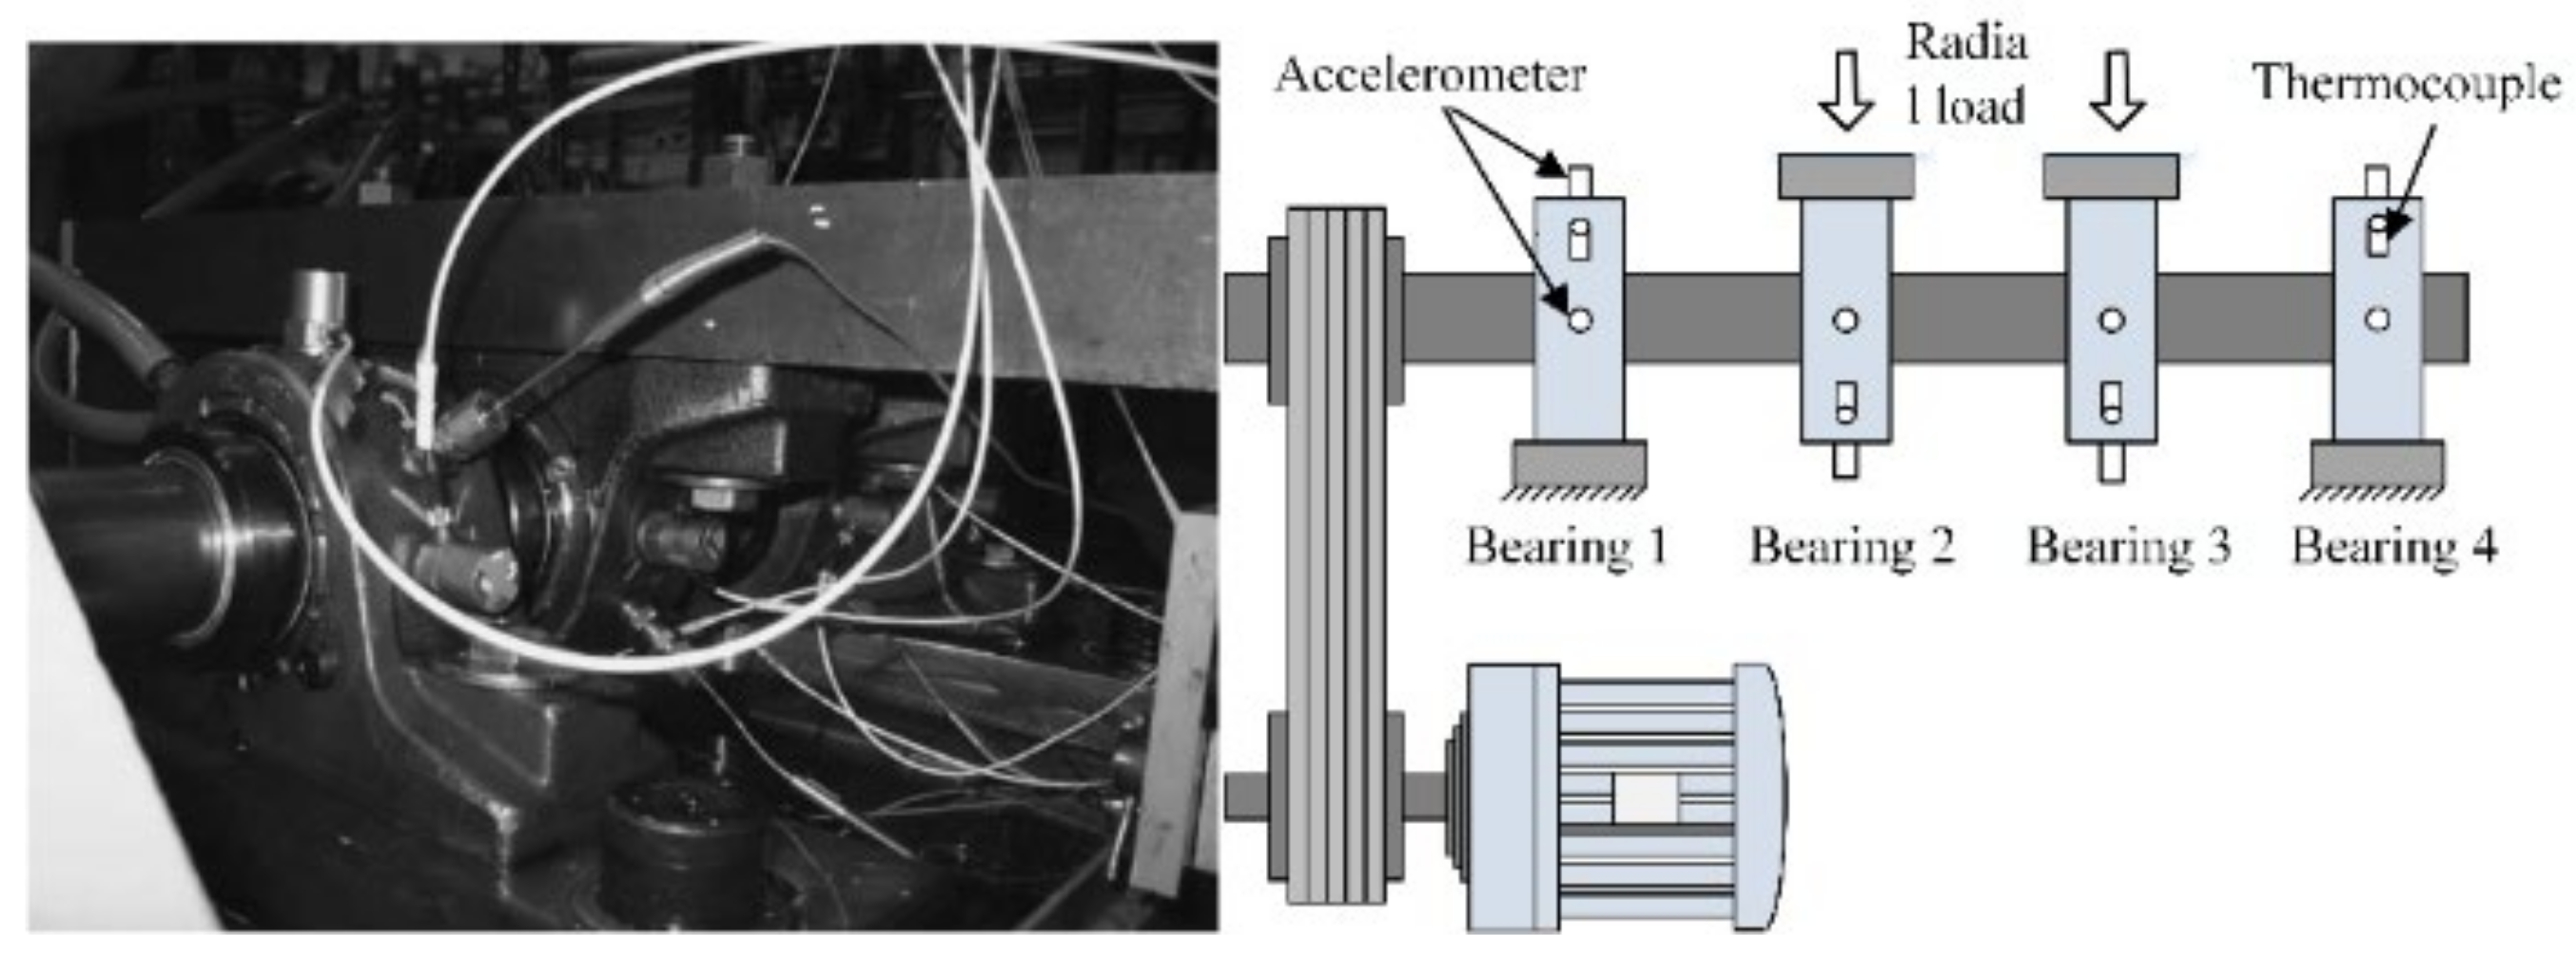
The Intelligent Maintenance System (IMS) Center of the University of Cincinnati’s full-life vibration signals of bearings are used to confirm the proposed method [
28]. The experimental platform is shown in
Figure 4.
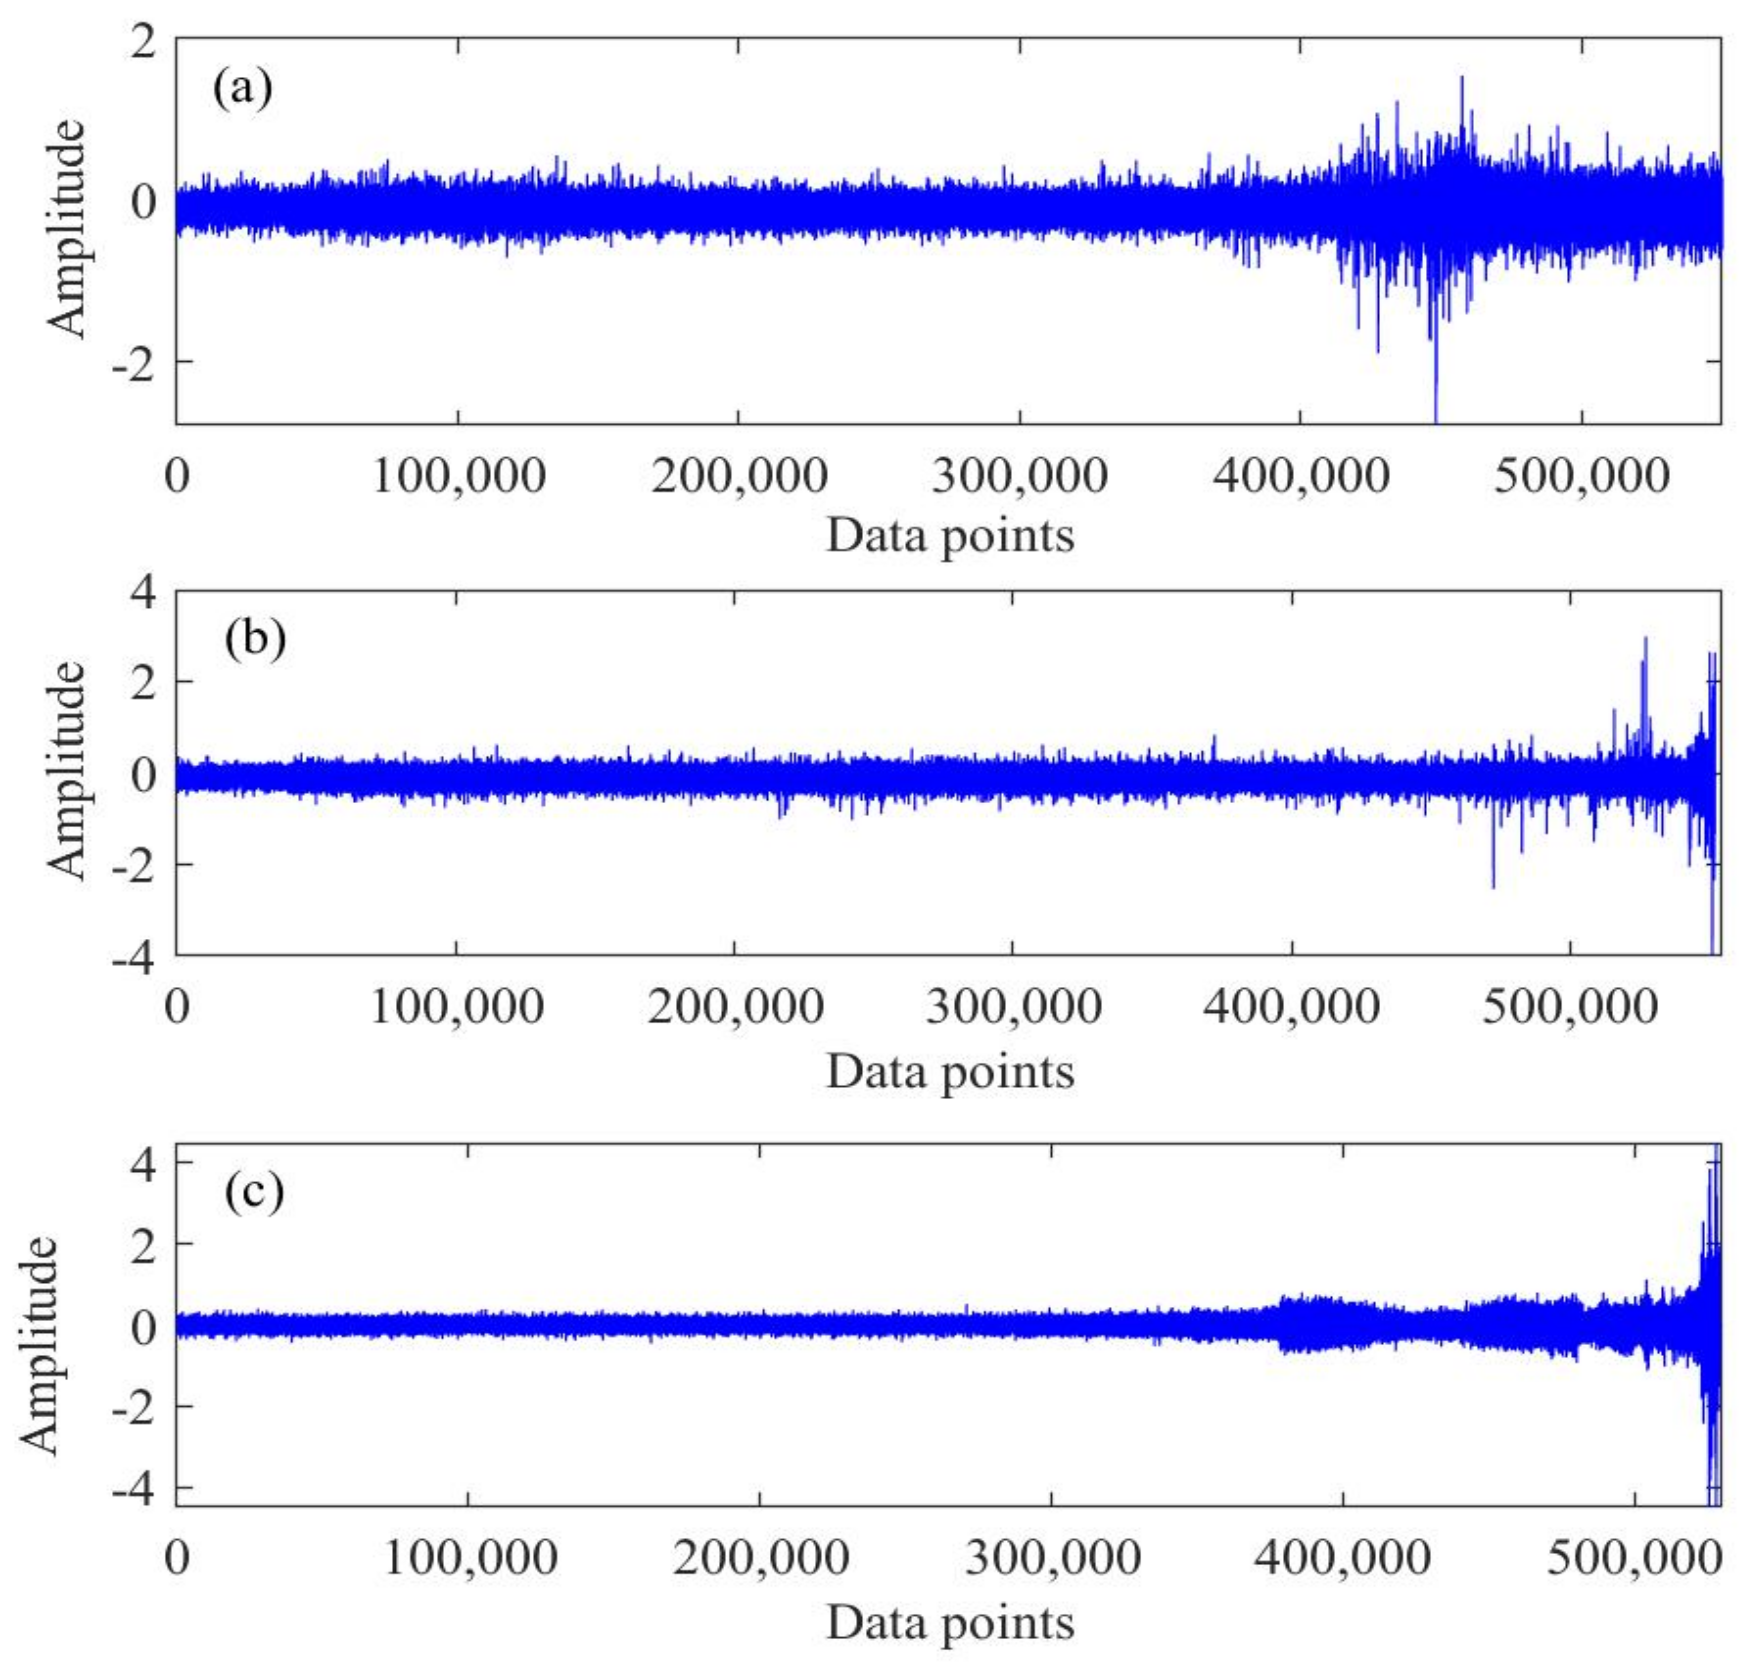
The bearing type is ZA-2115, and the experimental conditions were as follows: output speed was 2000 rpm, the radial load was 6000 lbs, and the sampling frequency was 20,480 Hz. A total of 984 sets of vibration signal data were recorded. The whole experiment was completed in three groups. By the end of the experiment, an inner fault in bearing 3 and a rolling fault in bearing 4 were observed in the first group. An outer fault in bearing 1 in the second group and an outer fault in bearing 3 in the third group were also observed. Among them, the rolling fault and inner fault in the first group, along with the outer fault in the second group, were selected as objects for analysis. The corresponding vibration data of life is shown in
Figure 5.
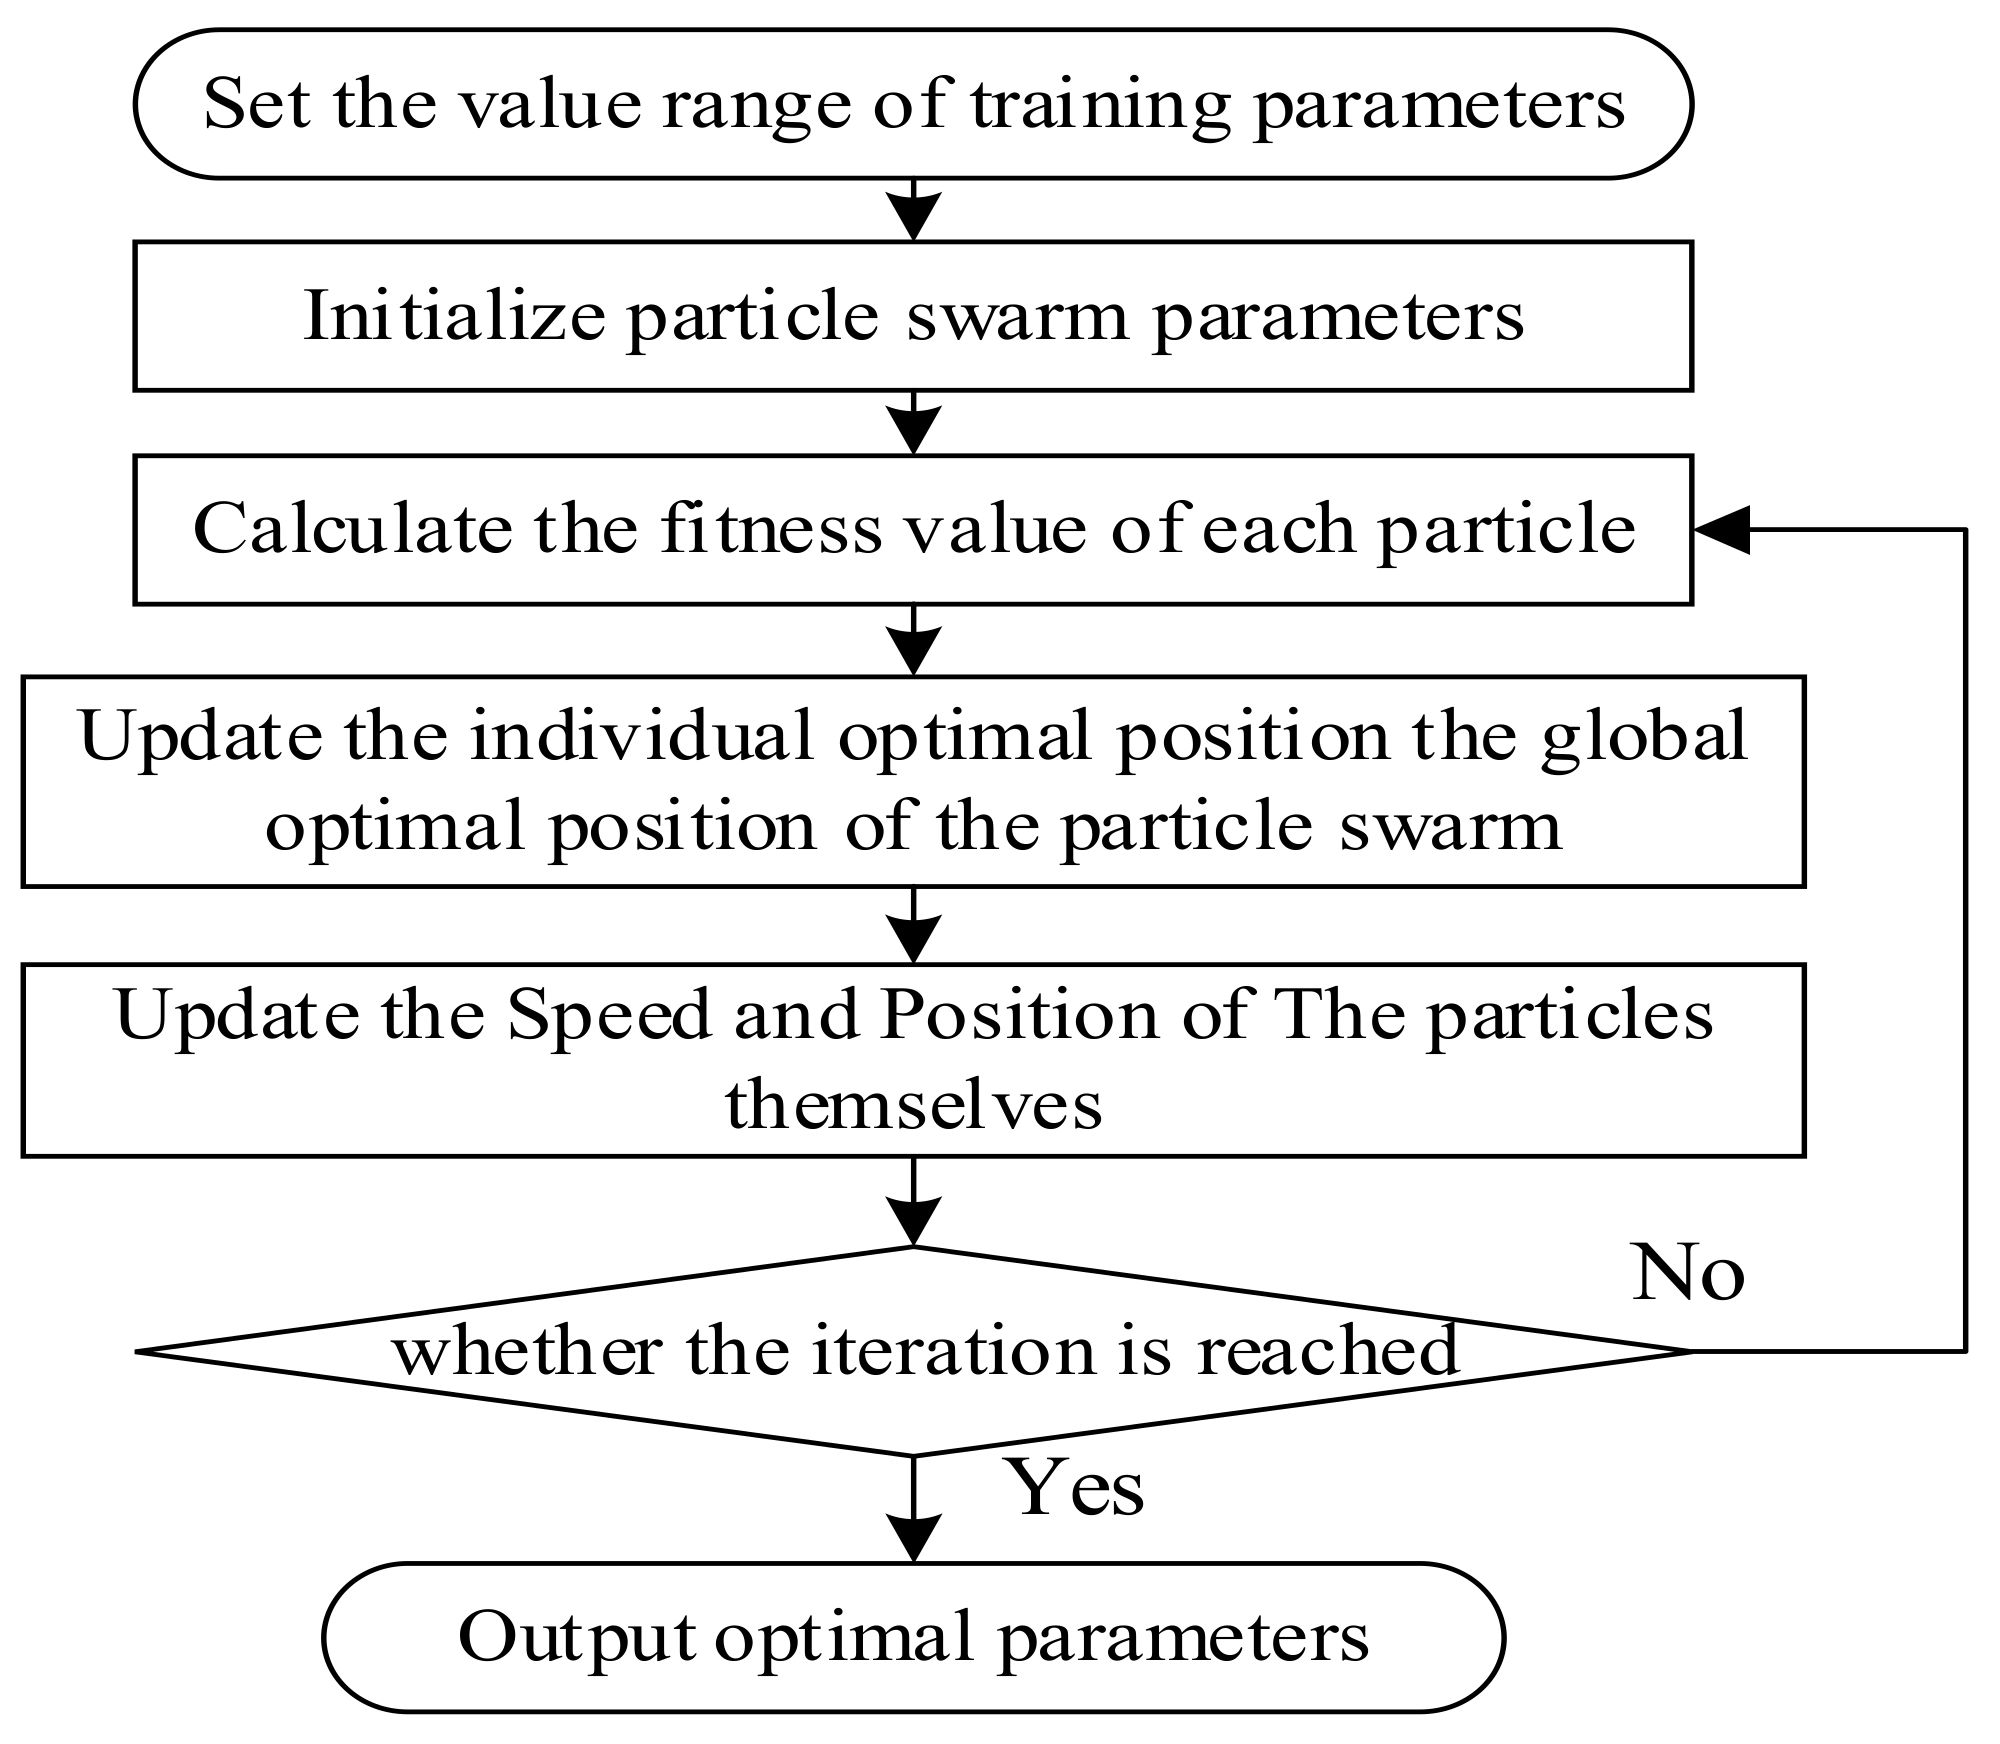
Based on the method in
Section 2, the IPSO algorithm is used to optimize the LSTM model’s predictive parameters. The initial parameters of the IPSO are as follows: the number of particles is 10, the dimension of particle swarm is 3, the maximum velocity of the particle is 1, and the maximum iteration number is 50. The range of particle locations, namely the number of hidden layer nodes, is set to (100, 300), and the batch size is (30, 200). The upper and lower limits of the inertia weight are
w_max = 0.9 and
w_min = 0.5, while the upper and lower limits of the initial learning factors
c_max and
c_min are 2 and 1, respectively. These are the optimal parameters obtained by comparative experiments. In this study, the first 60% of the performance data is used as the training set, and 20% of the rest is saved as a validation set. Besides this, the model is optimized by an Adam algorithm, and the root mean square error (RMSE) is applied as the target criteria.
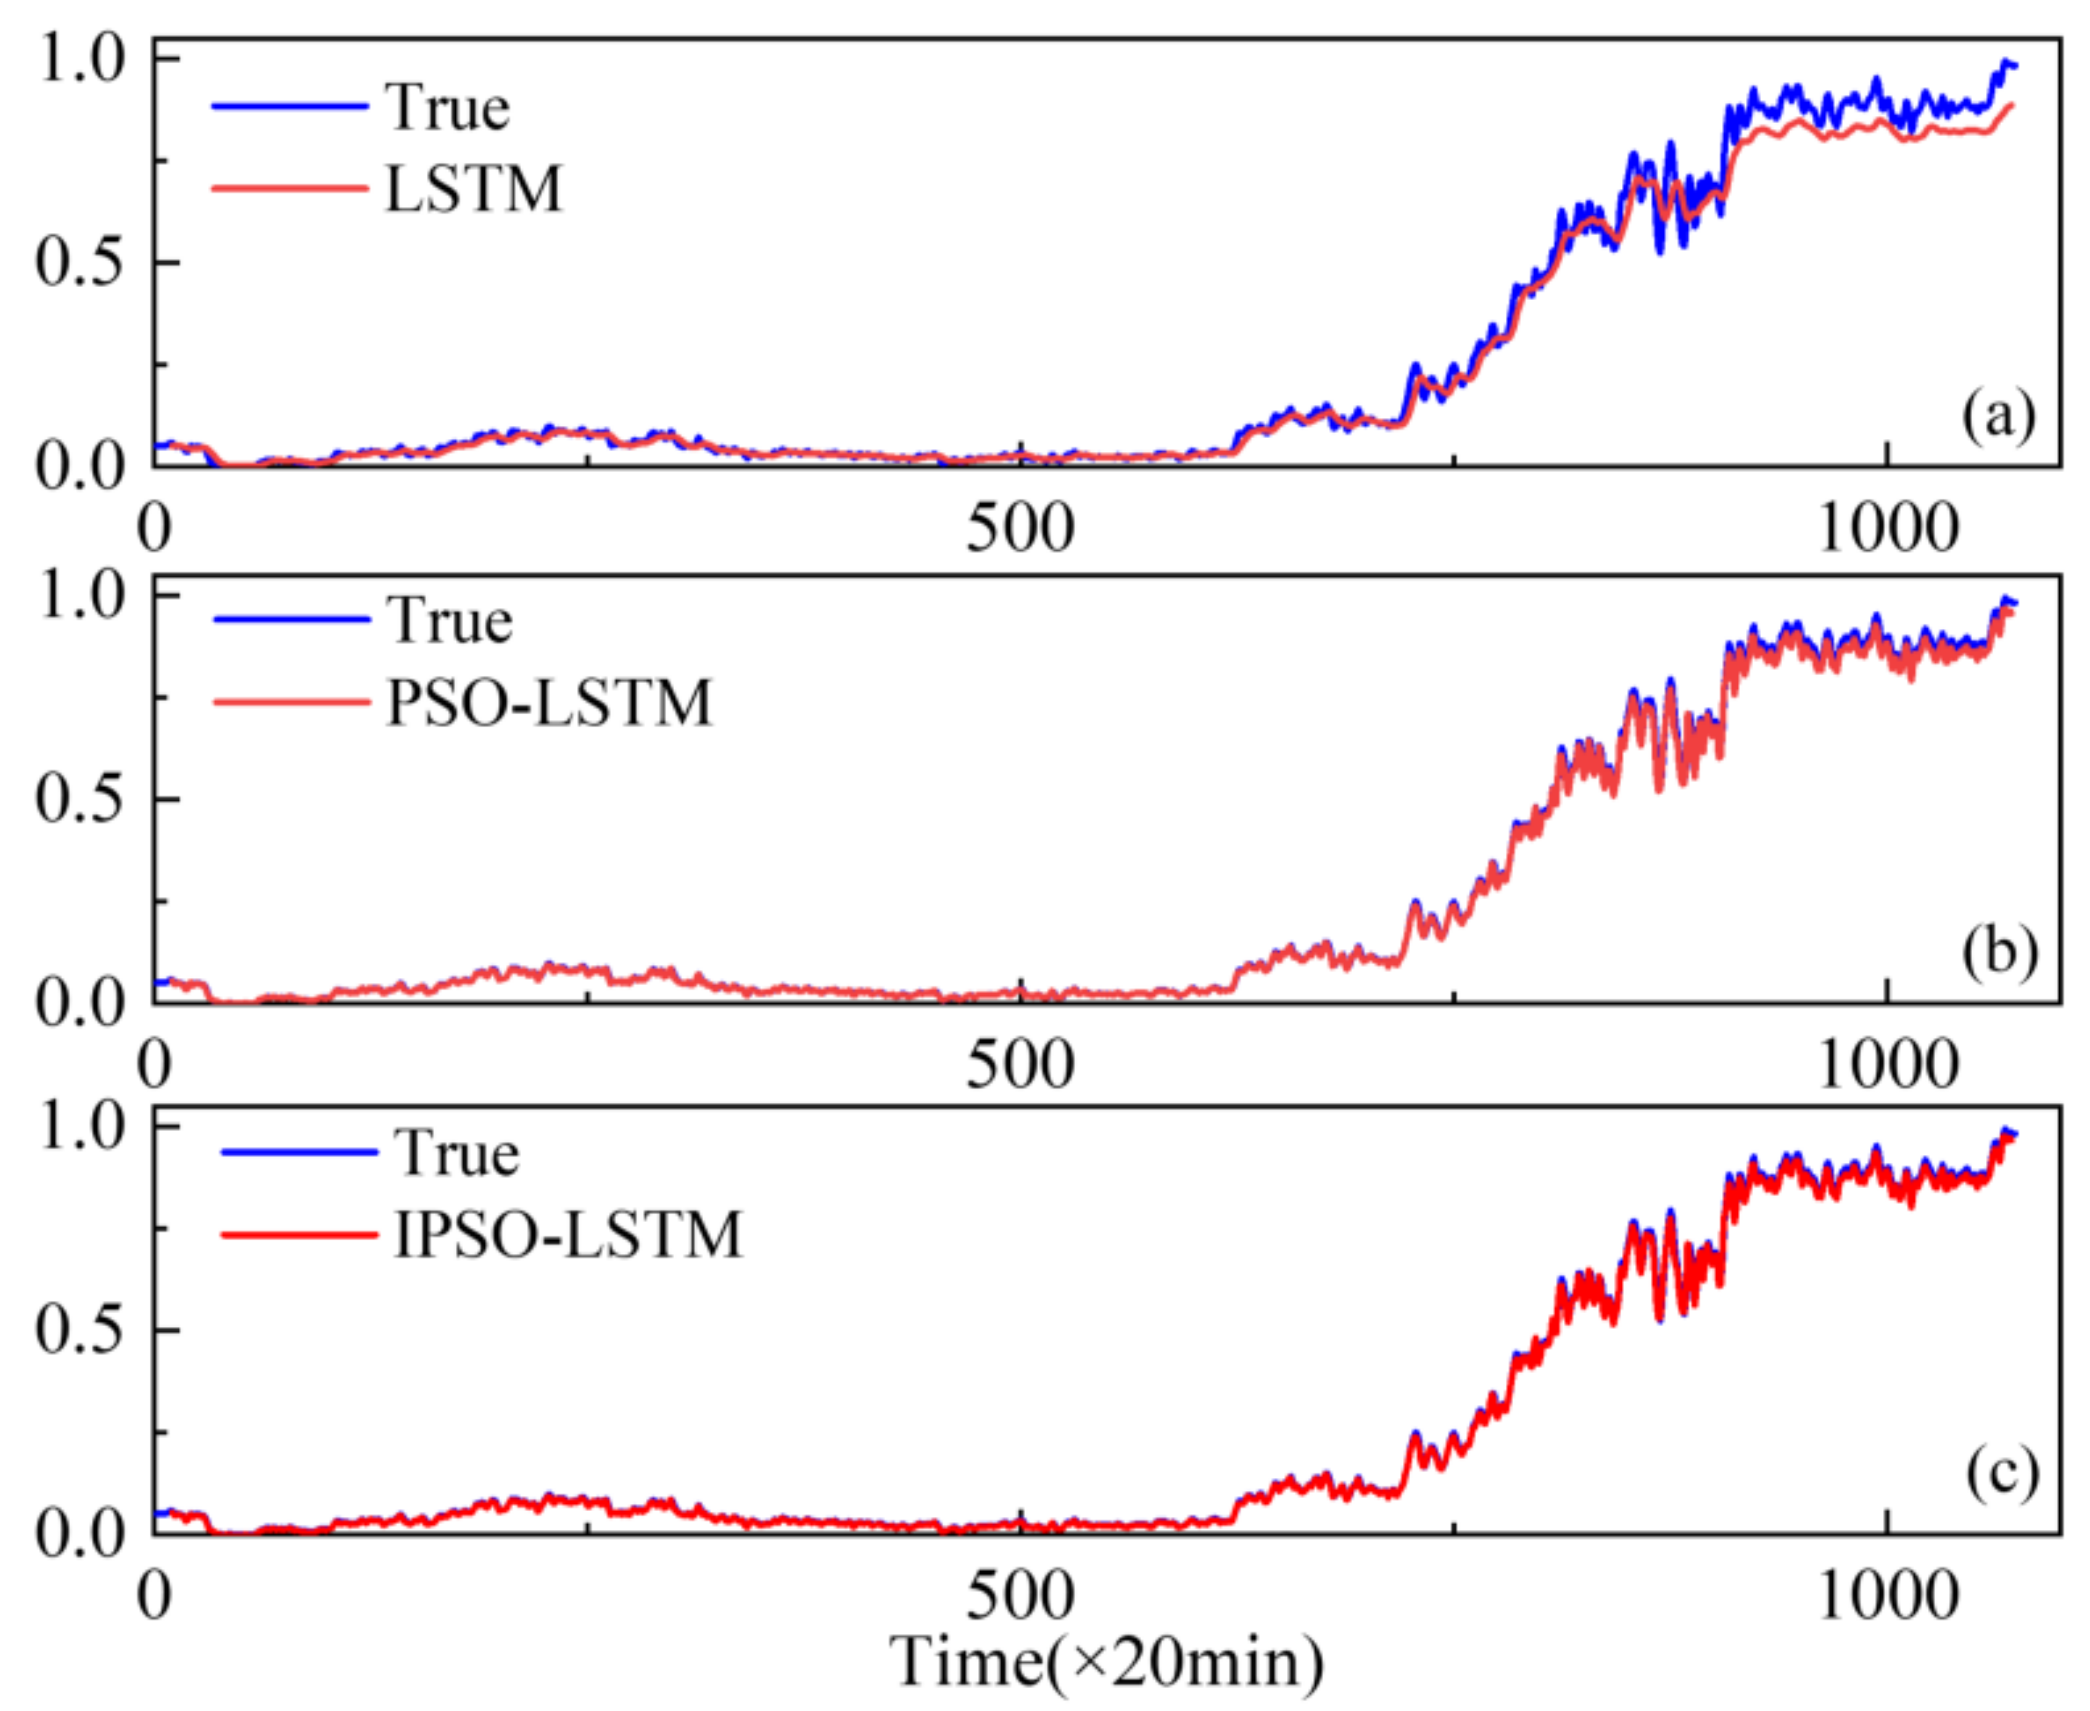
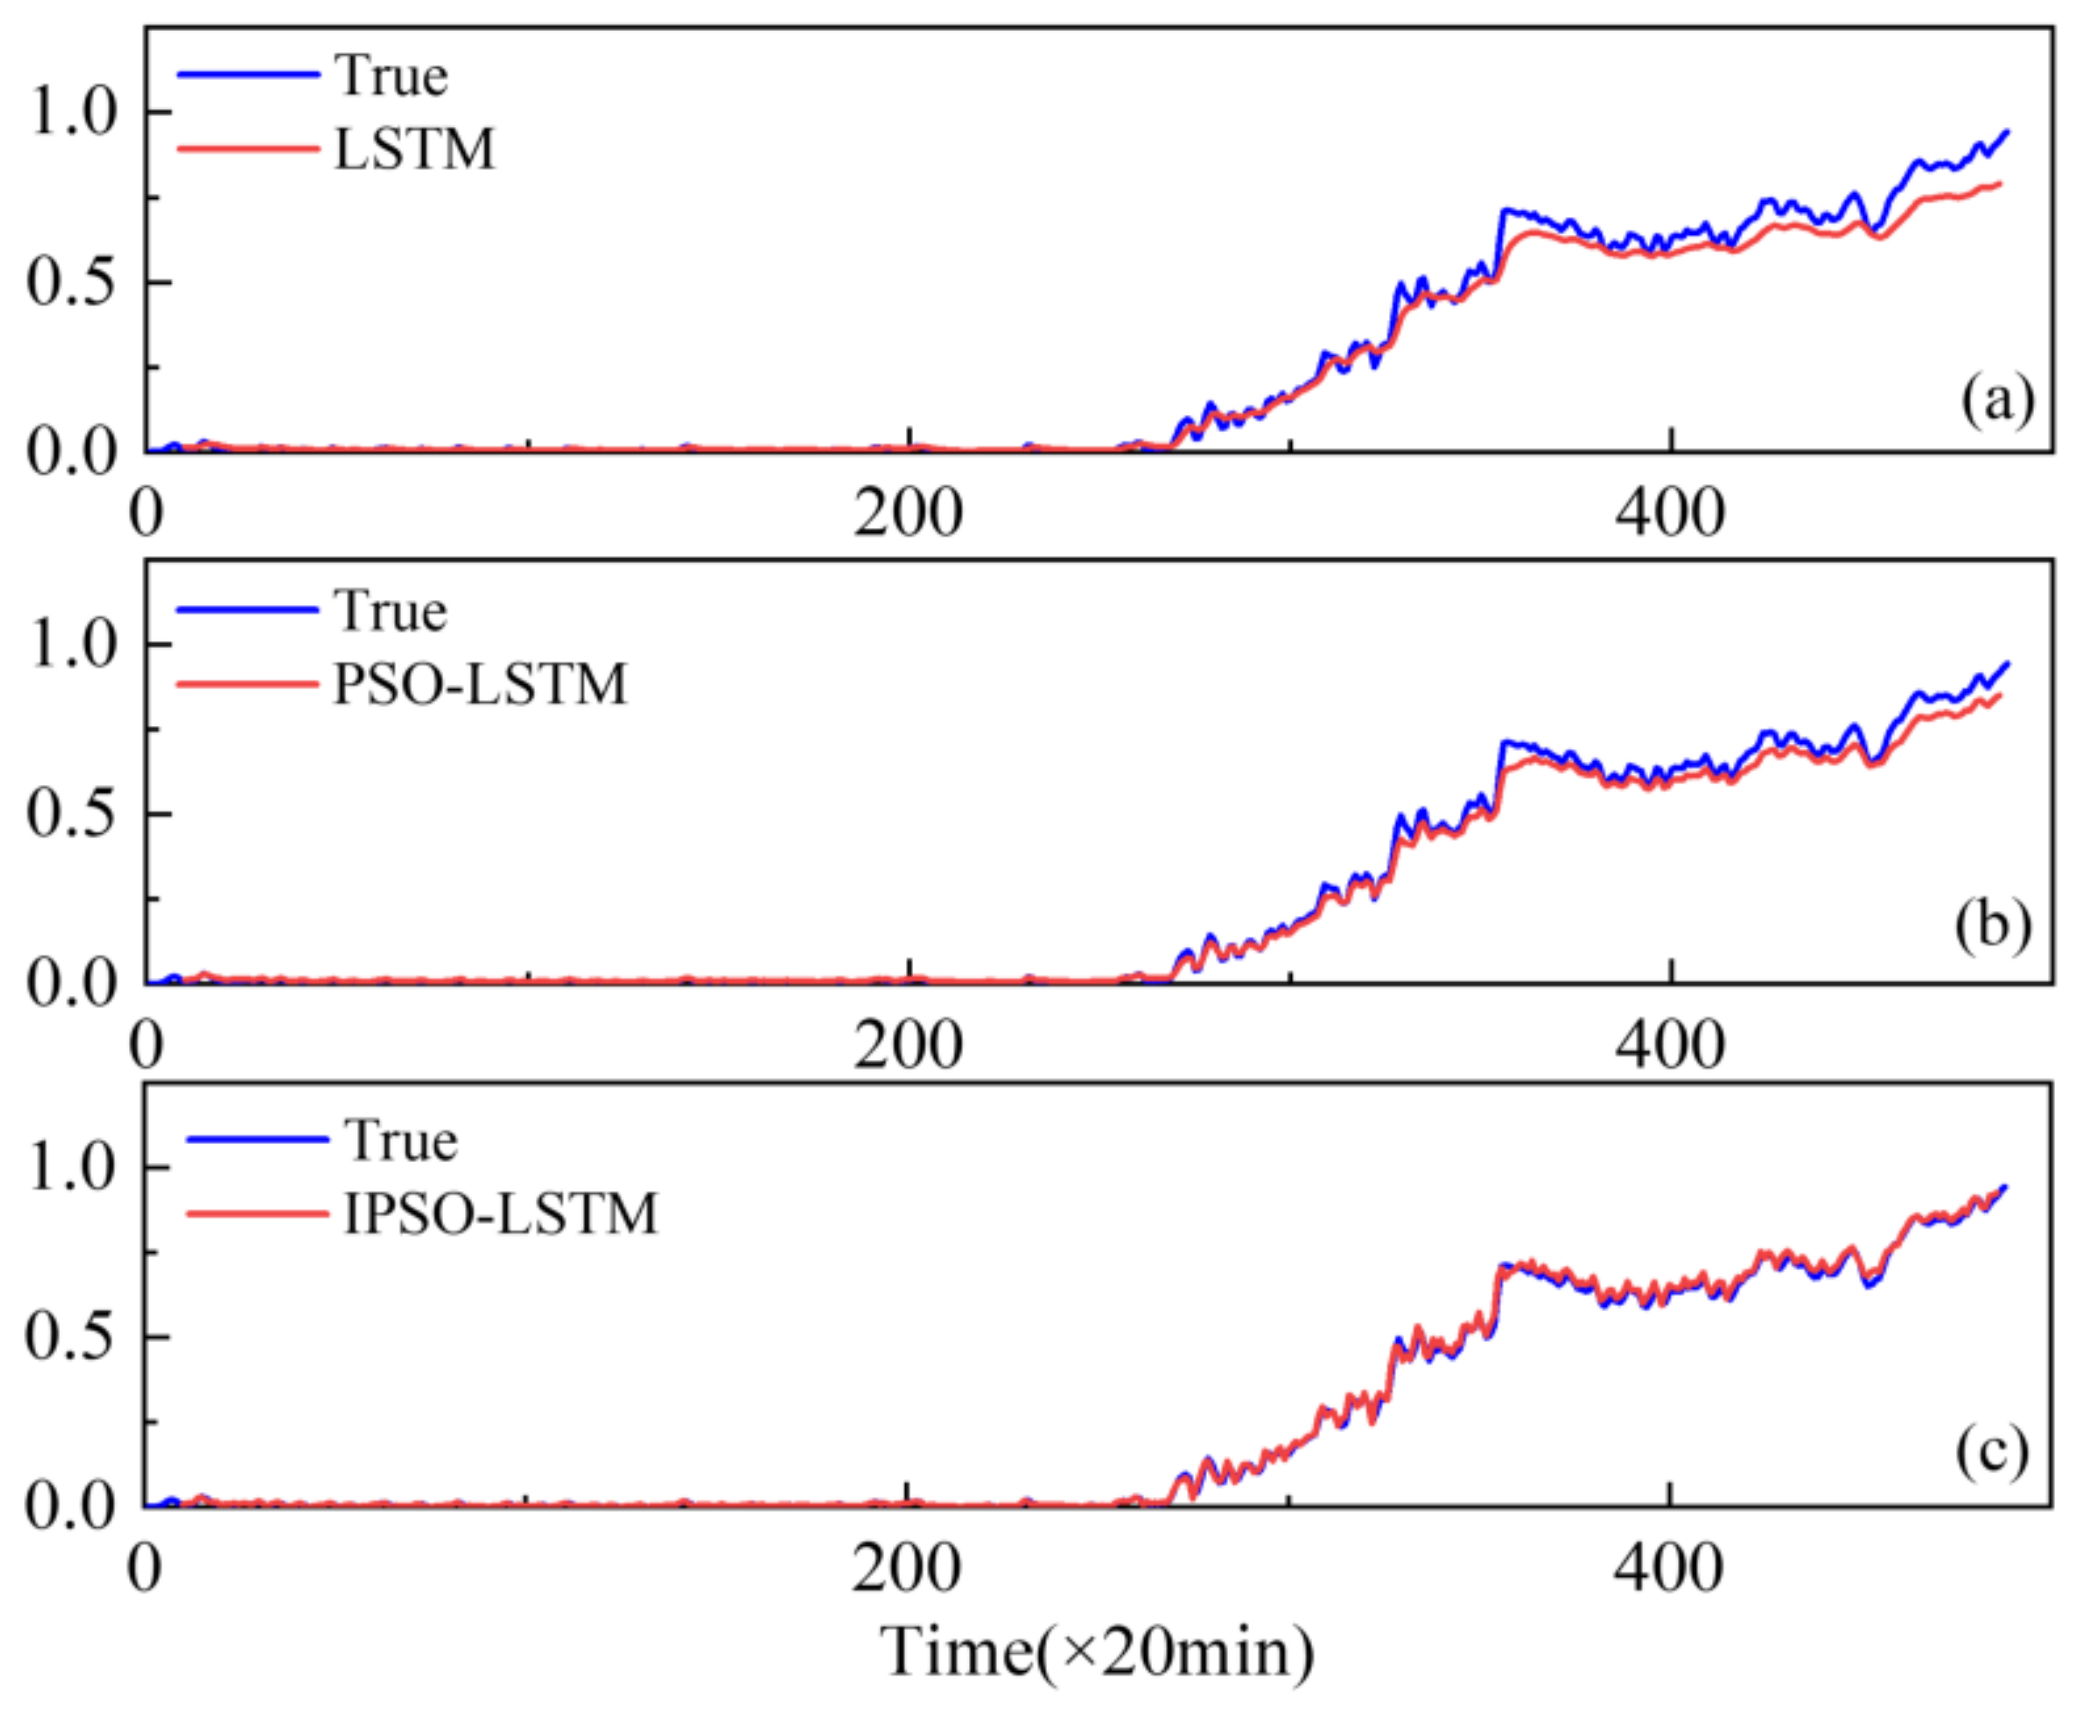
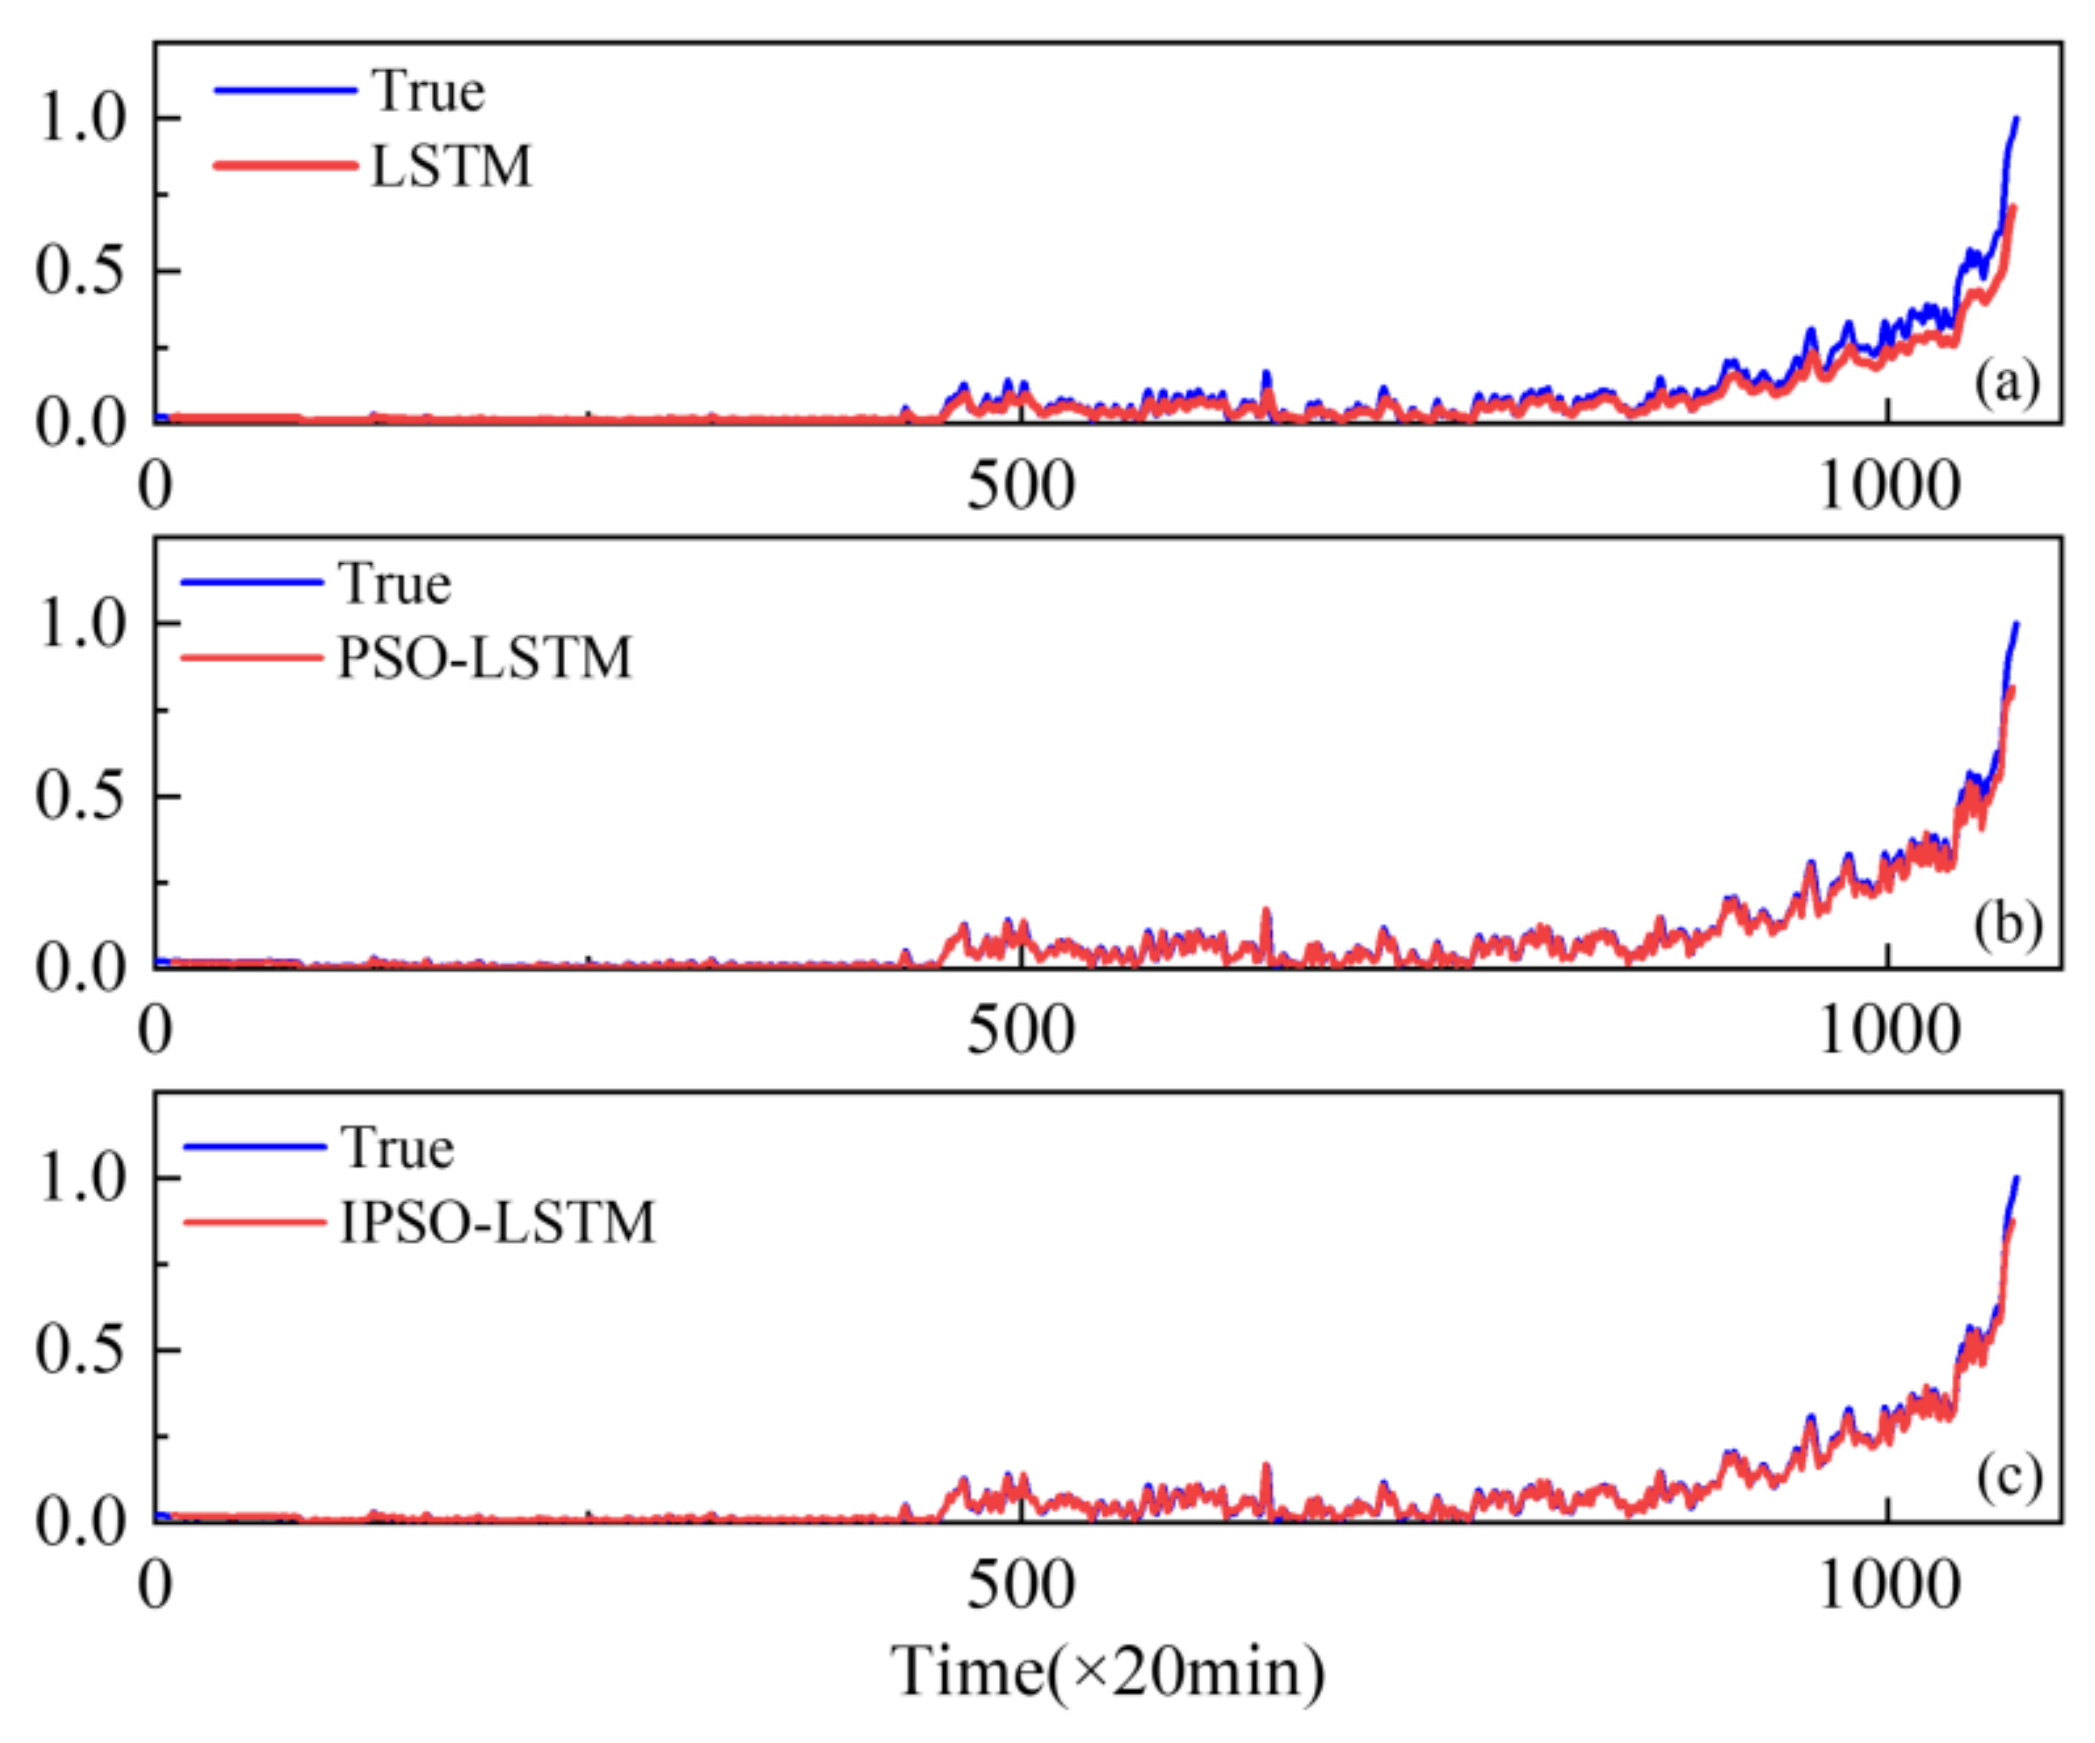
To demonstrate the superiority of the proposed method, the performance of conventional LSTMs and PSO-LSTMs have been compared. The resulting real degradation trends, which can be expressed as a degradation index, are obtained via feature fusion using the KJADE algorithm. Additionally, the comparison results of the degradation trends predicted by each model are shown in
Figure 6,
Figure 7 and
Figure 8, where the y-axis is the degradation index. In addition, RMSE is used as an additional metric to measure the performance of the model, with the results shown in
Table 3. The RMSE calculation is shown in Equation (13).
where
is the predicted value;
is the actual observation;
n is the total number of samples in the faulty bearing.
From
Figure 6,
Figure 7 and
Figure 8, it can be seen that our proposed IPSO-LSTM method tracks the degenerate states significantly better than the other two methods in all three failure modes, especially the LSTM method without the hyper-parameter optimization process. In terms of quantitative metrics, the RMSE results in
Table 3 also illustrate the superiority of the proposed method.
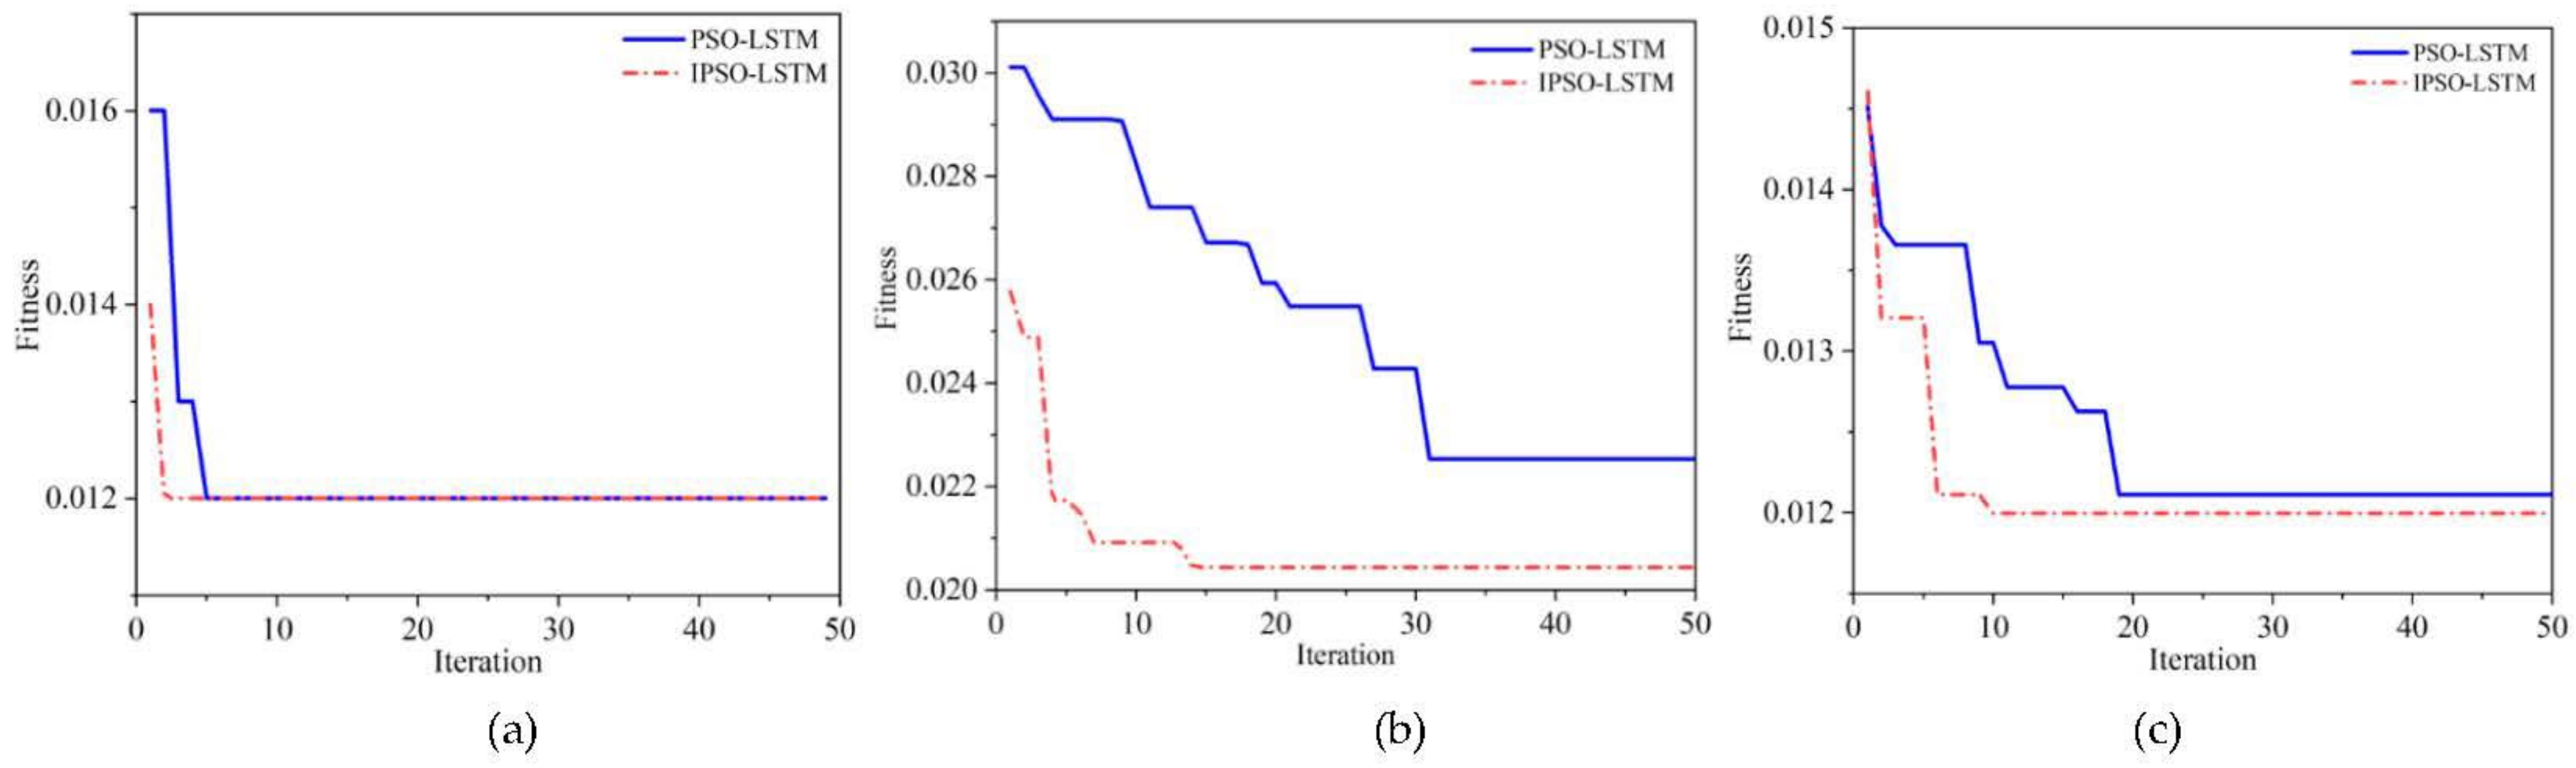
The above results show that the IPSO algorithm is effective in optimizing the hyper-parameters of the LSTM based network, which can automatically and accurately search for the optimal parameters. To further illustrate the advantages of the IPSO algorithm in optimizing speed and avoiding local extremum, we visualize the parameter search processes, which are shown in
Figure 9.
Overall, the convergence speed and fitness of the IPSO algorithm are better than the traditional PSO algorithm. Specifically, as
Figure 9b,c demonstrate, IPSO has good optimization ability and can quickly find the optimal global point. Compared with the PSO, the IPSO algorithm has a faster convergence speed.
Figure 9a shows that although the final fitness error is the same, the IPSO algorithm converge is faster.
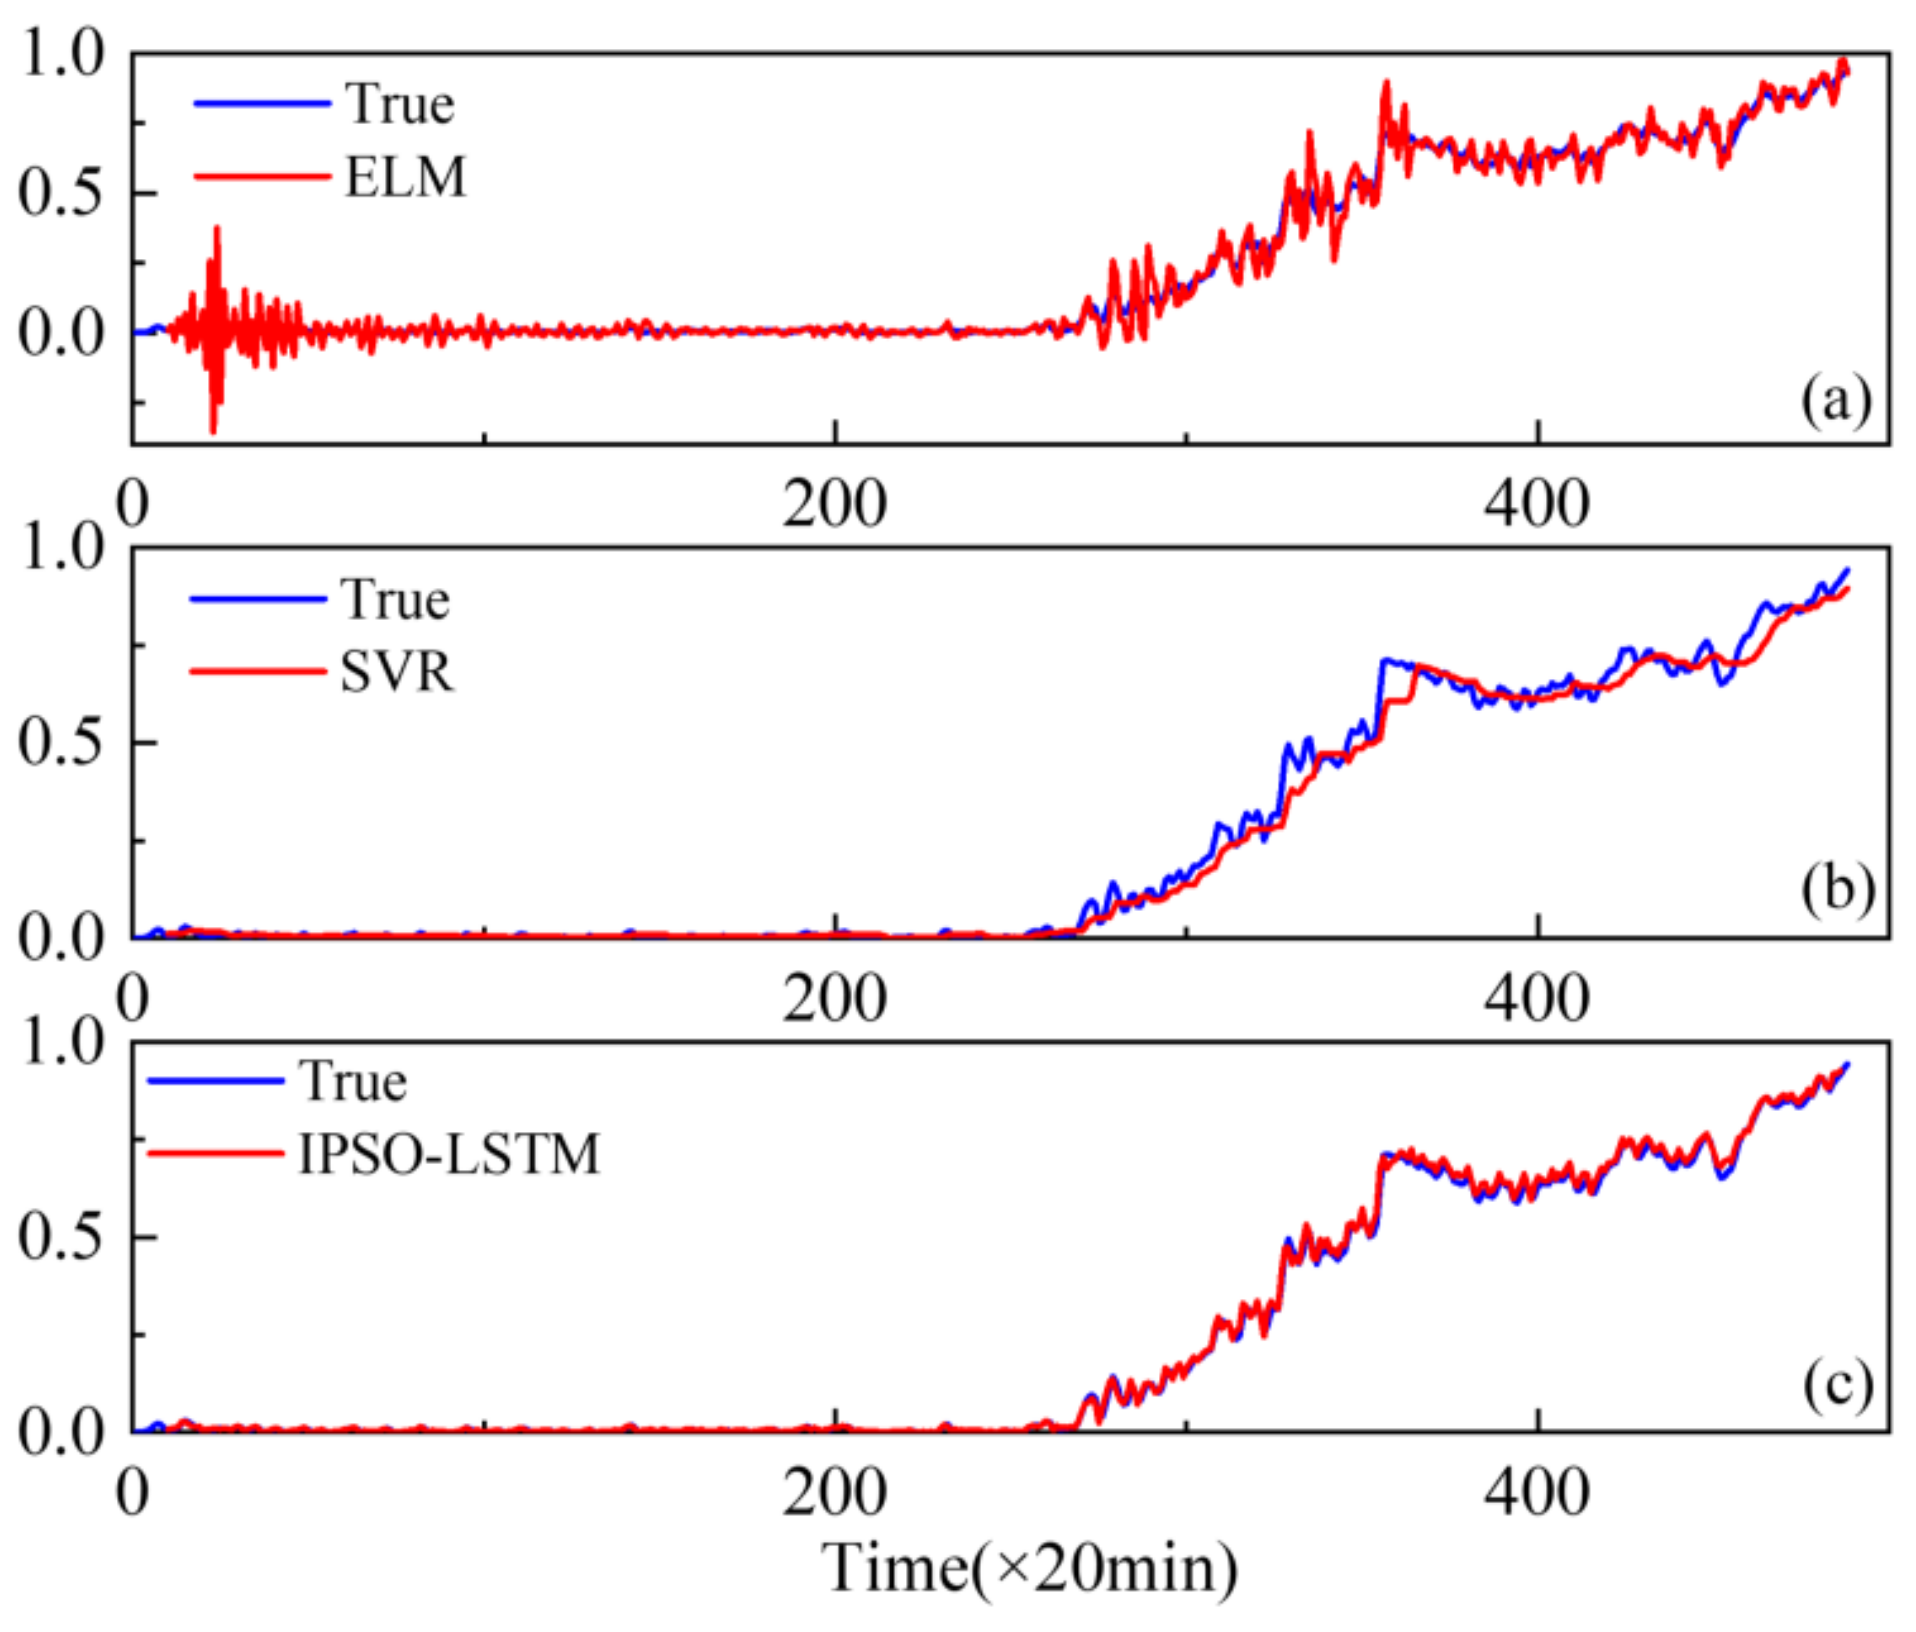
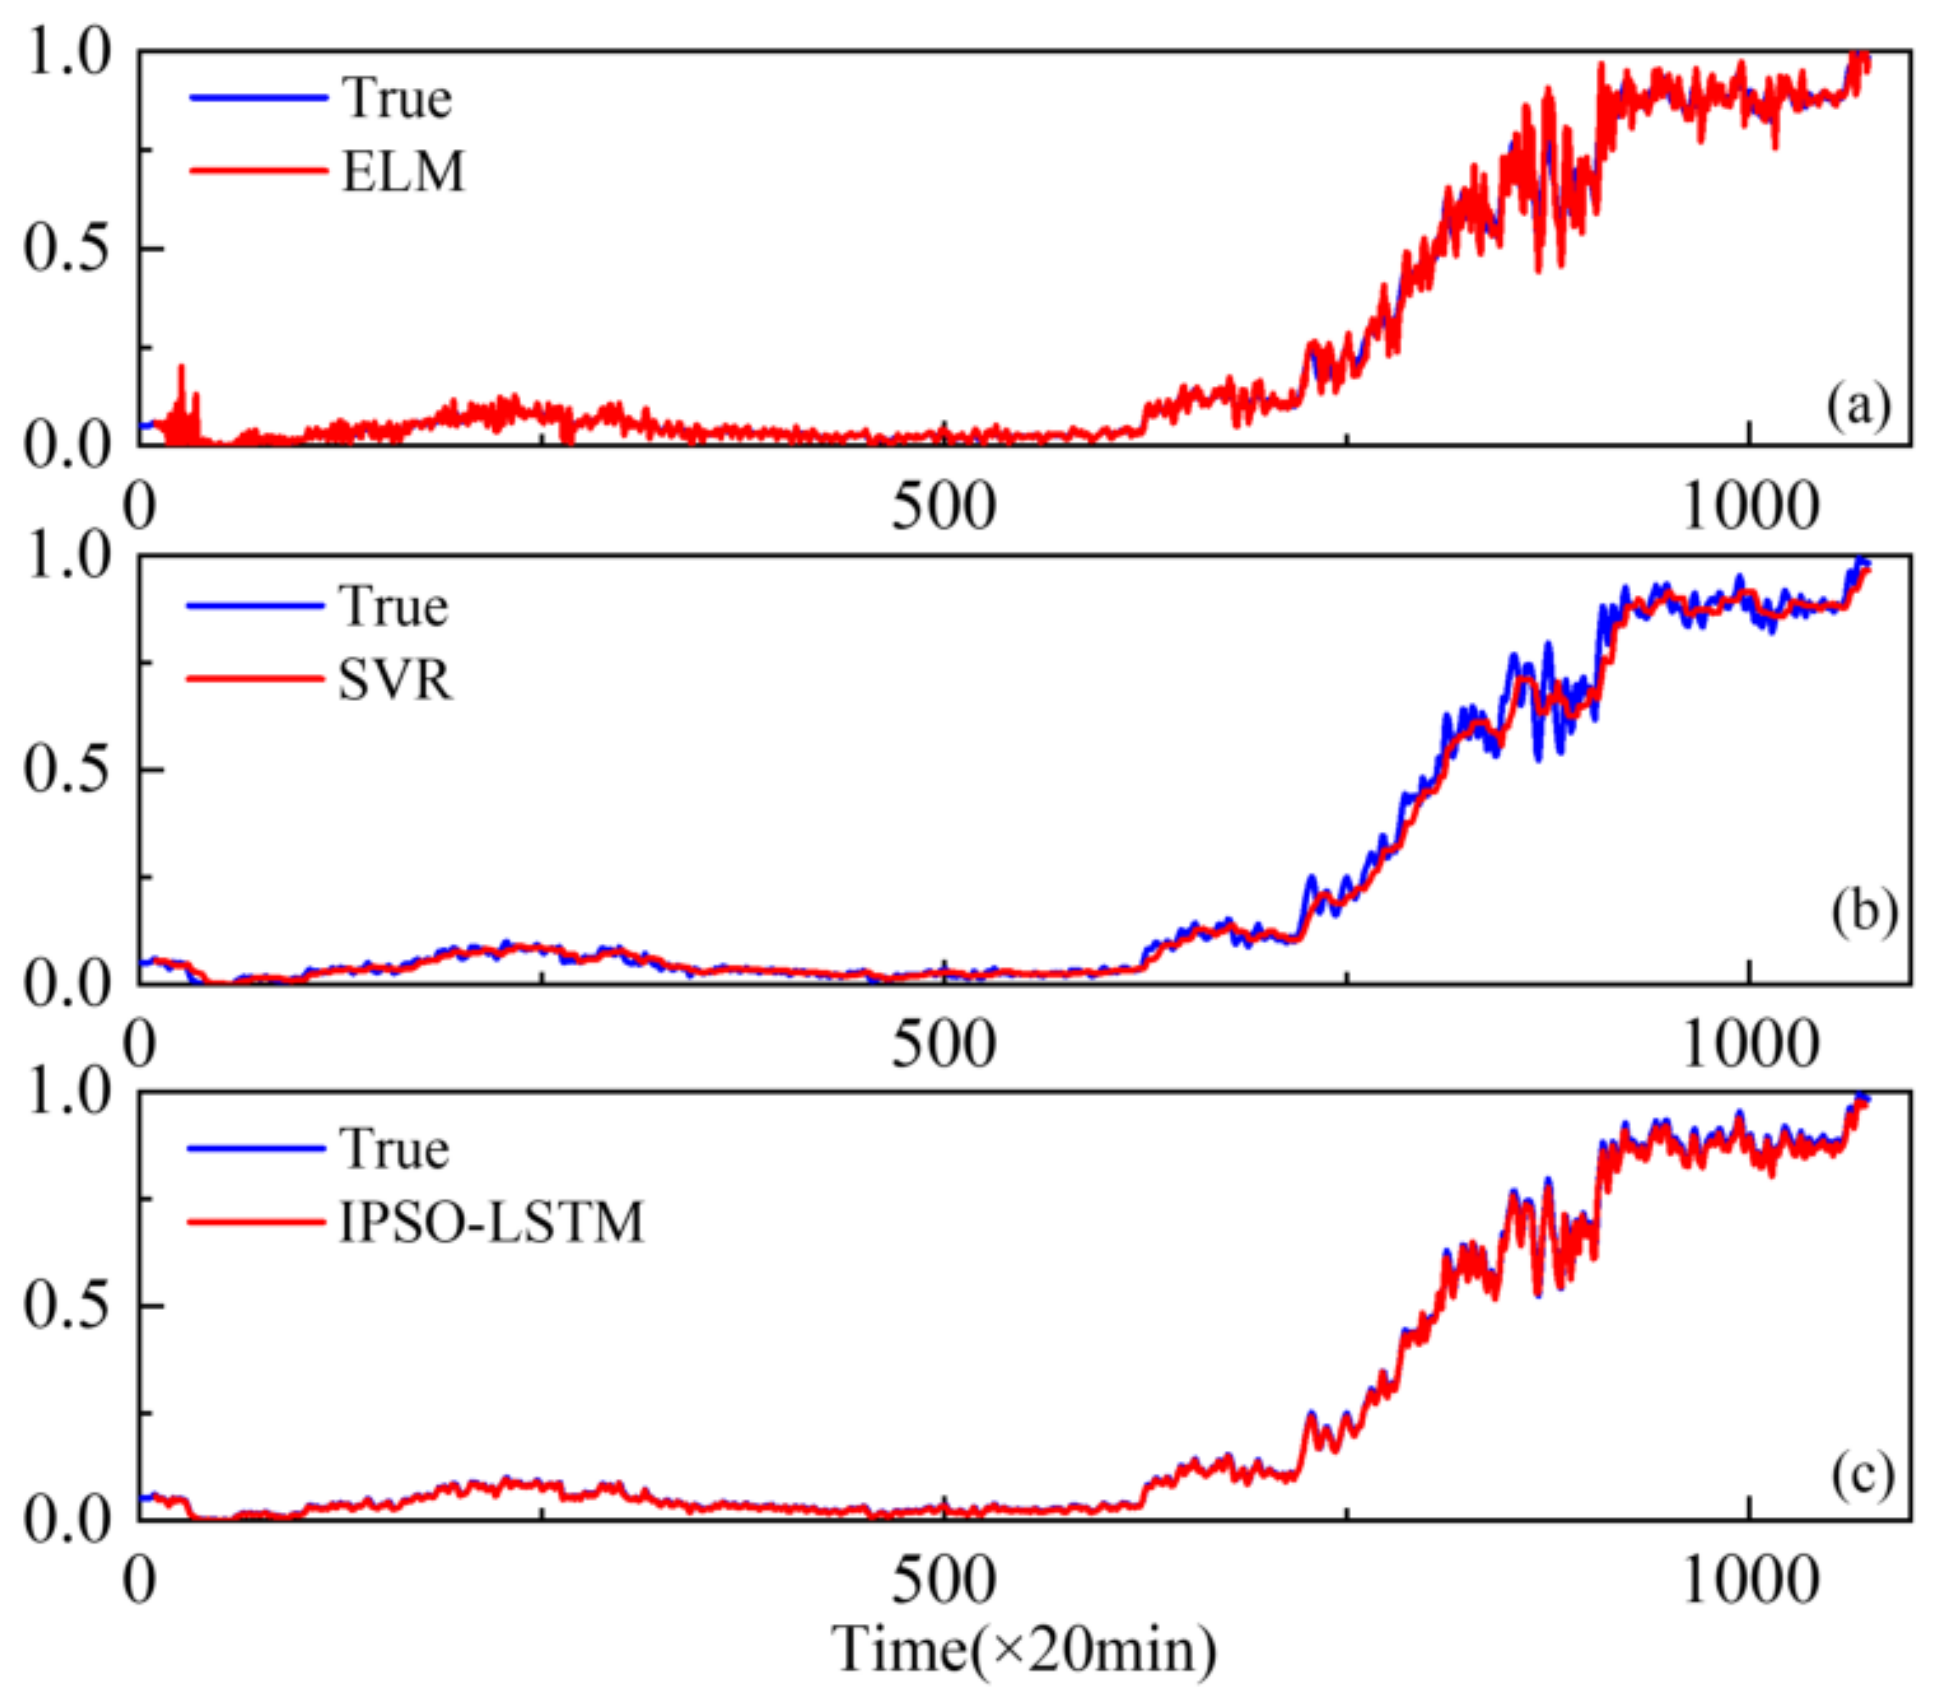
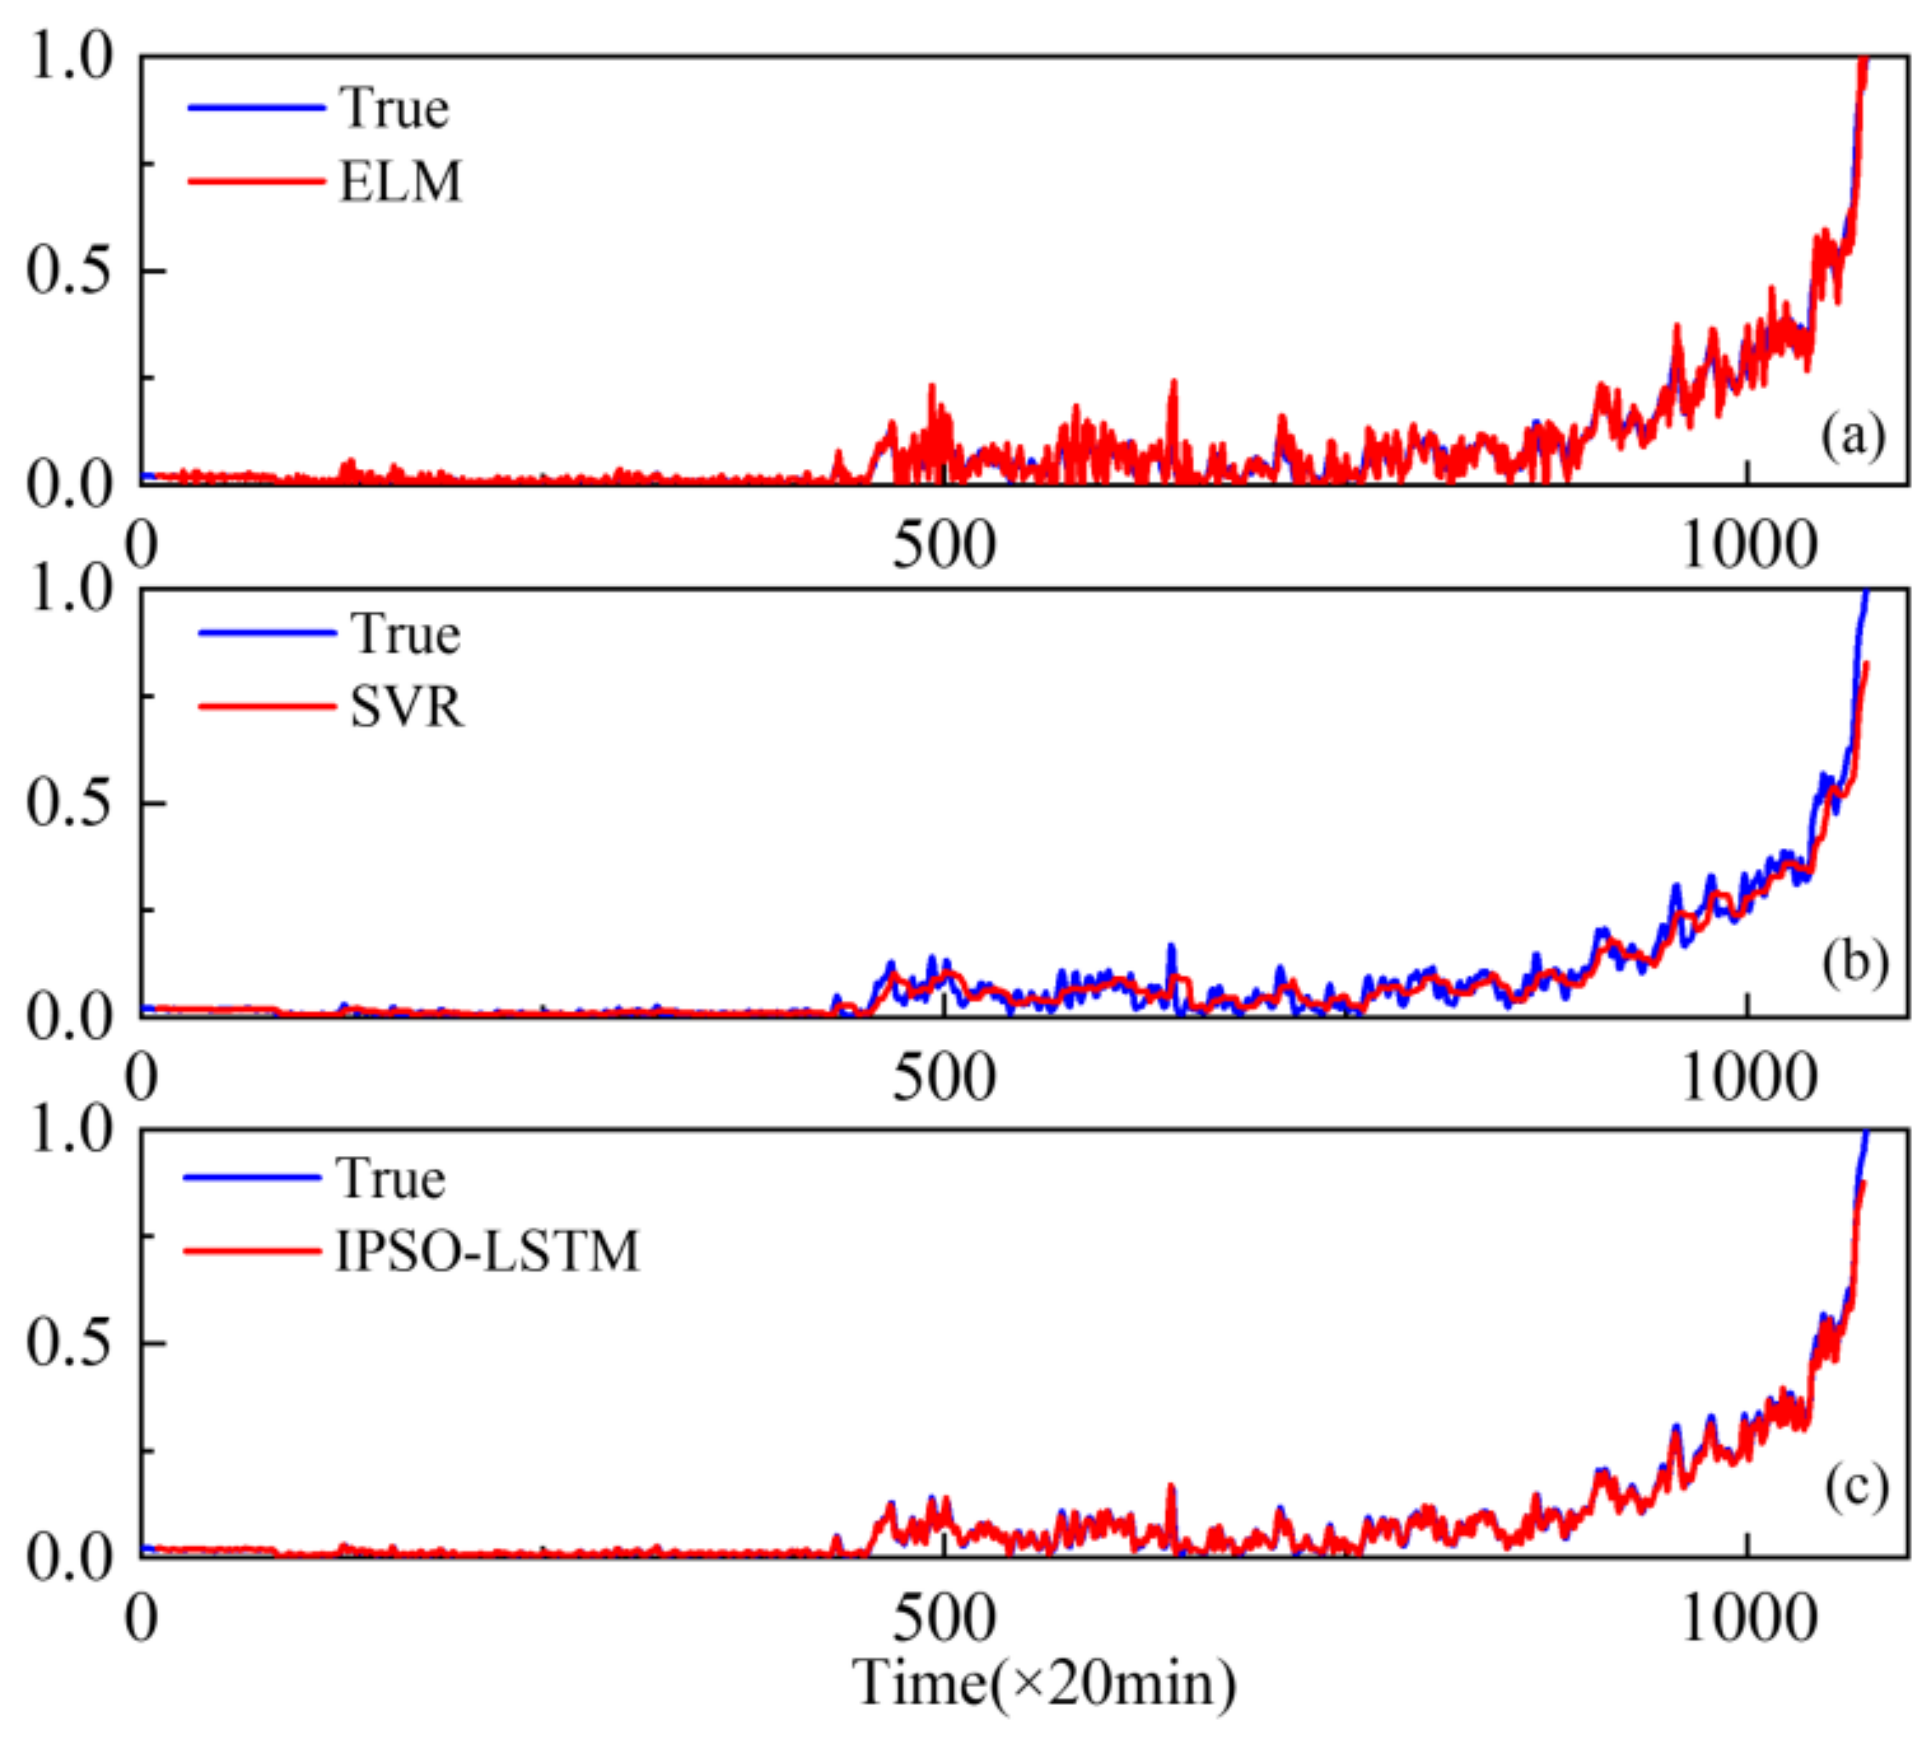
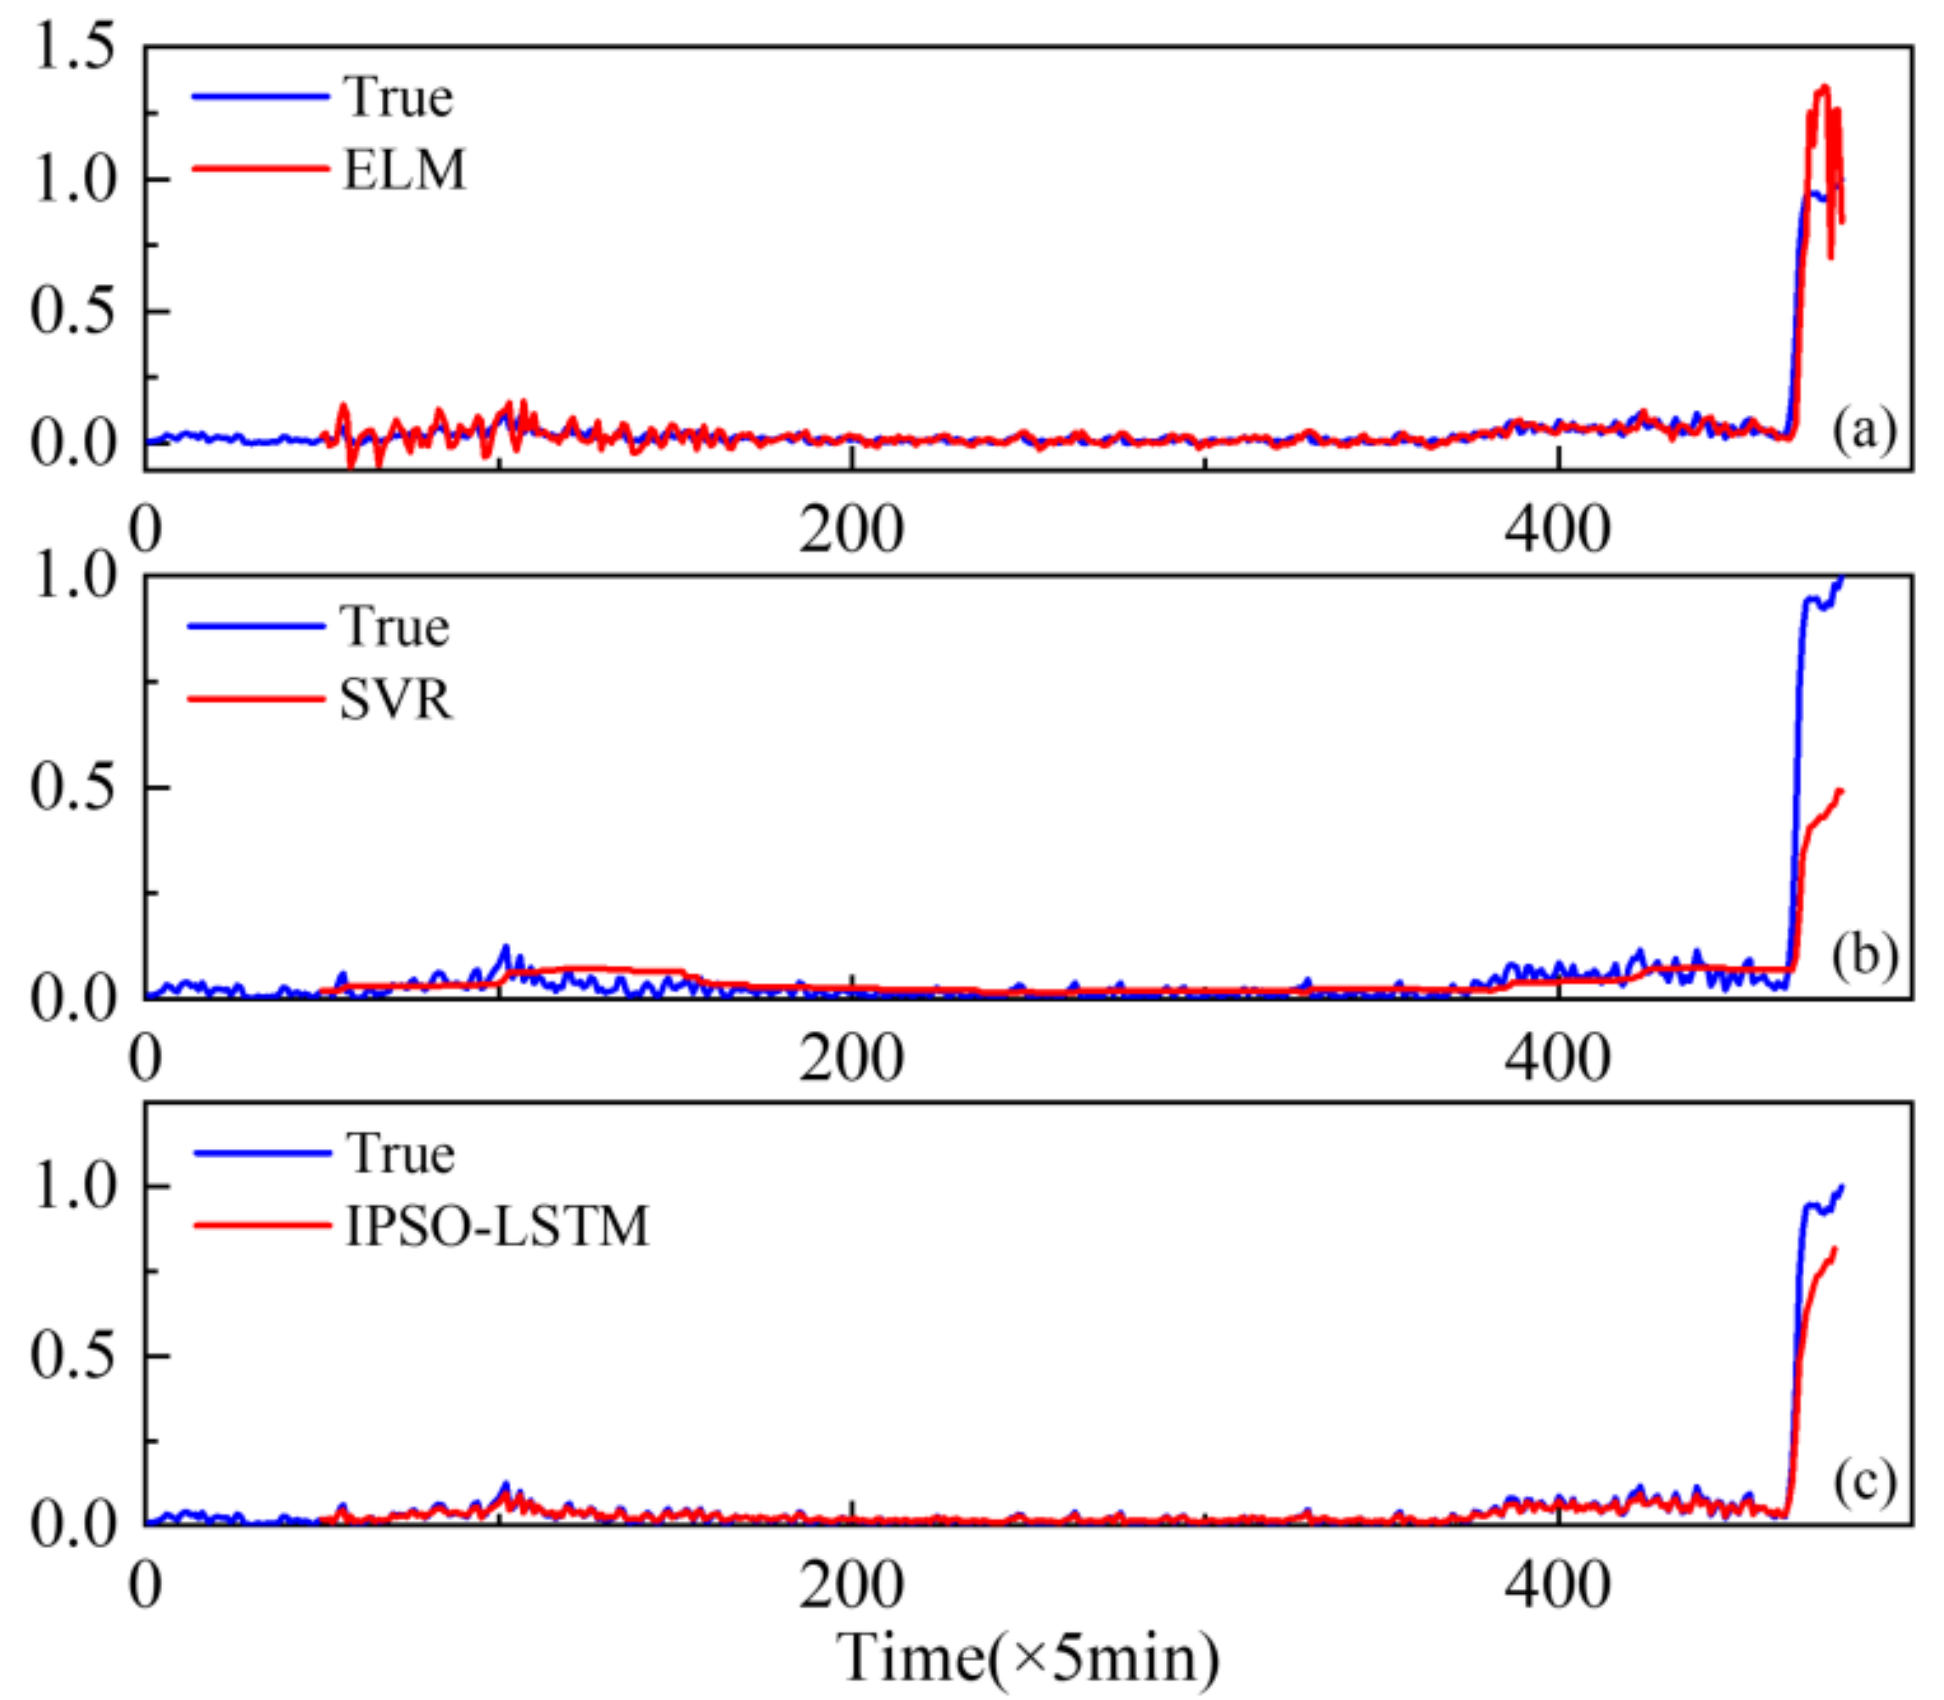
Furthermore, extreme learning machines (ELM) and support vector regression (SVR), which have been widely used with good performance degradation prediction [
29,
30], are compared with the proposed IPSO-LSTM for effectiveness. The comparison results are shown in
Figure 10,
Figure 11 and
Figure 12.
The results show that the prediction results of the IPSO-LSTM method are more in line with the original curve, with greater predictive accuracy. This is demonstrated in the RMSE values in
Table 4. Predictive errors in the proposed method are minimal, which verifies the effectiveness of the proposed IPSO-LSTM method.
4.2. Case 2
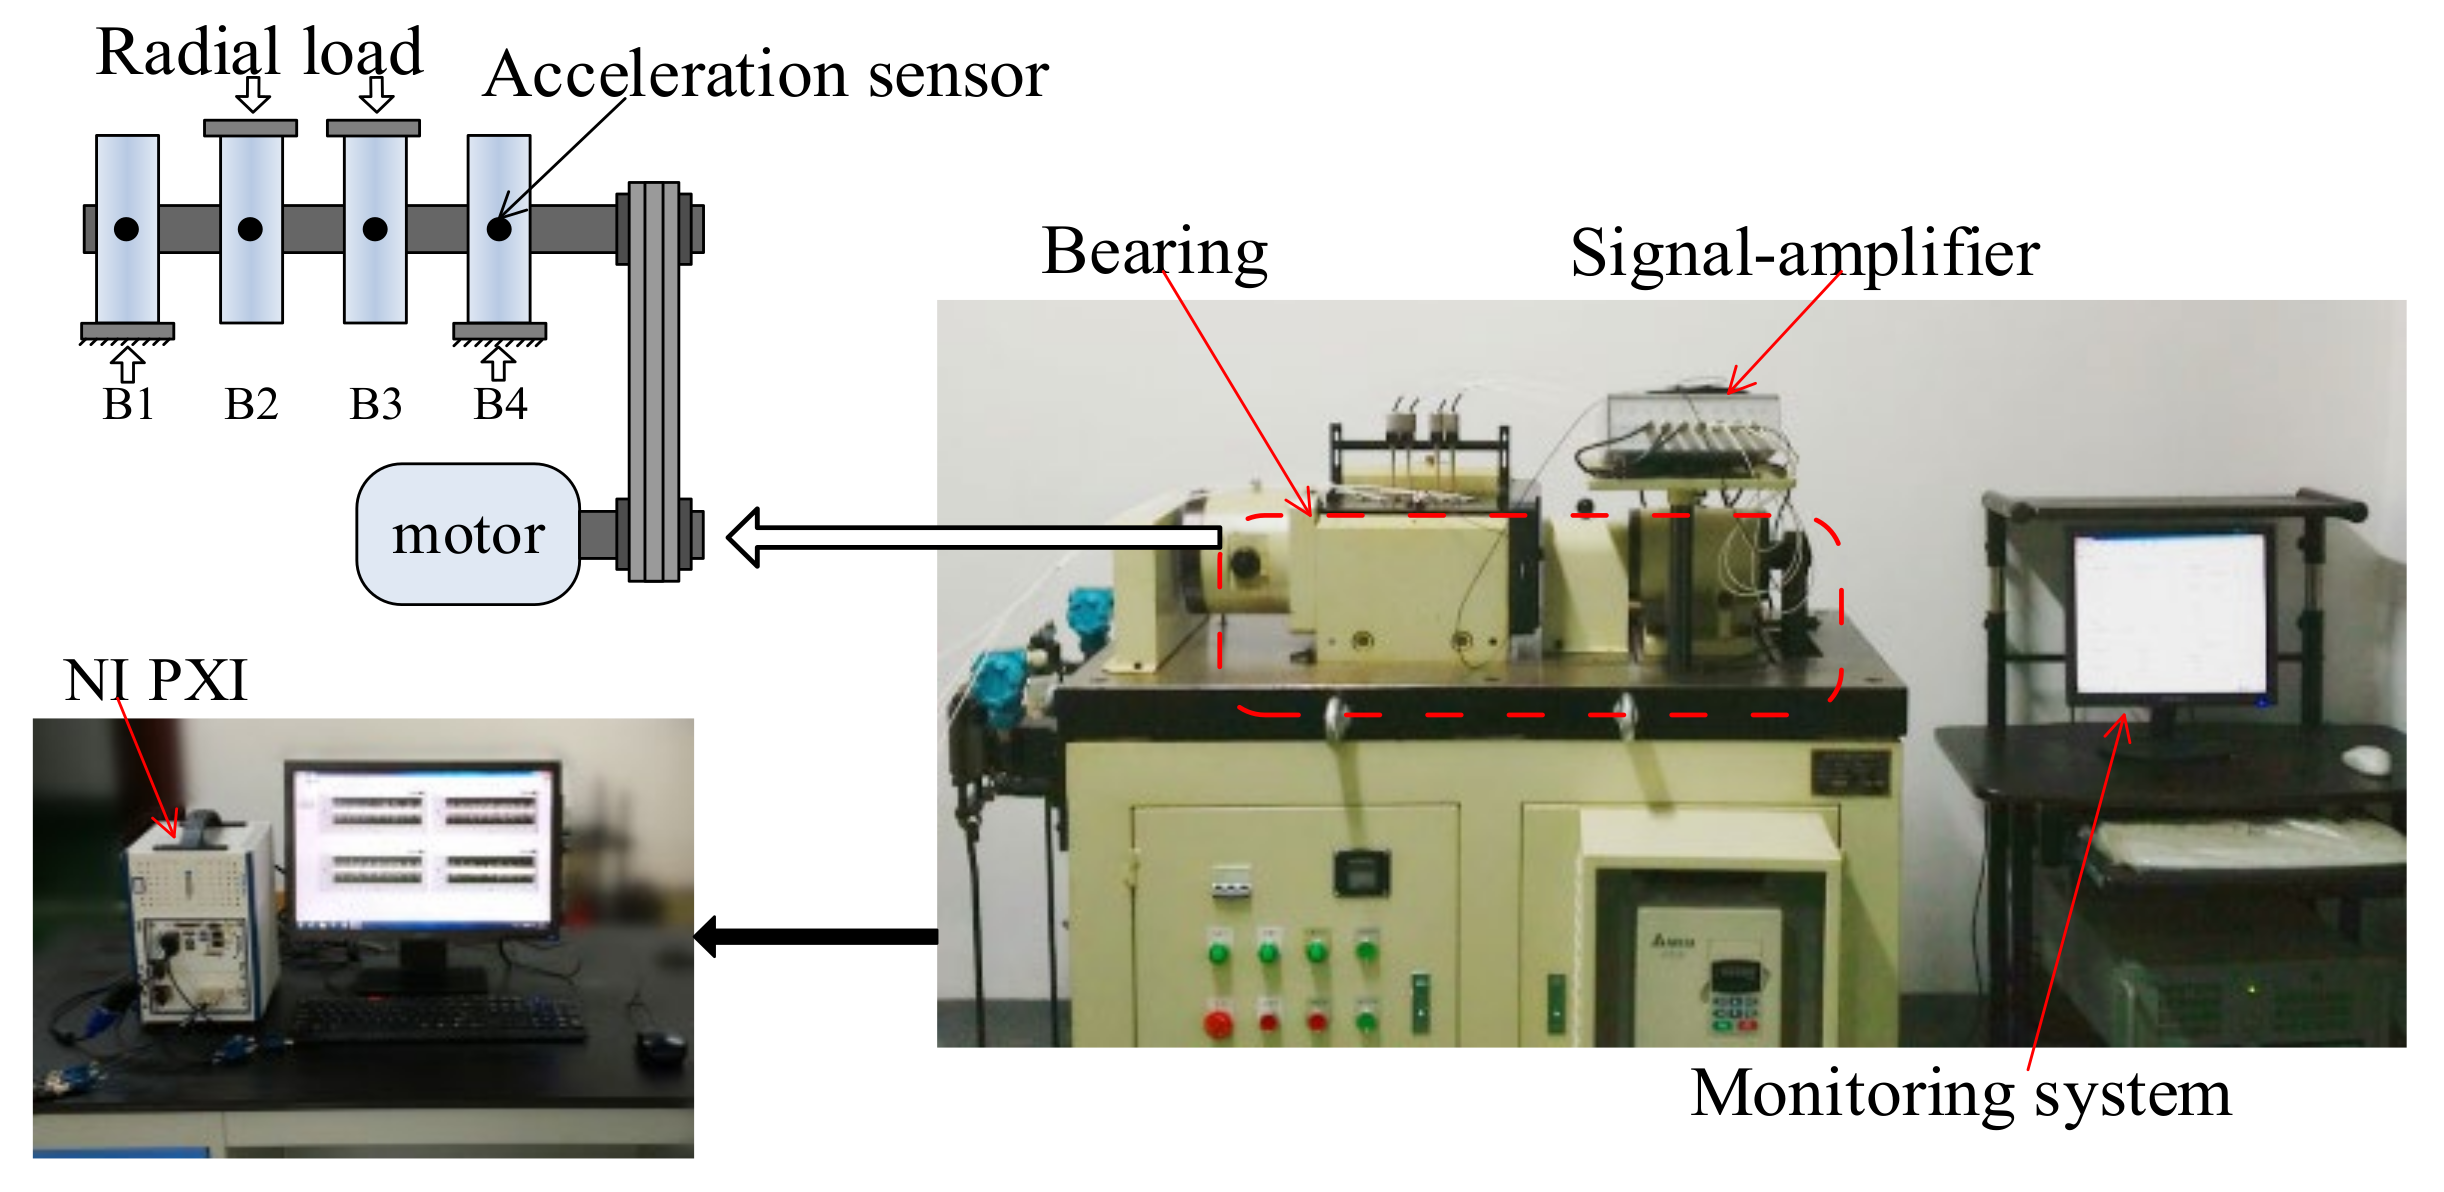
The lab experiments used four HRB6305 bearings. They were fixed on the same shaft and connected with the motor. A radial load of 750 kg was applied to all bearings to accelerate the bearing damage process, and the bearing speed was 3000 rpm. Full-life vibration signals were obtained by the NI PXI acquisition system. The vibration signals acquisition frequency was 20 kHz, the data were collected every 5 min. The experimental platform is shown in
Figure 13.
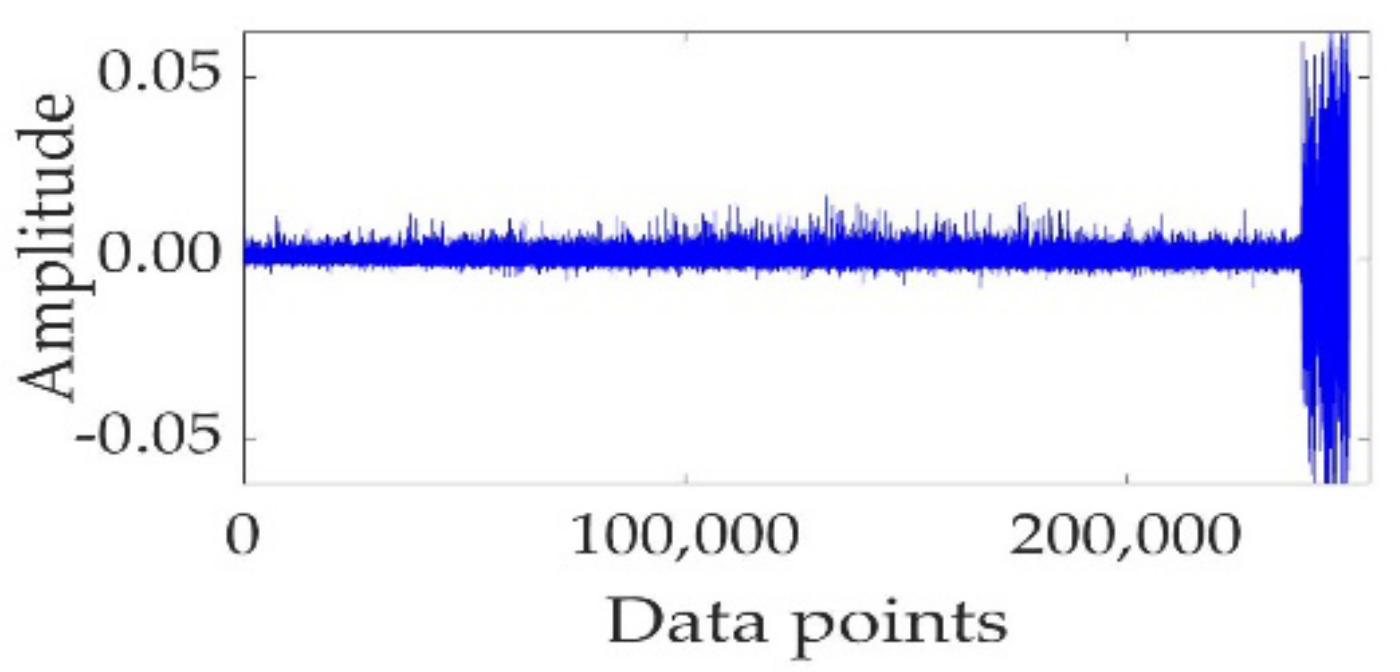
The fault in the rolling element is taken as the experimental object.
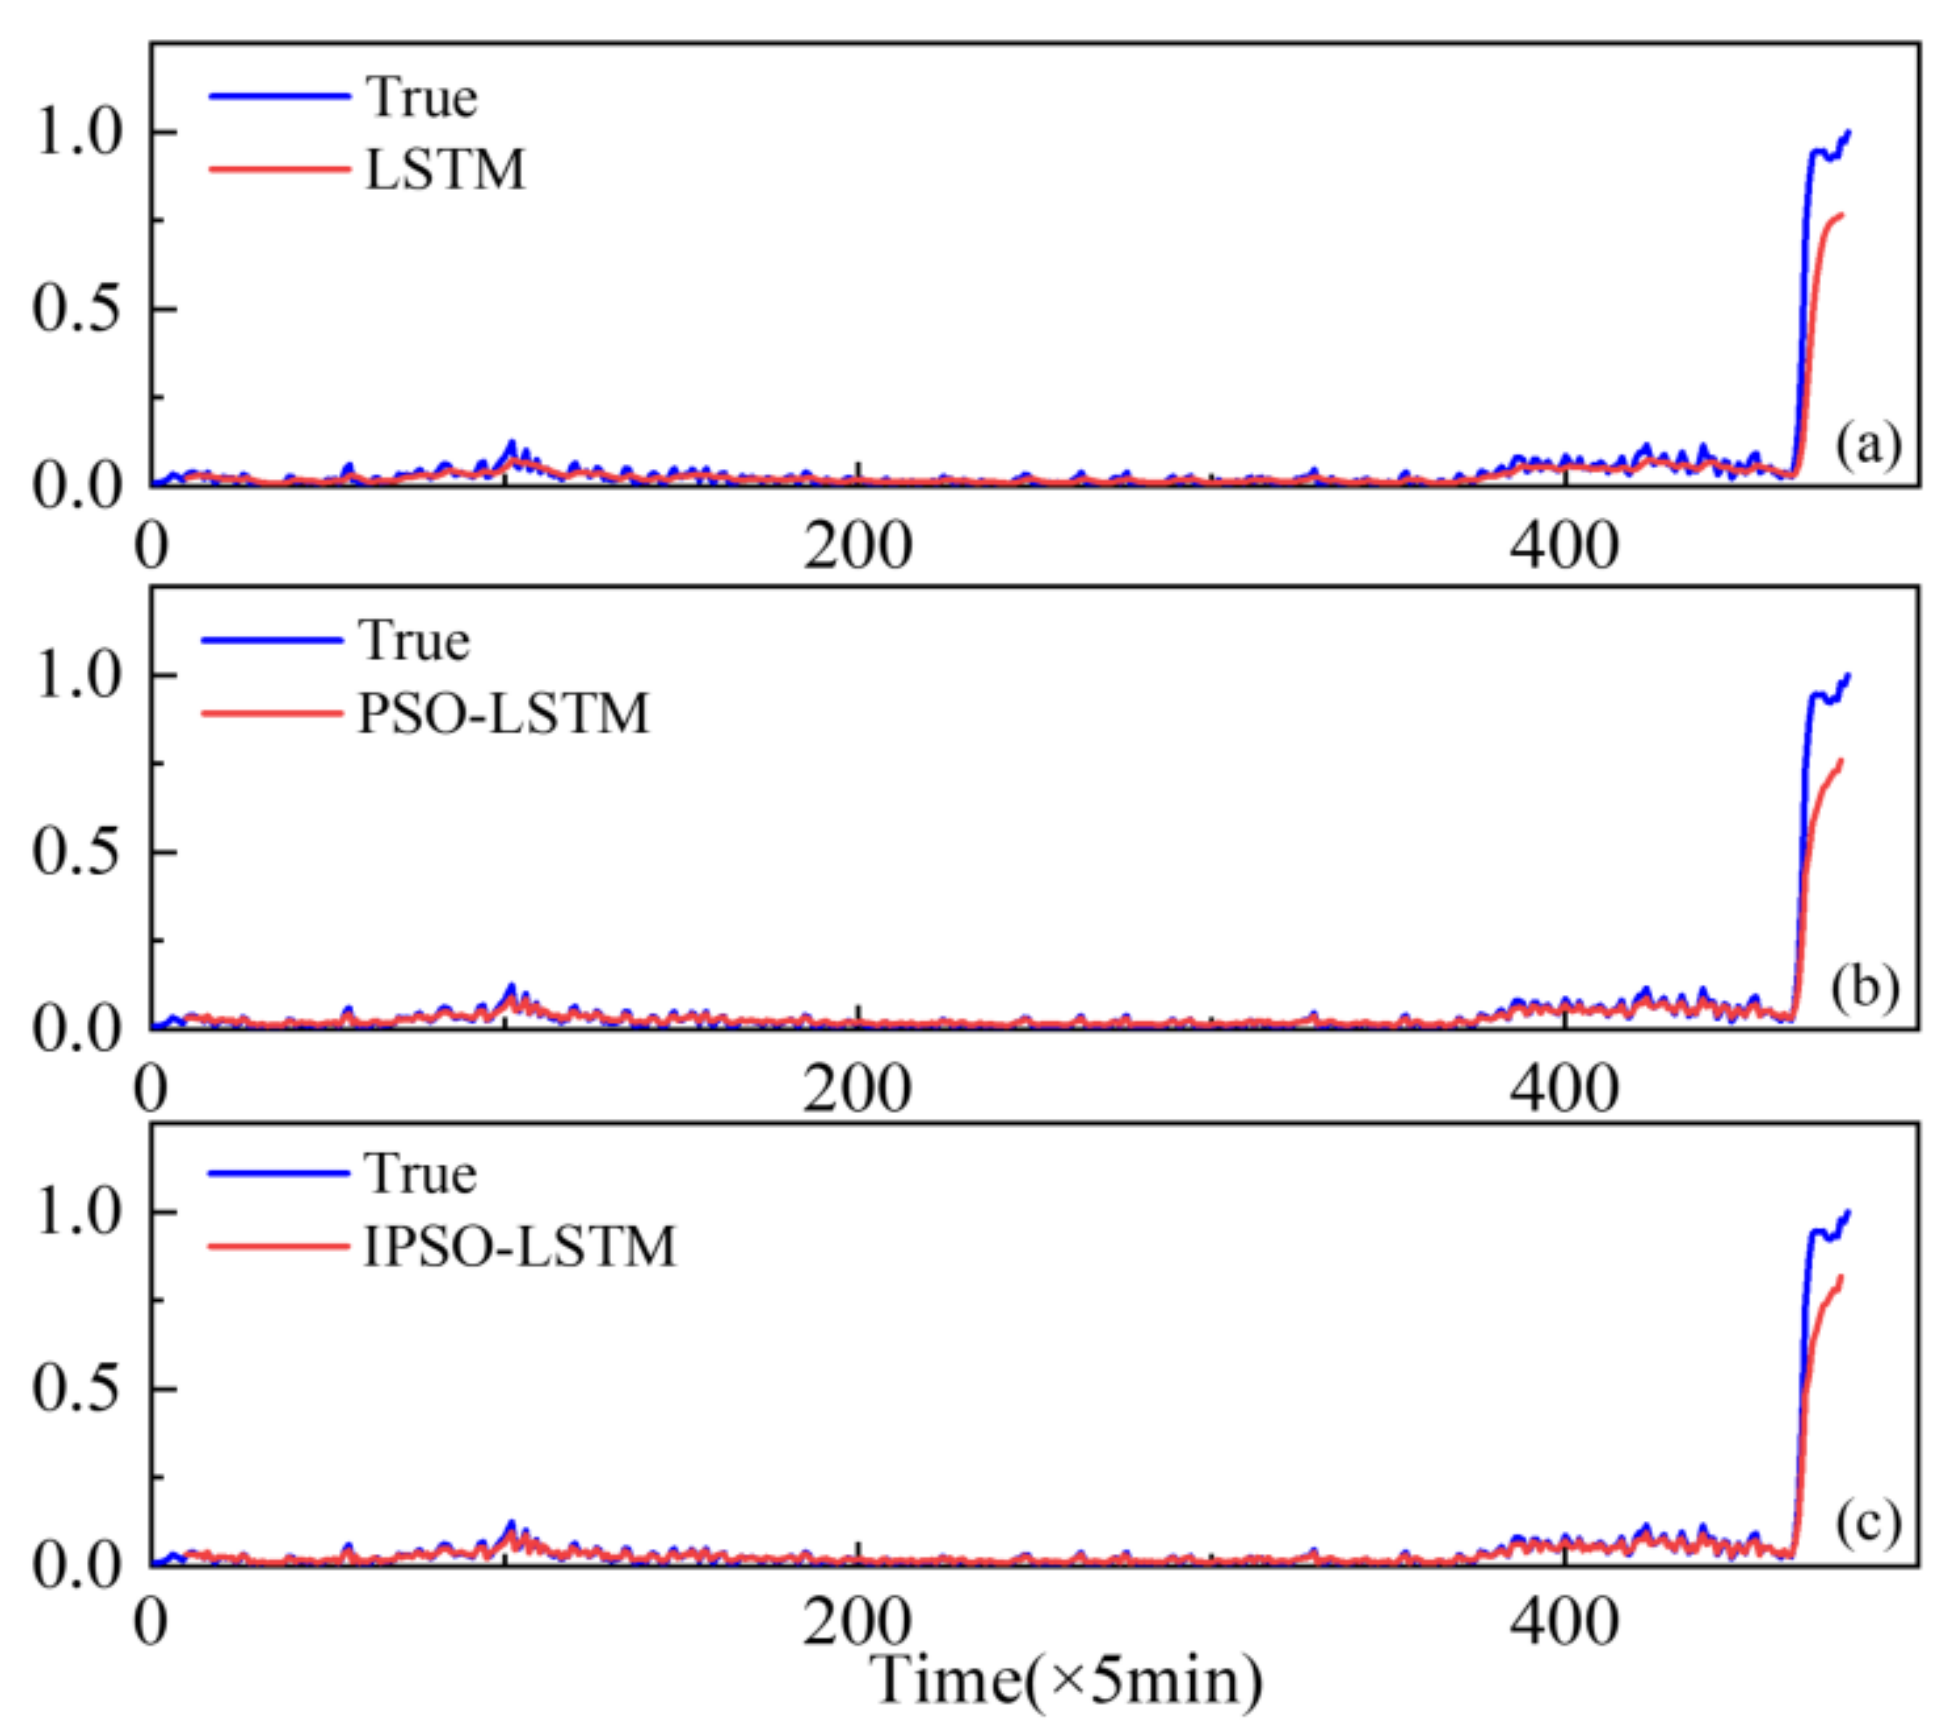
Figure 14 shows the full-life original vibration signal of the rolling element. The mixed-domain features are extracted from the bearing data. KJADE is used for feature fusion to acquire an optimal feature parameter set, and the SS is calculated from fusion features to obtain the degradation index. The proposed method is used to predict the performance degradation and compared with the LSTM and PSO-LSTM methods. The prediction curve is shown in
Figure 15.
The results demonstrate that the predictive accuracy of the proposed method is greater than that of the other two methods. The RMSE results of LSTM, PSO-LSTM, and IPSO-LSTM are shown in
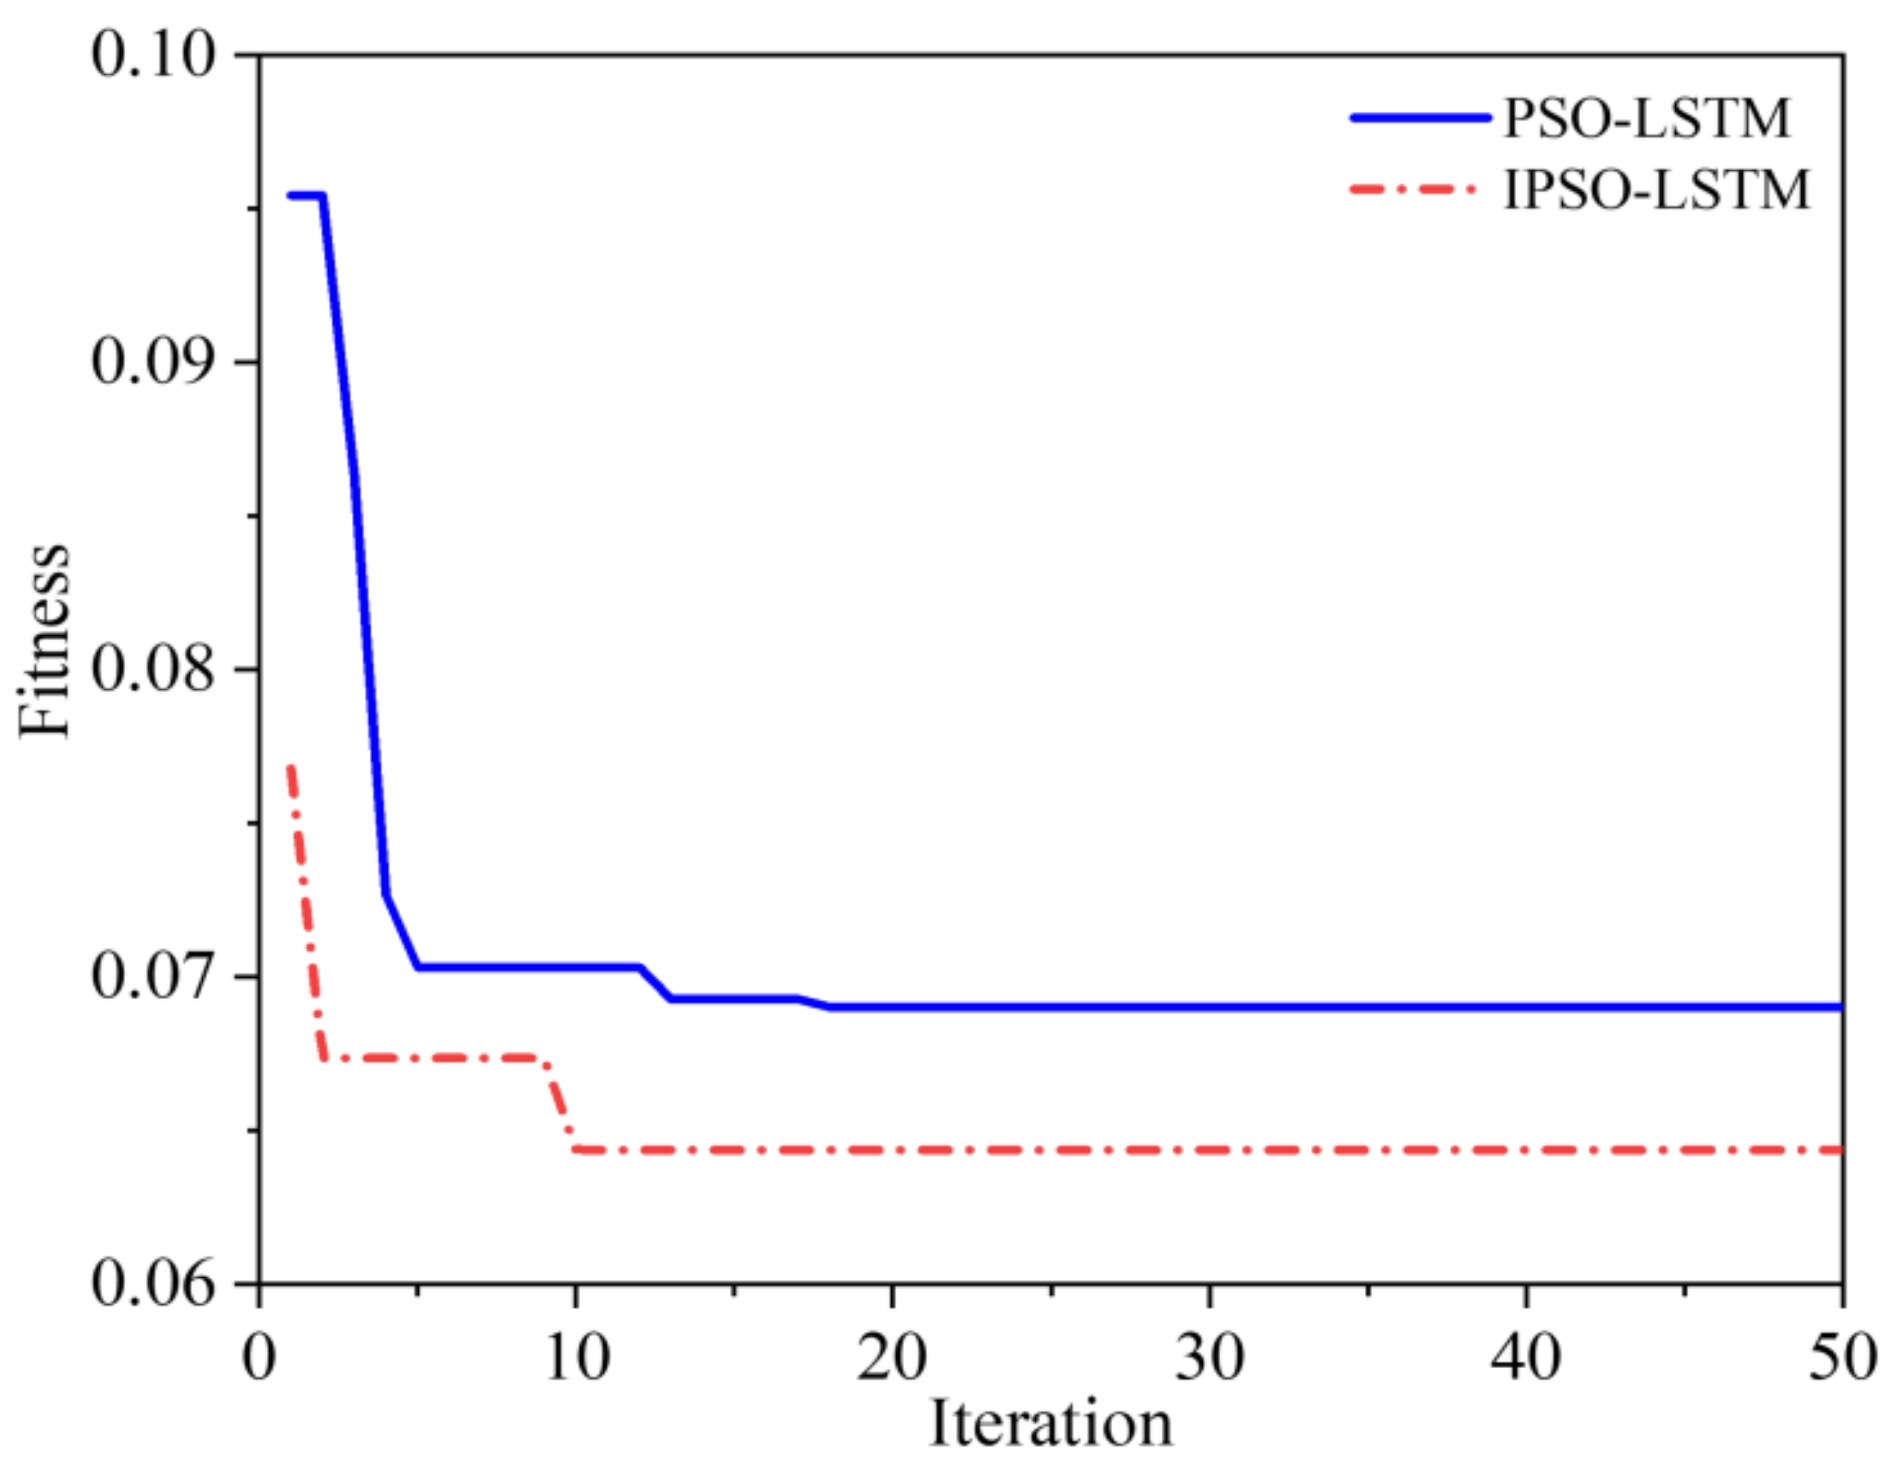
Table 5. The iteration results of IPSO and PSO optimization are shown in
Figure 16. It demonstrates that the IPSO algorithm converges earlier and is less likely to succumb to the local minimum problem, which is an advantage over the performance of the PSO.
Similar to case 1, extreme learning machines (ELM) and support vector regression (SVR) are compared with the proposed method.
The results of the comparison are shown in
Figure 17 and
Table 6. It can be seen that the proposed method is more effective than the other two methods in predicting the degradation trend of bearings. The RMSE values also reflect that the proposed IPSO-LSMT’s predictive accuracy is higher than the ELM and SVR methods.


 ,
, 


