
Unifying Obstacle Detection, Recognition, and Fusion Based on the Polarization Color Stereo Camera and LiDAR for the ADAS


Abstract
:1. Introduction
2. Related Work
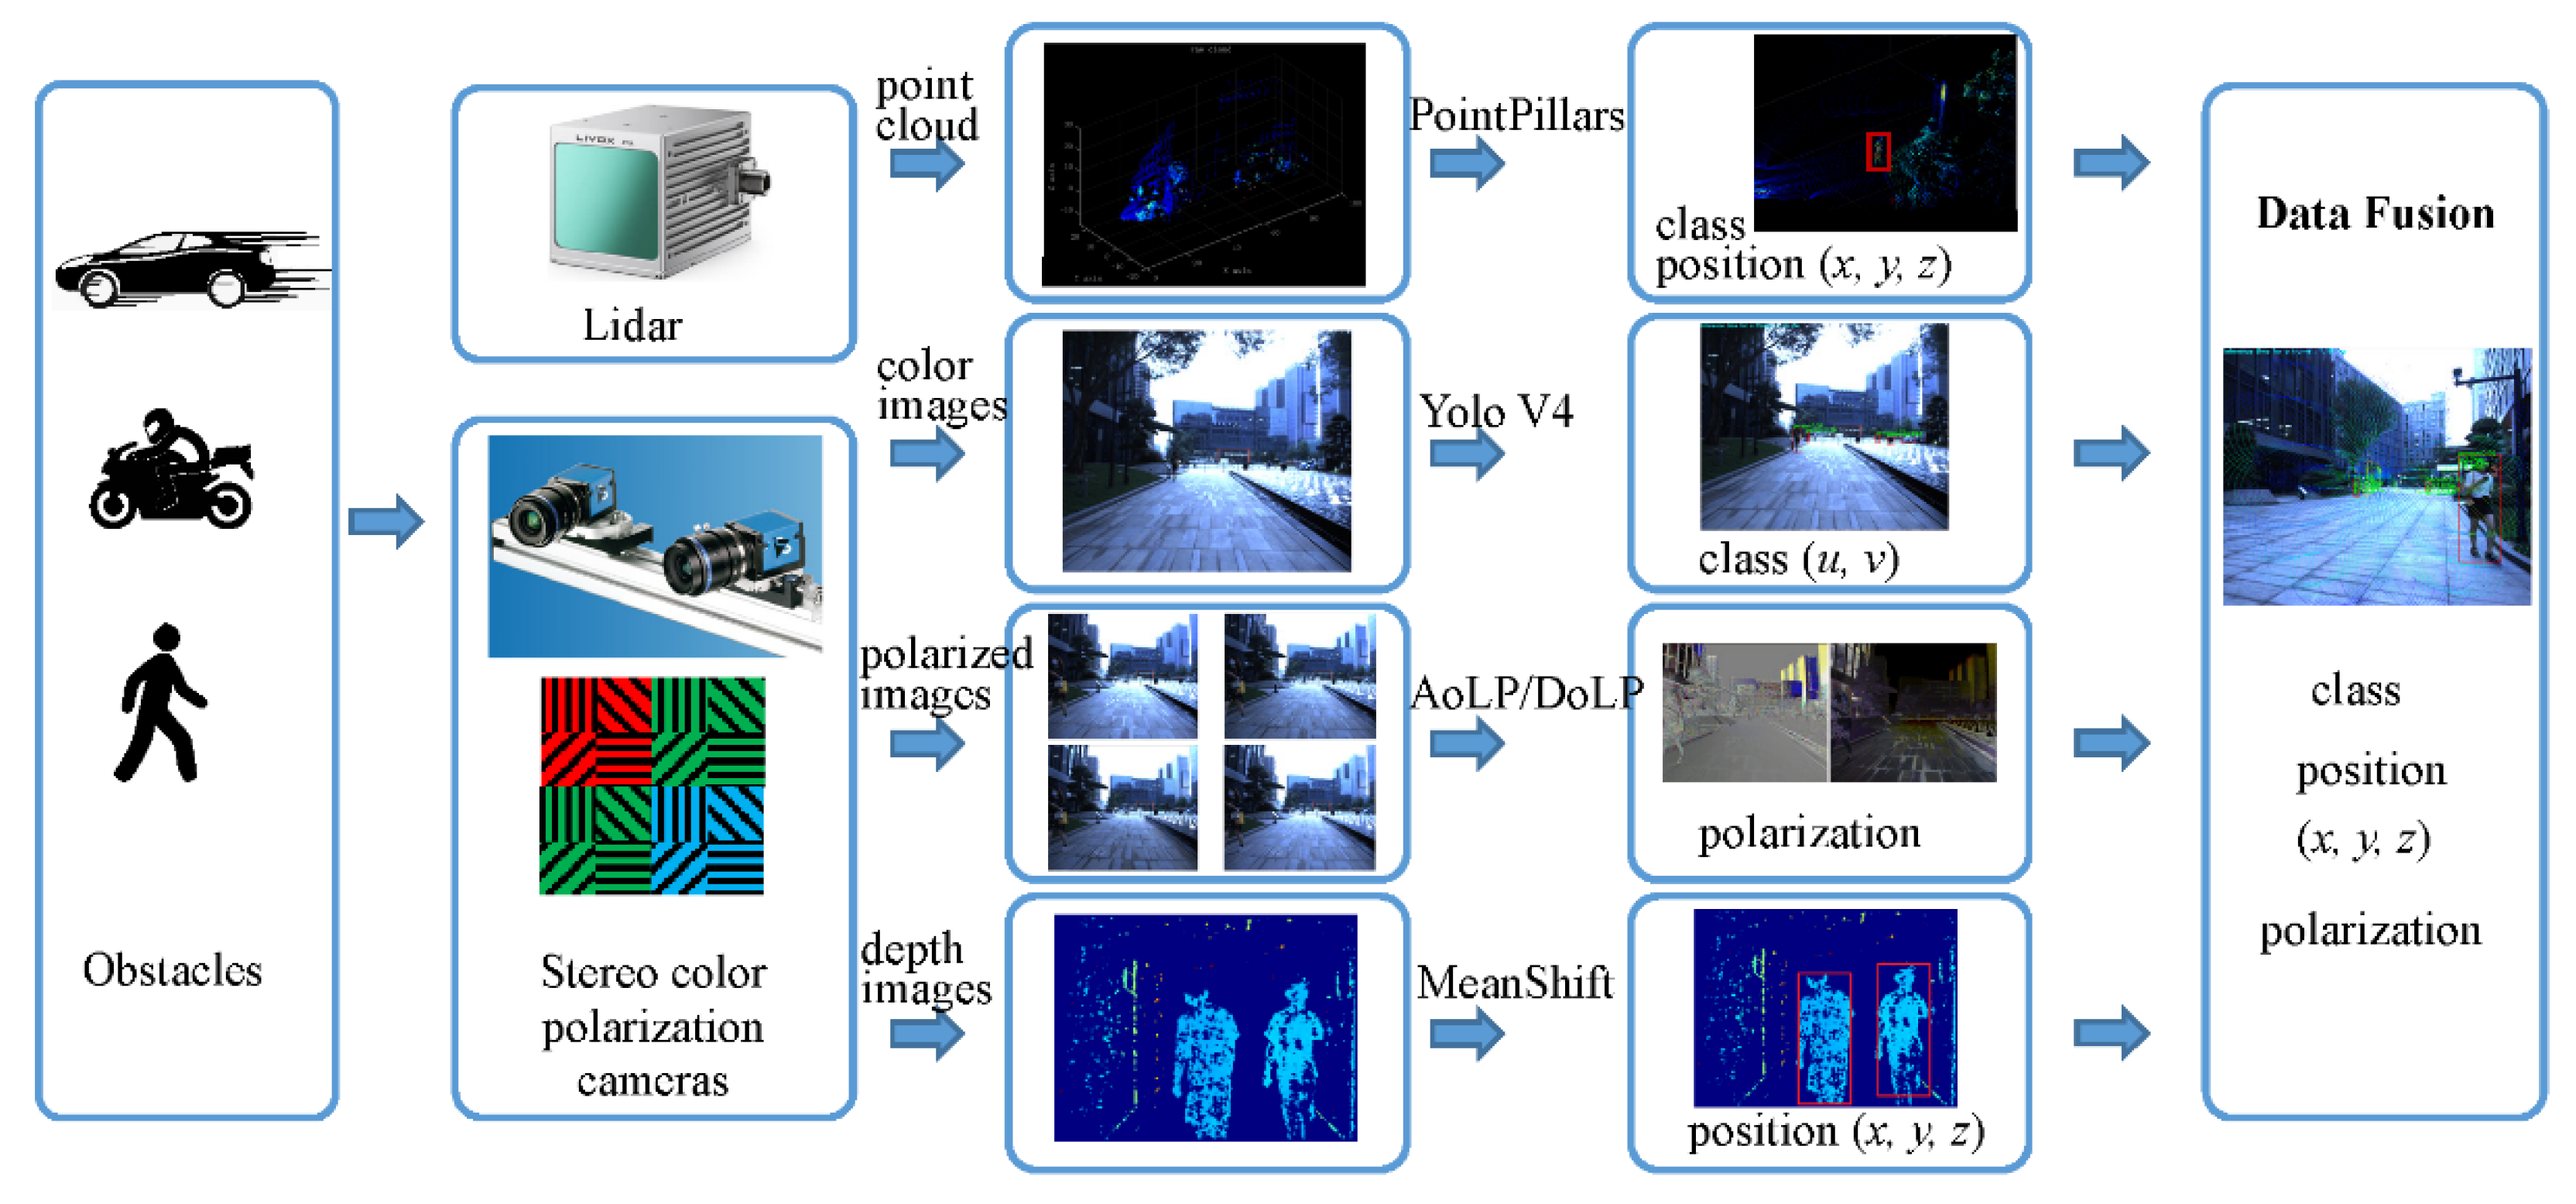
3. Methodology
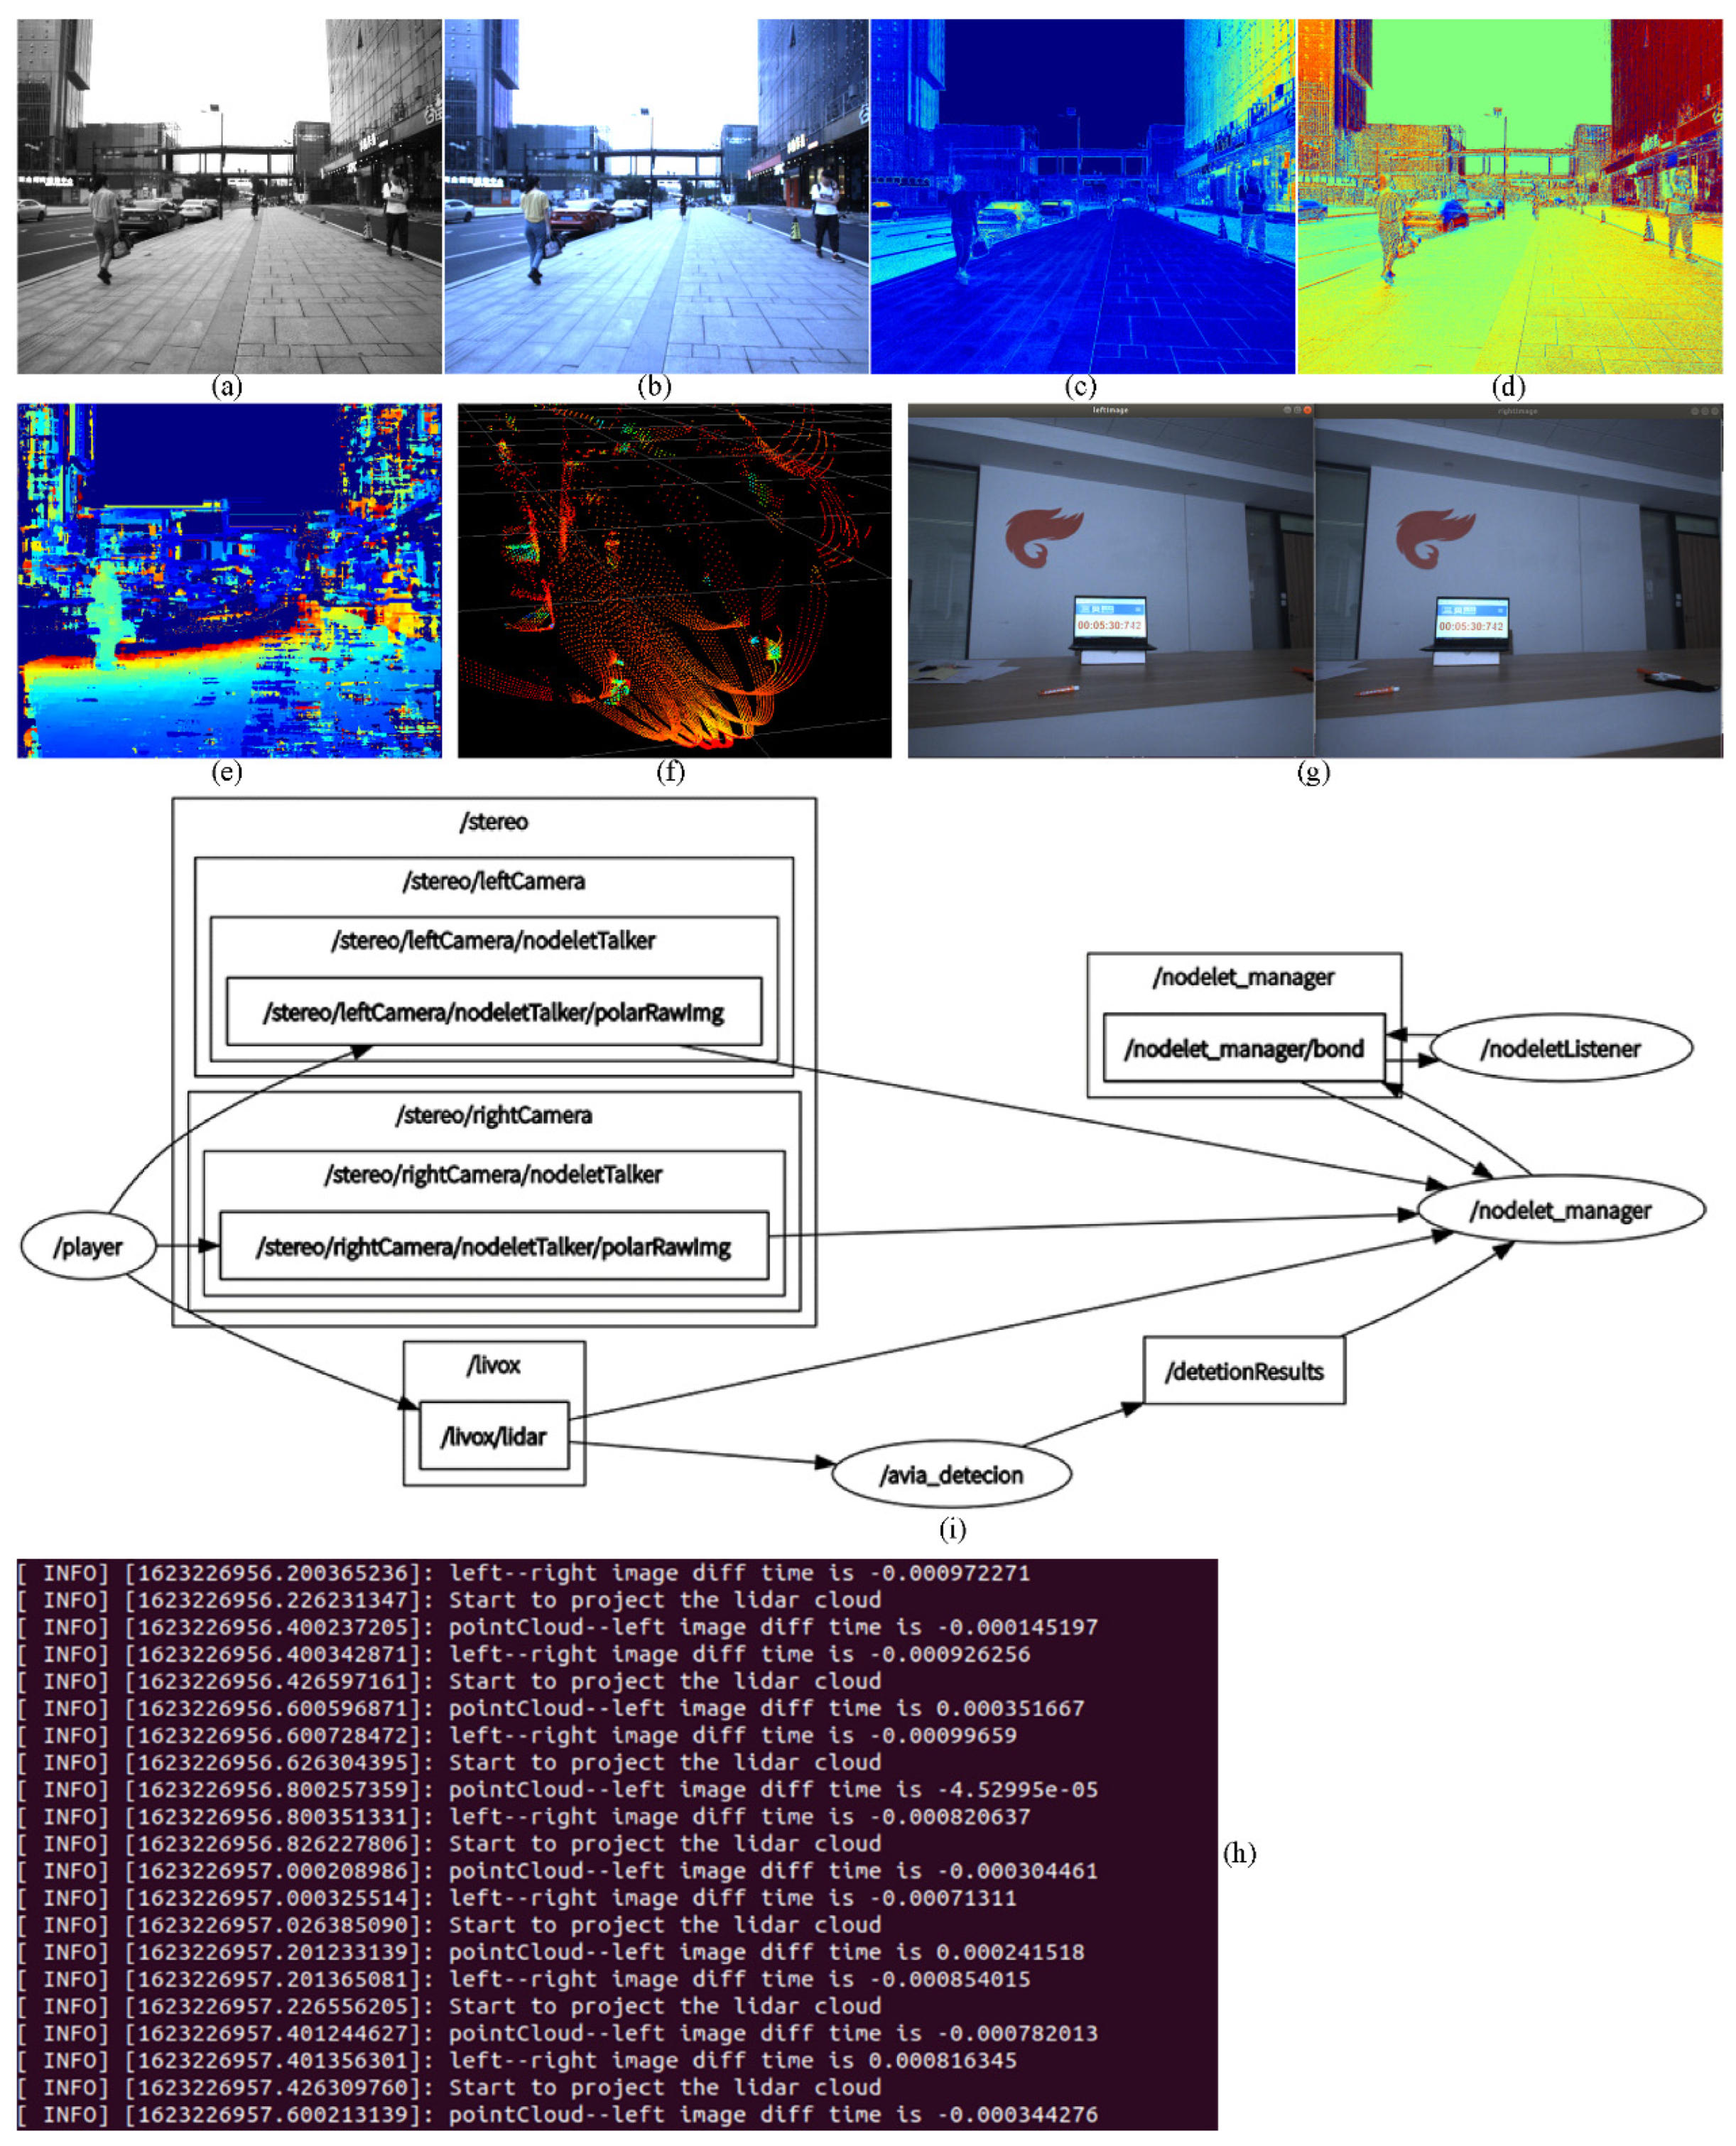
3.1. Sensors
3.2. Object Detection and Recognition
3.2.1. Object Recognition of the Color Images
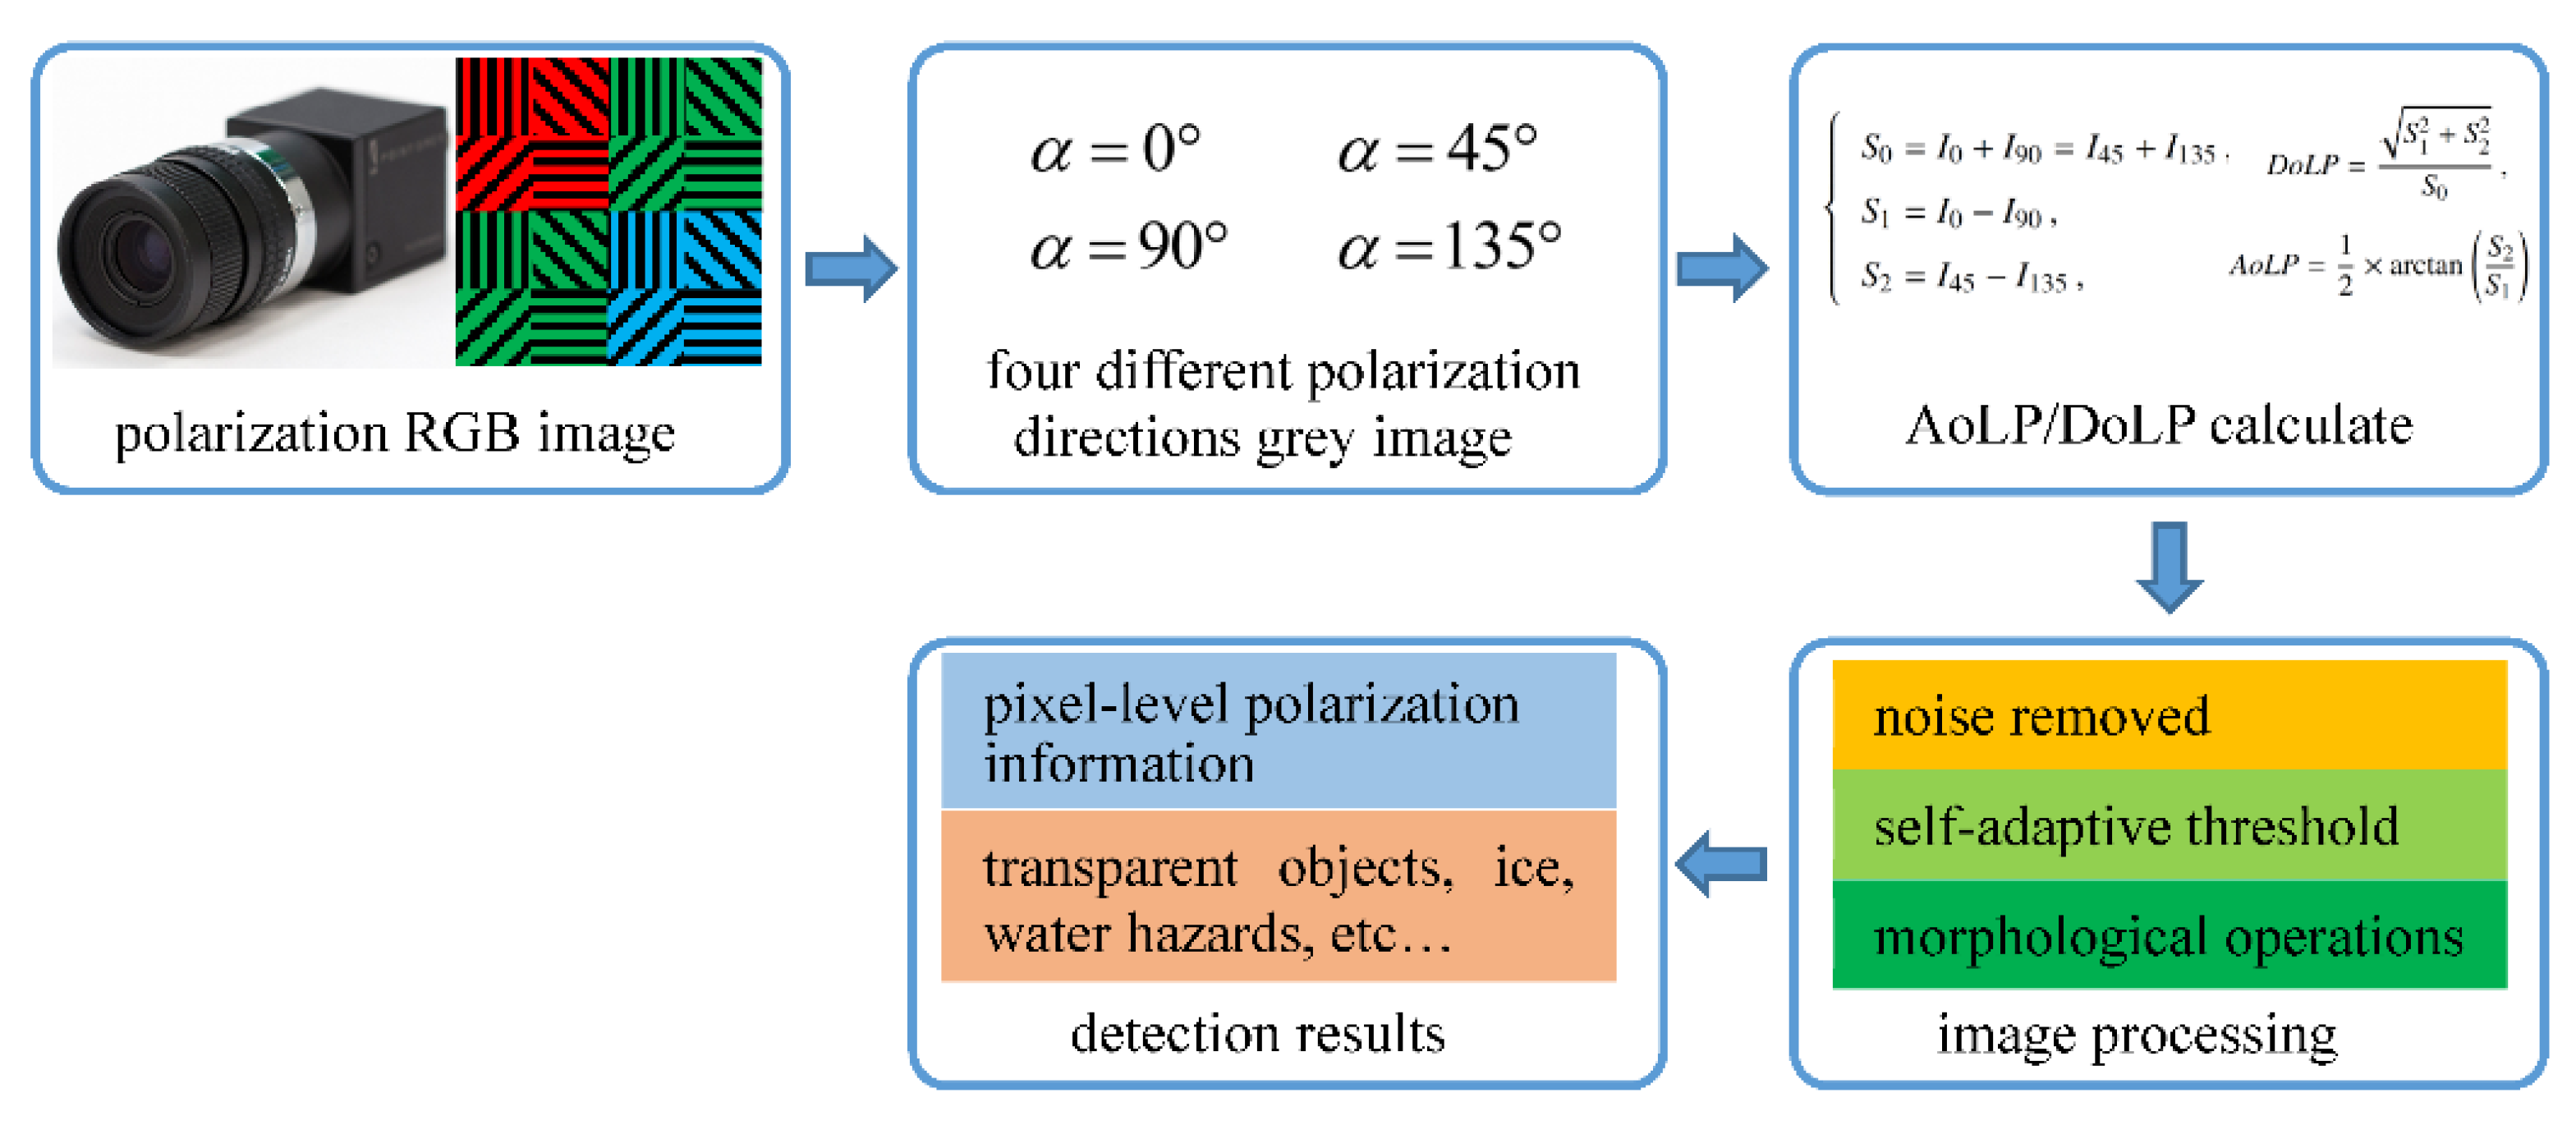
3.2.2. Feature Extraction of the Polarization Images
3.2.3. Object Detection of the Depth Images
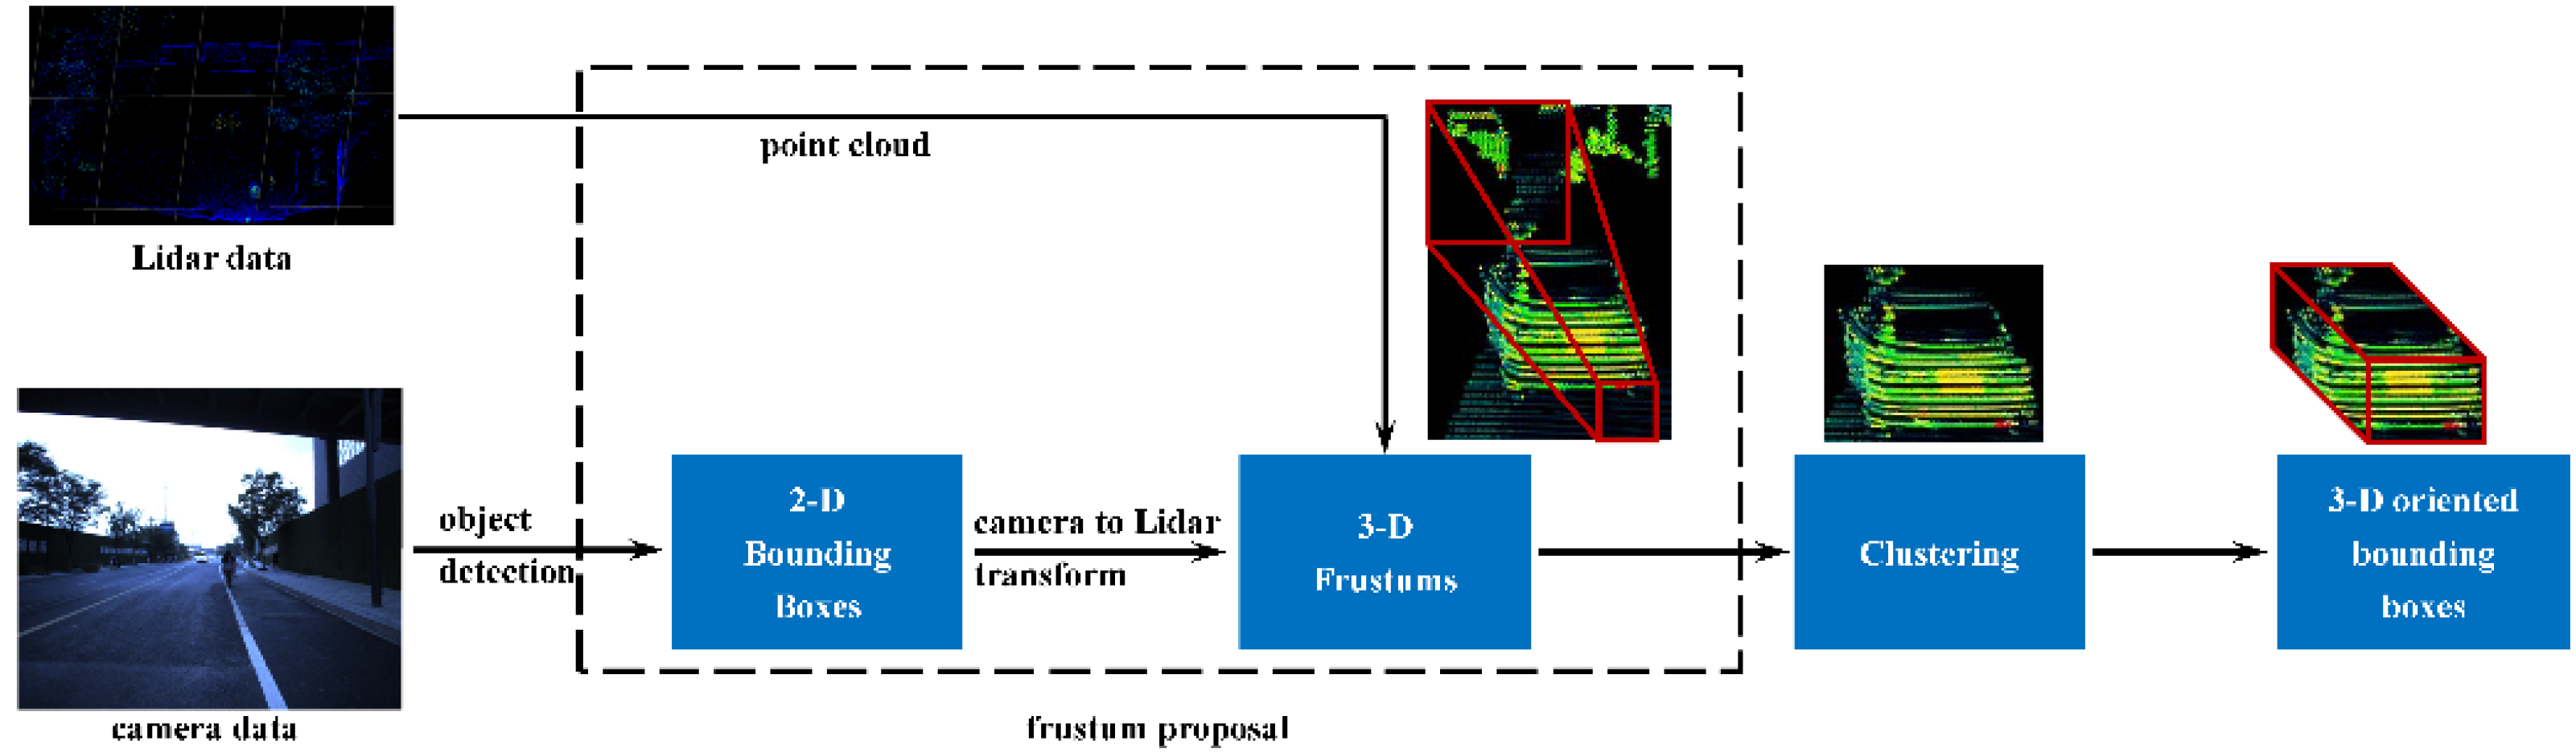
3.2.4. Object Detection of the Point Cloud
3.3. Calibration and Synchronization
3.4. Data Fusion
4. Experiments
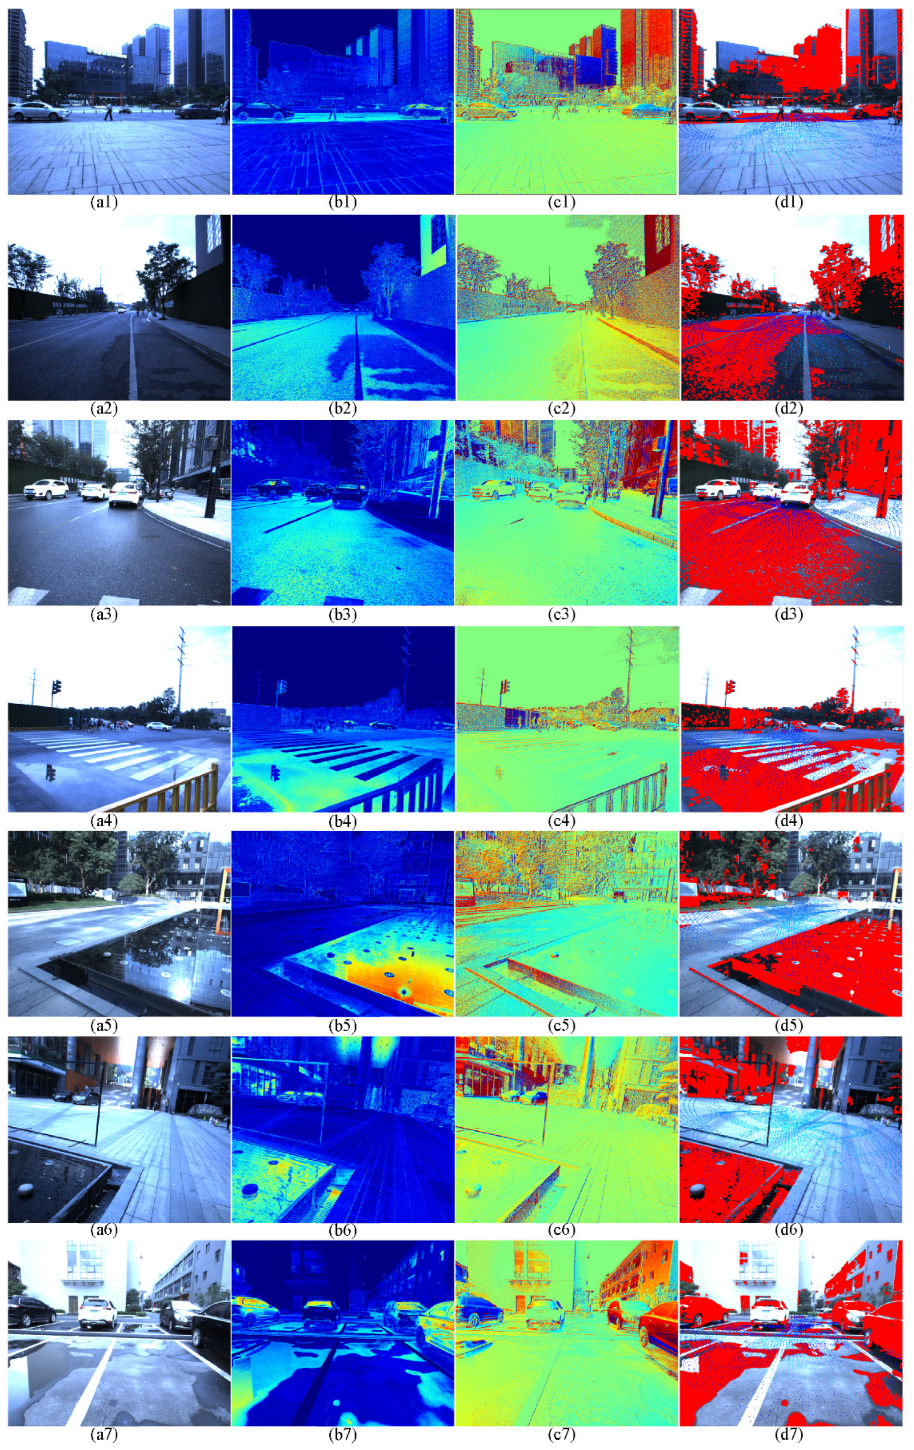
4.1. Pixel-Level Aligned Polarization-Color-Depth Data Information
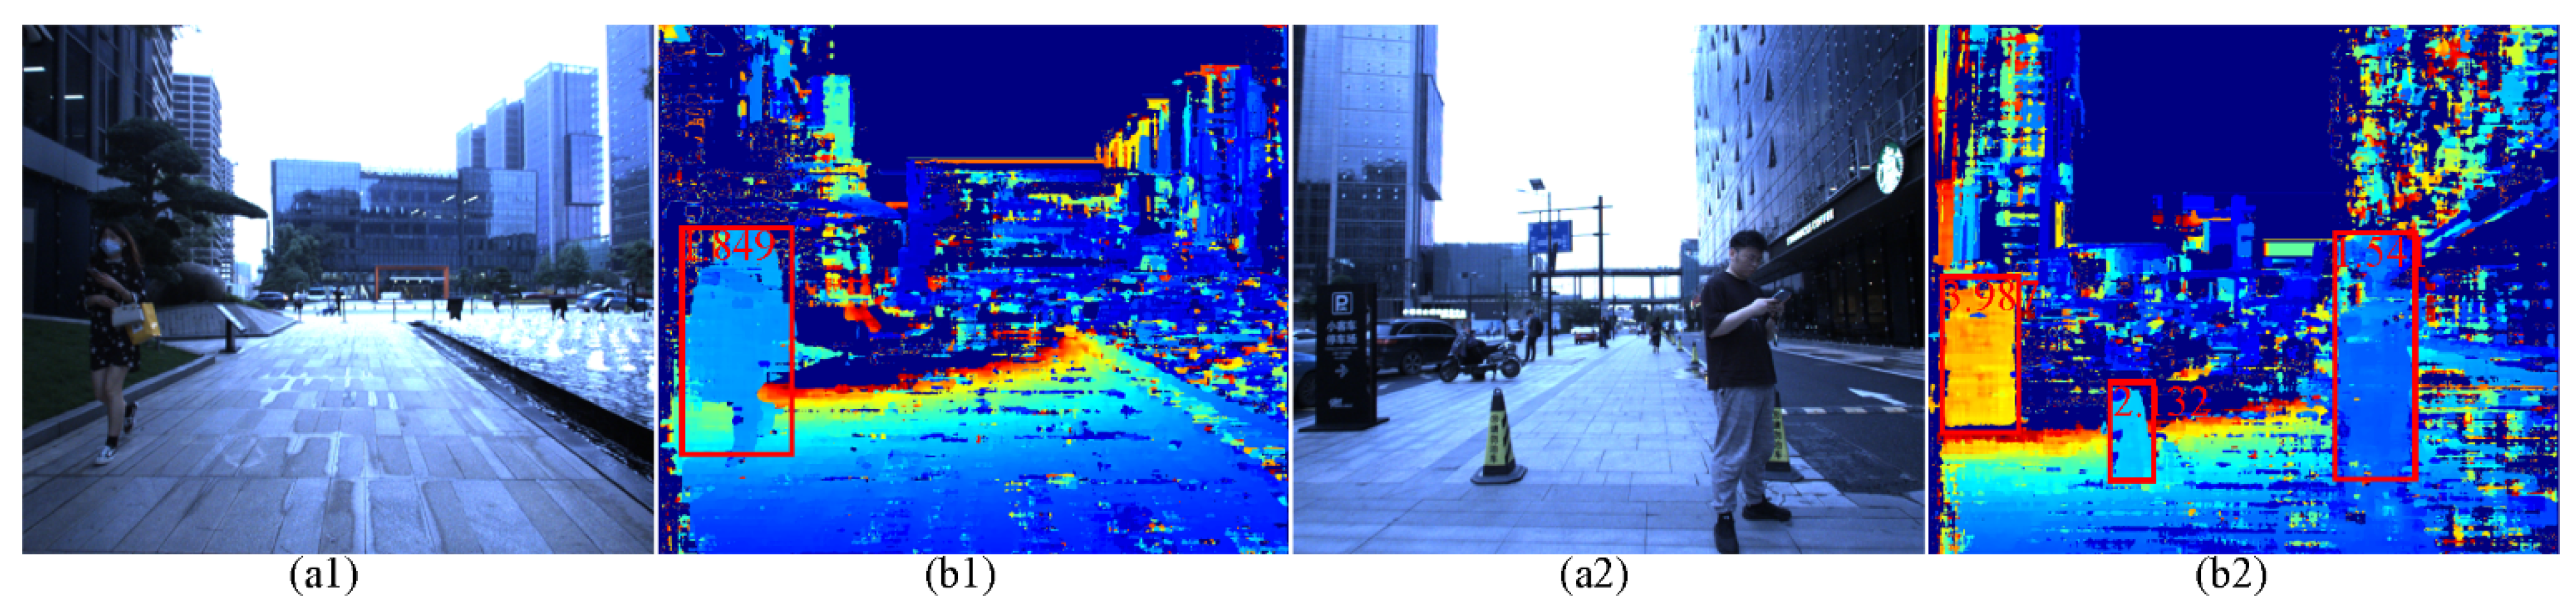
4.2. Slippery Road Surface and Puddles Detection
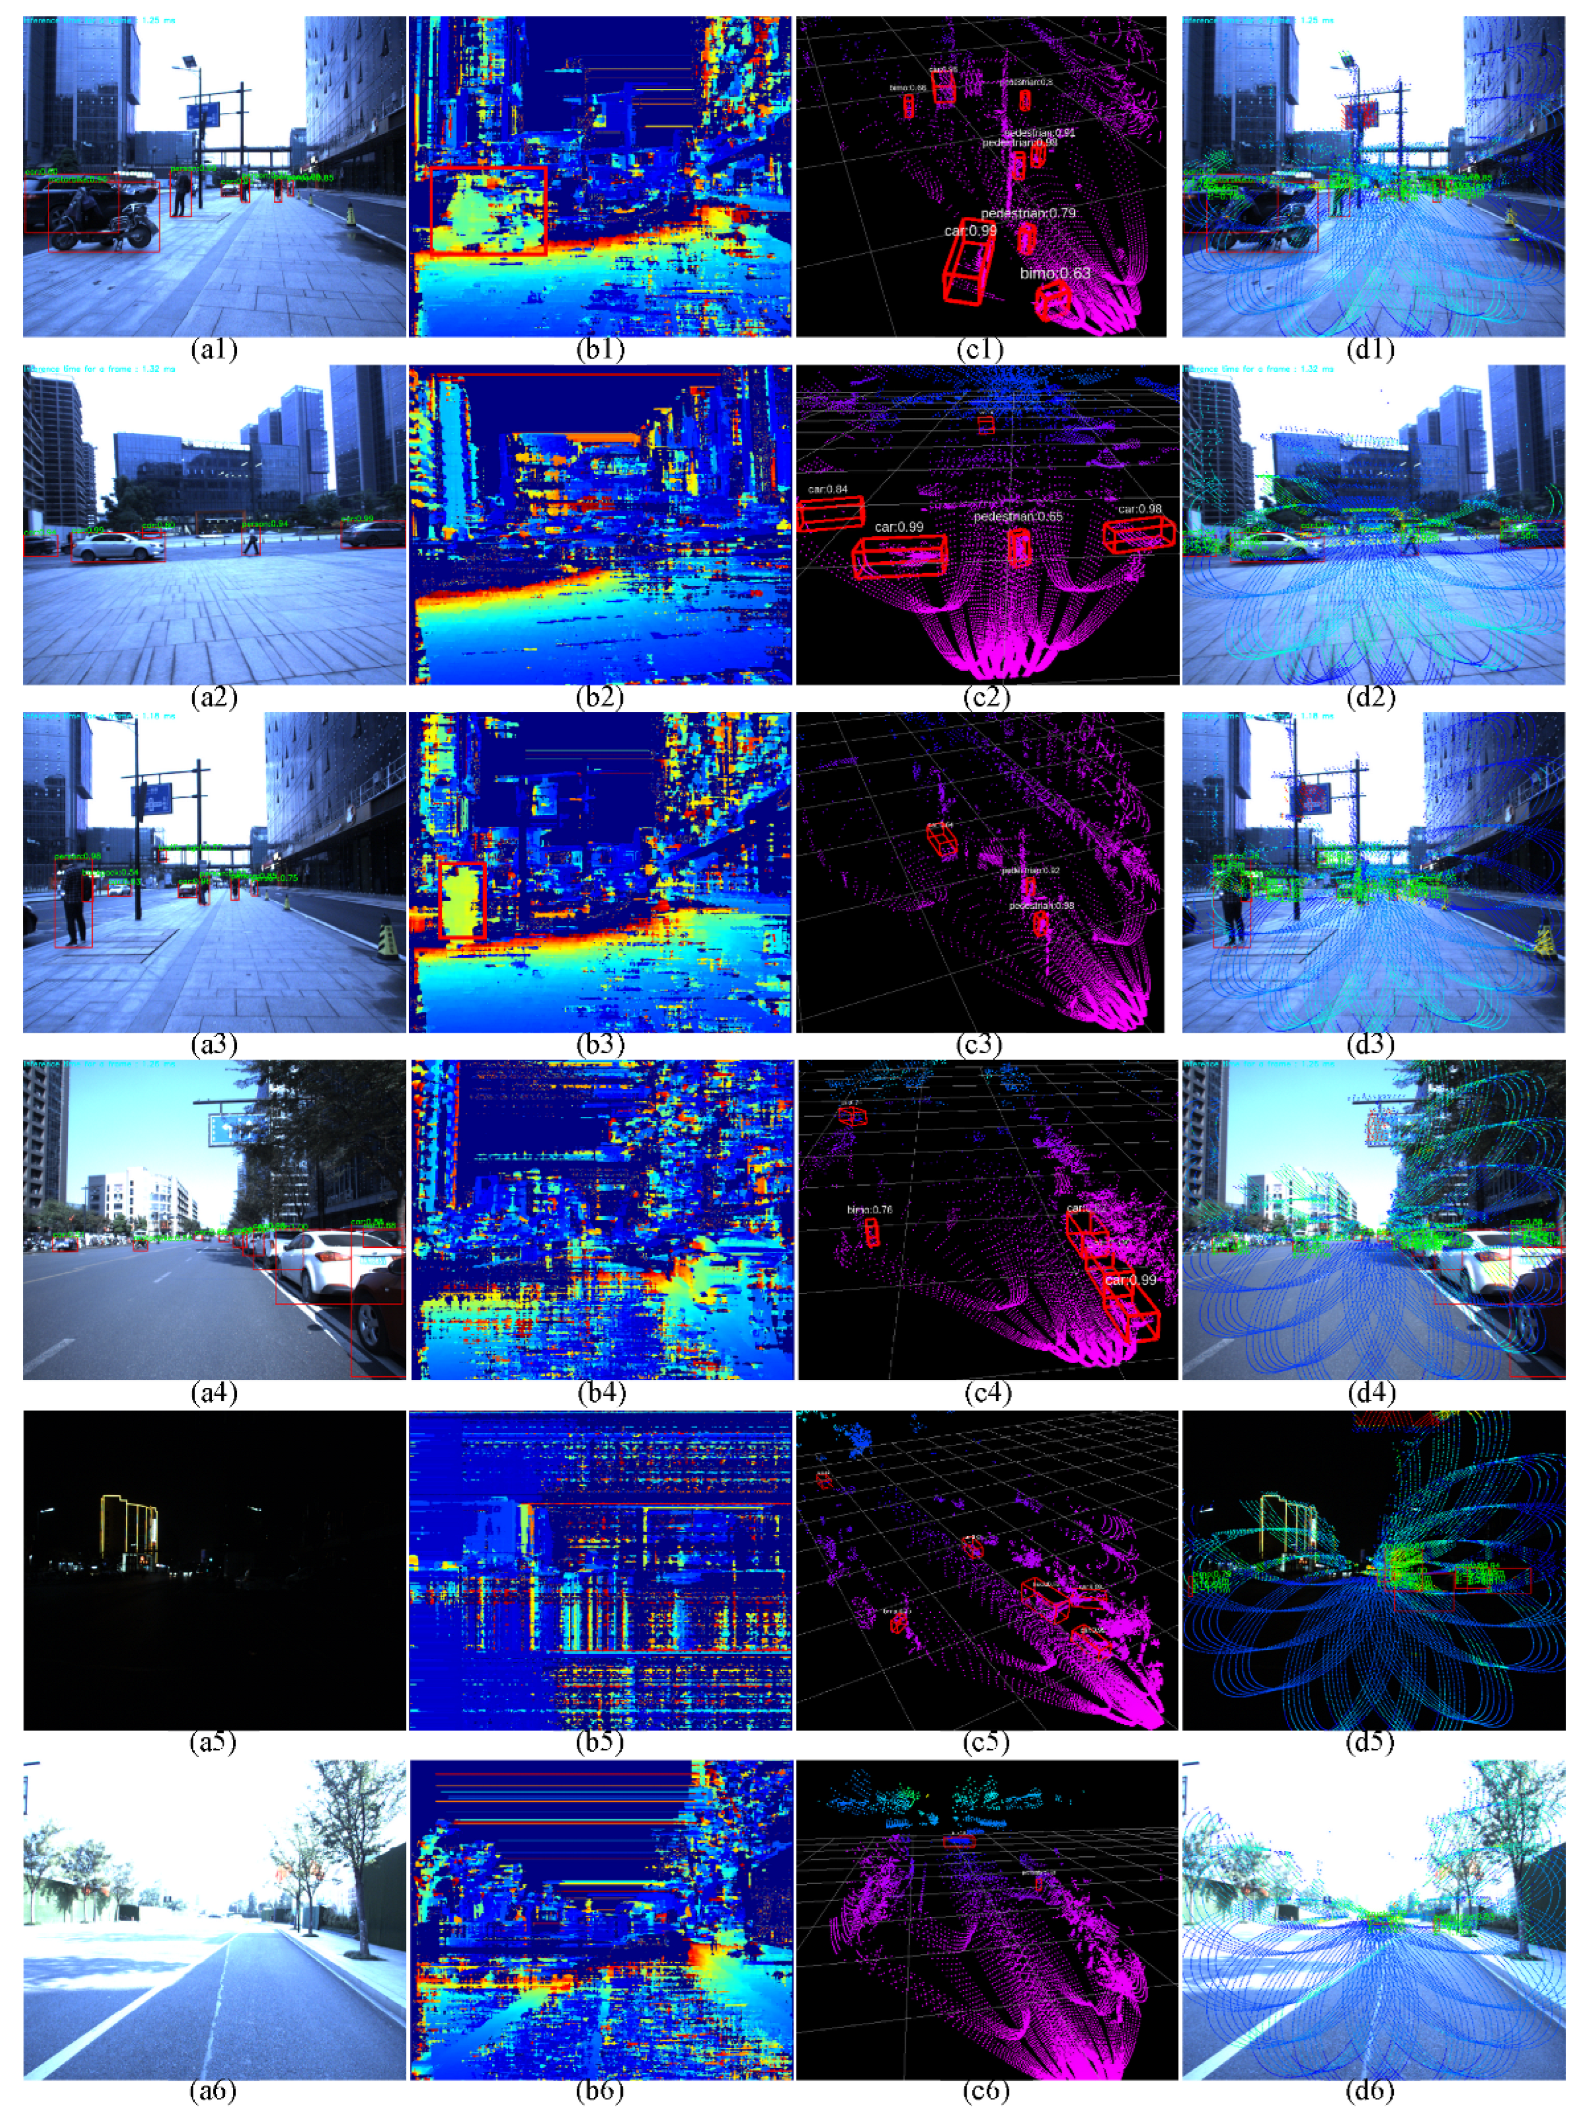
4.3. Objects Detection and Data Fusion
5. Conclusions and Future Work
Author Contributions
Funding
Institutional Review Board Statement
Informed Consent Statement
Data Availability Statement
Conflicts of Interest
References
- Badue, C.; Guidolini, R.; Carneiro, R.V.; Azevedo, P.; Cardoso, V.B.; Forechi, A.; Jesus, L.; Berriel, R.; Paixão, T.M.; Mutz, F.; et al. Self-driving cars: A survey. Expert Syst. Appl. 2021, 165, 113816. [Google Scholar] [CrossRef]
- LeCun, Y.; Bengio, Y.; Hinton, G. Deep learning. Nature 2015, 521, 436–444. [Google Scholar] [CrossRef]
- Zhao, Z.-Q.; Zheng, P.; Xu, S.-T.; Wu, X. Object Detection with Deep Learning: A Review. IEEE Trans. Neural Netw. Learn. Syst. 2019, 30, 3212–3232. [Google Scholar] [CrossRef] [Green Version]
- Wu, X.; Sahoo, D.; Hoi, S.C.H. Recent advances in deep learning for object detection. Neurocomputing 2020, 396, 39–64. [Google Scholar] [CrossRef] [Green Version]
- Wang, W.; Lai, Q.; Fu, H.; Shen, J.; Ling, H.; Yang, R. Salient Objct Detection in the Deep Learning Era: An In-Depth Survey. IEEE Trans. Pattern Anal. Mach. Intell. 2021, 1. [Google Scholar] [CrossRef]
- Lazaros, N.; Sirakoulis, G.C.; Gasteratos, A. Review of Stereo Vision Algorithms: From Software to Hardware. Int. J. Optomechatronics 2008, 2, 435–462. [Google Scholar] [CrossRef]
- Xiang, K.; Yang, K.; Wang, K. Polarization-driven semantic segmentation via efficient attention-bridged fusion. Opt. Express 2021, 29, 4802–4820. [Google Scholar] [CrossRef]
- Xie, B.; Pan, H.; Xiang, Z.; Liu, J. Polarization-Based Water Hazards Detection for Autonomous Off-Road Navigation. In Proceedings of the 2007 International Conference on Mechatronics and Automation, Harbin, China, 5–8 August 2007; pp. 1666–1670. [Google Scholar]
- Yang, K.; Wang, K.; Cheng, R.; Hu, W.; Huang, X.; Bai, J. Detecting Traversable Area and Water Hazards for the Visually Impaired with a pRGB-D Sensor. Sensors 2017, 17, 1890. [Google Scholar] [CrossRef] [Green Version]
- Nguyen, C.V.; Milford, M.; Mahony, R. 3D tracking of water hazards with polarized stereo cameras. In Proceedings of the 2017 IEEE International Conference on Robotics and Automation (ICRA), Singapore, 29 May–3 June 2017; pp. 5251–5257. [Google Scholar]
- Roriz, R.; Campos, A.; Pinto, S.; Gomes, T. DIOR: A Hardware-assisted Weather Denoising Solution for LiDAR Point Clouds. IEEE Sens. J. 2021, 1, 1621–1628. [Google Scholar] [CrossRef]
- Zhu, Y.; Zheng, C.; Yuan, C.; Huang, X.; Hong, X. CamVox: A Low-cost and Accurate Lidar-assisted Visual SLAM System. In Proceedings of the 2021 IEEE International Conference on Robotics and Automation (ICRA), Xi’an, China, 30 May–5 June 2021; pp. 5049–5055. [Google Scholar]
- Liu, Z.; Zhang, F.; Hong, X. Low-cost Retina-like Robotic Lidars Based on Incommensurable Scanning. IEEE/ASME Trans. Mechatron. 2021, 1, 58–68. [Google Scholar] [CrossRef]
- Zhong, H.; Wang, H.; Wu, Z.; Zhang, C.; Zheng, Y.; Tang, T. A survey of LiDAR and camera fusion enhancement. Procedia Comput. Sci. 2021, 183, 579–588. [Google Scholar] [CrossRef]
- Mai, N.A.M.; Duthon, P.; Khoudour, L.; Crouzil, A.; Velastin, S.A. Sparse LiDAR and Stereo Fusion (SLS-Fusion) for Depth Estimationand 3D Object Detection 2021. In Proceedings of the 11th International Conference of Pattern Recognition Systems (ICPRS 2021), Online Conference, 17–19 March 2021; pp. 150–156. [Google Scholar]
- Long, N.; Wang, K.; Cheng, R.; Hu, W.; Yang, K. Unifying obstacle detection, recognition, and fusion based on millimeter wave radar and RGB-depth sensors for the visually impaired. Rev. Sci. Instrum. 2019, 90, 044102. [Google Scholar] [CrossRef] [PubMed]
- Long, N.; Wang, K.; Cheng, R.; Yang, K.; Bai, J. Fusion of Millimeter Wave Radar and RGB-Depth Sensors for Assisted Navigation of the Visually Impaired. In Proceedings of the Millimetre Wave and Terahertz Sensors and Technology XI, Berlin, Germany, 10–13 September 2018; SPIE—The International Society for Optical Engineering: Ann Arbor, MI, USA, 2018; Volume 10800. [Google Scholar]
- Bochkovskiy, A.; Wang, C.-Y.; Liao, H.-Y.M. YOLOv4: Optimal Speed and Accuracy of Object Detection 2020. arXiv 2004, arXiv:2004.10934. [Google Scholar]
- Yang, J.; Rahardja, S.; Fränti, P. Mean-shift outlier detection and filtering. Pattern Recognit. 2021, 115, 107874. [Google Scholar] [CrossRef]
- Lang, A.H.; Vora, S.; Caesar, H.; Zhou, L.; Yang, J.; Beijbom, O. PointPillars: Fast Encoders for Object Detection from Point Clouds. In Proceedings of the IEEE/CVF Conference on Computer Vision and Pattern Recognition (CVPR), Long Beach, CA, USA, 15–20 June 2019. [Google Scholar]
- Gong, Z.; Lin, H.; Zhang, D.; Luo, Z.; Zelek, J.; Chen, Y.; Nurunnabi, A.; Wang, C.; Li, J. A Frustum-based probabilistic framework for 3D object detection by fusion of LiDAR and camera data. ISPRS J. Photogramm. Remote Sens. 2020, 159, 90–100. [Google Scholar] [CrossRef]
- Zhang, C.; Zhan, Q.; Wang, Q.; Wu, H.; He, T.; An, Y. Autonomous Dam Surveillance Robot System Based on Multi-Sensor Fusion. Sensors 2020, 20, 1097. [Google Scholar] [CrossRef] [Green Version]
- Wang, L.; Chen, T.; Anklam, C.; Goldluecke, B. High Dimensional Frustum PointNet for 3D Object Detection from Camera, LiDAR, and Radar. In Proceedings of the 2020 IEEE Intelligent Vehicles Symposium (IV), Las Vegas, NV, USA, 19 October–13 November 2020; pp. 1621–1628. [Google Scholar]
- Ku, J.; Mozifian, M.; Lee, J.; Harakeh, A.; Waslander, S.L. Joint 3D Proposal Generation and Object Detection from View Aggregation. In Proceedings of the 2018 IEEE/RSJ International Conference on Intelligent Robots and Systems (IROS), Madrid, Spain, 1–5 October 2018; pp. 1–8. [Google Scholar]
- Caltagirone, L.; Bellone, M.; Svensson, L.; Wahde, M. LIDAR–camera fusion for road detection using fully convolutional neural networks. Rob. Auton. Syst. 2019, 111, 125–131. [Google Scholar] [CrossRef] [Green Version]
- Zhuang, Z.; Li, R.; Jia, K.; Wang, Q.; Li, Y.; Tan, M. Perception-Aware Multi-Sensor Fusion for 3D LiDAR Semantic Segmentation. In Proceedings of the IEEE/CVF International Conference on Computer Vision (ICCV), Online Conference, 11–17 October 2021; pp. 16280–16290. [Google Scholar]
- Zhen, W.; Hu, Y.; Liu, J.; Scherer, S. A Joint Optimization Approach of LiDAR-Camera Fusion for Accurate Dense 3-D Reconstructions. IEEE Robot. Autom. Lett. 2019, 4, 3585–3592. [Google Scholar] [CrossRef] [Green Version]
- Gu, S.; Zhang, Y.; Tang, J.; Yang, J.; Kong, H. Road Detection through CRF based LiDAR-Camera Fusion. In Proceedings of the 2019 International Conference on Robotics and Automation (ICRA), Montreal, QC, Canada, 20–24 May 2019; pp. 3832–3838. [Google Scholar]
- Ono, S. Snapshot multispectral imaging using a pixel-wise polarization color image sensor. Opt. Express 2020, 28, 34536–34573. [Google Scholar] [CrossRef]
- Wang, C.-Y.; Bochkovskiy, A.; Liao, H.-Y.M. Scaled-YOLOv4: Scaling Cross Stage Partial Network. In Proceedings of the IEEE/CVF Conference on Computer Vision and Pattern Recognition (CVPR), Online Conference, 20–25 June 2021; pp. 13029–13038. [Google Scholar]
- Lin, T.-Y.; Maire, M.; Belongie, S.; Hays, J.; Perona, P.; Ramanan, D.; Dollár, P.; Zitnick, C.L. Microsoft COCO: Common Objects in Context. In Computer Vision—ECCV 2014; Fleet, D., Pajdla, T., Schiele, B., Tuytelaars, T., Eds.; Springer International Publishing: Cham, Switzerland, 2014; pp. 740–755. [Google Scholar]
- Qi, C.R.; Liu, W.; Wu, C.; Su, H.; Guibas, L.J. Frustum PointNets for 3D Object Detection From RGB-D Data. In Proceedings of the IEEE Conference on Computer Vision and Pattern Recognition (CVPR), Salt Lake City, UT, USA, 18–23 June 2018. [Google Scholar]
- Zhou, Y.; Tuzel, O. VoxelNet: End-to-End Learning for Point Cloud Based 3D Object Detection. In Proceedings of the IEEE Conference on Computer Vision and Pattern Recognition (CVPR), Salt Lake City, UT, USA, 18–23 June 2018. [Google Scholar]
- Zhang, Z. A flexible new technique for camera calibration. IEEE Trans. Pattern Anal. Mach. Intell. 2000, 22, 1330–1334. [Google Scholar] [CrossRef] [Green Version]
- Wang, P.; Xu, G.; Cheng, Y.; Yu, Q. A simple, robust and fast method for the perspective-n-point Problem. Pattern Recognit. Lett. 2018, 108, 31–37. [Google Scholar] [CrossRef]
- Agarwal, S.; Mierle, K. Others Ceres Solver. Available online: http://ceres-solver.org (accessed on 22 February 2022).
- Aeberhard, M.; Schlichtharle, S.; Kaempchen, N.; Bertram, T. Track-to-Track Fusion With Asynchronous Sensors Using Information Matrix Fusion for Surround Environment Perception. IEEE Trans. Intell. Transp. Syst. 2012, 13, 1717–1726. [Google Scholar] [CrossRef]
- Long, N.; Wang, K.; Cheng, R.; Yang, K.; Hu, W.; Bai, J. Assisting the visually impaired: Multitarget warning through millimeter wave radar and RGB-depth sensors. J. Electron. Imaging 2019, 28, 013028. [Google Scholar] [CrossRef]


| Number of Samples | Detection Results | Accuracy(%) | ||
|---|---|---|---|---|
| slippery road surface | 937 (positive) | TP:927 | FN:10 | 98.91 |
| 814 (negative) | FP:9 | TN:805 | ||
| puddles | 695 (positive) | TP:689 | FN:6 | 98.71 |
| 623 (negative) | FP:11 | TN:612 | ||
Publisher’s Note: MDPI stays neutral with regard to jurisdictional claims in published maps and institutional affiliations. |
© 2022 by the authors. Licensee MDPI, Basel, Switzerland. This article is an open access article distributed under the terms and conditions of the Creative Commons Attribution (CC BY) license (https://creativecommons.org/licenses/by/4.0/).
Share and Cite
Long, N.; Yan, H.; Wang, L.; Li, H.; Yang, Q. Unifying Obstacle Detection, Recognition, and Fusion Based on the Polarization Color Stereo Camera and LiDAR for the ADAS. Sensors 2022, 22, 2453. https://doi.org/10.3390/s22072453
Long N, Yan H, Wang L, Li H, Yang Q. Unifying Obstacle Detection, Recognition, and Fusion Based on the Polarization Color Stereo Camera and LiDAR for the ADAS. Sensors. 2022; 22(7):2453. https://doi.org/10.3390/s22072453
Chicago/Turabian StyleLong, Ningbo, Han Yan, Liqiang Wang, Haifeng Li, and Qing Yang. 2022. "Unifying Obstacle Detection, Recognition, and Fusion Based on the Polarization Color Stereo Camera and LiDAR for the ADAS" Sensors 22, no. 7: 2453. https://doi.org/10.3390/s22072453
APA StyleLong, N., Yan, H., Wang, L., Li, H., & Yang, Q. (2022). Unifying Obstacle Detection, Recognition, and Fusion Based on the Polarization Color Stereo Camera and LiDAR for the ADAS. Sensors, 22(7), 2453. https://doi.org/10.3390/s22072453