
Mechanism of Magnetic Permeability Perturbation in Magnetizing-Based Eddy Current Nondestructive Testing


Abstract
:1. Introduction
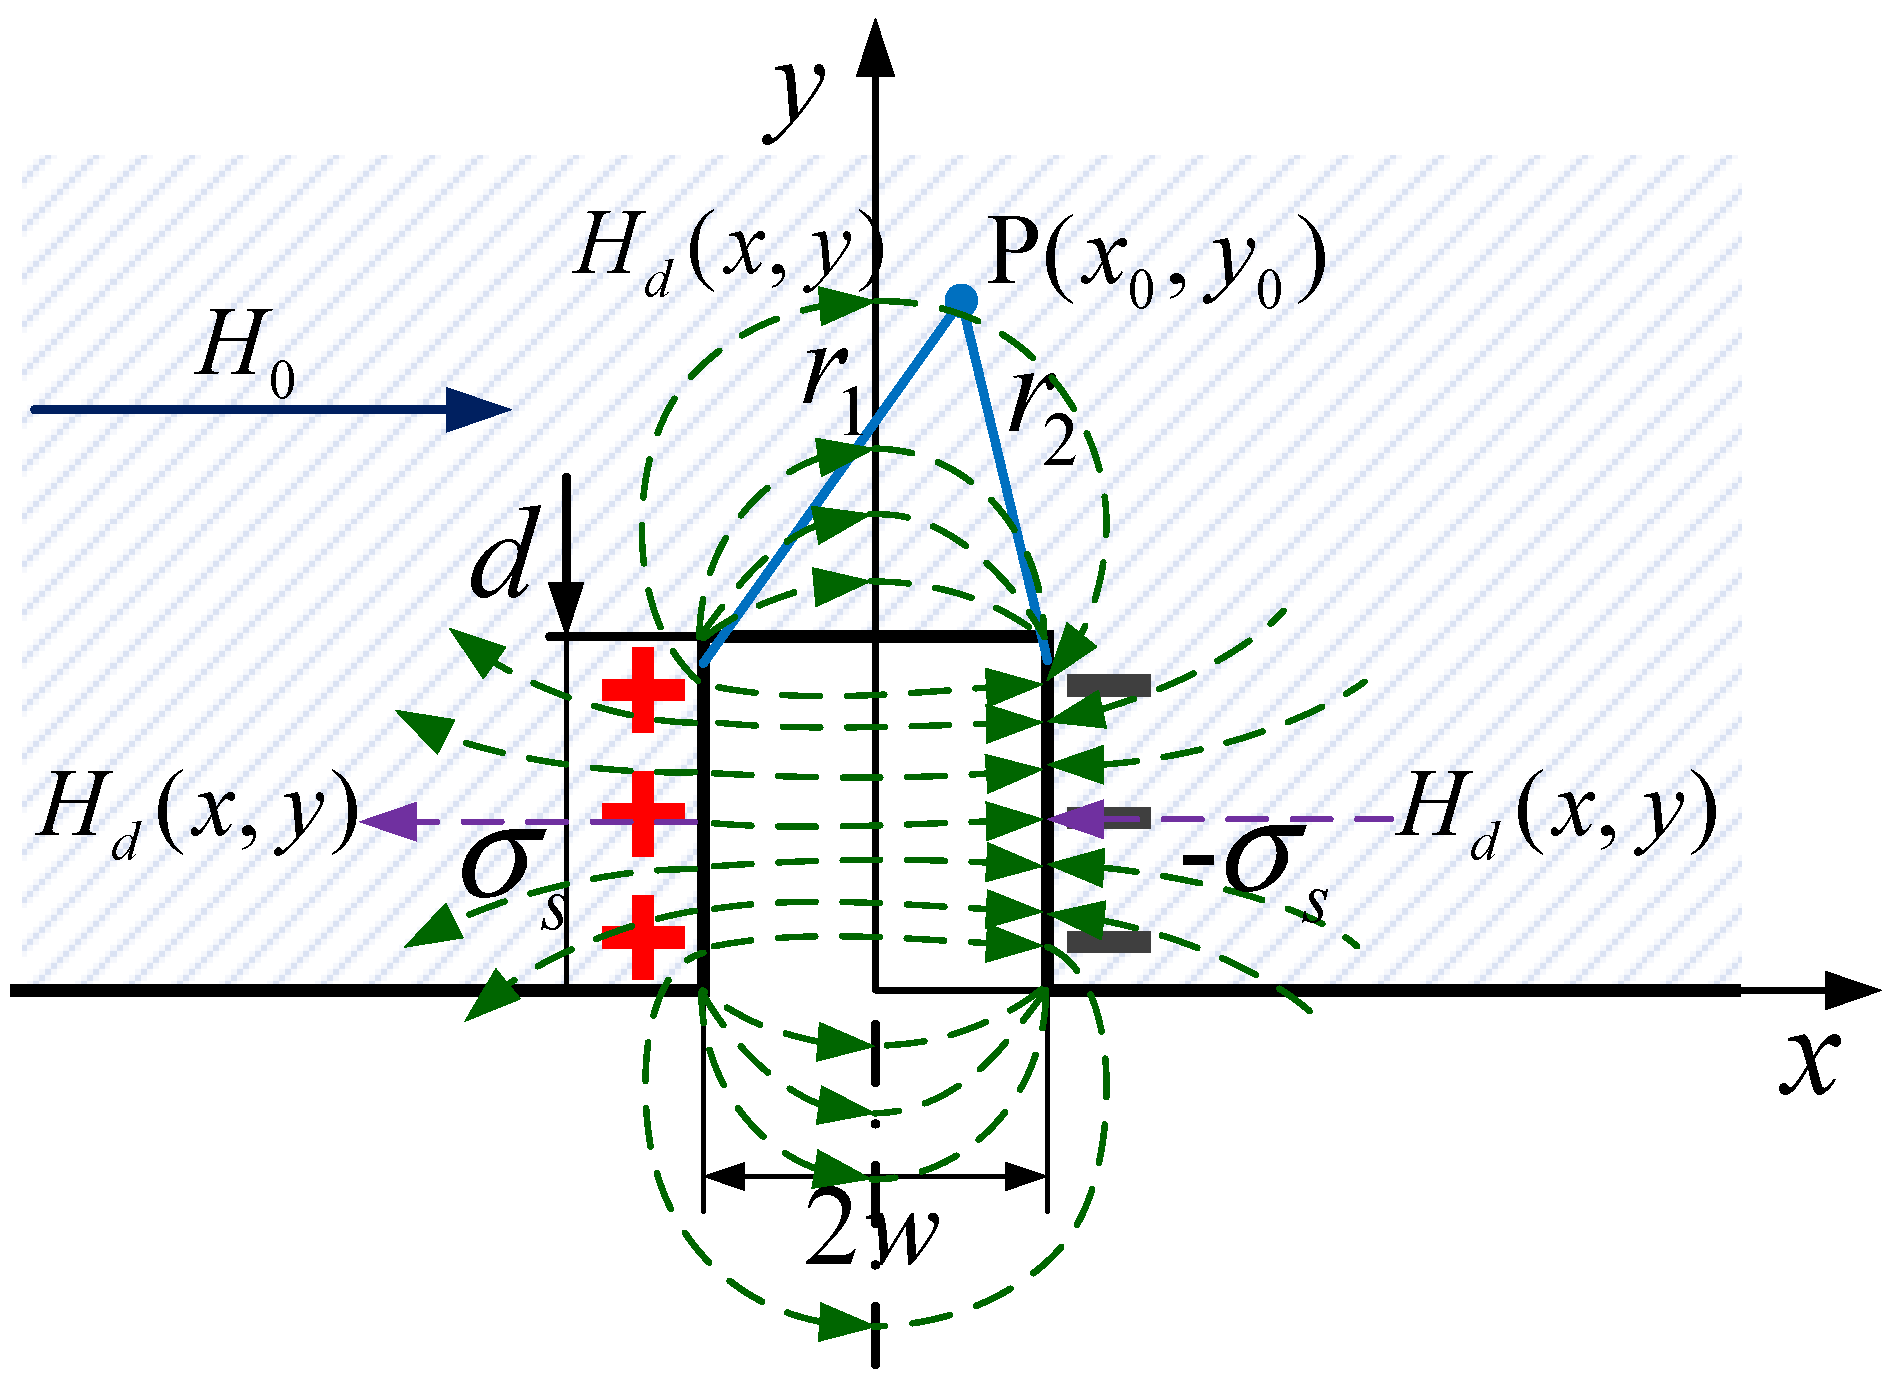
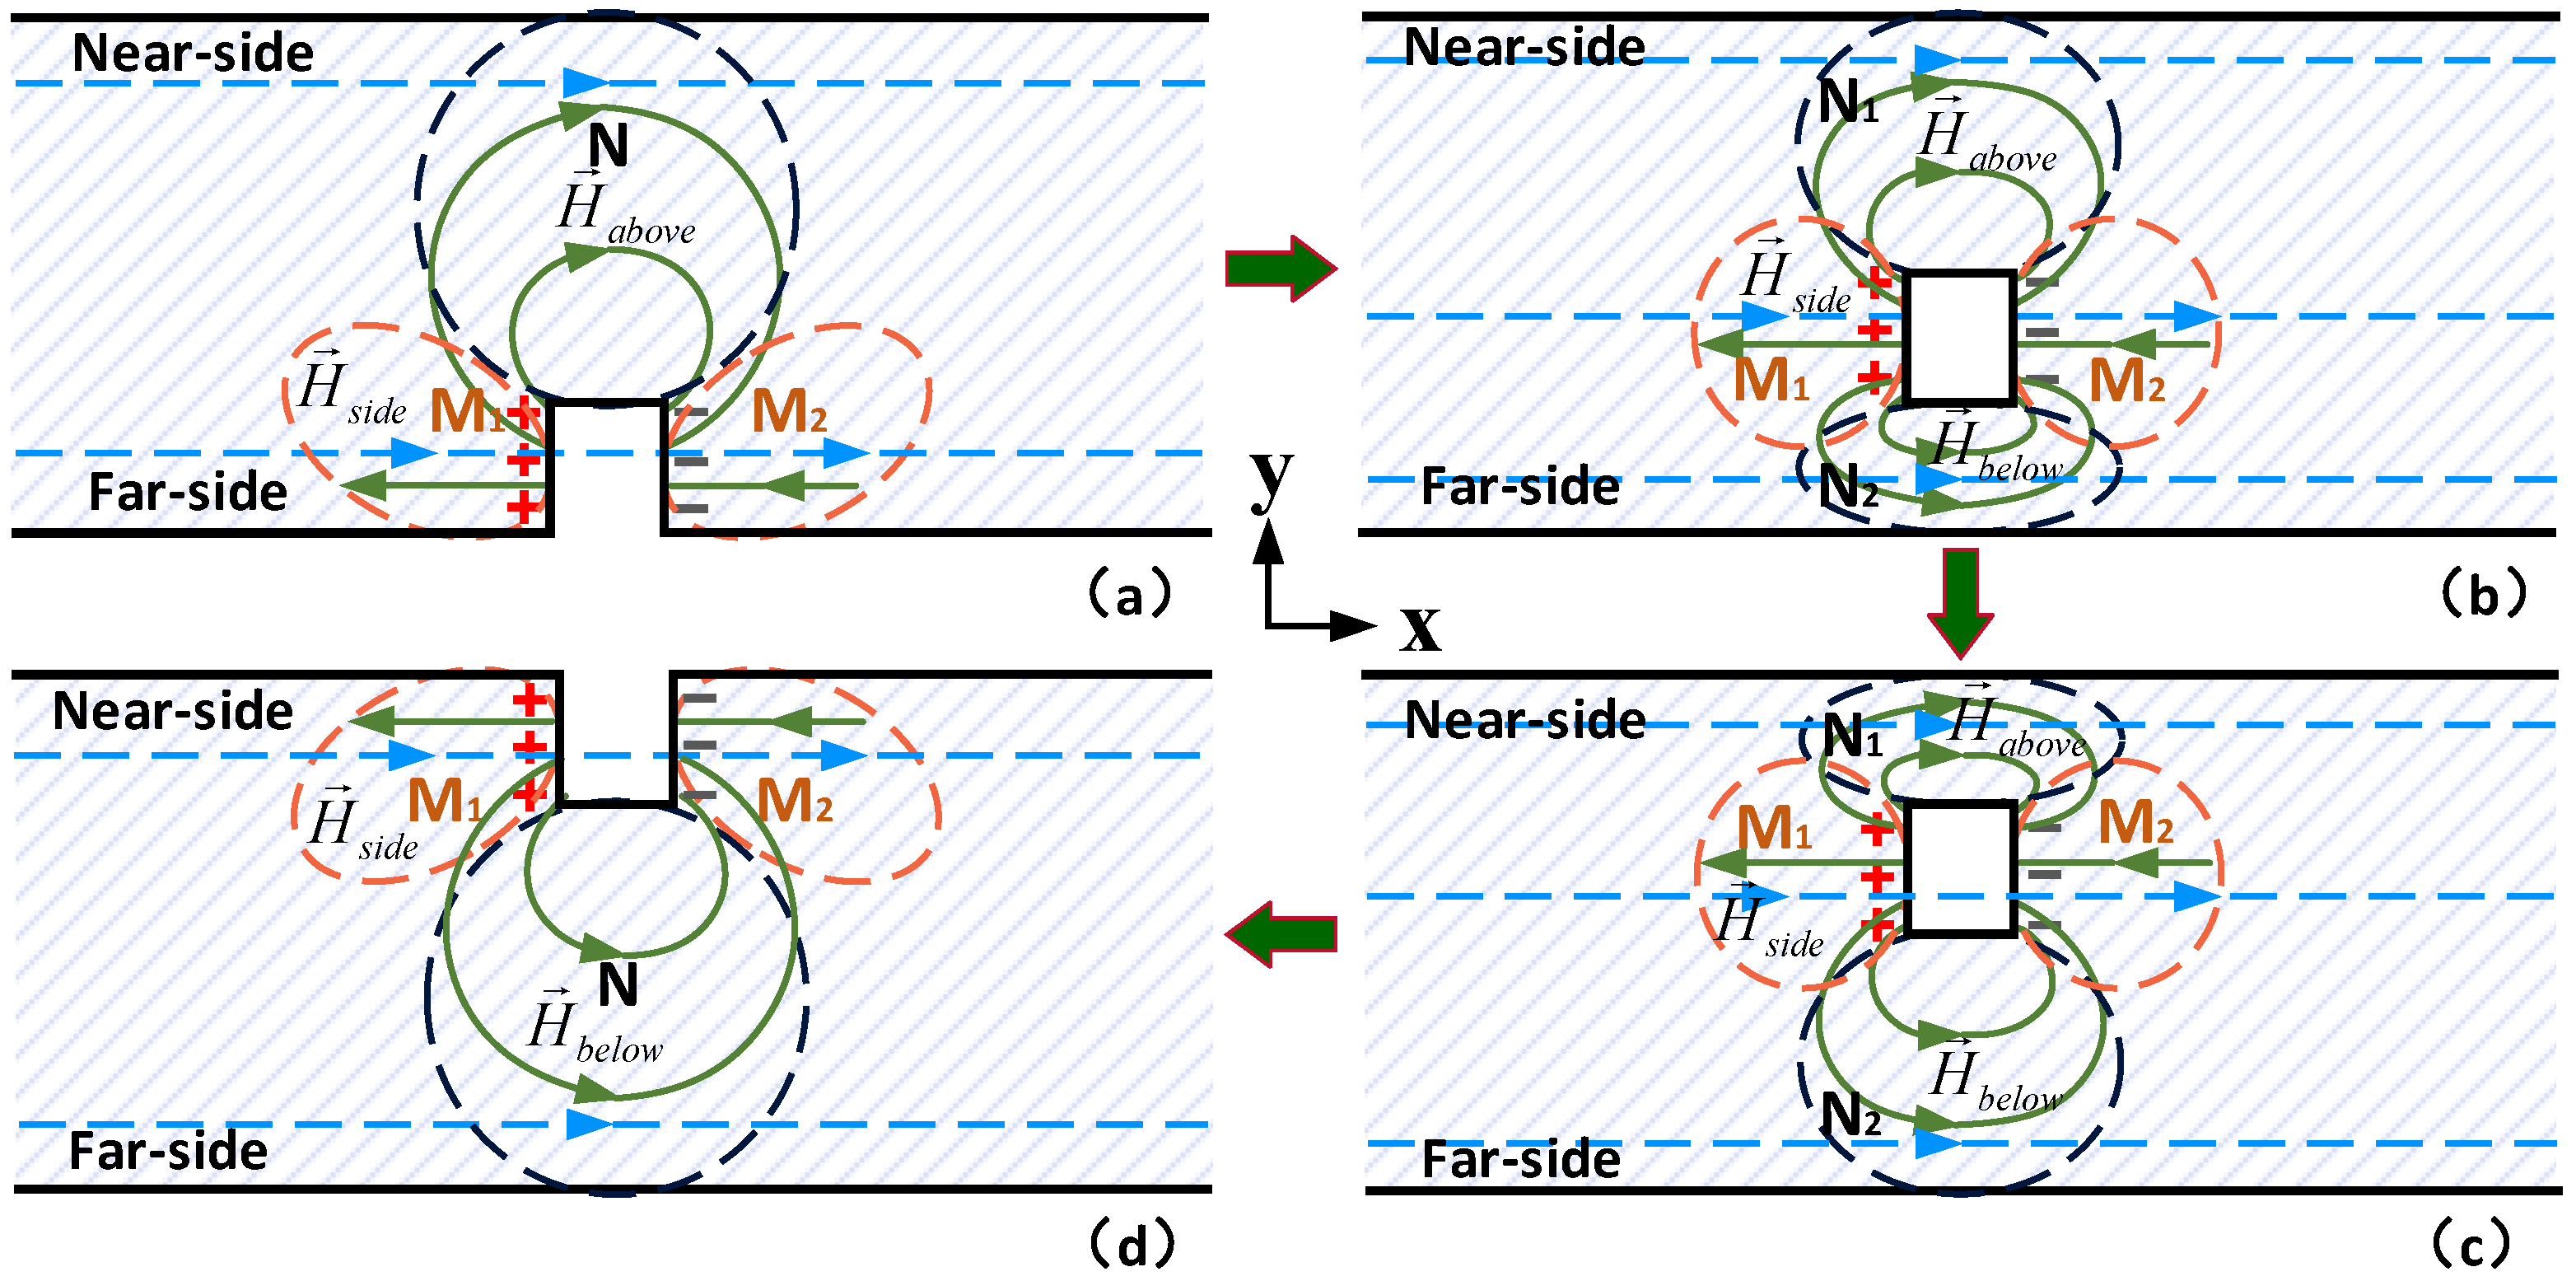
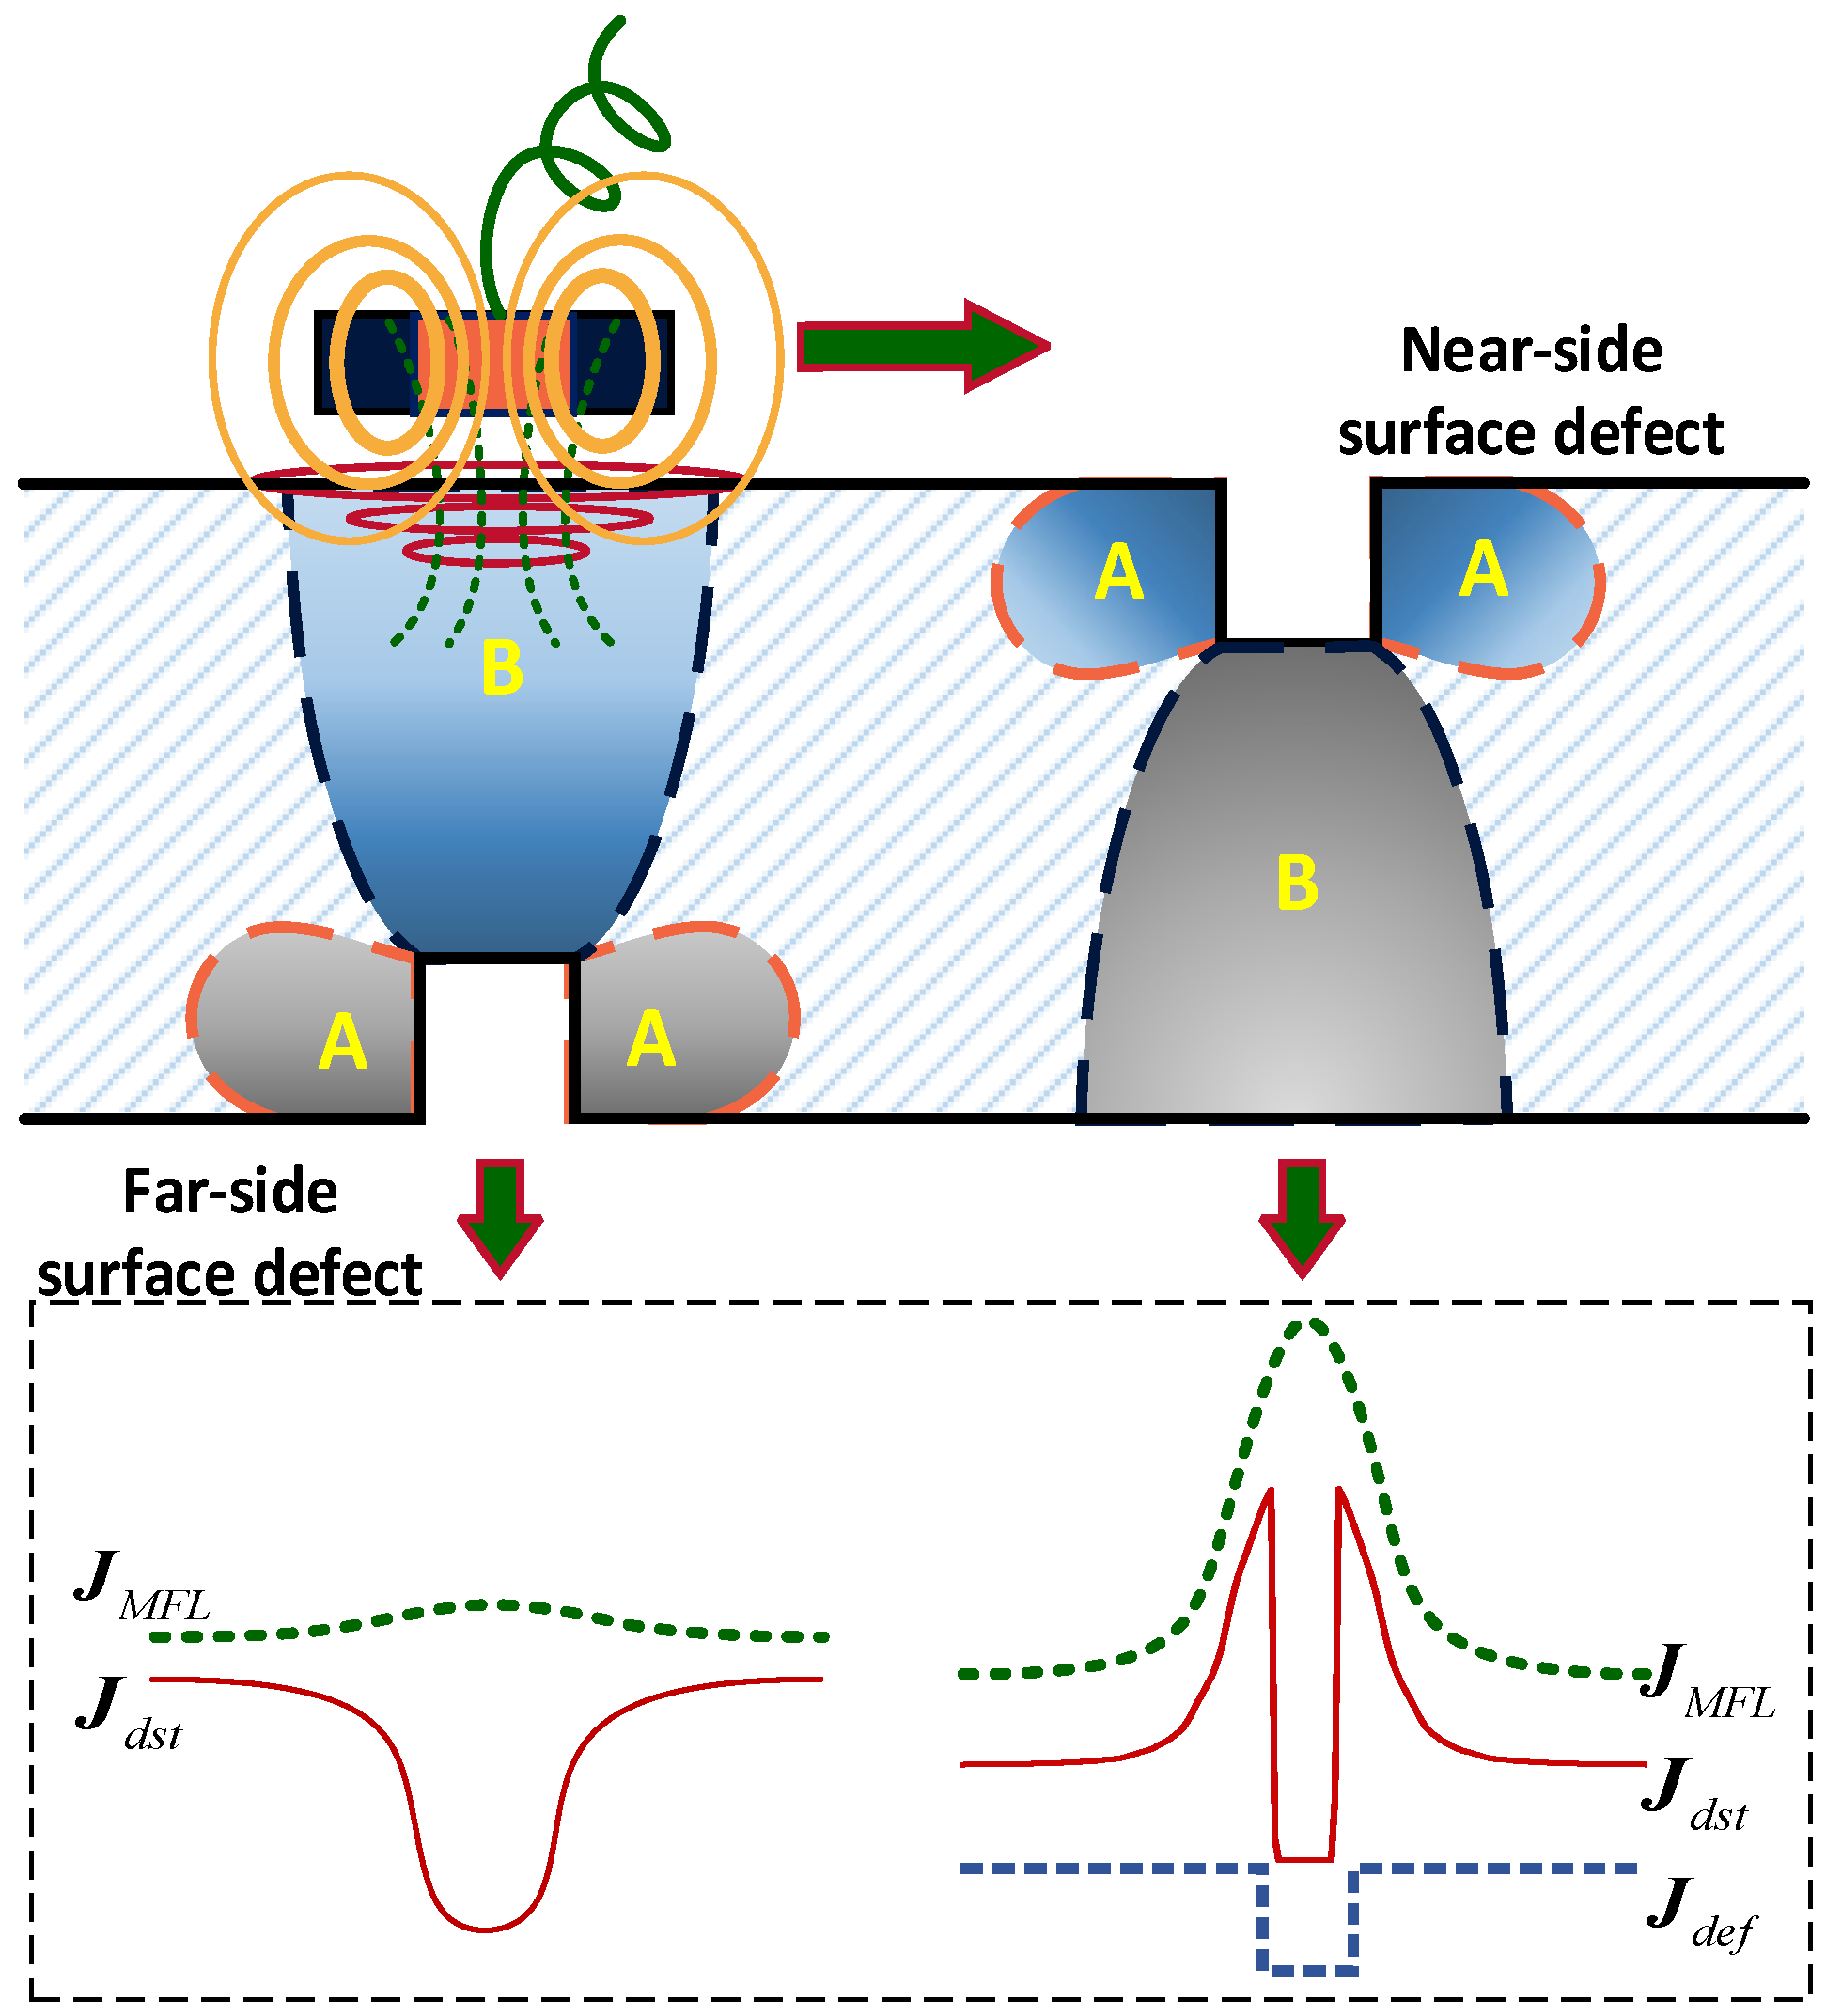
2. Mechanism
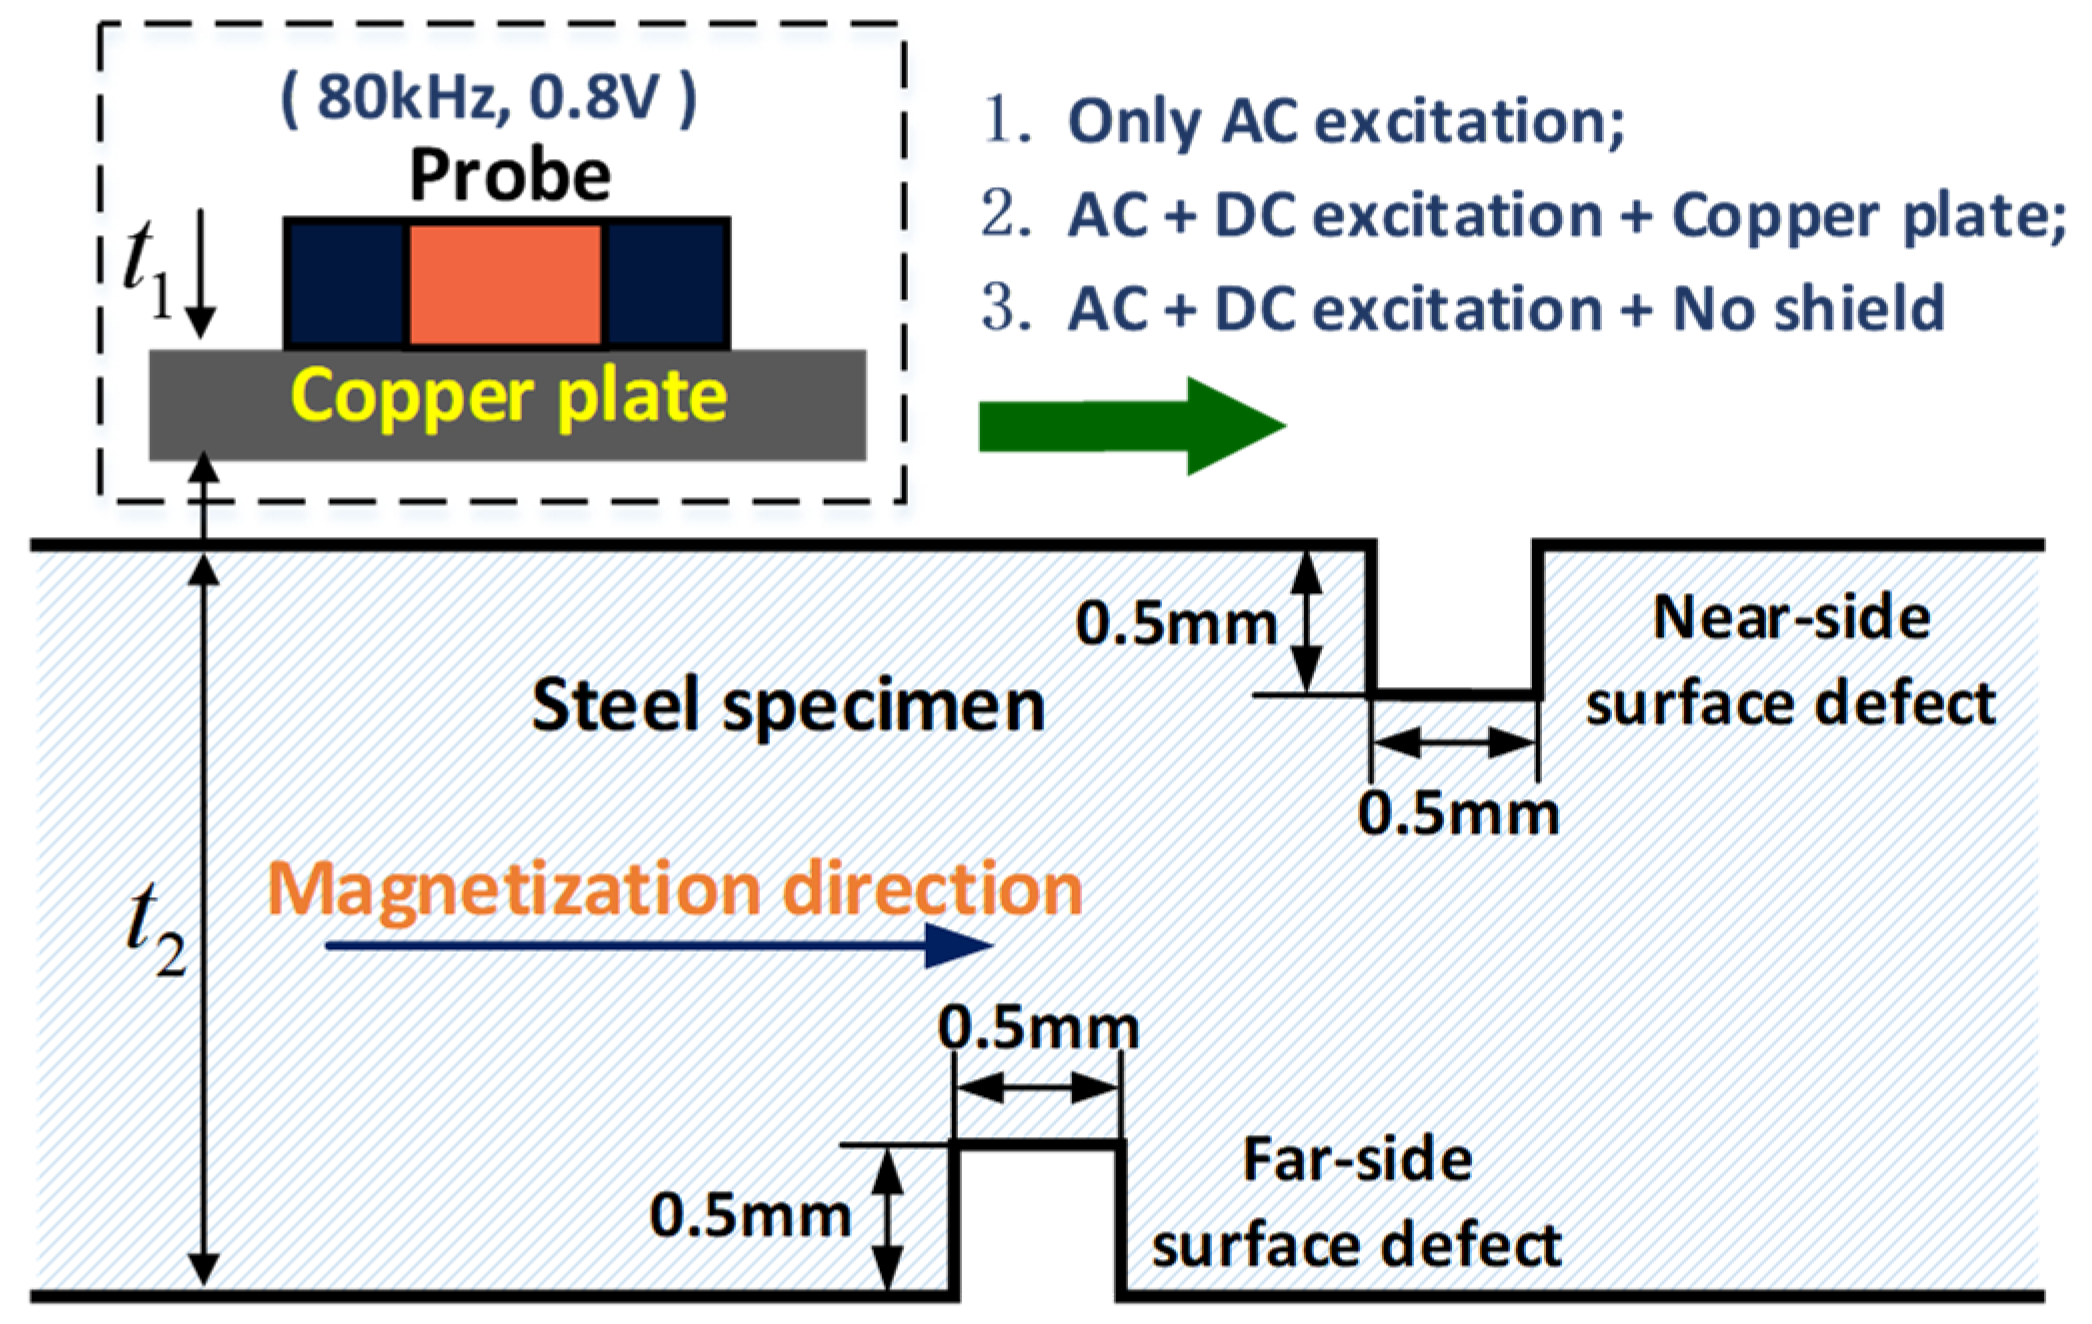
3. Simulation and Experiment
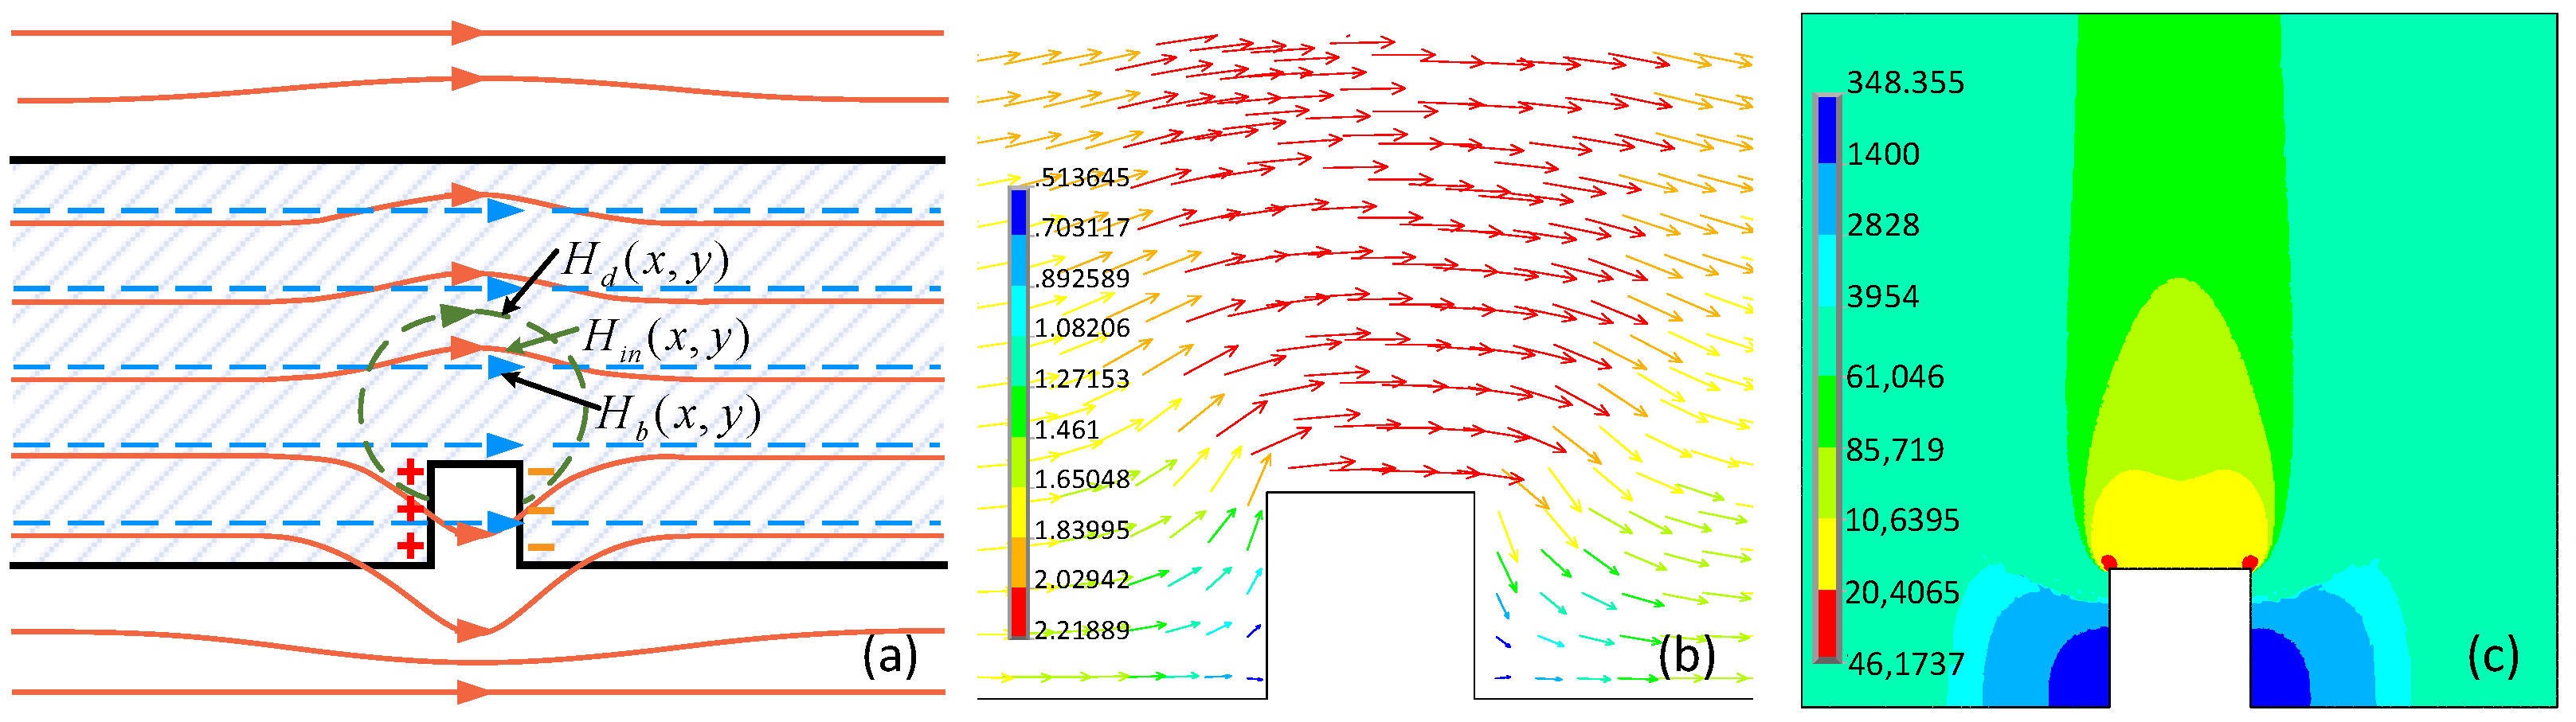
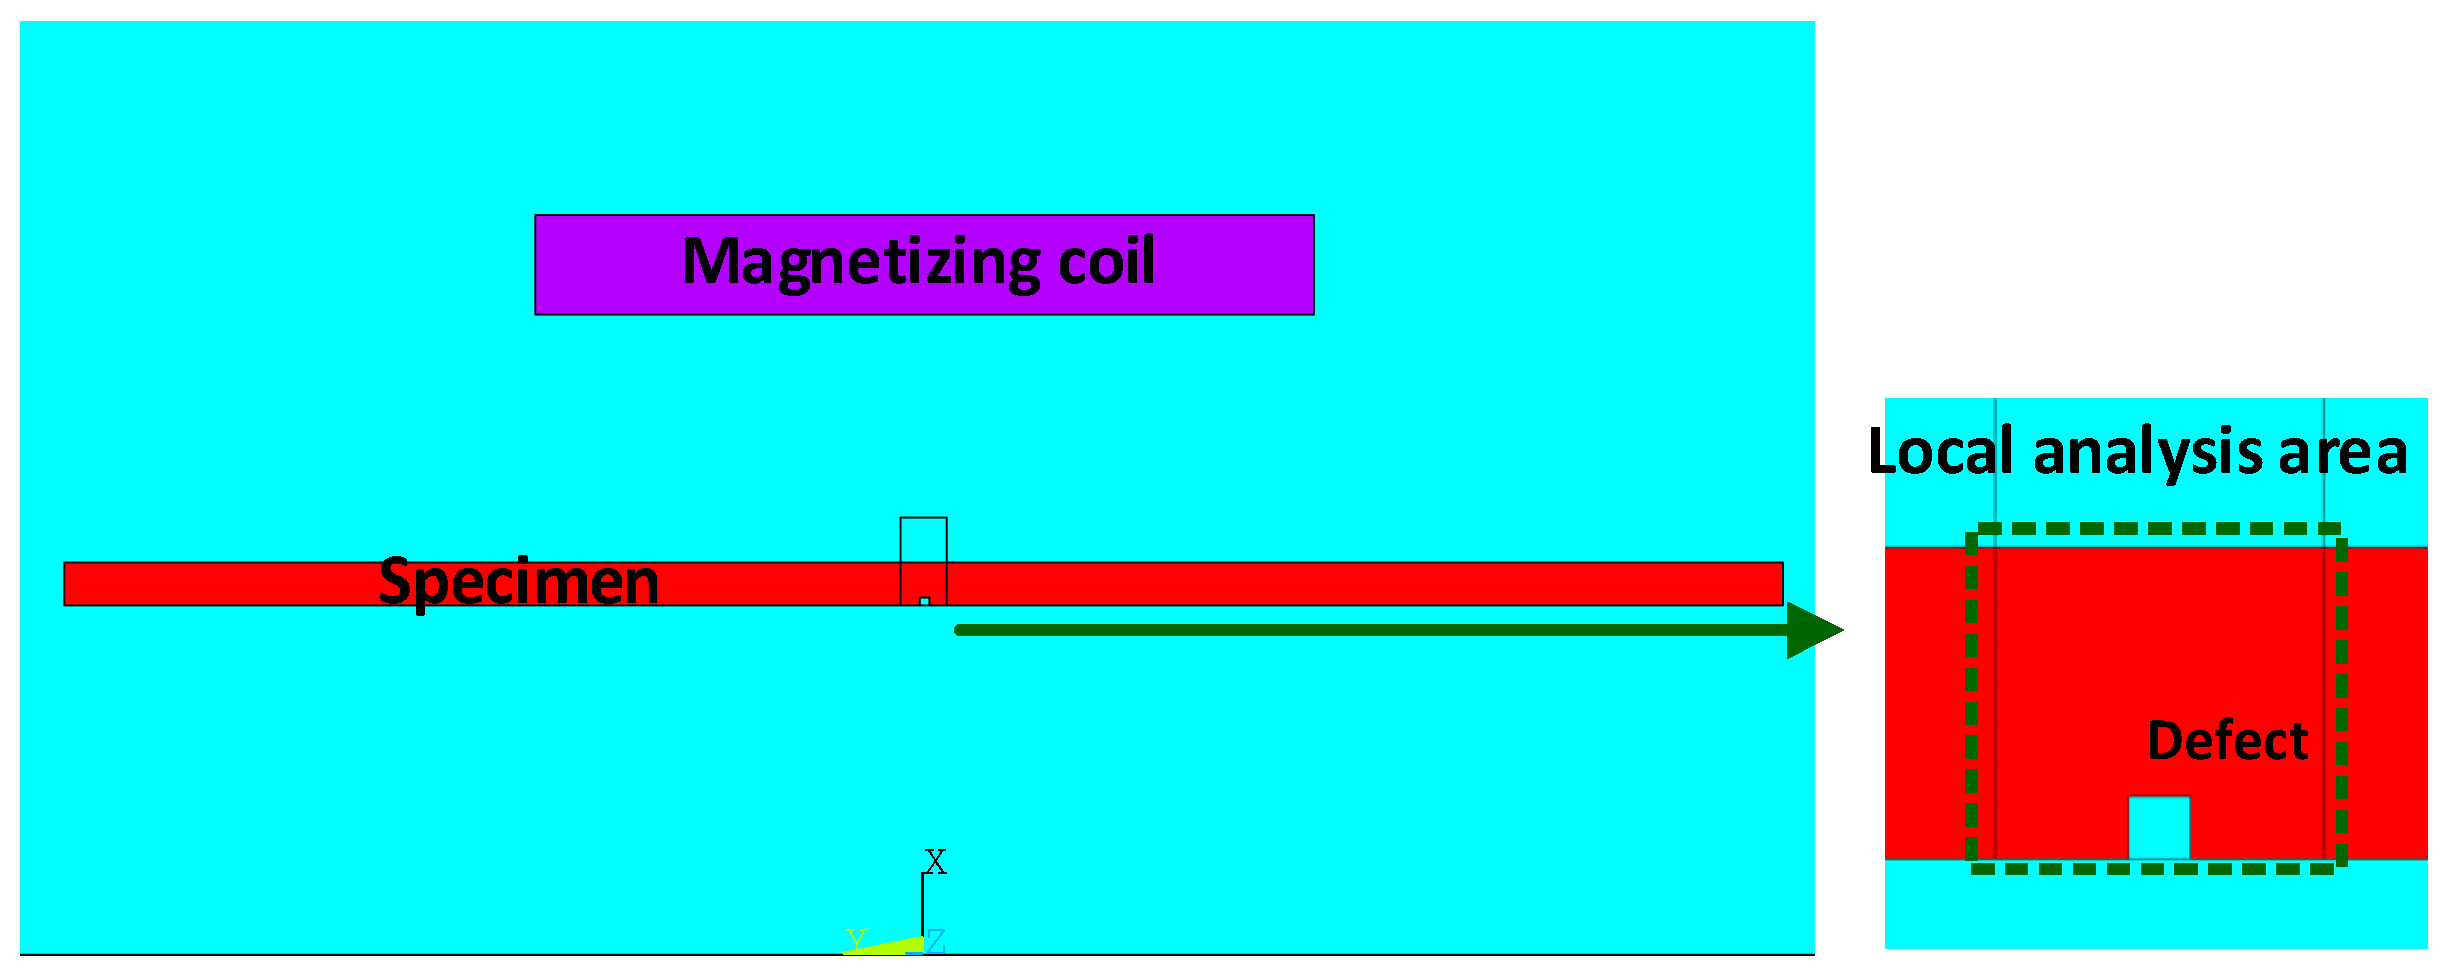
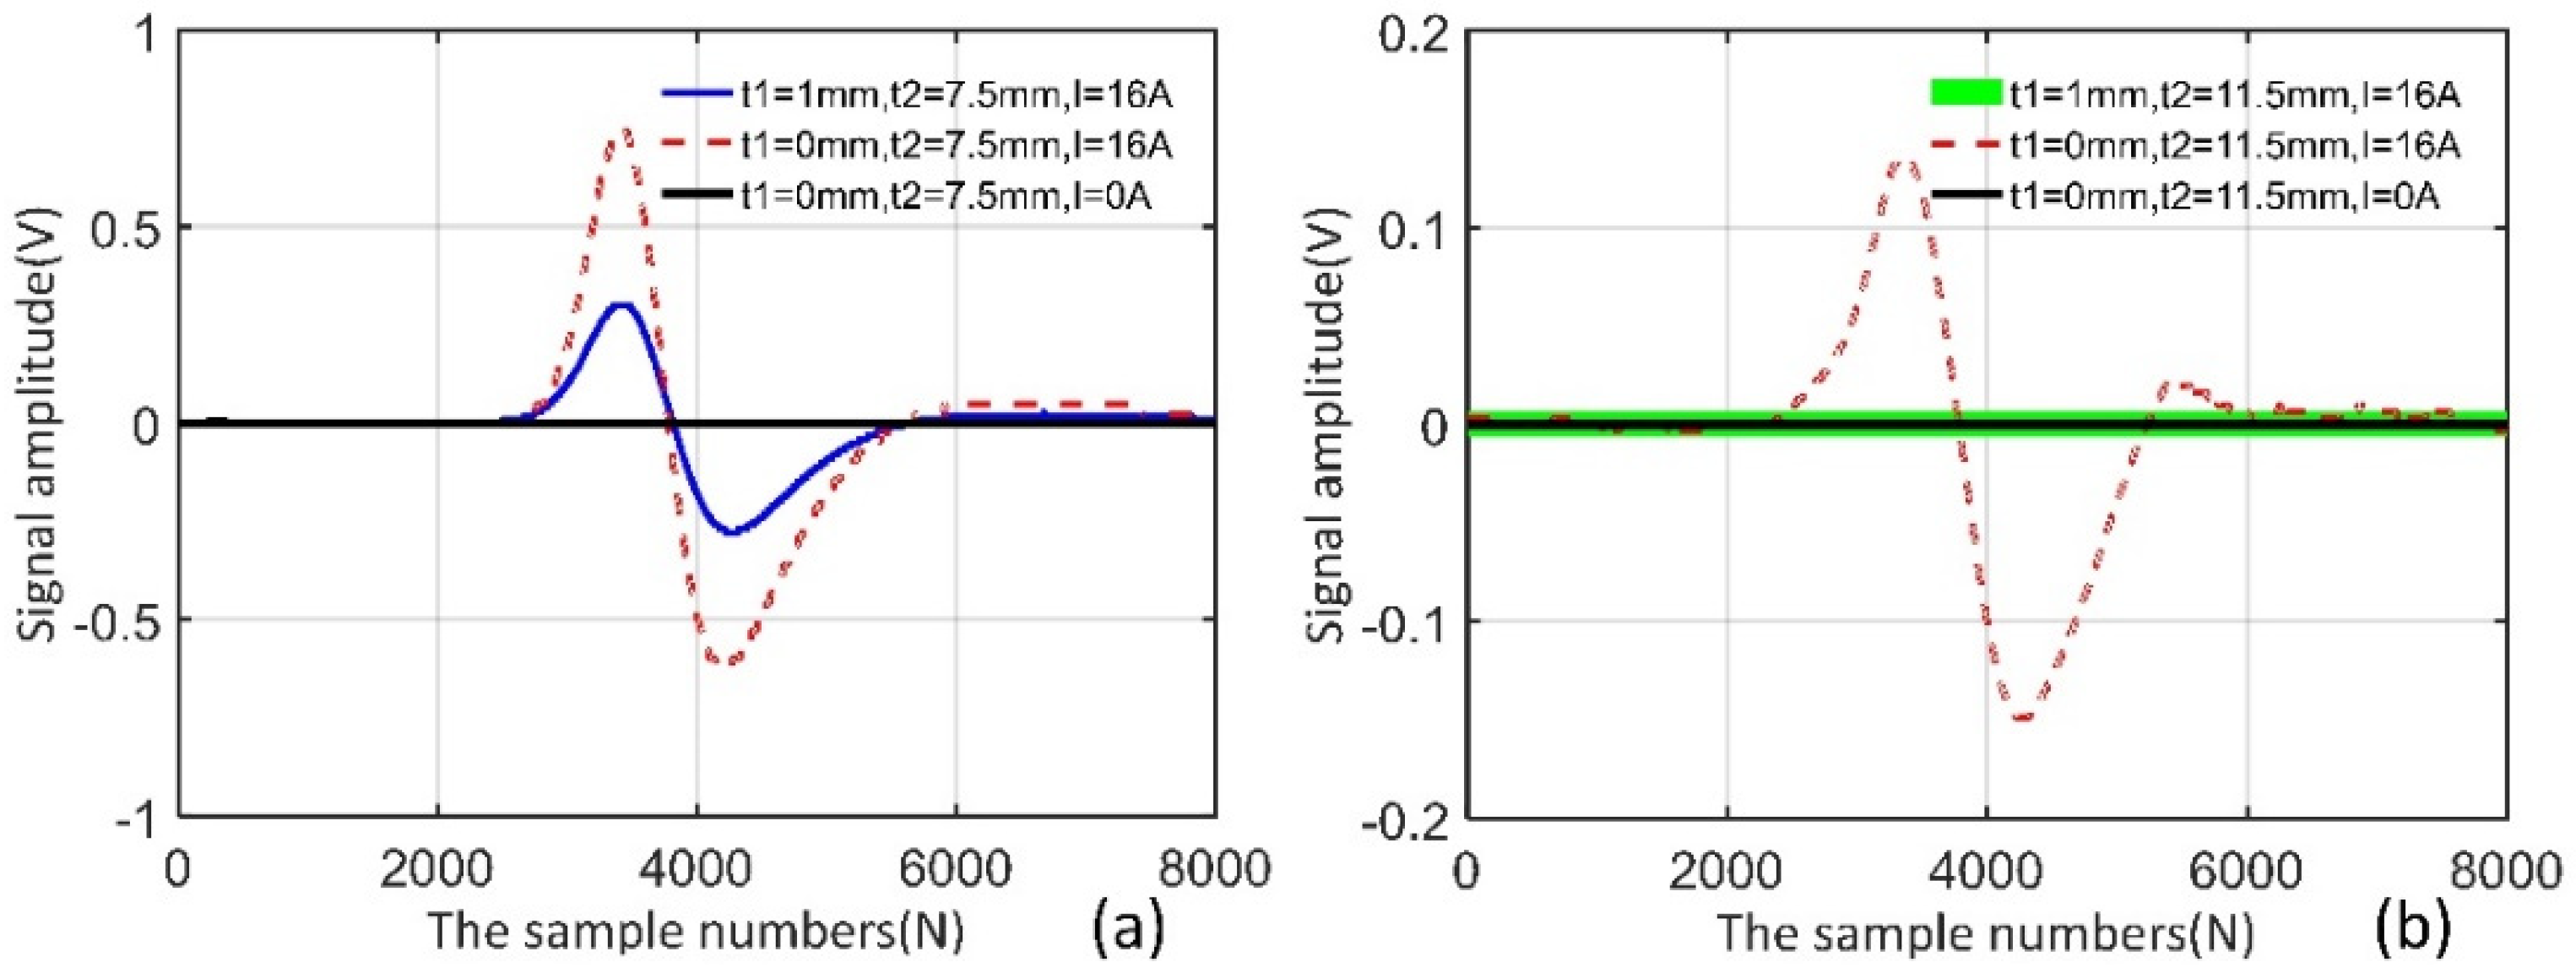
3.1. Verification via FEM
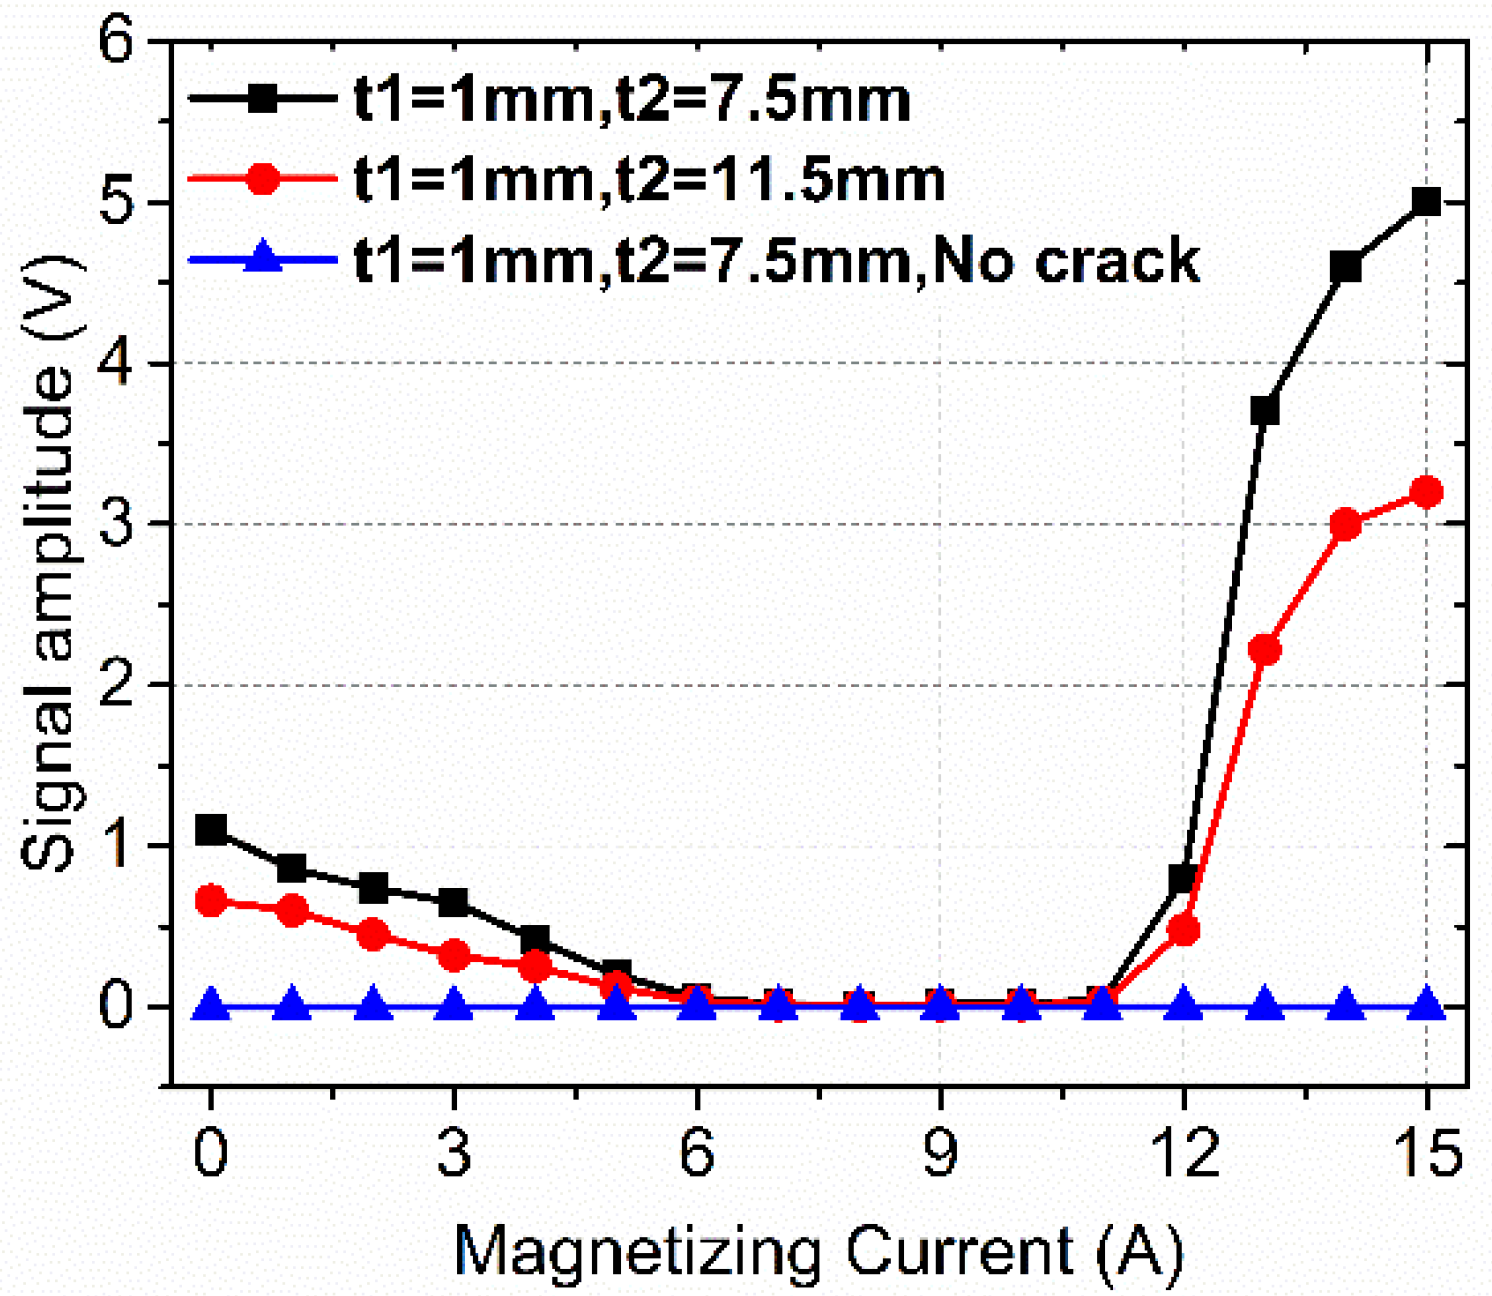
3.2. Verification via Experiments
4. Discussion
5. Conclusions
Author Contributions
Funding
Conflicts of Interest
References
- Bellanova, M.; Carboni, M.; Felicetti, R. NDT and E International A feasibility analysis on the application of eddy current testing to the detection of the most detrimental defects in historical metallic tie-rods ☆. NDT E Int. 2019, 104, 34–41. [Google Scholar] [CrossRef]
- Ricci, M.; Silipigni, G.; Ferrigno, L.; Laracca, M.; Adewale, I.D.; Tian, G.Y. Evaluation of the lift-off robustness of eddy current imaging techniques. NDT E Int. 2017, 85, 43–52. [Google Scholar] [CrossRef]
- Pasadas, D.J.; Ribeiro, A.L.; Rocha, T.; Ramos, H.G. 2D surface defect images applying Tikhonov regularized inversion and ECT. NDT E Int. 2016, 80, 48–57. [Google Scholar]
- Li, Y.; Yan, B.; Li, W.; Li, D. Thickness Assessment of Thermal Barrier Coatings of Aeroengine Blades Via Dual-Frequency Eddy Current Evaluation. IEEE Magn. Lett. 2017, 7, 1–5. [Google Scholar]
- Yusa, N.; Hashizume, H.; Urayama, R.; Uchimoto, T.; Takagi, T.; Sato, K. An arrayed uniform eddy current probe design for crack monitoring and sizing of surface breaking cracks with the aid of a computational inversion technique. NDT E Int. 2014, 61, 29–34. [Google Scholar] [CrossRef]
- Berthold, R.; Vaupel, O.; Förster, F. IX. Zerstörungsfreie Werkstoffprüfung; Springer: Berlin/Heidelberg, Germany, 1958. [Google Scholar]
- Bowler, J.R. Eddy-current interaction with an ideal crack. I. The forward problem. J. Appl. Phys. 1994, 75, 8128–8137. [Google Scholar]
- Miller, R.K. Nondestructive Testing Handbook; American Society for Nondestructive Testing: Columbus, OH, USA, 1982. [Google Scholar]
- Dodd, C.V.; Deeds, W.E. Analytical Solutions to Eddy-Current Probe-Coil Problems. J. Appl. Phys. 1968, 39, 2829–2838. [Google Scholar]
- Yang, G.; Dib, G.; Udpa, L.; Tamburrino, A.; Udpa, S.S. Rotating Field EC-GMR Sensor for Crack Detection at Fastener Site in Layered Structures. IEEE Sens. J. 2015, 15, 463–470. [Google Scholar]
- Rosado, L.S.; Cardoso, F.A.; Cardoso, S.; Ramos, P.M.; Freitas, P.P.; Piedade, M. Eddy currents testing probe with magneto-resistive sensors and differential measurement. Sens. Actuators A Phys. 2014, 212, 58–67. [Google Scholar]
- Ye, C.; Huang, Y.; Udpa, L.; Udpa, S.S. Differential Sensor Measurement With Rotating Current Excitation for Evaluating Multilayer Structures. IEEE Sens. J. 2016, 16, 782–789. [Google Scholar]
- Huang, H.; Sakurai, N.; Takagi, T.; Uchimoto, T. Design of an eddy-current array probe for crack sizing in steam generator tubes. NDT E Int. 2003, 36, 515–522. [Google Scholar]
- Chelabi, M.; Hacib, T.; Le Bihan, Y.; Ikhlef, N.; Boughedda, H.; Mekideche, M.R. Eddy current characterization of small cracks using least square support vector machine. J. Phys. D Appl. Phys. 2016, 49, 155303. [Google Scholar]
- Douvenot, R.; Lambert, M.; Lesselier, D. Adaptive Metamodels for Crack Characterization in Eddy-Current Testing. IEEE Trans. Magn. 2011, 47, 746–755. [Google Scholar]
- Boenisch, A. Partial Saturation Eddy Current Sensor Apparatus and Method of Use. U.S. Patent 921,301,8B2, 15 December 2015. [Google Scholar]
- Tada, T.; Suetsugu, H. Development of magnetic eddy current testing techniques. In AIP Conference Proceedings; AIP Publishing: Long Island, NY, USA, 2017; Volume 1806, p. 110021. [Google Scholar]
- Schenk, H.L., Jr.; Junker, W.R. Eddy Current Thickness Gauge with Constant Magnetic Bias. U.S. Patent 45,530,95A, 12 November 1985. [Google Scholar]
- ASTM International. ASTM E309-16; Standard Practice for Eddy Current Examination of Steel Tubular Products Using Magnetic Saturation; ASTM International: West Conshohocken, PA, USA, 2016. [Google Scholar]
- Atherton, D.L.; Czura, W.; Schmidt, T.R.; Sullivan, S.; Toal, C. Use of magnetically-saturated regions in remote field eddy current tools. J. Nondestruct. Eval. 1989, 8, 37–43. [Google Scholar]
- Kolyshkin, A.A.; Vaillancourt, R. Analytical solutions to eddy-current testing problems for a layered medium with varying properties. IEEE Trans. Magn. 1997, 33, 2473–2477. [Google Scholar]
- Jakubas, A.; Jaboński, P. Measurement and Evaluation of the Defect Size in Soft Magnetic Composites Using Magnetic Field Inspections. Energies 2021, 14, 2694. [Google Scholar]
- Edwards, C.; Palmer, S.B. The magnetic leakage field of surface-breaking cracks. J. Phys. D Appl. Phys. 1986, 19, 657. [Google Scholar]
- Zatsepin, N.N. Calculation of the Magnetostatic Field of Sueface Defects 1 & 2. Defectscopiya 1966, 5, 59–65. [Google Scholar]
- Sun, Y.; Kang, Y. Magnetic mechanisms of magnetic flux leakage nondestructive testing. Appl. Phys. Lett. 2013, 103, 184104. [Google Scholar]
- Jiles, D. Introduction to Magnetism and Magnetic Materials; CRC Press: Boca Raton, FL, USA, 2015; ISBN 1482238888. [Google Scholar]
- Wang, Z.D.; Gu, Y.; Wang, Y.S. A review of three magnetic NDT technologies. J. Magn. Magn. Mater. 2012, 324, 382–388. [Google Scholar] [CrossRef]
- Deng, Z.; Kang, Y.; Zhang, J.; Song, K. Multi-source effect in magnetizing-based eddy current testing sensor for surface crack in ferromagnetic materials. Sens. Actuators A Phys. 2018, 271, 24–36. [Google Scholar] [CrossRef]


Publisher’s Note: MDPI stays neutral with regard to jurisdictional claims in published maps and institutional affiliations. |
© 2022 by the authors. Licensee MDPI, Basel, Switzerland. This article is an open access article distributed under the terms and conditions of the Creative Commons Attribution (CC BY) license (https://creativecommons.org/licenses/by/4.0/).
Share and Cite
Deng, Z.; Yu, Z.; Yuan, Z.; Song, X.; Kang, Y. Mechanism of Magnetic Permeability Perturbation in Magnetizing-Based Eddy Current Nondestructive Testing. Sensors 2022, 22, 2503. https://doi.org/10.3390/s22072503
Deng Z, Yu Z, Yuan Z, Song X, Kang Y. Mechanism of Magnetic Permeability Perturbation in Magnetizing-Based Eddy Current Nondestructive Testing. Sensors. 2022; 22(7):2503. https://doi.org/10.3390/s22072503
Chicago/Turabian StyleDeng, Zhiyang, Zhiheng Yu, Zhongyu Yuan, Xiaochun Song, and Yihua Kang. 2022. "Mechanism of Magnetic Permeability Perturbation in Magnetizing-Based Eddy Current Nondestructive Testing" Sensors 22, no. 7: 2503. https://doi.org/10.3390/s22072503