Article

Analysis of the Effect of Tillage Depth on the Working Performance of Tractor-Moldboard Plow System under Various Field Environments

1
Smart Agricultural R&D Group, Korea Institute of Industrial Technology (KITECH), Gimje 54325, Korea
2
Department of Smart Agriculture Systems, Chungnam National University, Daejeon 34134, Korea
3
Department of Bio-Industrial Machinery Engineering, Kyungpook National University, Daegu 41566, Korea
4
Agricultural Machinery Certification Team, Foundation of Agricultural Technology Commercialization and Transfer (FACT), Iksan 54667, Korea
5
Department of Biosystems Machinery Engineering, Chungnam National University, Daejeon 34134, Korea
*
Author to whom correspondence should be addressed.
Sensors 2022, 22(7), 2750; https://doi.org/10.3390/s22072750
Submission received: 4 March 2022 / Revised: 28 March 2022 / Accepted: 31 March 2022 / Published: 2 April 2022
(This article belongs to the Section Smart Agriculture)

Abstract

:
The purpose of this study was to analyze the tillage depth effect on the tractor-moldboard plow systems in various soil environments and tillage depths using a field load measurement system. A field load measurement system can measure the engine load, draft force, travel speed, wheel axle load, and tillage depth in real-time. In addition, measurement tests of soil properties in the soil layer were preceded to analyze the effect of field environments. The presented results show that moldboard plow at the same tillage depth had a wide range of influences on the tractor’s working load and performance under various environments. As the draft force due to soil–tool interaction occurred in the range of 5.6–17.7 kN depending on the field environment, the overall mean engine torque and rear axle torque were up to 2.14 times and 1.67 times higher in hard and clayey soil, respectively, than in soft soil environments. In addition, the results showed tractive efficiency of 0.56–0.73 and were analyzed to have a lugging ability of 67.8% with a 44% maximum torque rise. The engine power requirement in hardpan was similar within 3.6–9.6%, but the power demand of the rear axle differed by up to 18.4%.

1. Introduction

Static or dynamic mechanical loads are physical stresses on a mechanical system or component. Some mechanical loads are utilized as design loads for mechanical systems [1]. To design agricultural machinery such as a tractor or determine an appropriate power source, it is important to predict the required power and load characteristics of each major power transmission unit [2]. Therefore, measuring mechanical loads in the laboratory or the field using appropriate test methods is essential for optimal design and performance evaluation. In particular, agricultural tractors operate in unstructured working environments, unlike commercial vehicles; thus, it is essential to secure load data in consideration of various agricultural working environments.
The working load of the agricultural tractor occurs according to the soil resistance caused by the soil–tool interaction during tillage operation. This means that the soil property distribution according to the soil layer and tillage depth [3,4,5] are the fundamental key factors that have the greatest influence on the working performance and mechanical load of agricultural tractors. Previous studies on tractor load have been mainly conducted based on the prediction and analysis of tillage force. The tillage force is the force required to pull the attached implement in the direction of tillage of the tractor and is mainly affected by the travel speed (i.e., transmission gear selection), implement geometry, tillage depth, and soil environments (e.g., soil texture, soil properties, water content). Most tillage implements manufacturers research to improve geometry to reduce tillage resistance, fuel consumption, and wear during tillage operations. The topics of energy conversion and mechanical efficiency during tillage operations are very important, as tractor manufacturers focus on designing the reliability of the power transmission caused by high tillage forces and providing adequate power to overcome tillage resistance. Therefore, it has been largely divided into implement-dependent and tractor-dependent load studies.
Various studies using classical theoretical formulas or tillage force measurement systems have been conducted to study the perspective of tillage implement-dependent loads, which means the design parameters and operating conditions of the attached implement. In some studies, soil bin experiments were conducted to evaluate the design parameters (e.g., tine spacing, rake angle, tillage width, surface treatment) and operation conditions (e.g., tillage depth, gang angle) of the tillage implement on tillage force and working performance [6,7,8,9,10,11,12,13,14]. In another study, an experimental study was conducted to develop a specific draft estimation model for offset disc harrows in a soil bin test environment [15]. In another study, a classical draft force prediction model was developed for disk plows [16].
On the other hand, vehicle-dependent load studies on the effect of tractor driving conditions such as operation type, transmission gear selection, and tillage depth on the required force and power have been mainly conducted through field tests. Basically, the study of the mechanical load through field tests performed dynamic load analysis in terms of the tractor power depending on the agricultural operation type or gear selection [17,18]. Lee [19] analyzed the PTO (power take-off) shaft load of a 75 kW agricultural tractor in rotary tillage and baler operation. Their results showed that a sharp increase in shaft torque due to PTO gear selection or an increase in the rotational speed of the PTO shaft increased the damage of the PTO shaft by 1.45 to 2.31 times. In other studies, the effect of gear selection was analyzed during deep tillage or rotary tillage operations on the mechanical load and fuel efficiency of the transmission and PTO input shaft [20,21]. It was confirmed that the mechanical load on the transmission and PTO input shaft increased by 19.47 to 22.97 times depending on the gear selection during rotary operation and that the fuel consumption during deep tillage increased by up to 2.15 times. In another study, Kim [22] analyzed the effect of gear selection and soil water contents on the mechanical load of a 78 kW agricultural tractor during moldboard plowing. The test site was divided into 3 m sizes, and the water contents were measured in all sections. Then, the mechanical load data measured by matching with the plowing section were classified and analyzed according to the water contents. As a result of field test data analysis, the lower the water content was, the higher the engine power and fuel efficiency. Research on the development of an embedded digital draft force, slip, and wheel torque indicator system was conducted to measure the wheel axle load used in the design of the tractor, as well as the tillage force required for using the tillage implement and the engine power requirement for power source selection [23,24]. In some studies, performance evaluation studies were conducted through field tests in various working environments. Vidas [25] analyzed the efficiency of disc harrow adjustment for stubble tillage quality and fuel consumption, considering exchangeable parameters such as travel speed, disc angle, and tillage depth. In another study, Balsari [26] conducted a performance evaluation of a tractor-power harrow system under different working conditions focused on PTO torque and draft force.
Although some studies have been conducted on the load according to the tractor driving conditions at the same test site [27,28], studies on how the soil environment with different characteristics in terms of soil depth distribution affects the load and performance of the tractor during tillage work have not been conducted. In addition, it is not clear to what extent the tillage depth and soil characteristics depend on the use of a specific tractor. The research reproducibility is low, making it difficult to design load. Therefore, if the effect of the working environments on the tractor performance becomes clear through this study, it will be useful information for studies related to the reliability of agricultural machinery, such as axle load prediction [29] and component life evaluation [30], and the tillage performance of the attached implement can be analyzed at the same time.
This study presents the results of an extensive experimental analysis planned to investigate the relationship between tractor performance and working environments by tillage depth during moldboard plow. This study aimed to analyze the tillage depth effect on the performance of tractor-moldboard systems under various working environments by tillage depth. The specific objectives of this study were to: (1) analyze the working environment by focusing on the soil properties based on depth distribution; (2) develop a field load measurement system and measure the load parameters during tillage operation, and; (3) analyze the tillage depth effect on the working load and performance evaluation (e.g., power transmission efficiency, traction performance, and lugging ability) of agricultural tractors.

2. Materials and Methods

2.1. Tractor-Implement System

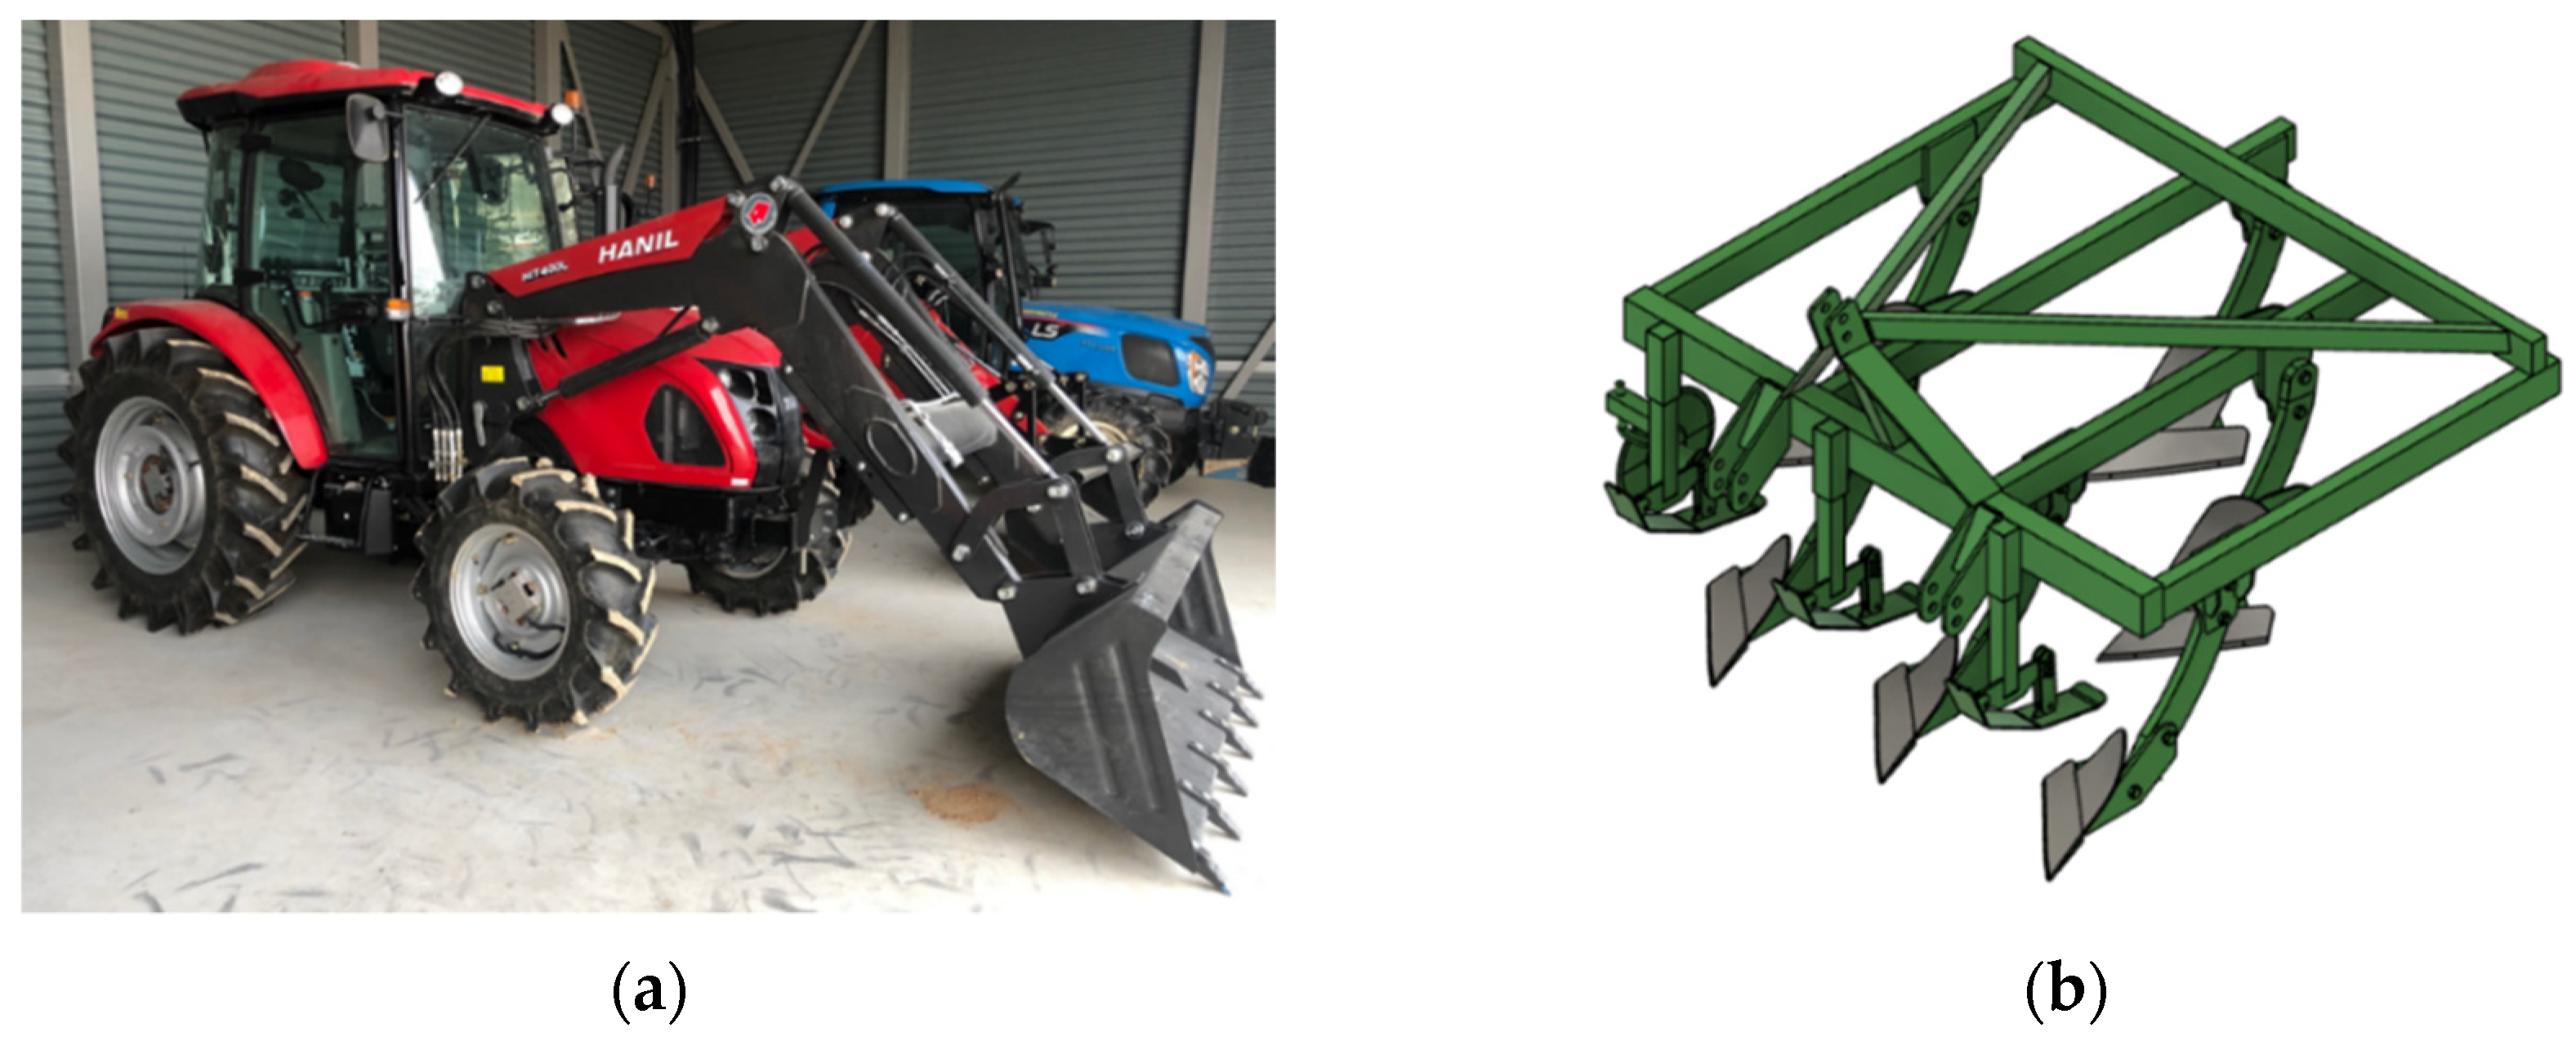
A 4WD type 42 kW class agricultural tractor (TX58, Tong Yang Moolsan, Gongju, Korea) that conforms to the OECD standard was used in the field experiments with a rated power of 35.6 kW and a maximum torque of 211.8 Nm, as shown in Figure 1a. The tractor’s empty vehicle weight was 2615 kg, but the total weight, including the attached data acquisition system (229 kg) in the cabin, a tillage force measurement system (310 kg), and a front loader (450 kg) (HIT400 L, Hanil Industry Co, Ltd., Gyeongsan, Korea), was 3894 kg. The overall dimensions of the agricultural tractor body were 3695 mm × 1848 mm × 2560 mm (length × width × height). The agricultural tractor used for the field experiment was equipped with a mechanical transmission power shuttle. In addition, the tractor can shift a total of 48 gear selections (24 forwards and 24 reverses) according to tillage operation through a combination of 4 main and 6 sub gear stages, and the maximum speed is 33.8 km/h. The specifications of the agricultural tractor are shown in Table 1.
Figure 1b shows a 6-row moldboard plow (WJSP-6S, Woongjin Machinery, Gimje, Korea), often used in soil-machine interactions studies. Moldboard plows are a high-load operation compared to other agricultural operations; thus, they are suitable for soil–tool interaction studies of agricultural machinery. The moldboard plow has a maximum tillage depth of 20 cm, and the dimensions are 1930 × 1800 mm × 1235 mm (length × width × height). The detailed specifications of the attachment implement are shown in Table 2.

2.2. Field Load Measurement System

Figure 2 shows the overall configuration of the field load measurement system developed for field experiments and the installation location of each measurement part. The data acquisition system used Dewesoft X (Dewesoft 3X, Dewesoft, Trbovlje, Slovenia) to synchronize and extract field measurement data at a sampling rate of 1000 Hz. The field load measurement system provided for the study the effect of soil working environment on the load of an agricultural tractor during moldboard plow, and consisted of an engine part (e.g., engine torque, engine speed, fuel consumption), wheel axle part (e.g., wheel axle torque, wheel axle rotational speed), a draft force measurement system, a tillage depth measurement system, and a real-time kinematic global positioning system (RTK-GPS) (Duro Inertial, Swift Navigation, San Francisco, CA, USA) for measuring travel speed of moldboard plow. The detailed specifications of the sensors constituting the field load measurement system are shown in Table 3.
Slip ratio can be obtained using the following equations.
V th = π D wr N wr GR 3.6 60 ,
S = ( V th V a V th ) 100 ,
where V th is the theoretical speed of the tractor in the working direction (km/h), D wr is the diameter of the rear wheel axle (m), N wr is the wheel axle rotational speed as calculated by proximity sensors (rpm), GR is the gear ratio, S is the slip ratio (%), and V a is the travel speed of the tractor measured by RKT-GPS (km/h).
To measure the load data more accurately compared to previous studies that performed field tests using only CAN communication, the engine load measurement part consisted of a torque transducer and flowmeter for the direct measurement of engine torque ( T e ) and fuel consumption (FC). To measure engine torque, a 5 kNm strain gauge-type torque transducer was installed on the flexplate, and torque data were measured by contactless sensor telemetry through an amplifier. The engine rotation speed ( N e ) was measured by wireless controller area network (CAN) communication. In addition, the lugging ability of a tractor refers to the ability of the engine to overcome a sudden large load during tillage operation without easily stopping it. This is a major performance indicator of how much load is generated and can be overcome in various working environments in the tractor-implement system [2]. Lugging ability-related parameters can be obtained as follows.
P e = 2 π T e N e 60000 ,
where P e is the power requirement of the engine (kW), T e is the engine torque (Nm) measured by the flex plate torque transducer, and N e is the engine speed (rpm) measured by controller area network (CAN) communication.
η = P e P r × 100 ,
δ = N e N r × 100 ,
μ = D n D r D r × 100 ,
where η is the engine power ratio (%), P r is the rated engine power (kW), δ is the engine speed ratio (%), N r is the rated engine speed (rpm), μ is the lugging ability (%), D n is the draft force at engine speed ‘n’ (kN), and D r is the draft force at rated engine speed (kN).
Fuel consumption (OG2-SS5-VHQ-B, Titan Enterprises, Sherborne, UK) was measured by installing an oval gear flowmeter at the engine fuel injection inlet and outlet. Specific fuel consumption (SFC), which is mainly used for performance indicators of fuel consumption, can be obtained from the following equations. The fuel cost was also calculated through a literature study [21].
FC = 60 ( F in F out ) 0.83 ,
SFC = FC P e ,
PR = TS × WW 10 ,
Fuel   cos t = FC × 1 PR × FP ,
where FC is the fuel consumption of the engine (kg/h), F in is the flow rate (L/min) measured by the flow meter installed on the fuel inlet of the engine, F out is the flow rate (L/min) measured by the flow meter installed on the fuel outlet of the engine, SFC is the specific fuel consumption (g/kWh), PR is the productivity rate (ha/h), TS is the travel speed measured by RTK-GPS (km/h), WW is the working width (m), fuel cost ($/ha), and FP is the fuel price (1.23 $/L).
The wheel axle load (wheel axle torque and rotational speed) measurement part consisted of a flange-type torque transducer (PCM16, MANNER, Spaichingen, Germany) and a proximity sensor (CYGTS211B-PO2, Chen Yang Technologies GmbH & Co. KG, Finsing, Germany). A torque transducer, proximity sensor, and antenna with an integrated amplifier were installed inside and outside each wheel axle shaft to measure the wheel axle load. The wheel axle torque data from each torque transducer were amplified by internal amplifiers and transmitted wirelessly to a stationary antenna. A tooth profile of a helical gear or spur gear and a tooth thickness of 3 mm or more is required to measure the wheel axle rotational speed.
P w = 2 π T w N w 60000 ,
where P w is the power requirement of the wheel axle (kW), T w is the wheel axle torque (Nm) measured by the wheel torque meter, and N w is the wheel axle rotational speed (rpm) measured by the proximity sensor.
The tillage force measurement system was configured to measure draft force by using 6 tensile compression-type universal load cells (SBA-2T, CAS, Yangju, Korea) on a triangular jig. It was located between the link for attaching the rear of the tractor and the implement [31,32]. The equation for calculating the draft force from the measured values obtained from the load cell attached to the tillage force measurement system is as follows.
D = F a + F b + F c ,
where D is the draft force, which is the sum of the forces applied to the system in the horizontal direction (kN), and F a , F b , and F c are the measured forces at the load cell for each attachment position depicted.
In addition, drawbar power and tractive efficiency were analyzed to evaluate traction performance, which is a major performance indicator of the tractor as follows.
P db = D × V a 3 ,
TE = P db P w × 100 ,
where P db is the drawbar power (kg/h) and TE is the tractive efficiency(%).
To analyze the effect of tillage depth in studies related to tractor tillage operation, the work is generally performed after fixing the hitch height at the target tillage depth. However, since the soil in agricultural fields is irregular and bumpy, a precise real-time tillage measurement system is required. The tillage depth measurement system consisted of an inclinometer (IS2MA090-U-BL, GEMACsensors, Chemnitz, Germany) for measuring the vertical penetration depth of the implement during tillage operation. The inclinometer attached to the lower link of the depth measurement system was used to measure the angle of the lower link according to the vertical penetration depth that occurs when the attached implement penetrates the soil. In the case of a change in the angle of inclination due to the occurrence of tillage depth, the measured angle of the lower link was drastically reduced compared to the initial angle θ 1 at zero tillage depth. The tillage depth was obtained using the following equation [27]:
d = L L sin θ 1 L L sin θ 2 ,
where d is the tillage depth, L L is the length of the lower link of the tillage depth measurement system (m), θ 1 is the initial angle of the lower link measured using the inclination sensor when the tillage depth is zero (deg), and θ 2 is the angle of the lower link measured when the tillage depth occurs (deg).

2.3. Experimental Design

In the soil measurement process, soil properties were measured using the uniform grid sampling method [33]. To consider the change in soil properties distributed according to the target tillage depth, each test site was divided into a uniform grid with 5–10 measurement points. In addition, 1 measurement point was divided into 4 soil layers of a 50 mm deep layer (SL1: 0–50 mm, SL2: 50–100 mm, SL3: 100–150 mm, and SL4: 150–200 mm), as shown in Figure 3. Soil properties measured through field measurements were bulk density ( γ ), water content (WC), porosity (ƞ), cone index (CI), shear strength ( τ f ), and Atterberg limits (i.e., plastic index, plastic limits, liquid limits).
First, the soil sampling was performed using a 100 mL stainless steel tube (51 mm in diameter and 50 mm in height) (DIK-1801, Daiki Rika Kogyo Co., Ltd., Akagidai, Japan) and a soil sampling apparatus (DIK-1815, Daiki Rika Kogyo Co., Ltd., Akagidai, Japan). Bulk density was obtained by measuring the weight of 100 mL of sampled soil with an electronic scale (EK-610i, AND, Seoul, Korea). In addition, soil samples weighed for bulk density measurement were then measured for porosity with volume fraction using an actual volumenometer (DIK-1150, Daiki Rika Kogyo Co., Ltd., Akagidai, Japan). Afterward, the sampled soil specimen was dried at a temperature of 110 °C for 24 h using the oven drying method for measuring the water content [34] using an experimental oven (SH-DO-100FGB, Samheung Energy, Sejong, Korea). The dried soil was analyzed for soil texture (i.e., particle size distribution) by the USDA method [35] through sieve analysis using a sieve shaker (HJ-4560, Heungjin, Gimpo, Korea) [36]. To determine the plastic index, which indicated the level of compression and stickiness in the soil environment [37], the Atterberg limits test was performed to obtain the plastic index using an electric liquid-limit tester (HJ-4105, Heungjin, Gimpo, Korea) [38]. To measure the cone index and shear strength, a cone penetration test and shear vane test were performed using a cone penetrometer (DIK-5532, Daiki Rika Kogyo Co., Ltd., Akagidai, Japan) [39,40] and shear ring-type soil resistance meter (DIK-5503, Daiki Rika Kogyo Co., Ltd., Saitama, Japan).
To analyze the effect of the soil working environment on the load and working performance of agricultural tractors, field experiments were conducted in 3 different agricultural field environments (First test site: 36°22′01.7″ N and 127°21′18.6″ E, second test site: 37°00′42.7″ N and 126°21′18.5″ E, third test site: 37°56′11.3″ N and 127°46′58.2″ E). Before performing tillage using a measuring tractor equipped with a field load measurement system, soil property measurement tests were performed. Moreover, field experiments were performed based on the 3 × 3 split-plot design under 3 test conditions and 3 tillage depths (12, 16, and 20 cm). Since the field load measurement system used in this study can measure the tillage depth in real-time, it does not prevent the vertical movement of the 3-point hitch from performing it at the target tillage depth reported in prior related studies. Instead, the 3-point hitch was controlled to perform the tillage operation at a target tillage depth range of 12–20 cm. To analyze the effect of tillage depth and soil properties, the results of the field measurement data were arranged in ascending order according to tillage depth. The measured field test data irregularities were removed using the group frequency distribution method to clearly analyze the influence of soil properties according to 3 tillage depth levels on load-related parameters. During moldboard plowing, the agricultural tractor selected an M3 gear with a theoretical speed of 7.9 km/h on a straight working path and operated in 4-wheel-drive mode under full-throttle, not at rated engine speed.
In addition, to analyze the tractor load under the no-load condition as a basic comparison group, the driving load in the same gear selection was additionally measured at the paddy field. Performance evaluation of tractor-tillage implement systems was generally performed through analysis of power transmission efficiency (PTE), tractive efficiency (TE), and lugging ability with torque rise [2]. Therefore, the performance evaluation of the tractor-implement system was performed by analyzing the load data measured in various working environments and tillage depths.

3. Results and Discussion

3.1. Soil Collection Data Analysis

The specific overall measurement results of the soil properties according to the soil layer are shown in Table 4, Table 5 and Table 6. As a result of soil texture analysis for each field, the first test site was analyzed with sandy loam (sand 68%, silt 20%, clay 12%), the second test site was analyzed with loam (40% sand, 48% silt, 12% clay), and the third test site was analyzed with clay loam (40% sand, 28% silt, 32% clay). Bulk density showed 1544–1800 kg / m 3 , 1519–1898 kg / m 3 , and 1899–2021 kg / m 3 analysis results in sandy loam, loam, and clay loam fields, respectively. The bulk density results were generally higher than the range of 1200–1500 kg / m 3 , which was the bulk density value reported in previous studies performed on soil bins [41,42,43] and showed similar values to the range of 1500–2100 kg / m 3 reported in studies using actual field experiments [27,44]. Porosity was 0.47–0.53, 0.41–0.54, and 0.34–0.39 in sandy loam, loam, clay loam fields, respectively, and it was confirmed that as the soil layer deepened, it decreased up to 24.1% compared to the topsoil. In addition, the water content showed values of 15.5–19.4%, 24.5–32.2%, and 20.2–26.5% in sandy loam, loam, and clay loam fields, respectively. In general, the deeper the soil layer was, the lower the water content compared to topsoil due to high soil compaction and low porosity. Loam field has dry conditions with high porosity, and the moisture content increases as the soil layer deepens, showing an opposite trend to loam and clay loam test sites. For the Atterberg limits test for relative evaluation of compressible and stickiness characteristics of test sites, the plastic index results were 6.89 (15.19% plastic limits, 22.08% liquid limits), 13.49 (21.1% plastic limits, 34.59% liquid limits), and 13.95 (18.99% plastic limits, 32.94% liquid limits) in sandy loam, loam, and clay loam fields, respectively. Sandy loam field was analyzed as having partly cohesive characteristics, and loam and clay loam fields were analyzed as having relatively high cohesive characteristics [37].
The cone index results showed ranges of 560.4–897.3 kPa, 471.2–1798.1 kPa, and 680.8–1915.5 kPa in sandy loam, loam, and clay loam, respectively. Although the average cone index value was different for each field, it was confirmed that a hardpan was formed at a depth of SL3–SL4 (10–20 cm) in all test sites. In particular, in the case of loam and clay loam, it was confirmed that the average cone index in SL3–SL4 compared to SL1–SL2 corresponding to the plow layer increased rapidly by 2.8–3.8 times. Additionally, the shear strength showed ranges of 23.8–41.4 kN / m 2 , 23.9–78.4 kN / m 2 , and 64.8–87.7 kN / m 2 in sandy loam, loam, and clay loam, respectively.

3.2. Driving Load Analysis

Figure 4 shows the measurement result of the driving load under no-load conditions. During straight path driving, the average driving speed under the no-load condition was 7.87 km/h with a slip ratio of 2%. In the case of the engine load, the average engine torque of the tractor was 22.8 Nm, the average engine speed was 2290 rpm, and approximately 5.5 kW of engine power was used (15.4% engine power ratio), with an average fuel consumption of 5.73 kg/h. In the case of the wheel axle load, the power requirement for the front axle was 2.6 kW (wheel axle torque of 553.1 Nm, wheel axle speed of 44.5 rpm), and the power requirement for the rear axle was 1.4 kW (wheel axle torque of 444.4 Nm, wheel axle speed of 29.8 rpm). The front wheel axle load tends to be higher than the rear wheel axle load because a weighed ballast or a front loader is attached to the front of the tractor to prevent problems such as overturning due to the effect of the pitch angle by load transfer.

3.3. Working Load Analysis

3.3.1. Tillage Depth and Travel Speed

The tillage depth and travel speed results during moldboard plowing are shown in Figure 5a. The overall mean tillage depths of each test field were 17.5 ± 2.8 cm in sandy loam, 16.3 ± 3.1 cm in loam, and 15.2 ± 3.6 cm in clay loam. As a result of the measurement data analysis, it was confirmed that the tillage depth was properly carried out in the hardpan range based on cone penetration test results (12–20 cm). In the case of the travel speed, the overall mean travel speed of each test field was 6.9 ± 0.1 km/h (6.8–7.1 km/h) in sandy loam, 6.2 ± 0.5 km/h (5.5–6.9 km/h) in loam, and 4.8 ± 0.4 km/h (4.1–5.6 km/h) in clay loam. Based on these results, it was confirmed that the travel speed decreased in the range of 12.7–39.2% from the theoretical speed of 7.9 km/h in M3 gear selection due to the influence of soil properties at a tillage depth of 20 cm. It was confirmed that the travel speed result at a tillage depth of 20 cm of clay loam was reduced by 0.57 times compared to that of sandy loam at a tillage depth of 12 cm, as shown in Figure 5b.

3.3.2. Draft Force

The results of draft force according to tillage depth and test sites are shown in Figure 6a. The overall mean draft force in each test field was 8.1 ± 1.4 kN (5.6–9.5 kN) in sandy loam, 10.1 ± 2.5 kN (6.4–13 kN) in loam and 13.9 ± 2.5 kN (10.4–17.7 kN) in clay loam. Compared to sandy loam, loam and clay loam showed 1.24 times and 1.71 times higher overall mean draft forces in the hardpan section. This confirms that various working environments were highly affected by the draft force according to tillage depth. As shown in Figure 6b, it was confirmed that the result at a tillage depth of 20 cm of clay loam increased rapidly by 2.89 times compared to that of sandy loam at a tillage depth of 12 cm.

3.3.3. Engine Load with Fuel Consumption

The engine load and fuel consumption results are shown in Figure 7a. The overall mean engine torque in the tillage depth section of 12–20 cm was 139.5 ± 18.4 Nm (105.5–155.3 Nm), 165.1 ± 24.3 Nm (124.9–192.5 Nm), and 201.5 ± 16.3 Nm (167.4–225.9 Nm) in sandy loam, loam, and clay loam, respectively. As shown in Figure 7b, the engine torque increased up to 2.14 times compared to that of sandy loam at a tillage depth of 12 cm. The engine torque increased up to 2.14 times compared to that of sandy loam at a tillage depth of 12 cm. The engine speed showed a tendency to decrease rapidly as the tillage depth increased. The smallest reduction in engine speed was from 2236.2 rpm to 2176 rpm in sandy loam (up to a 1.1% reduction compared to the rated engine speed). In the case of loam, the engine speed decreased from 2213.9 rpm to 1902.7 rpm (up to 13.6% reduction compared to the rated engine speed). The maximum engine speed decreased from 2024.9 rpm to 1668.3 rpm in clay loam (up to 25.4% reduction compared to the rated engine speed).
In general, the literature related to fuel consumption in agricultural machinery mainly performed a comparative analysis of fuel consumption according to the load ratio obtained from CAN data or tillage force generated under different driving test design conditions in the same test field [21,45,46]. In this study, fuel consumption analysis was performed considering the tractor’s working load, such as engine torque and wheel axle torque, and tillage force and tillage depth measured in real-time in various field environments. The overall mean fuel consumption was 9.8 ± 0.6 kg/h (8.5–10.2 kg/h), 10.1 ± 0.2 kg/h (9.8–10.3 kg/h), and 9.5 ± 0.3 kg/h (8.9–9.7 kg/h) in sandy loam, loam, and clay loam, respectively. In loam and clay loam fields, as the depth of the tillage increases, the fuel consumption decreases, but in the case of sandy loam, the average fuel consumption increases. This is lower than the rated engine speed of loam and clay loam, and it is judged to be affected by engine speed higher than the rated engine speed in sandy loam, which is a relatively soft soil environment.

3.3.4. Wheel Axle Load with Slip Ratio

The wheel axle load and slip ratio results are shown in Figure 8. The overall mean front wheel axle torque in the tillage depth section of 12–20 cm was 1297.7 ± 129.3 Nm (1085.6–1448.4 Nm), 1461.9 ± 164.5 Nm (1224.4–1662.3 Nm), and 1373.1 ± 61.1 Nm (1246.3–1453.2 Nm) in sandy loam, loam, and clay loam, respectively. In the case of the front-wheel axle torque, the average torques of loam and clay loam were almost similar. The overall mean front wheel speeds in the tillage depth section of 12–20 cm were 42.6 ± 0.4 rpm (42.1–43.5 rpm), 39.8 ± 2.4 rpm (35.8–43 rpm), and 34.6 ± 1.9 rpm (31.3–38.1 rpm) in sandy loam, loam, and clay loam, respectively. The wheel axle rotational speed was affected by the decrease in engine speed, so when the tillage depth increased from 12 to 20 cm, it decreased up to 4.3%, 10.4%, and 22.3% at sandy loam, loam, and clay loam, respectively, compared to the wheel speed under driving load conditions.
In the case of the rear wheel axle load, the overall mean rear wheel axle torque in the tillage depth section of 12–20 cm was 2649 ± 435 Nm (1872.2–3075.4 Nm), 3256.2 ± 681.5 Nm (2277.3–4033 Nm), and 4442.8 ± 875.4 Nm (3206.1–5815.9 Nm) at sandy loam, loam, and clay loam, respectively. Although most engine torque is generated within the maximum torque point on the engine performance curve, the rear axle torque tends to increase rapidly without limitation. In particular, loam and clay loam were 1.22, 1.67 times higher than the overall average rear wheel axle torque of sandy loam. As seen from Figure 9a, the rear wheel axle torque, which is most importantly utilized as the tractor design load, increased by an average of 3.1 times in clay loam compared to sandy loam, depending on the field environment and tillage depth. The overall mean rear wheel speeds in the tillage depth section of 12–20 cm were 28.5 ± 0.2 rpm (28.3–29.3 rpm), 26.7 ± 1.6 rpm (24.7–28.8 rpm), and 23.1 ± 1.3 rpm (21.1–25.5 rpm) in sandy loam, loam, and clay loam, respectively.
In addition, the overall mean slip ratios of each test field were 9.5 ± 0.5% (8.5–10%) in sandy loam, 13.4 ± 2.4% (10.1–16.7%) in loam, and 22.3 ± 3.8% (18.1–28%) in clay loam. The overall average slip ratios of loam and clay loam were 1.41 times and 2.34 times higher than those of sandy loam, respectively. As shown in Figure 9b, the mean slip ratio of up to 1.92–3.2 times higher occurred in loam and clay loam compared to that of sandy loam at a tillage depth of 12 cm, which had the lowest average slip ratio. Normally, traction of off-road machinery is defined as the ability of the vehicle’s wheel to develop efficient soil thrust force to overcome resistance force (e.g., draft force) [47,48]. In other words, the higher the soil resistance, the lower the traction force and the higher the slip ratio. From the test results, it is judged that a higher draft force occurred in clay loam, resulting in a higher slip ratio than in sandy loam and loam.

3.4. Performance Evaluation of Agricultural Tractor

3.4.1. Traction Performance

Depending on the field environment conditions, the traction performance was basically affected by the average 2.3 times increase in the slip ratio occurrence range. As shown in Figure 10, the overall mean tractive efficiency in the tillage depth section of 12–20 cm was 0.7 ± 0.02 (0.65–0.73), 0.68 ± 0.04 (0.61–0.74), and 0.61 ± 0.03 (0.56–0.66) in sandy loam, loam, and clay loam, respectively. As soil hardness and compaction increased over sandy loam to clay loam, it was confirmed that the average tractive efficiency decreased by an average of 12.9% and a maximum of 23.3%. Compared with the results of previous studies of slip-based traction performance curves [49], it was confirmed that the maximum tractive efficiency occurred at a slip ratio of 10%, and the overall data trend was that the tractive efficiency decreased as the slip ratio increased.

3.4.2. Lugging Ability with Torque Rise

Figure 11 shows the distribution of the measured working load parameters according to engine rpm on the engine performance curve calibrated by KOAT (Korea Agriculture Technology Promotion Agency) in various working environments and target tillage depths (12–20 cm).
The maximum torque of the tractor engine used in this study was 211.8 Nm at 1600 rpm. The engine torque was measured in the ranges of 50–73.6%, 59.1–91.2%, and 50–107% compared to the maximum engine torque at sandy loam, loam, and clay loam, respectively. Therefore, when a maximum draft force of 17.7 kN occurs under certain soil property conditions at the clay loam using a 6-row moldboard plow, it was determined that there was a 67.8% lugging ability that enables continuous operation even when the engine torque increase rate was increased to a maximum of 44% compared to the engine rated torque of 140 Nm at 2200 rpm, as shown in Figure 12.

3.4.3. Power Transmission Efficiency

The power transmission efficiency of the 42 kW agricultural tractor according to tillage depth and test sites is shown in Table 7. The overall mean engine power requirements were 24.6–34.8 kW, 28.9–38 kW, and 34.9–39.4 kW, ranging from 58.8–82.8%, 68.8–90.4%, and 83–93.8%, respectively, compared to the engine maximum capacity of 42 kW. Except for the 12 cm shallow tillage depth section of sandy loam, which is soft and weak, it was confirmed that more than 80% of the maximum engine power was used in most sections, including the hardpan layer (16–20 cm). In the case of the rear wheel axle, the overall mean power requirements were 11.4–17.8 kW, 13.7–20.9 kW, and 17–25.6 kW, which ranged from 46.3 to 51.1%, 47.4 to 55%, and 48.7 to 64.9, respectively, compared to the engine power requirements. In the case of the front wheel axle, the overall mean power requirements were 9.8–12.8 kW, 11–12.7 kW, and 8.7–10.2 kW, which ranged from 35.7 to 39.8%, 32.9 to 38%, and 22 to 28, respectively, compared to the engine power requirements. Overall, the power required for the front axle was in a similar range, and the lowest front axle power transmission efficiency was shown in the clay loam condition. It was found that it was affected by the rapid load transfer to the rear axle by the high draft force in clay loam. The average engine power requirement in the 16–20 cm tillage depth section in sandy loam and clay loam showed only a difference of 11.6%, but it was confirmed that the required power of the rear wheel axle was up to 30.5%. This means that it is difficult to predict the exact wheel axle load and required power only by analyzing the engine load. There is little difference in different field environments in the front wheel axle, but in the case of the rear wheel axle, the axle torque and slip must be considered according to the tillage depth. In particular, when the plasticity index is high, such as in loam and clay loam, the cohesive force is very high. The tillage force is significantly different depending on the tillage depth when the hardpan is clearly formed [50]. Therefore, analysis of soil characteristics according to soil depth is essential.
The fuel efficiency of the 42 kW agricultural tractor according to tillage depth and test sites is shown in Table 8. In the engine performance curve, when the engine speed is lower than the maximum power point, the power requirement decreases, but the power requirement tends to gradually increase due to the occurrence of over torque due to the high slip ratio. Eventually, a high-power requirement occurs under fuel consumption conditions at low engine speeds, resulting in very low specific fuel consumption. In addition, in the hardest and most viscous soil environment, in clay loam, the productivity rate decreased by up to 42.7% compared to sandy loam, depending on the working depth, and it was determined that 1.81 times higher fuel cost was required. In general, it has been reported that in order to obtain maximum fuel efficiency during tillage operation, it is required that the work be performed under the conditions of using the high torque ranges in the appropriate slip range [51]. Therefore, it was analyzed that the conditions of the 8–16% slip ratio range [52] and the highest engine torque range reported as the appropriate slip ratio of the cultivated field were satisfied when the tillage was performed with a tillage depth of 16–20 cm in the loam. In the case of sandy loam, the slip ratio was ideal at about 10%, but the soil resistance was very low, resulting in little engine load. On the contrary, in the case of clay loam, a large engine load occurred, but an excessive slip ratio of 16% or more occurred.

4. Conclusions

This study confirmed that even if tillage operation was performed at the same tillage depth, it affected a various range of tractor working loads and working performances according to different working environments. The major findings are as follows.
  • The bulk density, cone index, and shear strength were increased by 1.25 times, 1.44–2.17 times, and 1.62–2.72 times, respectively, according to the field environment in the same soil layer. In addition, porosity decreased up to 0.73 times according to the field environment in the same soil layer. In particular, in the case of loam and clay loam, where the hardpan layer was distributed, it showed a tendency to change rapidly from a soil depth of approximately 12–13 cm. Therefore, the soil physical properties according to the target tillage depth should be considered the top priority in the performance evaluation process or field monitoring of agricultural machinery.
  • As a result of the field test, the travel speed decreased by 12.7–39.2%, and the slip ratio increased by up to 3.2 times according to tillage depth. Overall engine torque was up to 2.14 times higher in average engine torque in hard and cohesive soil environments compared to soft soil environments, and engine rotational speed was reduced by up to 0.74 times. In addition, the average rear wheel axle torque is up to 1.67 times higher.
  • From the tractor’s point of view, even when plowing at the same tillage depth, clay showed the highest draft force, and it was confirmed that the tractor could withstand the maximum load, but excessive slip of more than 16% occurred. In addition, results showed that sandy loam and loam had relatively lower soil resistance than clay loam and had a margin of use torque increase, making it possible to plow even under higher gear stage conditions. For fuel efficiency, the tractor-implemented system in this study was analyzed to use a relatively high torque range at a moderate slip of 8–16% when plowing at a tillage depth of 16–20 cm in loam.
  • From the viewpoint of the tillage implement, if the target is a soil environment such as sandy loam or loam, it is judged that the working efficiency can be further increased by additionally increasing the tillage width or changing the geometry design thus that it can be operated at a deeper tillage depth. Alternatively, it is possible to comprehensively check whether the maximum soil resistance occurs, which can serve as a basis for determining appropriate power machine matching.
The tractor-implement system performance evaluation method can be widely utilized to select an appropriate engine capacity and attached implement for agricultural tractors, optimal design, and gear selection of the power transmission system, decision support of the control system, and three-point hitch elevation control for soil alleviation of soil compaction, and so on. In addition, from the viewpoint of the attached implement, it will be possible to use it for research that can minimize the tillage force through geometry design. Based on this approach and utilization of the performance evaluation method, the optimal tractor-implement system matching and optimal design will be possible by predicting the working load according to the target soil environment.

Author Contributions

Conceptualization, Y.-S.K., S.-D.L. and Y.-J.K.; methodology, Y.-S.K. and W.-S.K.; software, S.-M.B. and S.-Y.B.; formal analysis, Y.-S.K. and W.-S.K.; investigation, Y.-J.K.; data curation, H.-H.J., J.-Y.S. and J.-H.L.; writing—original draft preparation, Y.-S.K.; writing—review and editing, Y.-S.K. and Y.-J.K.; supervision, Y.-J.K. and S.-D.L.; project administration, Y.-J.K.; funding acquisition, Y.-J.K. All authors have read and agreed to the published version of the manuscript.

Funding

This research was funded by Korea Institute of Planning and Evaluation for Technology in Food, Agriculture and Forestry(IPET) through Advanced Production Technology Development Pro-gram, funded by Ministry of Agriculture, Food and Rural Affairs(MAFRA)(321065-2) and this research was supported by the Korea Institute of Planning and Evaluation for Technology in Food, Agriculture and Forestry (IPET) thorough Technology Commercialization Support Program, funded by Ministry of Agriculture, Food and Rural Affairs(MAFRA)(821014-03).

Institutional Review Board Statement

Not applicable.

Informed Consent Statement

Not applicable.

Conflicts of Interest

The authors declare no conflict of interest.

References

  1. Rao, S.S. Reliability-Based Design; McGraw-Hill Companies: New York, NY, USA, 1992; ISBN 0-07-051192-6. [Google Scholar]
  2. Kim, K.U.; Kim, K.D.; Koo, Y.M.; Park, K.J. Agricultural Machinery Design I; Munundang: Seoul, Korea, 2009. [Google Scholar]
  3. Jabro, J.D.; Stevens, W.B.; Iversen, W.M.; Evans, R.G. Tillage Depth Effects on Soil Physical Properties, Sugarbeet Yield, and Sugarbeet Quality. Commun. Soil Sci. Plant Anal. 2010, 41, 908–916. [Google Scholar] [CrossRef] [Green Version]
  4. Lee, K.S.; Park, J.G.; Cho, S.C.; Noh, K.M.; Chang, Y.C. Physical Properties of Hardpan in Paddy Fields. J. Biosyst. Eng. 2007, 32, 207–214. [Google Scholar]
  5. Chung, S.O.; Sudduth, K.A. Soil failure models for vertically operating and horizontally operating strength sensors. Trans. ASABE 2006, 49, 851–863. [Google Scholar] [CrossRef]
  6. Aday, S.H.; Ramadhan, M.N. Comparison between the draft force requirements and the disturbed area of a single tine, parallel double tines and partially swerved double tines subsoilers. Soil Tillage Res. 2019, 191, 238–244. [Google Scholar] [CrossRef]
  7. Barzegar, M.; Hashemi, S.J.; Nazokdast, H.; Karimi, R. Evaluating the draft force and soil-tool adhesion of a UHMW-PE coated furrower. Soil Tillage Res. 2016, 163, 160–167. [Google Scholar] [CrossRef]
  8. Hang, C.; Gao, X.; Yuan, M.; Huang, Y.; Zhu, R. Discrete element simulations and experiments of soil disturbance as affected by the tine spacing of subsoiler. Biosyst. Eng. 2018, 168, 73–82. [Google Scholar] [CrossRef]
  9. Ibrahmi, A.; Bentaher, H.; Hbaieb, M.; Maalej, A.; Mouazen, A.M. Study the effect of tool geometry and operational conditions on mouldboard plough forces and energy requirement: Part 1. Finite element simulation. Comput. Electron. Agric. 2015, 117, 258–267. [Google Scholar] [CrossRef]
  10. Marakoglu, T.; Carman, K. Effect of Design Parameters of Cultivator Share on Draft Force and Soil Loosening in a Soil Bin. J. Agron. 2009, 8, 21–26. [Google Scholar] [CrossRef] [Green Version]
  11. Mari, I.A.; Ji, C.; Chandio, F.A.; Arslan, C.; Sattar, A.; Ahmad, F. Spatial distribution of soil forces on moldboard plough and draft requirement operated in silty-clay paddy field soil. J. Terramech. 2015, 60, 1–9. [Google Scholar] [CrossRef]
  12. Naderloo, L.; Alimadani, R.; Akram, A.; Javadikia, P.; Zeinali Khanghah, H. Tillage depth and forward speed effects on draft of three primary tillage implements in clay loam soil. J. Food Agric. Environ. 2009, 7, 382–385. [Google Scholar]
  13. Raper, R.L. Force Requirements and Soil Disruption of Straight and Bentleg Subsoilers for Conservation Tillage Systems. Appl. Eng. Agric. 2005, 21, 787–794. [Google Scholar] [CrossRef] [Green Version]
  14. Moeenifar, A.; Mousavi-Seyedi, S.R.; Kalantari, D. Influence of tillage depth, penetration angle and forward speed on the soil/thin-blade interaction force. Agric. Eng. Int. CIGR J. 2014, 16, 69–74. [Google Scholar]
  15. Upadhyay, G.; Raheman, H. Specific draft estimation model for offset disc harrows. Soil Tillage Res. 2019, 191, 75–84. [Google Scholar] [CrossRef]
  16. Ahmadi, I. Development and assessment of a draft force calculator for disk plow using the laws of classical mechanics. Soil Tillage Res. 2016, 163, 32–40. [Google Scholar] [CrossRef]
  17. Lee, J.-W.; Kim, K.-U.; Gim, D.-H.; Choi, K.-J. Effects of Distribution of Axle Load and Inflation Pressure of Tires on Fuel Efficiency of Tractor Operations. J. Biosyst. Eng. 2011, 36, 303–313. [Google Scholar] [CrossRef]
  18. Kim, Y.J.; Chung, S.O.; Park, S.J.; Choi, C.H. Analysis of Power Requirement of Agricultural Tractor by Major Field Operation. J. Biosyst. Eng. 2011, 36, 79–88. [Google Scholar] [CrossRef]
  19. Lee, D.H.; Kim, Y.J.; Chung, S.O.; Choi, C.H.; Lee, K.H.; Shin, B.S. Analysis of the PTO load of a 75 kW agricultural tractor during rotary tillage and baler operation in Korean upland fields. J. Terramech. 2015, 60, 75–83. [Google Scholar] [CrossRef]
  20. Kim, Y.J.; Chung, S.O.; Choi, C.H. Effects of gear selection of an agricultural tractor on transmission and PTO load during rotary tillage. Soil Tillage Res. 2013, 134, 90–96. [Google Scholar] [CrossRef]
  21. Kichler, C.M.; Fulton, J.P.; Raper, R.L.; McDonald, T.P.; Zech, W.C. Effects of transmission gear selection on tractor performance and fuel costs during deep tillage operations. Soil Tillage Res. 2011, 113, 105–111. [Google Scholar] [CrossRef] [Green Version]
  22. Kim, W.S.; Kim, Y.J.; Park, S.U.; Kim, Y.S. Influence of soil moisture content on the traction performance of a 78-kW agricultural tractor during plow tillage. Soil Tillage Res. 2021, 207, 104851. [Google Scholar] [CrossRef]
  23. Kumar, A.A.; Tewari, V.K.; Nare, B. Embedded digital draft force and wheel slip indicator for tillage research. Comput. Electron. Agric. 2016, 127, 38–49. [Google Scholar] [CrossRef]
  24. Ashok Kumar, A.; Tewari, V.K.; Gupta, C.; Pareek, C.M. A device to measure wheel slip to improve the fuel efficiency of off road vehicles. J. Terramech. 2017, 70, 1–11. [Google Scholar] [CrossRef]
  25. Čiplienė, A.; Gurevičius, P.; Janulevičius, A.; Damanauskas, V. Experimental validation of tyre inflation pressure model to reduce fuel consumption during soil tillage. Biosyst. Eng. 2019, 186, 45–59. [Google Scholar] [CrossRef]
  26. Balsari, P.; Biglia, A.; Comba, L.; Sacco, D.; Eloi Alcatrão, L.; Varani, M.; Mattetti, M.; Barge, P.; Tortia, C.; Manzone, M.; et al. Performance analysis of a tractor-power harrow system under different working conditions. Biosyst. Eng. 2021, 202, 28–41. [Google Scholar] [CrossRef]
  27. Kim, Y.S.; Kim, W.S.; Siddique, A.A.; Baek, S.Y.; Baek, S.M.; Cheon, S.H.; Lee, S.D.; Lee, K.H.; Hong, D.H.; Park, S.U.; et al. Power Transmission Efficiency Analysis of 42 kW Power Agricultural Tractor According to Tillage Depth during Moldboard Plowing. Agronomy 2020, 10, 1263. [Google Scholar] [CrossRef]
  28. Kim, Y.S.; Kim, W.S.; Baek, S.Y.; Baek, S.M.; Kim, Y.J.; Lee, S.D.; Kim, Y.J. Analysis of Tillage Depth and Gear Selection for Mechanical Load and Fuel Efficiency of an Agricultural Tractor Using an Agricultural Field Measuring System. Sensors 2020, 20, 2450. [Google Scholar] [CrossRef] [PubMed]
  29. Kim, W.S.; Kim, Y.S.; Kim, Y.J. Development of prediction model for axle torque of agricultural tractors. Trans. ASABE 2020, 63, 1773–1786. [Google Scholar] [CrossRef]
  30. Kim, W.S.; Kim, Y.J.; Kim, Y.S.; Park, S.U.; Lee, K.H.; Hong, D.H.; Choi, C.H. Evaluation of the fatigue life of a tractor’s transmission spiral bevel gear. J. Terramech. 2021, 94, 13–22. [Google Scholar] [CrossRef]
  31. Kim, E.J.; Moon, S.G.; Oh, C.M.; Han, J.W. Working load measurement using 6-component load cell and fatigue damage analysis of composite working implement. J. Agric. Life Environ. Sci. 2017, 29, 225–236. [Google Scholar]
  32. Koo, Y.M.; Hong, J.G.; Han, J.W.; Shin, H.Y. Operating Power and Draft Performance of an Integrated Tractor Implement for Flat Ridge Preparation. J. Agric. Life Sci. 2018, 52, 137–150. [Google Scholar] [CrossRef]
  33. Tan, K.H. Soil Sampling, Preparation, and Analysis; CRC Press: New York, NY, USA, 1995; ISBN 0-8247-9675-6. [Google Scholar]
  34. O’Kelly, B.C.; Sivakumar, V. Water Content Determinations for Peat and Other Organic Soils Using the Oven-Drying Method. Dry. Technol. 2014, 32, 631–643. [Google Scholar] [CrossRef]
  35. Ditzler, C.; Scheffe, K.; Monger, H.C. USDA Handbook 18; Government Printing Office: Washington, DC, USA, 2017.
  36. Thien, S.J. A flow diagram for teaching texture-by-feel analysis. J. Agron. Educ. 1979, 8, 54–55. [Google Scholar] [CrossRef]
  37. Roy, S.; Kumar Bhalla, S. Role of Geotechnical Properties of Soil on Civil Engineering Structures. Resour. Environ. 2017, 7, 103–109. [Google Scholar]
  38. ASTM International Standard Test Methods for Liquid Limit, Plastic Limit, and Plasticity Index of Soils (D4318-10); ASTM International: West Conshohocken, PA, USA, 2010; Volume 4.
  39. ASABE Standards EP542; Procedure for Using and Reporting Data Obtained with the Soil Cone Penetrometer. ASAE: St. Joseph, MI, USA, 2009; Volume 1999.
  40. ASABE Standards S313.3; Soil Cone Penetrometer. ASAE: St. Joseph, MI, USA, 2005; Volume 1999.
  41. Mak, J.; Chen, Y. Simulation of draft forces of a sweep in a loamy sand soil using the discrete element method. Can. Biosyst. Eng. Pa. 2015, 56, 2.1–2.7. [Google Scholar] [CrossRef]
  42. Tekeste, M.Z.; Tollner, E.W.; Raper, R.L.; Way, T.R.; Johnson, C.E. Non-linear finite element analysis of cone penetration in layered sandy loam soil-Considering precompression stress state. J. Terramech. 2009, 46, 229–239. [Google Scholar] [CrossRef]
  43. Sánchez-Girón, V.; Ramírez, J.J.; Litago, J.J.; Hernanz, J.L. Effect of soil compaction and water content on the resulting forces acting on three seed drill furrow openers. Soil Tillage Res. 2005, 81, 25–37. [Google Scholar] [CrossRef]
  44. Farid Eltom, A.E.; Ding, W.; Ding, Q.; Ali, A.B.B.; Eisa Adam, B. Effect of trash board on moldboard plough performance at low speed and under two straw conditions. J. Terramech. 2015, 59, 27–34. [Google Scholar] [CrossRef]
  45. Damanauskas, V.; Velykis, A.; Satkus, A. Efficiency of disc harrow adjustment for stubble tillage quality and fuel consumption. Soil Tillage Res. 2019, 194, 104311. [Google Scholar] [CrossRef]
  46. Lee, J.W.; Kim, J.S.; Kim, K.U. Computer simulations to maximise fuel efficiency and work performance of agricultural tractors in rotovating and ploughing operations. Biosyst. Eng. 2016, 142, 1–11. [Google Scholar] [CrossRef]
  47. Alcock, R. Tractor-Implement Systems; Springer Science & Business Media: Berlin/Heidelberg, Germany, 2012. [Google Scholar]
  48. Ani, O.A.; Uzoejinwa, B.B.; Ezeama, A.O.; Onwualu, A.P.; Ugwu, S.N.; Ohagwu, C.J. Overview of soil-machine interaction studies in soil bins. Soil Tillage Res. 2018, 175, 13–27. [Google Scholar] [CrossRef]
  49. Zoz, F.M.; Grisso, R.D. Traction and Tractor Performance; ASAE: St. Joseph, MI, USA, 2003. [Google Scholar]
  50. Kim, Y.-S.; Siddique, M.A.A.; Kim, W.-S.; Kim, Y.-J.; Lee, S.-D.; Lee, D.-K.; Hwang, S.-J.; Nam, J.-S.; Park, S.-U.; Lim, R.-G. DEM simulation for draft force prediction of moldboard plow according to the tillage depth in cohesive soil. Comput. Electron. Agric. 2021, 189, 106368. [Google Scholar] [CrossRef]
  51. Grisso, R.; Pitman, R.; Perumpral, J.V.; Vaughan, D.; Roberson, G.T.; Hoy, R.M. “Gear Up and Throttle Down” to Save Fuel. Virginia Coop. Ext. Pap. 2011, 442–450. [Google Scholar]
  52. Hanna, H.M.; Hanna, H.; Harmon, J.; Petersen, D. Farm Energy: Ballasting Tractors for Fuel Efficiency; University Library Digital Initiative: Ames, IA, USA, 2010. [Google Scholar]
Figure 1. Tractor-implement system: (a) 42 kW class agricultural tractor (TX58, TYM); (b) 6-rows moldboard plow (WJSP-6S, Woongjin).
Sensors 22 02750 g001
Figure 2. Configuration of field load measurement system.
Sensors 22 02750 g002
Figure 3. Soil environment analysis procedure considering depth distribution: Soil sampling using uniformed grid sampling method.
Sensors 22 02750 g003
Figure 4. Driving load of 42 kW agricultural tractor at M3 gear selection.
Sensors 22 02750 g004
Figure 5. (a) Field measurements results of tillage depth and travel speed under various field sites; (b) Comparison analysis of travel speed by tillage depth and test sites.
Sensors 22 02750 g005aSensors 22 02750 g005b
Figure 6. (a) Field measurements results of draft force under various field sites; (b) Comparison analysis of draft force by tillage depth and test sites.
Sensors 22 02750 g006
Figure 7. (a) Field measurements results of the engine load with fuel consumption under various field sites; (b) Comparison analysis of engine torque by tillage depth and test sites.
Sensors 22 02750 g007
Figure 8. Field measurements results of wheel axle load and slip ratio under various field sites.
Sensors 22 02750 g008
Figure 9. Comparison analysis by tillage depth and test sites: (a) rear wheel axle torque; (b) slip ratio.
Sensors 22 02750 g009
Figure 10. Tractive efficiency by slip ratio and test sites.
Sensors 22 02750 g010
Figure 11. Comparative analysis of measurement data on tractor engine performance curve.
Sensors 22 02750 g011
Figure 12. (a) Lugging ability; (b) torque rise ranges.
Sensors 22 02750 g012
Table 1. Specification of the agricultural tractor.
ItemSpecification
Weight (kg)Empty2615
Total4072
Wheel base (mm)2155
Length (mm) × width (mm) × height (mm)3695 × 1848 × 2560
EngineRated Power (kW)35.6 @ 2000 rpm
Maximum torque (Nm)211.8 @ 1600 rpm
TransmissionMain4 stages (1, 2, 3, 4)
Sub6 stages (C-L, C-M, C-H, L, M, H)
TireSize (front/rear)11.2–20/14.9–30
TypeBias
Gear ratio (front wheel axle/rear wheel axle)51:1/76:1
Maximum travel speed (km/h)33.8
Table 2. Specification of the tillage implement.
ItemSpecification
Product nameWJSP-6S
Manufacturing companyWoongjin
TypeMoldboard plow
Weight (kg) 370
Length (mm) × width (mm) × height (mm)1930 × 1800 × 1235
Required power (kW)40–52
Maximum tillage depth ranges (mm)Up to 200
Rake angle (deg)30.7
Single blade width (mm)270
Share length (mm)360
Share typePlain coulter with spring
Number of furrows3
Table 3. Specification of the sensors constituting the field load measurement system.
ItemSpecification
Torque meterName (product/company)PCM16/MANNER
Measuring torque range15 kNm
Sampling rate1 kHz
Proximity sensorName (product/company)CYGTS211B-PO2/GmbH and Co. KG
Rated sensing distance 3 mm
Sampling rate1 Hz to 20 kHz
Measuring rpm range1–20,000 rpm (using 60P/R gear)
Operating temperature ranges−40 to 125 °C
Load cellName (product/company)SBA-2T/CAS
Measuring capacity2tf
Rated Output3.0 mV/V
Operating temperature ranges−30 to 80 °C
Protection gradeIP 66
Flow meterName (product/company)OG2-SS5-VHQ-B/Titan Enterprises
Measuring capacity4 L/min
Operating typeOval gear type
InclinometerName (product/company)IS2MA090-U-BI/GEMAC sensors
Protection gradeIP 67
Accuracy±0.1°
Operating temperature ranges−40 to 80 °C
RTK GPSName (product/company)Duro Inertial/Swift Navigation
RTK accuracy: Horizontal0.01 m + 1 ppm
RTK accuracy: Vertical0.015 m + 1 ppm
Sampling rate (GPS/IMU)10/25–200
Network Protocol SupportedNTRIP Client
Table 4. Results of measurement of soil properties according to soil layers in sandy loam (first site).
ParametersSL1SL2SL3SL4
WC 1 (%)15.52 ± 0.318.07 ± 1.0119.6 ± 1.6219.45 ± 0.92
η   20.53 ± 0.020.51 ± 0.010.49 ± 0.010.47 ± 0.03
γ   3 ( kg / m 3 )1544 ± 74.41644 ± 36.81688 ± 44.41800 ± 114.2
CI 4 (kPa)560.45 ± 130.6725.33 ± 114.9810.29 ± 89.5879.3 ± 82.7
τ f   5 (kPa)23.8 ± 7.628.75 ± 3.536.07 ± 3.641.43 ± 1.8
1 WC: water content; 2  η : porosity, 3  γ : bulk density, 4 CI: cone index, 5  τ f : shear strength.
Table 5. Results of measurement of soil properties according to soil layers in loam (second site).
ParametersSL1SL2SL3SL4
WC 1 (%)32.2 ± 0.0734.1 ± 1.6228.4 ± 4.524.5 ± 3.9
η  20.54 ± 0.010.52 ± 0.030.49 ± 0.070.41 ± 0.02
γ   3   ( kg / m 3 )1519 ± 75.21614 ± 97.41662 ± 179.41898 ± 108.1
CI 4 (kPa)471.2 ± 53.8563.14 ± 71.1655.3 ± 109.21798.1 ± 491.8
τ f  5 (kPa)23.9 ± 4.330.87 ± 3.532.9 ± 5.278.4 ± 6.4
1 WC: water content; 2  η : porosity, 3  γ : bulk density, 4 CI: cone index, 5  τ f : shear strength.
Table 6. Results of measurement of soil properties according to soil layers in clay loam (third site).
ParametersSL1SL2SL3SL4
WC 1 (%)26.56 ± 1.6123.8 ± 1.7722.49 ± 0.9320.24 ± 2.21
η  20.39 ± 0.020.38 ± 0.020.36 ± 0.030.34 ± 0.02
γ   3   ( kg / m 3 )1899 ± 27.861905 ± 49.711955 ± 83.312021 ± 72.97
CI 4 (kPa)680.8 ± 117.9900.6 ± 891012.6 ± 143.21915.5 ± 258.9
τ f  5 (kPa)64.83 ± 7.963.36 ± 8.258.49 ± 6.787.74 ± 5.8
1 WC: water content; 2  η : porosity, 3  γ : bulk density, 4 CI: cone index, 5  τ f : shear strength.
Table 7. Results of power transmission efficiency by tillage depth and test sites.
Test SiteTD 1 (cm) P e   2   ( kW ) P T E e   3   ( % ) P f w   4   ( kW ) P T E f w     5   ( % ) P r w   6   ( kW ) P T E r w   7   ( % )
Sandy loam1224.658.89.839.811.446.3
1633.379.211.935.716.649.8
2034.882.812.836.717.851.1
Loam1228.968.8113813.747.4
1635.885.211.832.91953
203890.412.733.420.955
Clay loam1234.9839.8281748.7
1638.792.110.226.321.856.3
2039.493.88.72225.664.9
1 TD: tillage depth; 2  P e : engine power, 3  PTE e : power transmission efficiency of the engine compared to engine maximum power, 4  P fw : front wheel axle power, 5  PTE fw : power transmission efficiency of front wheel axle compared to engine power, 6  P rw : rear wheel axle power, 7  PTE rw : power transmission efficiency of rear wheel axle compared to engine power.
Table 8. Results of fuel efficiency by tillage depth and test sites.
Test SiteTD (cm)FC 1 (kg/h)SFC 2 (g/kWh)PR 3 (ha/h)Fuel Cost ($/ha)
Sandy loam128.5349.71.298.1
1610.1306.21.249.9
2010.2305.71.2410.1
Loam129.8345.71.249.7
1610.3289.71.1211.3
209.9261.2112.2
Clay loam129.7284.71.0211.7
169.7252.10.913.2
208.9226.20.7414.7
1 FC: fuel consumption; 2 SFC: specific fuel consumption, 3 PR: productivity rate.
Publisher’s Note: MDPI stays neutral with regard to jurisdictional claims in published maps and institutional affiliations.

