Author Contributions
J.B., design the concept of experiments, FEM modelling, project administration; P.G., analysis and preparation of magnetorheological elastomers, writing manuscript; R.K., software implementation of image processing algorithm, camera setup, writing manuscript; A.M., analysis and preparation of magnetorheological elastomers, writing manuscript; P.S., prepare of experiments, data acquisition, writing manuscript. All authors have read and agreed to the published version of the manuscript.
Figure 1.
The mold for preparing sample beams (a). Example of performed beams (b). The gripper finger mold (c). The example of gripper finger (d).
Figure 1.
The mold for preparing sample beams (a). Example of performed beams (b). The gripper finger mold (c). The example of gripper finger (d).
Figure 2.
The cross section of coil windings and beam (core) (a). The coil model. (b) The absolute value of inductance for coil with varying permeability of beam and various geometry (c). The relative value of inductance for analogous example (d).
Figure 2.
The cross section of coil windings and beam (core) (a). The coil model. (b) The absolute value of inductance for coil with varying permeability of beam and various geometry (c). The relative value of inductance for analogous example (d).
Figure 3.
The example of coil built to perform estimate of relative permeability.
Figure 3.
The example of coil built to perform estimate of relative permeability.
Figure 4.
The laboratory set up for analysing the free oscillations of MRE beam.
Figure 4.
The laboratory set up for analysing the free oscillations of MRE beam.
Figure 5.
The free vibrations of MRE beam. The duty cycle of PWM and distance response for sample 1 (a,c). The duty cycle of PWM and distance response for sample 2 (b,d).
Figure 5.
The free vibrations of MRE beam. The duty cycle of PWM and distance response for sample 1 (a,c). The duty cycle of PWM and distance response for sample 2 (b,d).
Figure 6.
The example of model and measurement transients.
Figure 6.
The example of model and measurement transients.
Figure 7.
The laboratory set up for analysing the force of MRE beam.
Figure 7.
The laboratory set up for analysing the force of MRE beam.
Figure 8.
The permanent magnet position in the measurement of force.
Figure 8.
The permanent magnet position in the measurement of force.
Figure 9.
The force measurement between soft beam and permanent magnet. The force sensor for sample 1 (a) and sample 2 (b). The representation of force as a function of the position for sample 1 (c) and sample 2 (d).
Figure 9.
The force measurement between soft beam and permanent magnet. The force sensor for sample 1 (a) and sample 2 (b). The representation of force as a function of the position for sample 1 (c) and sample 2 (d).
Figure 10.
The soft gripper reaction on electromagnet. The upper pair of electromagnets turned on (a). The both pairs of electromagnets turned on (b).
Figure 10.
The soft gripper reaction on electromagnet. The upper pair of electromagnets turned on (a). The both pairs of electromagnets turned on (b).
Figure 11.
Camera system. Pan–tilt–zoom camera system mount (a). The view of the gripper framework (b).
Figure 11.
Camera system. Pan–tilt–zoom camera system mount (a). The view of the gripper framework (b).
Figure 12.
Gripper positions during weight lift experiment. Base position, closed gripper (a). Base position, opened gripper (b). Catching position, opened gripper (c). Catching position, closed gripper (d). Initial lifting position, closed gripper (e). Goal lifting position, closed gripper (f).
Figure 12.
Gripper positions during weight lift experiment. Base position, closed gripper (a). Base position, opened gripper (b). Catching position, opened gripper (c). Catching position, closed gripper (d). Initial lifting position, closed gripper (e). Goal lifting position, closed gripper (f).
Figure 13.
Preprocessing stages of the gripper displacement analysis. Edge image of closed gripper in the base closed position (a). Edge image of the closed gripper holding an object (b). Difference image between the closed empty gripper and closed gripper holding an object (analysis points marked) (c). Difference image between the closed empty gripper and opened gripper (analysis points marked) (d). The idea of identification of displacement analysis points (e).
Figure 14.
Results from visual analysis. Each line represents the displacement d caused by the particular weight along with the radius r millimeters from the gripper center.
Figure 14.
Results from visual analysis. Each line represents the displacement d caused by the particular weight along with the radius r millimeters from the gripper center.
Figure 15.
Results from visual analysis. X axis represents radius r. Y axis represents average standard deviation for all the weights with upper and lower error bands.
Figure 15.
Results from visual analysis. X axis represents radius r. Y axis represents average standard deviation for all the weights with upper and lower error bands.
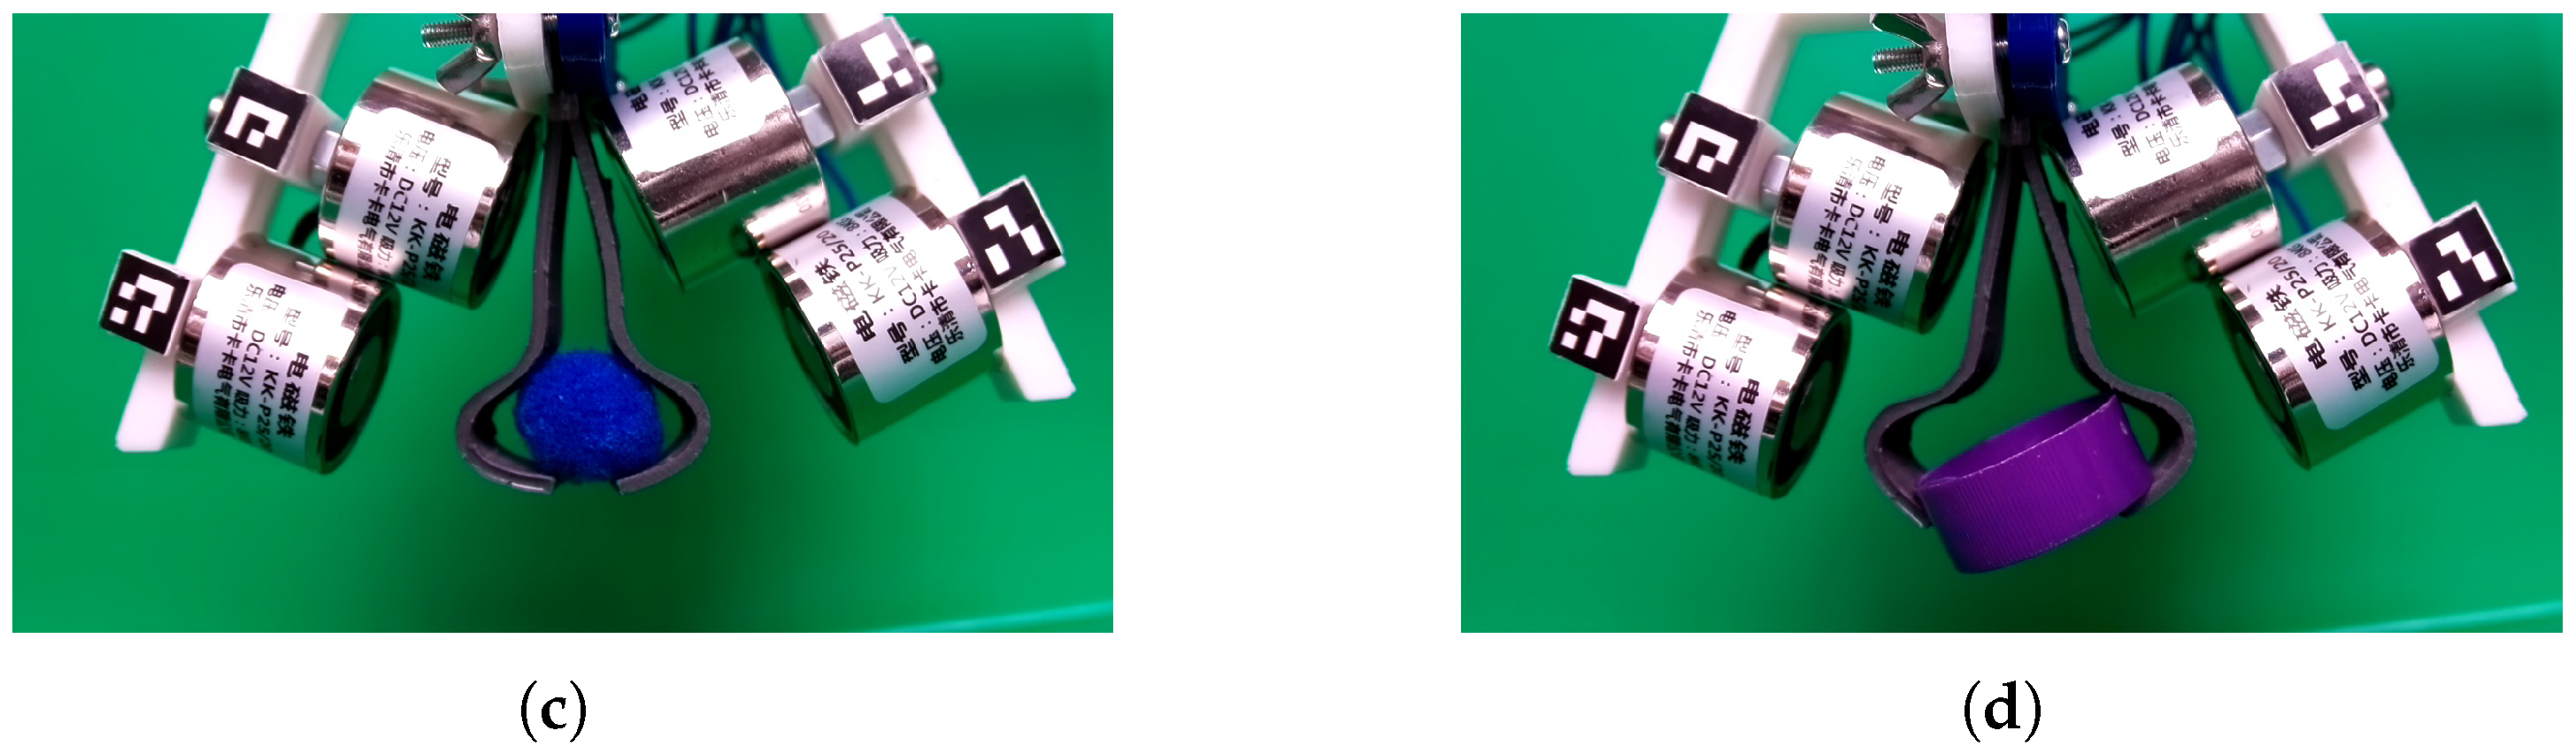
Figure 16.
The soft gripper holding various objects: wood ball (a), game pawn (b), pompon (c), pencil sharpener (d).
Figure 16.
The soft gripper holding various objects: wood ball (a), game pawn (b), pompon (c), pencil sharpener (d).
Table 1.
The dimensions of beam and coil.
Table 1.
The dimensions of beam and coil.
| Name | Value |
|---|
| beam length | 60 mm |
| beam width | 15 mm |
| beam thickness | 2 mm |
| winding length L | 40 mm |
| winding radius | 2 mm |
| winding thickness z | 0.6 mm |
| winding width | 36 mm |
Table 2.
The various coil models in the analysis.
Table 2.
The various coil models in the analysis.
| Name | Length (L) | Thickness (z) |
|---|
| nominal | 40 mm | 0.6 mm |
| longer | 42 mm | 0.6 mm |
| shorter | 38 mm | 0.6 mm |
| thinner | 40 mm | 0.5 mm |
| thicker | 40 mm | 0.7 mm |
Table 3.
The results of the inductance measurements for varying iron powder content with the calculated relative inductance and the estimated magnetic permeability.
Table 3.
The results of the inductance measurements for varying iron powder content with the calculated relative inductance and the estimated magnetic permeability.
| Coil | Fe Content (%) | L (μH) | | |
|---|
| A | - | 22.78 | 1.0 | 1.0 |
| B | - | 25.10 | 1.0 | 1.0 |
| A | 30 | 23.52 | 3.2 | 1.12 |
| B | 30 | 26.10 | 4.0 | 1.16 |
| A | 50 | 25.05 | 10.0 | 1.47 |
| B | 50 | 27.58 | 9.9 | 1.46 |
| A | 70 | 28.73 | 26.1 | 2.31 |
| B | 70 | 31.50 | 25.5 | 2.28 |
Table 4.
The settling time of free oscillations for samples of beams with different iron content in MRE.
Table 4.
The settling time of free oscillations for samples of beams with different iron content in MRE.
| Sample | Fe Content (%) | Settling Time (s) | (1/s) | (rad/s) |
|---|
| 1 | 30 | 11.2 | 0.29 | 28.5 |
| 2 | 30 | 11.2 | 0.29 | 27.6 |
| 1 | 50 | 8.9 | 0.45 | 30.4 |
| 2 | 50 | 8.0 | 0.48 | 31.6 |
| 1 | 70 | 6.5 | 0.63 | 33.9 |
| 2 | 70 | 6.6 | 0.56 | 30.2 |
Table 5.
The results of the mechanical strength measurements (Young modulus , tensile strength and elongation at break ) for magnetorheological elastomers with various iron powder content.
Table 5.
The results of the mechanical strength measurements (Young modulus , tensile strength and elongation at break ) for magnetorheological elastomers with various iron powder content.
| Fe Content (%) | (MPa) | (MPa) | (%) |
|---|
| 0 | | | |
| 30 | | | |
| 50 | | | |
| 70 | | | |
Table 6.
Characteristic of gripped objects.
Table 6.
Characteristic of gripped objects.
| Dimensions | Wood Ball | Game Pawn | Popmpon | Pencil Sharpener |
|---|
| Weight () | 2.79 | 0.8 | 0.18 | 2.06 |
| Diameter (mm) | 20 | 25.5 | 16 | 26 |
| Height (mm) | - | 6.5 | - | 12 |


 ,
, 


