3.1. Finite Element Model
To validate the correctness and effectiveness of the proposed data fusion method, ANSYS software was applied to simulate the vibration of a simply supported beam under complex loads, which is composed of three different patterns, as shown in
Figure 3; namely, a half-sine excitation with a pseudo-static component, a random excitation with a non-zero mean dynamic component, and an impulse excitation that can produce a free decay response. The beam188 element was utilized to simulate a simply supported beam; the length of the beam is 1.6 m, the cross-section is rectangular with
mm
2, the elastic modulus is 206 GPa, the Poisson’s ratio is 0.3, and the density is set to 7800 kg/m
3.
In the mode superposition method, the more mode orders are selected, the higher the accuracy of the reconstructed displacement. The first three-order modes have already accounted for most of the vibration energy. Considering that the first three-order modes of the structure can meet the requirements for a simply supported beam [
26,
27], four strain response extraction points were uniformly arranged in the length direction of the structure, and the middle span was set as the displacement and acceleration response extraction point. Excitation direction was Y and excitation duration was 20 s, the acceleration and displacement sampling rate were 1200 Hz, the strain sampling rate was 400 Hz, and the finite element model and measurement points layout are shown in
Figure 4.
3.2. Displacement Reconstruction
Substituting the strain responses of the four measurement points into the state equation of the SSI method as state variables, a stability diagram can be obtained as shown in
Figure 5. The orange curve in the figure represents the frequency spectrum, and the circle represents the point where the mode shape and frequency have stable solutions. The place where the peak of the frequency spectrum coincides with a row of circles can be considered as the excited strain mode, which can be obtained by reading the data corresponding to the circle, and the first three-order strain modes were successfully identified.
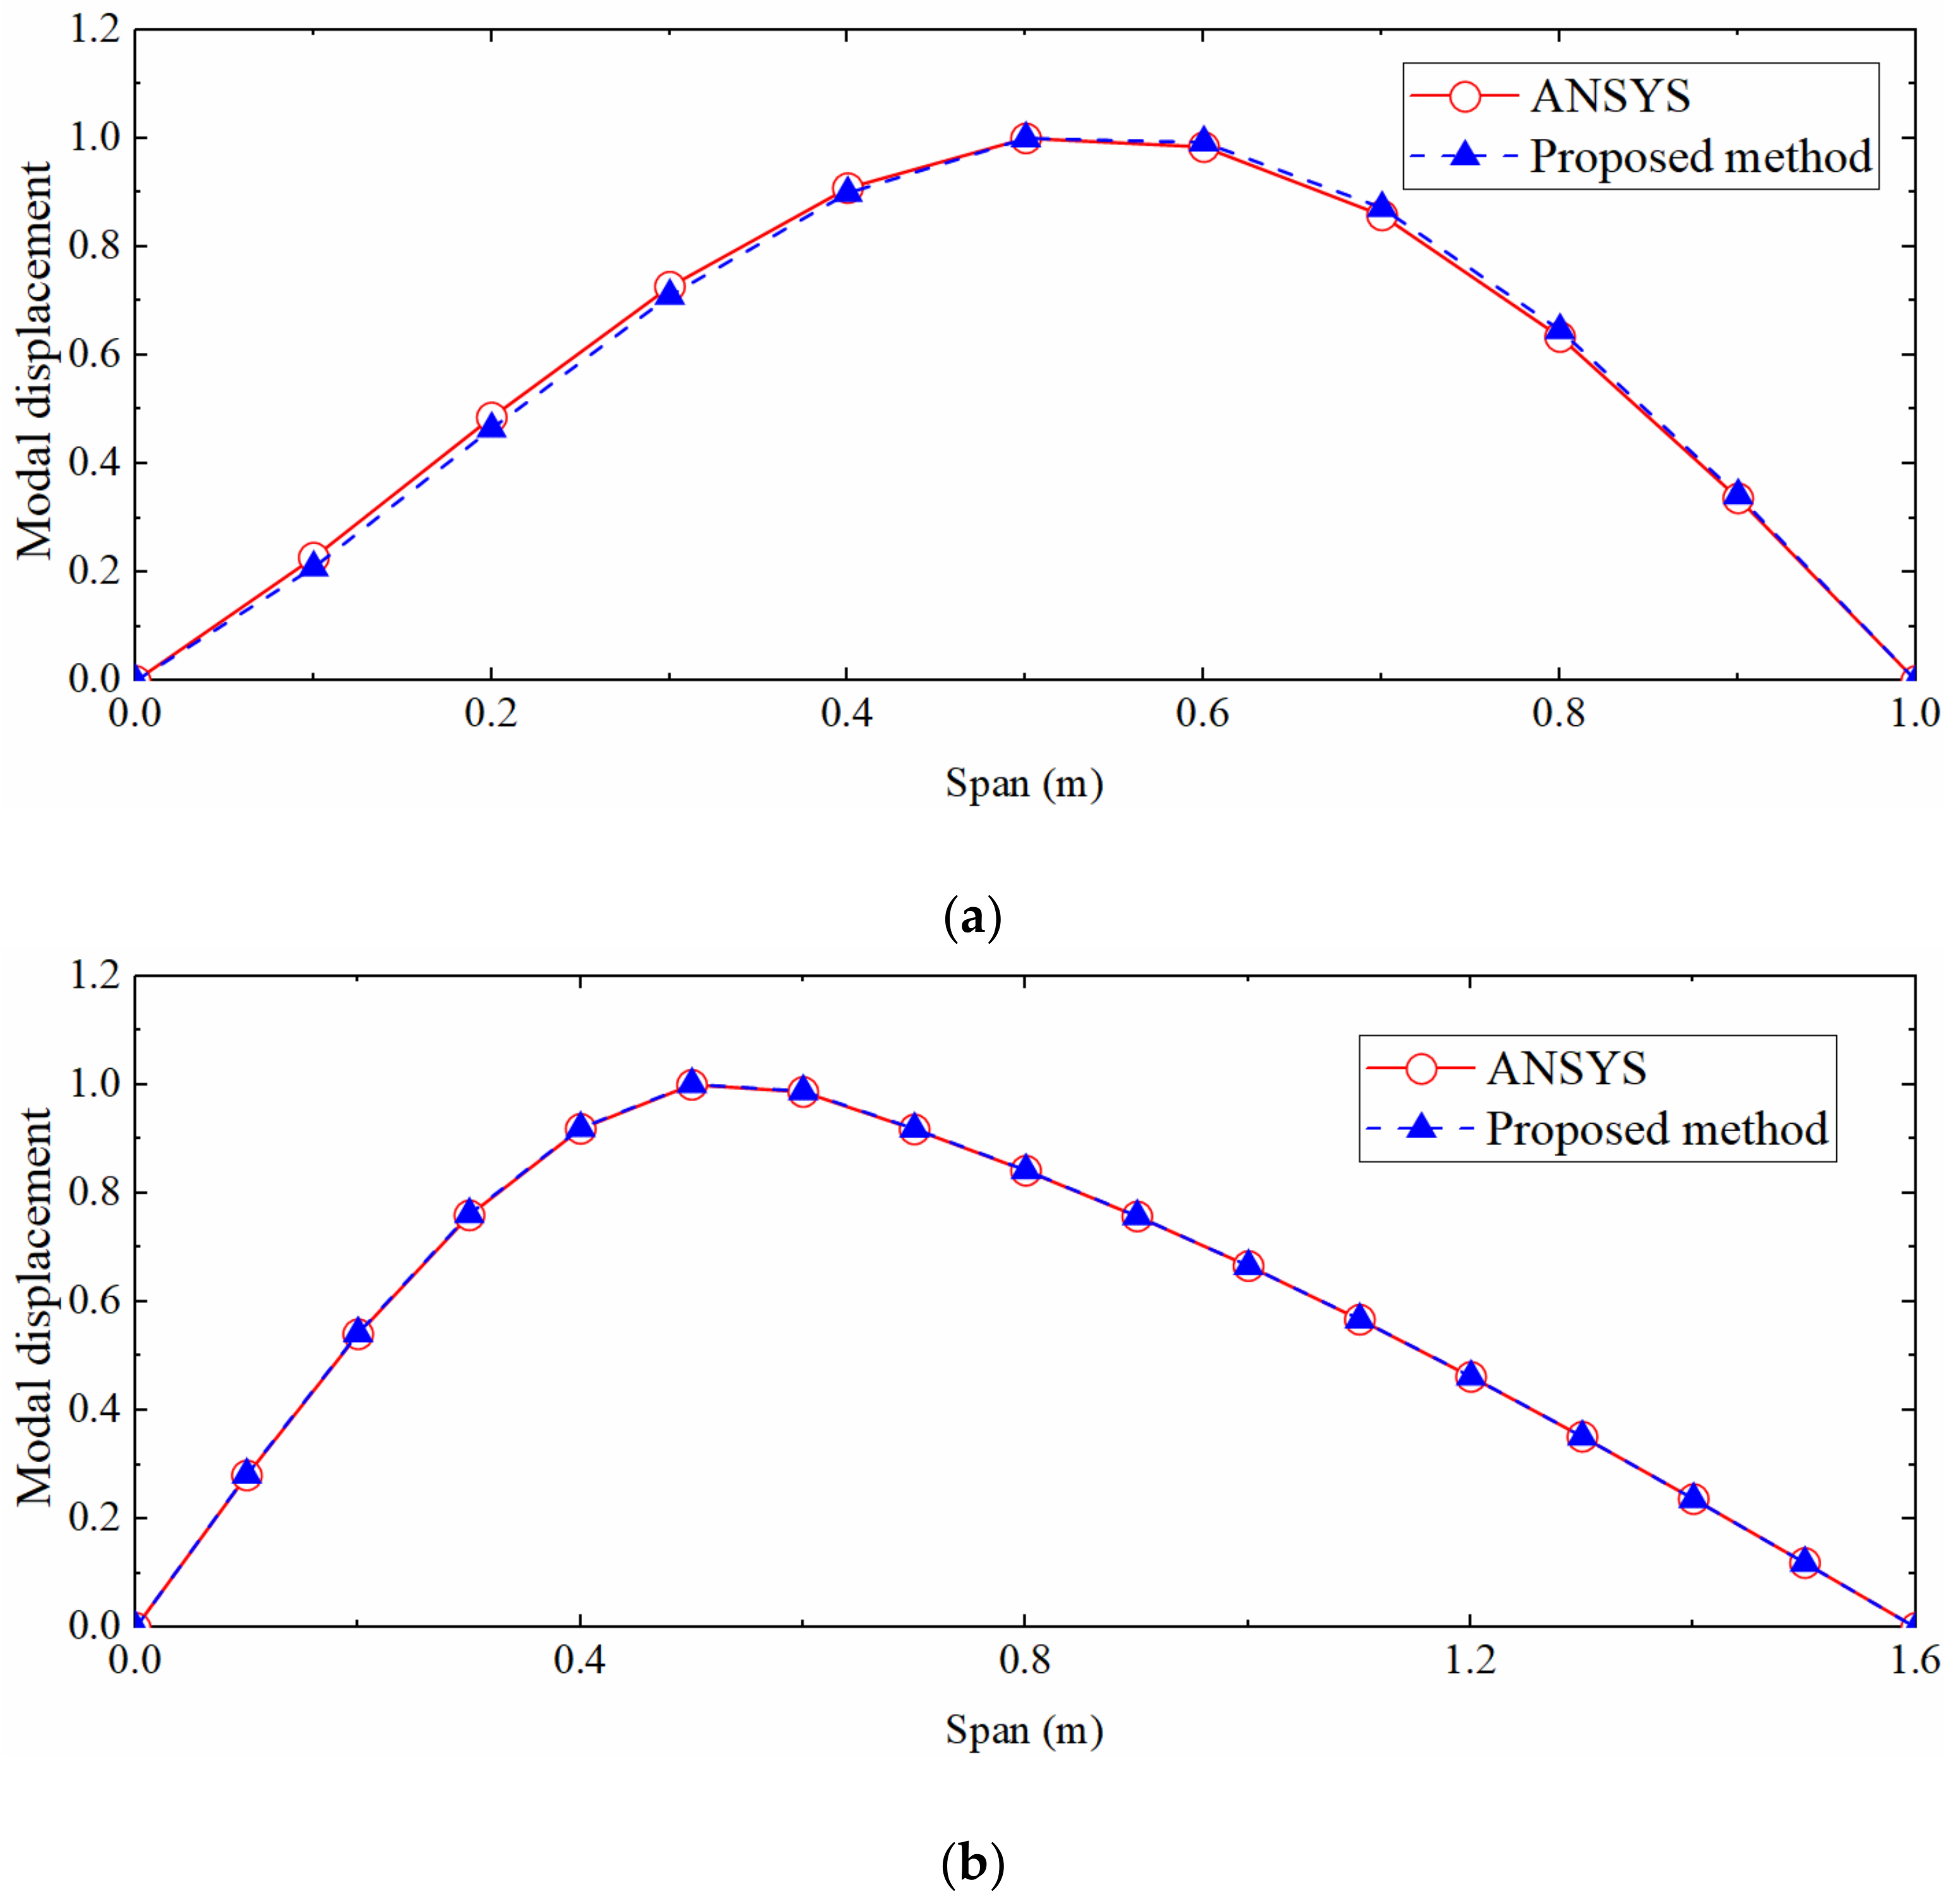
The identified first three-order strain modes are shown in
Figure 6. To indicate the effectiveness of the SSI algorithm in identifying the strain mode shape, the theoretical displacement mode shape function of the simply supported beam was applied to obtain the theoretical strain mode shape function [
28]; then, the mode identification method proposed by Wang et al. was used for comparison.
Figure 7 compares the first-order strain modes identified by the different methods, which shows that the difference between the results identified by the SSI method and the theoretical solution is very small, while the method proposed by Wang et al. has a large identification error near the boundary. This is because the simulation in this paper only applies the load at the middle of the span. Therefore, the SSI method has great advantages in both the recognition accuracy and the operability.
In order to calculate the strain-derived displacement, the least square method is used to fit the mode shape curve to obtain the displacement mode function and modal coordinates separately.
Then, the identified third-order strain mode shape is fitted with a third-order polynomial function as the strain mode shape function of the structure, and then they are, respectively, integrated twice and substituted into the boundary conditions of the simply supported beam to obtain the corresponding displacement mode shape function. Moreover, the modal coordinates are acquired by substituting the strain mode function and strain response into Equation (2); then multiplying the displacement mode shape and modal coordinates together is the strain derived displacement. According to the proposed method, strain-derived displacement was used to correct the displacement obtained by acceleration integration can accurately reconstruct the dynamic displacement.
Figure 8 is the comparison diagram between the theoretical displacement extracted by ANSYS, the strain-derived displacement and reconstructed displacement by the data fusion method.
Figure 8 shows that the strain-derived displacement curve, the displacement curve reconstructed by the data fusion algorithm, and the displacement curve extracted by ANSYS are in good agreement, which validates the correctness. The partially enlarged view suggests that the displacement reconstructed by the data fusion approach is more accurate than the strain-derived displacement, indicating that the proposed data fusion algorithm can not only increase the sampling rate of the strain-derived displacement but also make full use of the information contained in the acceleration to improve the accuracy of reconstructed displacement.
For comparing the performance between the proposed method and the similar existing approach, the method developed by Zhu et al. [
29] was used to reconstruct the dynamic displacement at the same position. Due to the limitation of the strain-derived displacement calculated by the method of Zhu et al., the number of strain measurement points needs to be increased to 10, which are 0.01, 0.64, 0.8, 0.96, and 1.6 m away from the left support, respectively, and it is required to extract strain on the upper and lower surfaces of each measurement point simultaneously. The displacement calculated by this method is compared with that reconstructed by the proposed approach, as shown in
Figure 9. It can be seen that the displacements calculated by the two methods are in good agreement with the theoretical displacement, and the partial enlarged view shows that the accuracy of the proposed method is higher even with fewer measurement points. In addition, the method of Zhu et al. requires that strain measurement points should be arranged at specific locations such as the structural boundary and the reconstruction target points, and each measurement point needs to be equipped with sensors on both sides of the structure, which undoubtedly limits the popularization and application of this method in actual engineering.
3.3. Parametric Analysis
With the purpose of applying the proposed algorithm to actual engineering, further analysis of its robustness is needed. Moreover, the normalized root mean square error (NRMS) is defined to measure the accuracy of reconstructed displacement:
where
N is the total number of data points,
is the reconstructed displacement value, and
represents the theoretical displacement value.
The anti-noise performance of the method is an important indicator of its applicability. Signal noise level is usually measured by signal-to-noise ratio (
SNR), defined as
where
S is the average power of the signal, and
N is the average power of the noise. It can be seen that higher
SNR indicates less noise contained in the signal.
The acceleration and strain responses extracted by ANSYS were added with Gaussian white noise with a signal to noise ratio of 5–100 dB, and then the data fusion algorithm was used to reconstruct the displacement.
Figure 10 shows displacement time histories with a signal to noise ratio of 5 dB. The reconstruction accuracy is reduced compared with
Figure 8, and the error of pseudo-static displacement increases most obviously, while the reconstruction of pseudo-static displacement mainly depends on strain-derived displacement, which indicates that the mode superposition method is easily affected by noise. The reconstruction effect of high-frequency components of the displacement is better, showing that the reconstruction of high-frequency displacement is more dependent on acceleration, and the data fusion algorithm can sufficiently reduce the influence of noise. Overall, the NRMS is still only 5.43%, illustrating that the mode superposition method is not as good as the data fusion method in resisting noise.
Table 1 shows the NRMSs of the reconstructed displacement after adding different signal to noise ratio noise to the dynamic response, which shows that NRMS increases as the
SNR decreases, but even if the
SNR is only 5 dB, the NRMS is only 5.43%, indicating that the proposed data fusion algorithm has good anti-noise performance.
In actual engineering, the acceleration sampling rate is usually higher than that of the strain. Consequently, it is necessary to analyze the accuracy of the reconstructed displacement of the data fusion method in the case of different sampling rate ratios. Define the sampling rate ratio as
, where
is the acceleration sampling rate and
is the strain sampling rate.
was set to 1200 Hz, and
was set to 400, 60, and 24 Hz; that is, the sampling rate ratio
Scale was 3, 20, and 50, respectively. The
SNR of Gaussian white noise was still 100 dB.
Figure 11 shows the displacement time histories when
Scale = 50. Compared with
Figure 8, the degree of agreement between the two curves is decreased. This is because the increase in the ratio of sampling rates results in a longer measurement update interval, which in turn increases the error. Furthermore, the pseudo-static displacement error is larger than that of the high-frequency displacement; but in fact, the reduction in the strain sampling rate will not affect the reconstruction of the pseudo-static displacement since the strain corresponding to the pseudo-static displacement changes slowly. On the contrary, the reconstructed displacement accuracy of the high-frequency displacement is more limited by the strain sampling rate due to the rapid change in the corresponding strain. This situation occurs owing to the noise added in the acceleration and strain response is unreasonable.
Figure 12 is a comparison diagram of displacement time histories when the signal to noise ratio of acceleration and strain noise is different. This figure shows that the pseudo-static displacement error is small, and the high-frequency displacement error is large, which conforms to the previous judgment. Nevertheless, the parameter analysis is mainly aimed at the robustness of the algorithm, so the acceleration and strain noise levels remain consistent in the subsequent discussion.
Table 2 presents the NRMSs corresponding to the different sampling rate ratios. It can be seen that as the
Scale increases, NRMS also rises, which is because the displacement derived from the strain is needed to guide the correction process of the displacement in the correction phase of the Kalman filtering, the time interval of the correction phase will also become longer when the strain sampling rate is reduced, resulting in larger reconstruction errors. Even when the
Scale reaches 50, the NRMS is still only 2.7%, which shows that the proposed data fusion algorithm still has good robustness when the
Scale is large.
Different displacement reconstruction points may also be encountered in actual projects, and the signal to noise ratio of different measurement point positions when collecting signals is also different. Hence, ANSYS is used to extract acceleration and displacement responses at different positions for analysis and research.
Figure 13 is a comparison diagram between reconstructed and theoretical displacements at a distance of 0.2 m from the left support. The reconstruction accuracy of pseudo-static displacement and high-frequency displacement is slightly reduced as the measurement point is relatively close to the mode zero point of the first-order displacement mode of the structure, and the error of obtaining the displacement mode shape from the strain mode shape increases, which leads to a larger error of the strain-derived displacement.
Table 3 shows the NRMSs at different locations, which shows that the errors at 0.4, 0.6, and 0.8 m are very close except for the slight increase in NRMS at 0.2 m. Still, when the distance to the left support is only 0.2 m, the error is only 1.61%, indicating that the proposed data fusion algorithm can effectively reconstruct the displacement at a position closer to the left support.
In addition, we also compared the time required for the proposed method to process data of different durations (the sampling rate is 1200 Hz), and the results are shown in
Table 4. Obviously, the data processing time is far less than the data duration; therefore, the proposed method will not cause data stack and can achieve online reconstruction.


