Author Contributions
Conceptualization, K.J.C. and D.A.R.; Methodology, K.J.C. and D.A.R.; Software, K.J.C.; Validation, K.J.C. and D.A.R.; Formal Analysis, K.J.C. and D.A.R.; Investigation, K.J.C. and D.A.R.; Resources, K.J.C. and D.A.R.; Data Curation, K.J.C. and D.A.R.; Writing—Original Draft Preparation, K.J.C.; Writing—Review and Editing, K.J.C. and D.A.R.; Visualization, K.J.C.; Supervision, D.A.R.; Project Administration, D.A.R.; Funding Acquisition, D.A.R. All authors have read and agreed to the published version of the manuscript.
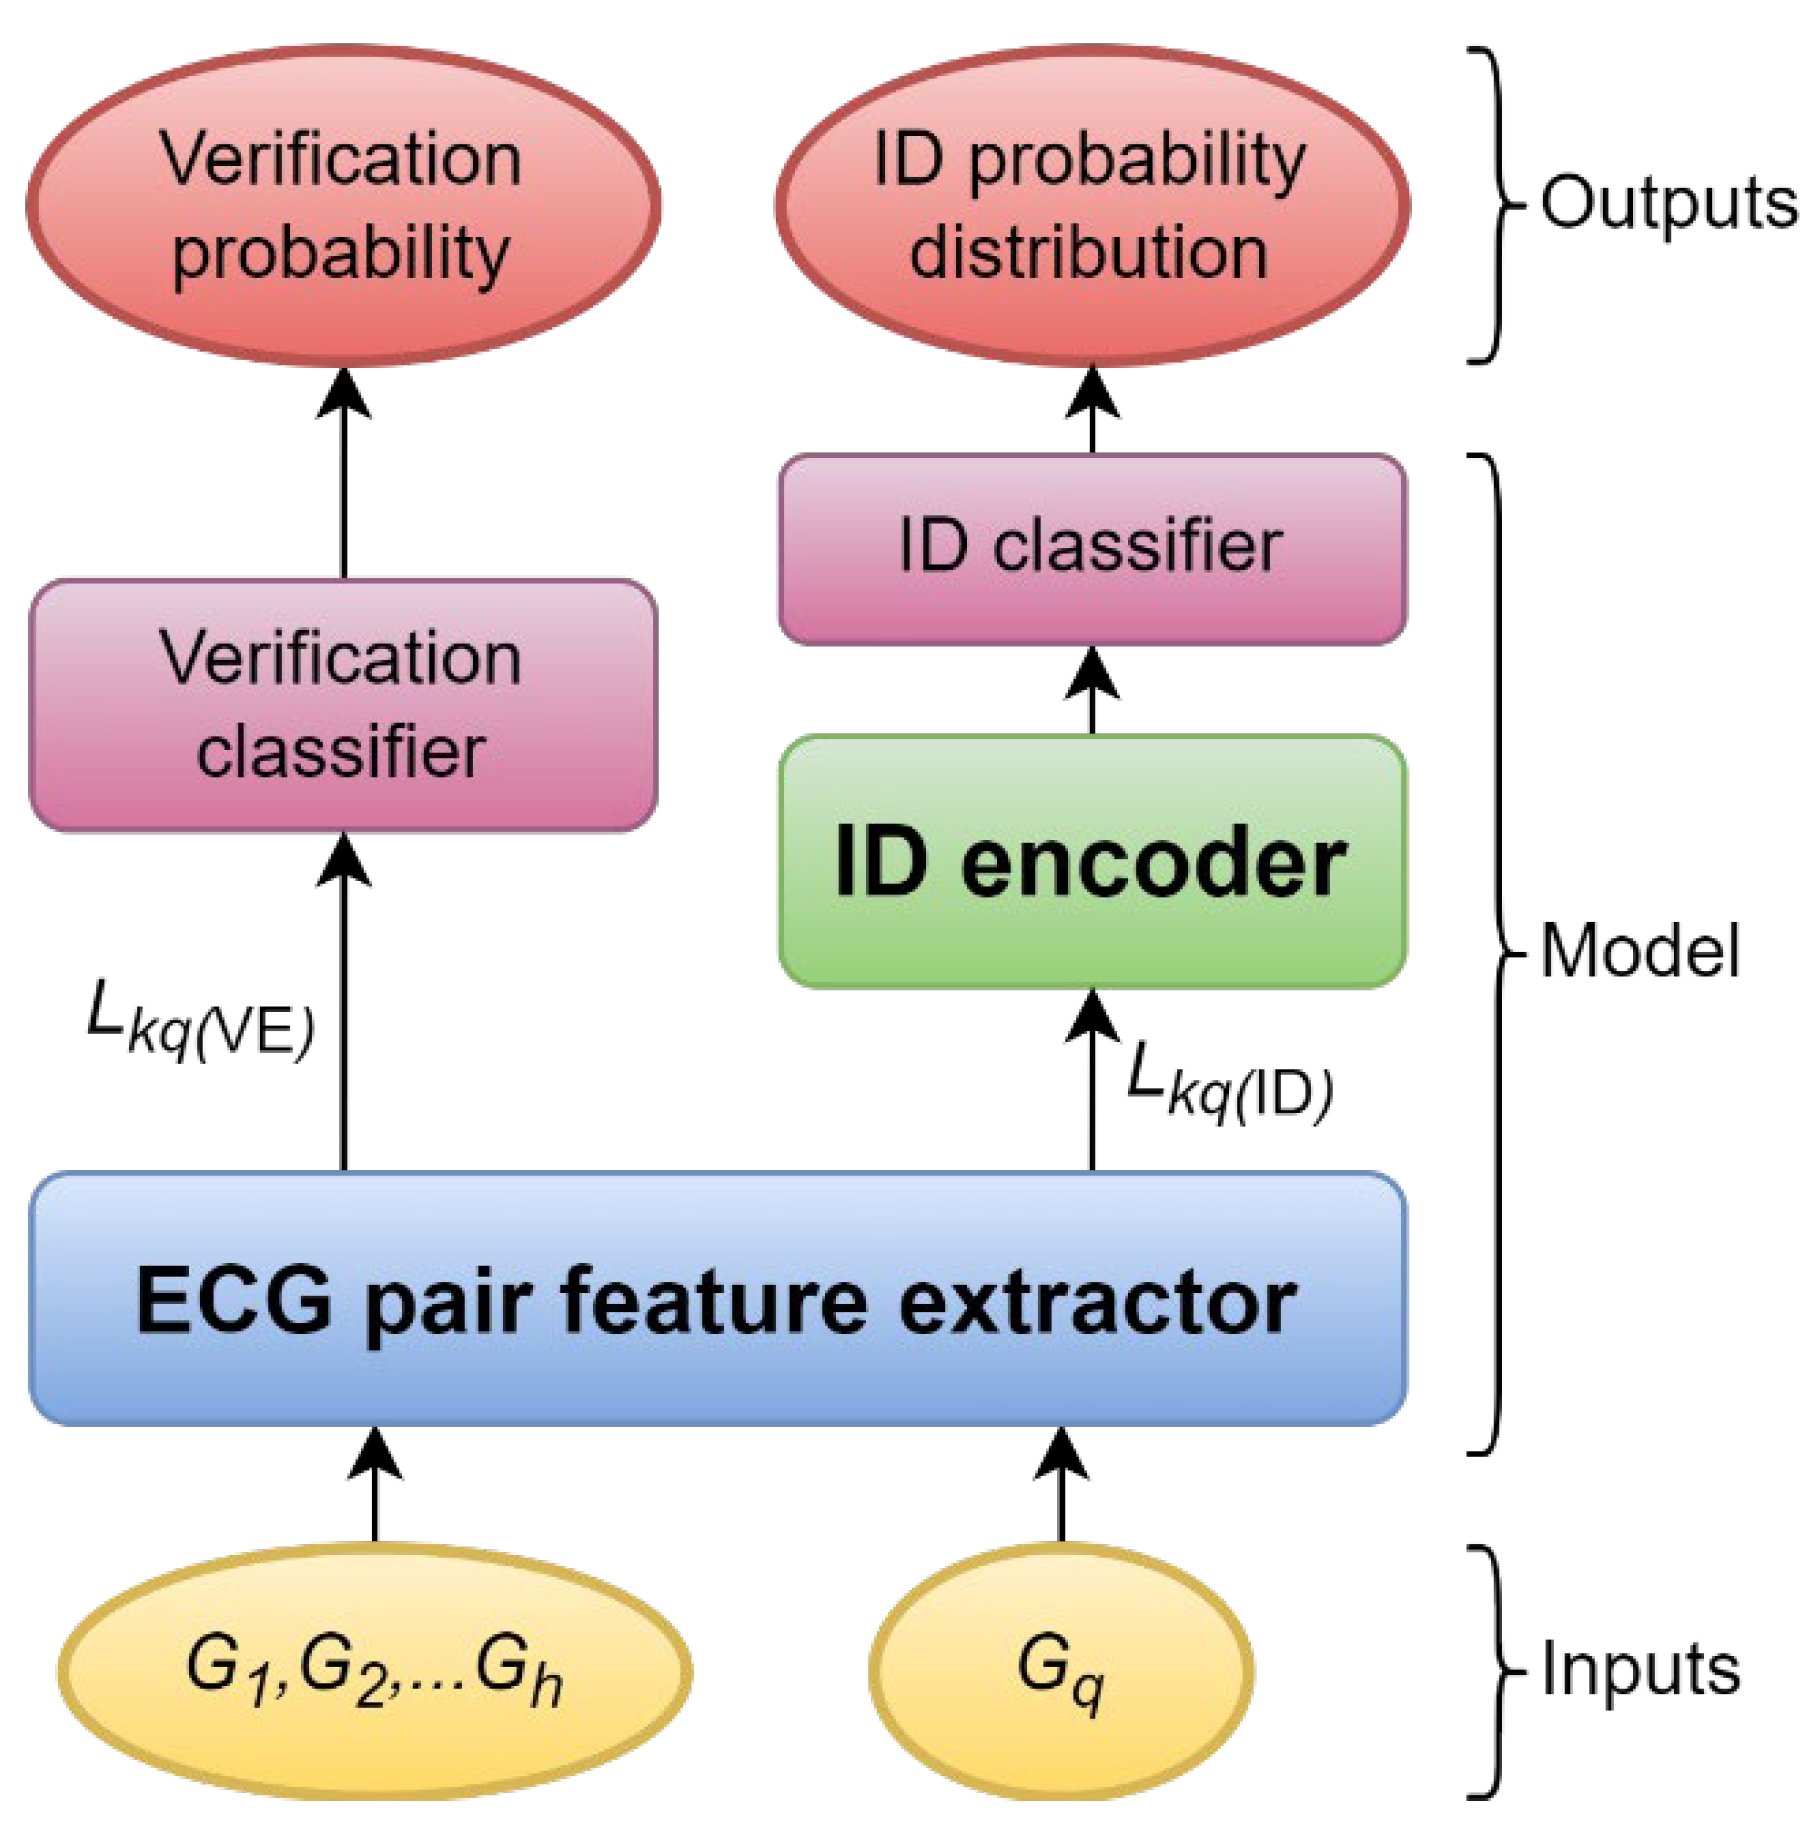
Figure 1.
An overview of the model design.
Figure 1.
An overview of the model design.
Figure 2.
ECG pair feature extractor.
Figure 2.
ECG pair feature extractor.
Figure 3.
A composite sequence consists of 2 classification tokens, an enrolled sequence, and the query sequence. is added to each element in resulting in . is added to each element in resulting in .
Figure 3.
A composite sequence consists of 2 classification tokens, an enrolled sequence, and the query sequence. is added to each element in resulting in . is added to each element in resulting in .
Figure 4.
The ECG pair encoder is adapted from Bidirectional Encoder Representations from Transformers (BERT)’s sequence pair encoder. It extracts joint features from the two input ECG sequences. are the final hidden states that correspond to respectively; are the final hidden states that correspond to respectively. is the final hidden state that correspond to ; is the final hidden state that correspond to .
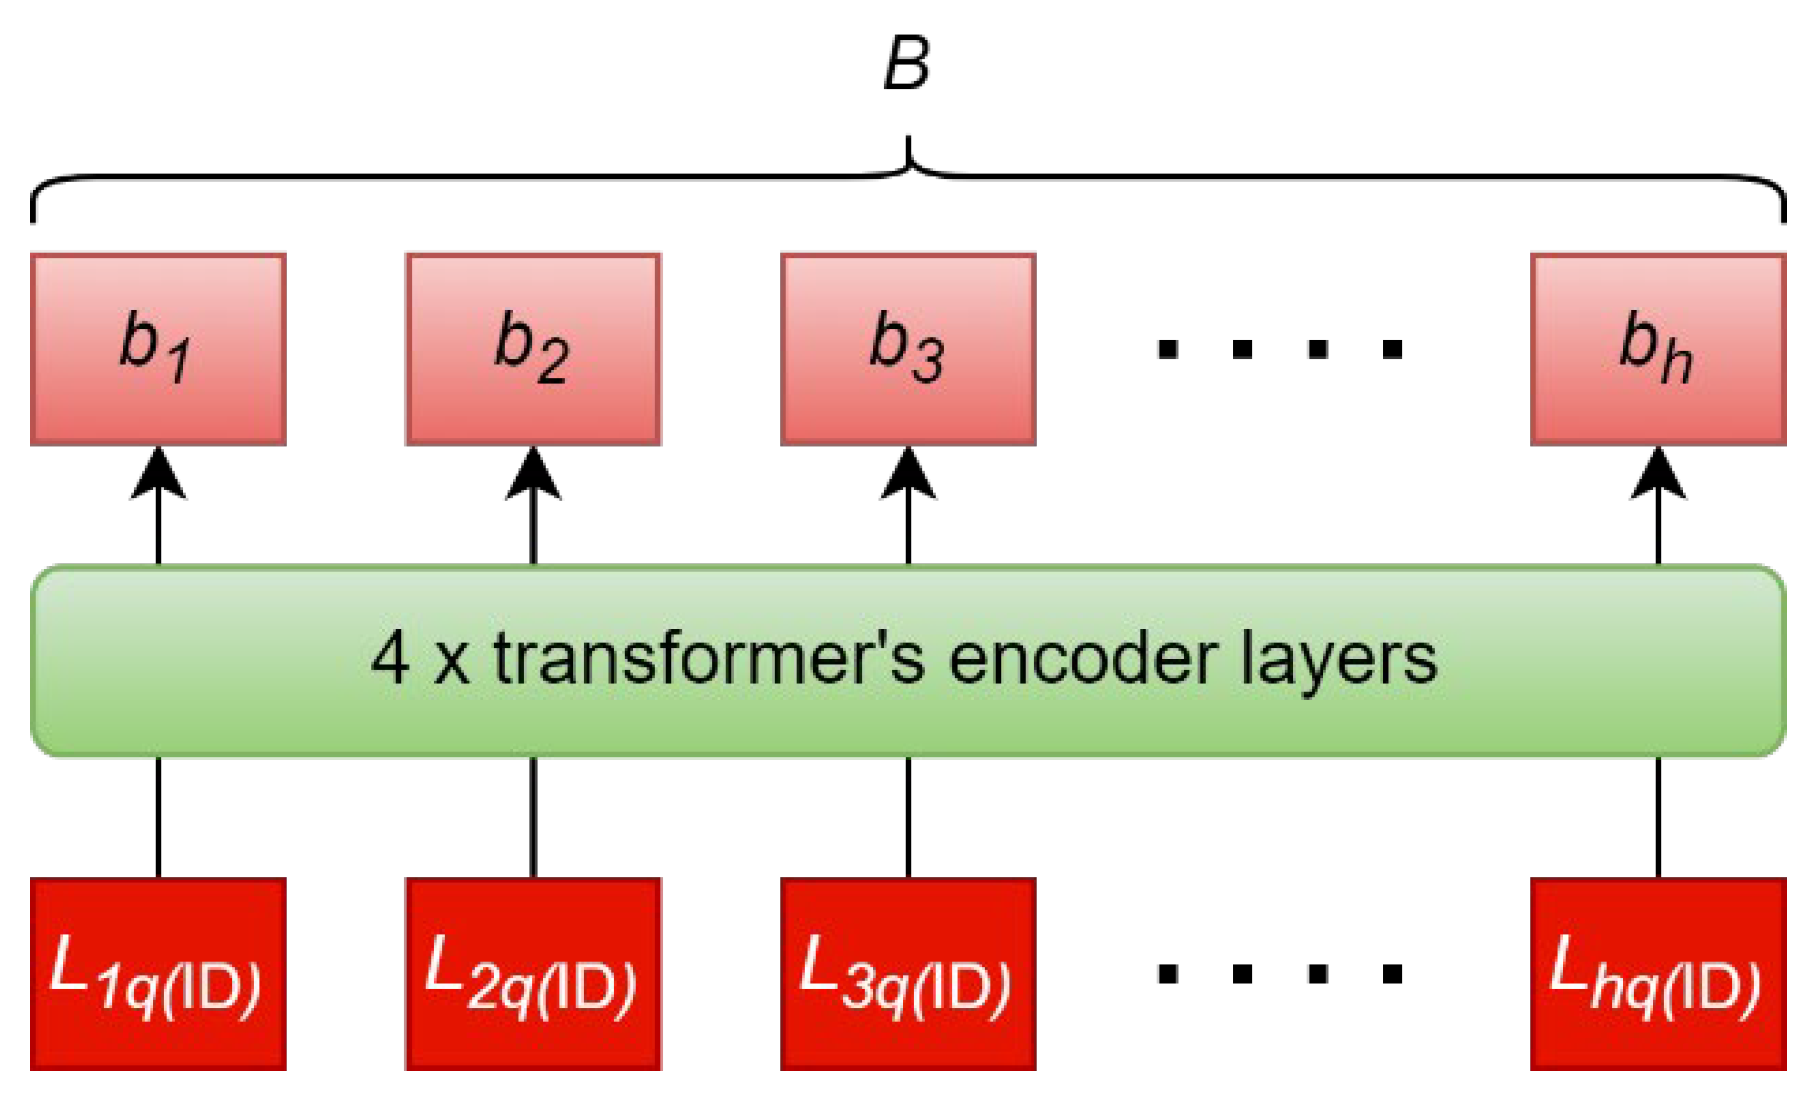
Figure 5.
All elements in form the input sequence to the ID encoder. The self-attention mechanism draws inter-identity relationships to produce the output sequence, . are the final hidden states that corresponds to enrolled identity 1, enrolled identity 2,…, enrolled identity .
Figure 5.
All elements in form the input sequence to the ID encoder. The self-attention mechanism draws inter-identity relationships to produce the output sequence, . are the final hidden states that corresponds to enrolled identity 1, enrolled identity 2,…, enrolled identity .
Figure 6.
(a) Losses are plotted against epoch throughout the training. (b) Combined accuracies are plotted against epoch throughout the training. A combined accuracy is the mean of the verification true positive rate (TPR), verification false positive rate (FPR), and the identification accuracy.
Figure 6.
(a) Losses are plotted against epoch throughout the training. (b) Combined accuracies are plotted against epoch throughout the training. A combined accuracy is the mean of the verification true positive rate (TPR), verification false positive rate (FPR), and the identification accuracy.
Figure 7.
A long ECG recording is divided into enrollment, time separation, and classification window.
Figure 7.
A long ECG recording is divided into enrollment, time separation, and classification window.
Table 1.
A summary of the related terminologies.
Table 1.
A summary of the related terminologies.
| Term | Alternative Term | Description |
|---|
| Enrollment | - | Registering a new ECG into the system |
| Classification | - | Referring to both verification and identification |
| Query | - | ECG used for classification |
| Classification scope | Closed set [18]
Gallery [17]
Gallery set [15,16] | Collection of enrolled ECGs to be considered during a classification |
| Individual verification | - | Classifying whether the query matches 1 claimed identity |
| Scope verification | Identity verification [18]
Set verification [15,16] | Classifying whether the query matches identities in the classification scope |
| Closed identification | - | Identification with the assumption that the query must match 1 identity within the classification scope |
| Opened identification | - | Closed identification + scope verification |
Table 2.
A summary of the evaluation metrics.
Table 2.
A summary of the evaluation metrics.
| Metric | Alternative Term | Formula/Description |
|---|
| True positive rate (TPR) | True acceptance rate [2]
Genuine acceptance rate [19]
Recall [4,17]
Sensitivity [20] | [2,4] |
| False positive rate (FPR) | False acceptance rate [2,14,17,19] | [2,4] |
| True negative rate (TNR) | Specificity [17,20] | [20] |
| False negative rate (FNR) | False rejection rate [4] | [4] |
| Equal error rate (EER) [14,19,20] | - | [14] |
| Receiver operating characteristics (ROC) | - | Graph of TPR against FPR [19] |
| Identification accuracy [5,20] | Identification rate [3,17]
Recognition accuracy [6] | Rate of correct identification [5] |
Table 3.
A summary of the related works.
Table 3.
A summary of the related works.
| Author | Segmentation | Feature | Classification | Data Source | Scope Size | Classification Type | Enrollment to Classification Time | Enrollment Length | Classification Length |
|---|
| [1] | No need | Fiducial | SIMCA | Private | 20 | Identification | Not specified | Not specified | Not specified |
| [11] | No need | DWT | Correlation coefficient | Public | 18–48 | Identification | Not specified | Not specified | Not specified |
| [8] | Heartbeat | Fiducial | Similarity thresholding | Public | 73 | Verification | Not specified | 30 s | 4 s |
| [14] | R-R and R-peak with fixed length | Fiducial and DWT | Euclidean distance and DTW | Public | 20–1119 | Verification | Not specified | 10 segments | Vary depends on database |
| [19] | Heartbeat | Fiducial | PCA and Euclidean distance | Public | 100 | Verification | Not specified | 30 s | 30 s |
| [5] | R-peak with fixed length | Fiducial and DWT | Random forest and wavelet distance | Public | 18–89 | Identification | Not specified | 67% of extracted heartbeats | 1 heartbeat |
| [21] | R-peak with fixed length | Learned | CNN | Public | 18–23 | Identification | Not specified | 100 heartbeats | 3 heartbeats |
| [6] | Blind with fixed length | Multi-domain, MFCC, FFT, DCT, Teager, etc. | Channel attention module (CNN) | Public | 50–89 | Identification | Avg. 63 days for PTBDB, avg. 9 days for EDGIDDB | 40 s | 4 s |
| [2] | Heartbeat | DWT | NEWFM | Public | 73 | Verification | Not specified | 15 heartbeats | 1 heartbeat |
| [3] | Blind with fixed length | Learned | CNN | Private | 1019 | Identification | maximum 6 months | Not specified | 5 s |
| [20] | R-peak with fixed length | Learned | Neural network | Public | 90 | Verification | 9 days for EDGIDDB | Not specified | Not specified |
| [4] | Blind with fixed length | Fiducial | Random forest | Public | 1985 | Verification | Not specified | 1 m | 3 s |
| [22] | R-peak with fixed length | Learned | RNN | Public | 47–89 | Identification | Not specified | 18 heartbeats | 18 heartbeats |
| [23] | Blind with fixed length | DWT | CNN | Public | 18–47 | Identification | Not specified | 250 × 2-s segments | 1 × 2-s segment |
| [18] | R-peak with fixed length | Learned | CNN | Public | 52 | Identification | Not specified | 10 s | 10 s |
Table 4.
ECG databases used to generate training and validation datasets.
Table 4.
ECG databases used to generate training and validation datasets.
| Database | Name | Health Condition | Length | Training-Validation Split Ratio |
|---|
| APNEA-ECG | Apnea-ECG Database | Apnea | 7–10 h | 38:32 |
| LTAFDB | Long Term AF Database | Paroxysmal or sustained atrial fibrillation | 24–25 h | 48:32 |
| MITDB | MIT-BIH Arrhythmia Database | Arrhythmia | 0.5 h | 31:16 |
| LTDB | MIT-BIH Long-Term ECG Database | Unspecified | 14–22 h | 6:1 |
| VFDB | MIT-BIH Malignant Ventricular Ectopy Database | Ventricular tachycardia, ventricular flutter, and ventricular fibrillation | 0.5 h | 14:8 |
| SLPDB | MIT-BIH Polysomnographic Database | Apnea | 80 h | 8:8 |
| SVDB | MIT-BIH Supraventricular Arrhythmia Database | Supraventricular arrhythmia | 0.5 h | 46:32 |
| INCARTDB | St Petersburg INCART 12-lead Arrhythmia Database | Various diagnosis | 0.5 h | 43:32 |
| FANTASIA | Fantasia Database | Healthy | 2 h | 24:16 |
| PTB-XL | PTB-XL, a large publicly available electrocardiography dataset | Mix of healthy and various heart conditions | 10 s | 18,853:32 |
Table 5.
ECG databases used for testing.
Table 5.
ECG databases used for testing.
| Database | Name | Total People | Description |
|---|
| AFDB | MIT-BIH Atrial Fibrillation Database [39] | 23 | Each person has 1 recording. Each recording is at least 8 h long. |
| NSRDB | MIT-BIH Normal Sinus Rhythm Database [35] | 18 | Each person has 1 recording. Each recording is at least 8 h long. |
| STDB | MIT-BIH ST Change Database [40] | 28 | Each person has 1 recording. Each recording is at least 12 min long. |
| CEBSDB | Combined measurement of ECG, Breathing, and Seismocardiography [41] | 20 | Each person has 3 recordings measured in different positions which sum up to at least 55 min long. |
| PTBDB | PTB Diagnostic ECG Database | 290 | 112 people have 2 or more recordings with valid time label |
| ECGIDDB | ECG-ID Database | 90 | 89 people have 2 or more recordings with valid time label |
Table 6.
Variables used for short time separation test.
Table 6.
Variables used for short time separation test.
| Database | (s)
| | (s)
| (s)
| | |
|---|
| APNEA-ECG | 32 | 12 | 0 | 256 | 64 | 23 |
| LTAFDB | 32 | 12 | 0 | 256 | 64 | 20 |
| MITDB | 32 | 12 | 0 | 256 | 64 | 18 |
| LTDB | 32 | 12 | 0 | 256 | 64 | 28 |
| VFDB | 20 | 8 | - | 20 | 4 | 89 |
| SLPDB | 32 | 12 | - | 32 | 8 | 112 |
Table 7.
Variables used for long time separation test.
Table 7.
Variables used for long time separation test.
| Database | (s)
| | (s)
| | | (s)
|
|---|
| ECGIDDB | 20 | 8 | 20 | 4 | 89 | 20 |
| PTBDB | 32 | 12 | 32–56 | 8 | 112 | 32 |
Table 8.
Variables used for all time separation test.
Table 8.
Variables used for all time separation test.
| Database | (s)
| | (s)
| | |
|---|
| AFDB | 32 | 12 | 256 | 8 | 23 |
| CEBSDB | 32 | 12 | 32 | 4 | 20 |
| NSRDB | 32 | 12 | 256 | 8 | 18 |
| STDB | 32 | 12 | 32 | 4 | 28 |
Table 9.
Metrics used to evaluate the model performance.
Table 9.
Metrics used to evaluate the model performance.
| Performance | Metrics |
|---|
| Individual verification | TPR when FPR is at 1%, 5%, and 10% |
| EER |
| Area under ROC curve |
| Scope verification | TPR when FPR is at 10%, 20%, and 30% |
| EER |
| Area under ROC curve |
| Closed identification | Accuracy |
Table 10.
Performance over short time separation. h: total number of people, TPR: true positive rate, FPR: false positive rate, EER: equal error rate, ID: identification, ROC: receiver operating characteristics.
Table 10.
Performance over short time separation. h: total number of people, TPR: true positive rate, FPR: false positive rate, EER: equal error rate, ID: identification, ROC: receiver operating characteristics.
| Database | | Individual Verification | Scope Verification | ID Accuracy (%) |
|---|
| TPR (%) When FPR Is at | EER (%) | Area under ROC | TPR (%) When FPR Is at | EER (%) | Area under ROC |
|---|
| 1% | 5% | 10% | 10% | 20% | 30% |
|---|
| AFDB | 23 | 91.17 | 97.35 | 98.70 | 3.44 | 0.9926 | 87.09 | 91.85 | 94.70 | 12.06 | 0.9454 | 96.20 |
| CEBSDB | 20 | 100.00 | 100.00 | 100.00 | 0.29 | 0.9989 | 100.00 | 100.00 | 100.00 | 6.41 | 0.9794 | 100.00 |
| NSRDB | 18 | 99.74 | 100.00 | 100.00 | 0.87 | 0.9979 | 97.83 | 99.74 | 100.00 | 6.38 | 0.9654 | 99.91 |
| STDB | 28 | 92.80 | 98.60 | 99.27 | 3.00 | 0.9956 | 90.90 | 92.97 | 95.20 | 9.32 | 0.9640 | 96.09 |
| ECGIDDB | 89 | 97.75 | 98.88 | 99.72 | 1.97 | 0.9966 | 83.15 | 95.22 | 97.19 | 15.03 | 0.9226 | 96.35 |
| PTBDB | 112 | 98.33 | 99.42 | 99.78 | 1.56 | 0.9984 | 95.31 | 98.21 | 98.77 | 8.54 | 0.9689 | 98.10 |
Table 11.
Performance over long time separation.
Table 11.
Performance over long time separation.
| Database | | Individual Verification | Scope Verification | ID Accuracy (%) |
|---|
| TPR (%) When FPR Is at | EER (%) | Area Uder ROC | TPR (%) When FPR Is at | EER (%) | Area Under ROC |
|---|
| 1% | 5% | 10% | 10% | 20% | 30% |
|---|
| ECGIDDB | 89 | 94.94 | 98.60 | 98.88 | 1.97 | 0.9885 | 64.89 | 89.89 | 93.54 | 17.56 | 0.9009 | 92.70 |
| PTBDB | 112 | 69.47 | 81.86 | 90.27 | 10.19 | 0.9460 | 49.78 | 63.94 | 74.34 | 27.43 | 0.7852 | 64.16 |
Table 12.
Performance comparison of individual verification over short time separation.
Table 12.
Performance comparison of individual verification over short time separation.
| Database | Methods | | FPR (%) | FNR (%) | EER (%) |
|---|
| CEBSDB | Ingale et al. [14] | 20 | 0.00 | 0.00 | 0.00 |
| Ours | 20 | 0.92 | 0.00 | 0.29 |
| ECGIDDB | Ingale et al. [14] | 89 | 1.86 | 0.00 | 2.00 |
| Salloum et al. [22] | 18 | - | - | 0.00 |
| Ours | 89 | 2.50 | 1.69 | 1.97 |
| PTBDB | Ingale et al. [14] | 290 | 0.59 | 0.00 | 0.50 |
| Pal et al. [19] | 100 | 1.63 | 10.00 | 2.88 |
| Ours | 112 | 0.85 | 1.79 | 1.56 |
Table 13.
Performance comparison of individual verification over short time separation.
Table 13.
Performance comparison of individual verification over short time separation.
| Database | Methods | | FPR (%) |
|---|
| CEBSDB | Zhang et al. [23] | 23 | 93.90 |
| Li et al. [21] | 23 | 90.90 |
| Ours | 23 | 96.20 |
| ECGIDDB | Zhang et al. [23] | 20 | 99.00 |
| Li et al. [21] | 20 | 95.00 |
| Ours | 20 | 100.00 |
| NSRDB | Tan et al. [5] | 18 | 99.98 |
| Zhang et al. [23] | 18 | 95.10 |
| Li et al. [21] | 18 | 96.10 |
| Ours | 18 | 99.91 |
| STDB | Zhang et al. [23] | 28 | 90.30 |
| Li et al. [21] | 28 | 95.20 |
| Ours | 28 | 96.09 |
| ECGIDDB | Sellami et al. [11] | 40 | 92.50 |
| Salloum et al. [22] | 89 | 97.00 |
| Tan et al. [5] | 89 | 98.79 |
| Ours | 89 | 96.35 |
| PTBDB | Labati et al. [18] | 52 | 100.00 |
| Ours | 112 | 98.10 |
Table 14.
Performance comparison of individual verification over long time separation.
Table 14.
Performance comparison of individual verification over long time separation.
| Database | Methods | | ID Accuracy (%) |
|---|
| ECGIDDB | Sun et al. [6] | 89 | 85.94 |
| Ours | 89 | 92.70 |
| PTBDB | Sun et al. [6] | 50+ | 56.93 |
| Ours | 112 | 64.16 |


