Article

Fluctuation of Plasmonically Induced Transparency Peaks within Multi-Rectangle Resonators

1
Xinjiang Laboratory of Phase Transitions and Microstructures in Condensed Matters, College of Physical Science and Technology, Yili Normal University, Yining 835000, China
2
State Key Laboratory of Millimeter Waves, Southeast University, Nanjing 210096, China
3
School of Physics and New Energy, Xuzhou University of Technology, Xuzhou 221018, China
4
School of Science, Jiangnan University, Wuxi 214122, China
*
Author to whom correspondence should be addressed.
Sensors 2023, 23(1), 226; https://doi.org/10.3390/s23010226
Submission received: 31 October 2022 / Revised: 12 December 2022 / Accepted: 21 December 2022 / Published: 26 December 2022
(This article belongs to the Section Nanosensors)

Abstract

:
Numerical investigations were conducted of the plasmonically induced transparency (PIT) effect observed in a metal–insulator–metal waveguide coupled to asymmetric three-rectangle resonators, wherein, of the two PIT peaks that were generated, one PIT peak fell while the other PIT peak rose. PIT has been widely studied due to its sensing, slow light, and nonlinear effects, and it has a high potential for use in optical communication systems. To gain a better understanding of the PIT effect in multi-rectangle resonators, its corresponding properties, effects, and performance were numerically investigated based on PIT peak fluctuations. By modifying geometric parameters and filling dielectrics, we not only realized the off-to-on PIT optical response within single or double peaks but also obtained the peak fluctuation. Furthermore, our findings were found to be consistent with those of finite element simulations. These proposed structures have wide potential for use in sensing applications.

1. Introduction

Surface plasmon polaritons (SPPs) are transverse electromagnetic waves [1] that result from collective oscillations between photons and free electrons, and they can be confined and spread along metal and dielectric surfaces [2,3,4]. SPPs have recently received increased attention for two reasons. First, SPPs can overcome light diffraction [5]. Second, they can manipulate light at sub-wavelength scales [6,7]. To date, numerous numerical simulations and experiments have been conducted on optical elements based on SPPs. From these studies, two representative plasmonic structures, insulator–metal–insulator (IMI) structures and metal–insulator–metal (MIM) structures, were found to be essential as optical components. Furthermore, SPPs-based IMI structures positively contribute to energy loss over long transmission distances. Because the light is limited to sub-wavelength scales, IMI structures are not suitable as high-integration-degree optical components. However, the unique structure of MIMs allows for deep sub-wavelength scales and high group velocity over a wide frequency range, in addition to also providing high optical confinement and acceptable propagation length [8]. As a result, MIM structures can be used in a variety of applications, including in optical filters [9], optical switches [10,11,12,13], Mach–Zehnder interferometers [14,15], demultiplexers [16], and nanosensors [17,18,19,20,21].
EIT is a well-known physical phenomenon that occurs in a coherently driven atomic system and can significantly suppress the absorption behavior of detection light within a narrow spectral range, resulting in a narrow, transparent window in the transmission spectrum [22,23]. Therefore, EIT is a promising candidate for a variety of applications such as signal processing [24,25], nanobiosensors [26], and optical data storage [27]. Plasmonically induced transparency (PIT) is a novel phenomenon with some properties that allow it to outperform EIT in some ways. Furthermore, because of its room-temperature manipulation, large bandwidth, and integration with nanoplasmonic circuits [28,29], PIT offers convenient and selective operation options. For example, EIT has been demonstrated through interaction with a wide silver line as a bright pattern and a pair of narrow silver lines as a dark pattern. The PIT phenomenon was caused by near-field coupling between light and dark modes in this structure. Liu et al. [30] developed an MIM with multiple rectangular resonators. Based on this, multiple plasma-induced transparent peaks and a controllable number of transparent peaks were achieved by adjusting the geometric parameters [31,32,33,34,35,36,37,38,39].
Previously, only a few studies have looked into the simultaneous and opposed adjustment of PIT peaks in same-order modes. As a result, modified modes based on traditional symmetric resonators were proposed [40]. In contrast to the plasma-induced transparency of the previous traditional structure, asymmetrical multi-rectangle resonators can not only achieve single or multiple induced transparency peaks but also realize energy-coupled path change [41,42,43,44,45,46]. As a result, the modulation parameters cause two transmission peaks in the same state to alternate.
In this study, a classic PIT structure was used as the basis for forming a MIM bus waveguide coupled to asymmetric three-rectangle resonators, and the corresponding influences were numerically investigated. The relationships between the PIT optical response and the widths, heights, refractive index, and location of the double transmission peaks of the three cavities were also thoroughly investigated. According to our findings, peak fluctuation in one same-order mode was observed, which was caused by the change in the energy coupling pathway. Numerical simulations performed by the commercial finite element method (FEM) software COMSOL Multiphysics demonstrated our theoretical analysis.

2. Model and Theoretical Analysis

Shown in Figure 1 is the schematic representation of the two-dimensional plasmonic filter structure comprising an MIM waveguide with side-coupled multi-rectangle resonators. The width of the MIM waveguide is set to w = 50 nm. The input and output ports are numbered 1 and 2, respectively. The insulators in the white areas are assumed to be air, and its refractive index is 1 (εi = 1). Cavity I, cavity II, and cavity III are the names of the three resonators. The rectangular resonator’s height, width, and coupling distance are hi (i = 1, 2, 3), wi (i = 1, 2, 3), and t, respectively. The distances from the three cavities to the main waveguide are all set as t = 20 nm. The distance between cavity I and cavity II is set as d = 20 nm. As shown in Figure 1, silver is used as the metal to fill the dark area. Silver’s relative permittivity is proportional to the frequency of incident light, and its dielectric constant can be calculated using the well-known Drude model [47]:
ε m ( ω ) = ε ω p 2 ω ( ω + i γ )
In Equation (1), ε = 3.7 denotes the infinite-frequency dielectric constant, γ = 2.73 × 10¹³ Hz denotes the electron collision frequency, ωp = 1.38 × 10¹⁶ Hz denotes the bulk plasma frequency, and the angular frequency of incident electromagnetic radiation is denoted by ω. All structural slits mentioned in this paper have a width of 50 nm. Because the incident wavelength is greater than w, only the basic plasmon mode TM0 can exist in the waveguide structure. The constant for incident light propagation can be calculated using the following equation [48]:
tanh ( w β 2 k 0 2 ε i 2 ) = ε i β 2 k 0 2 ε m ( ω ) ε m ( ω ) β 2 k 0 2 ε i
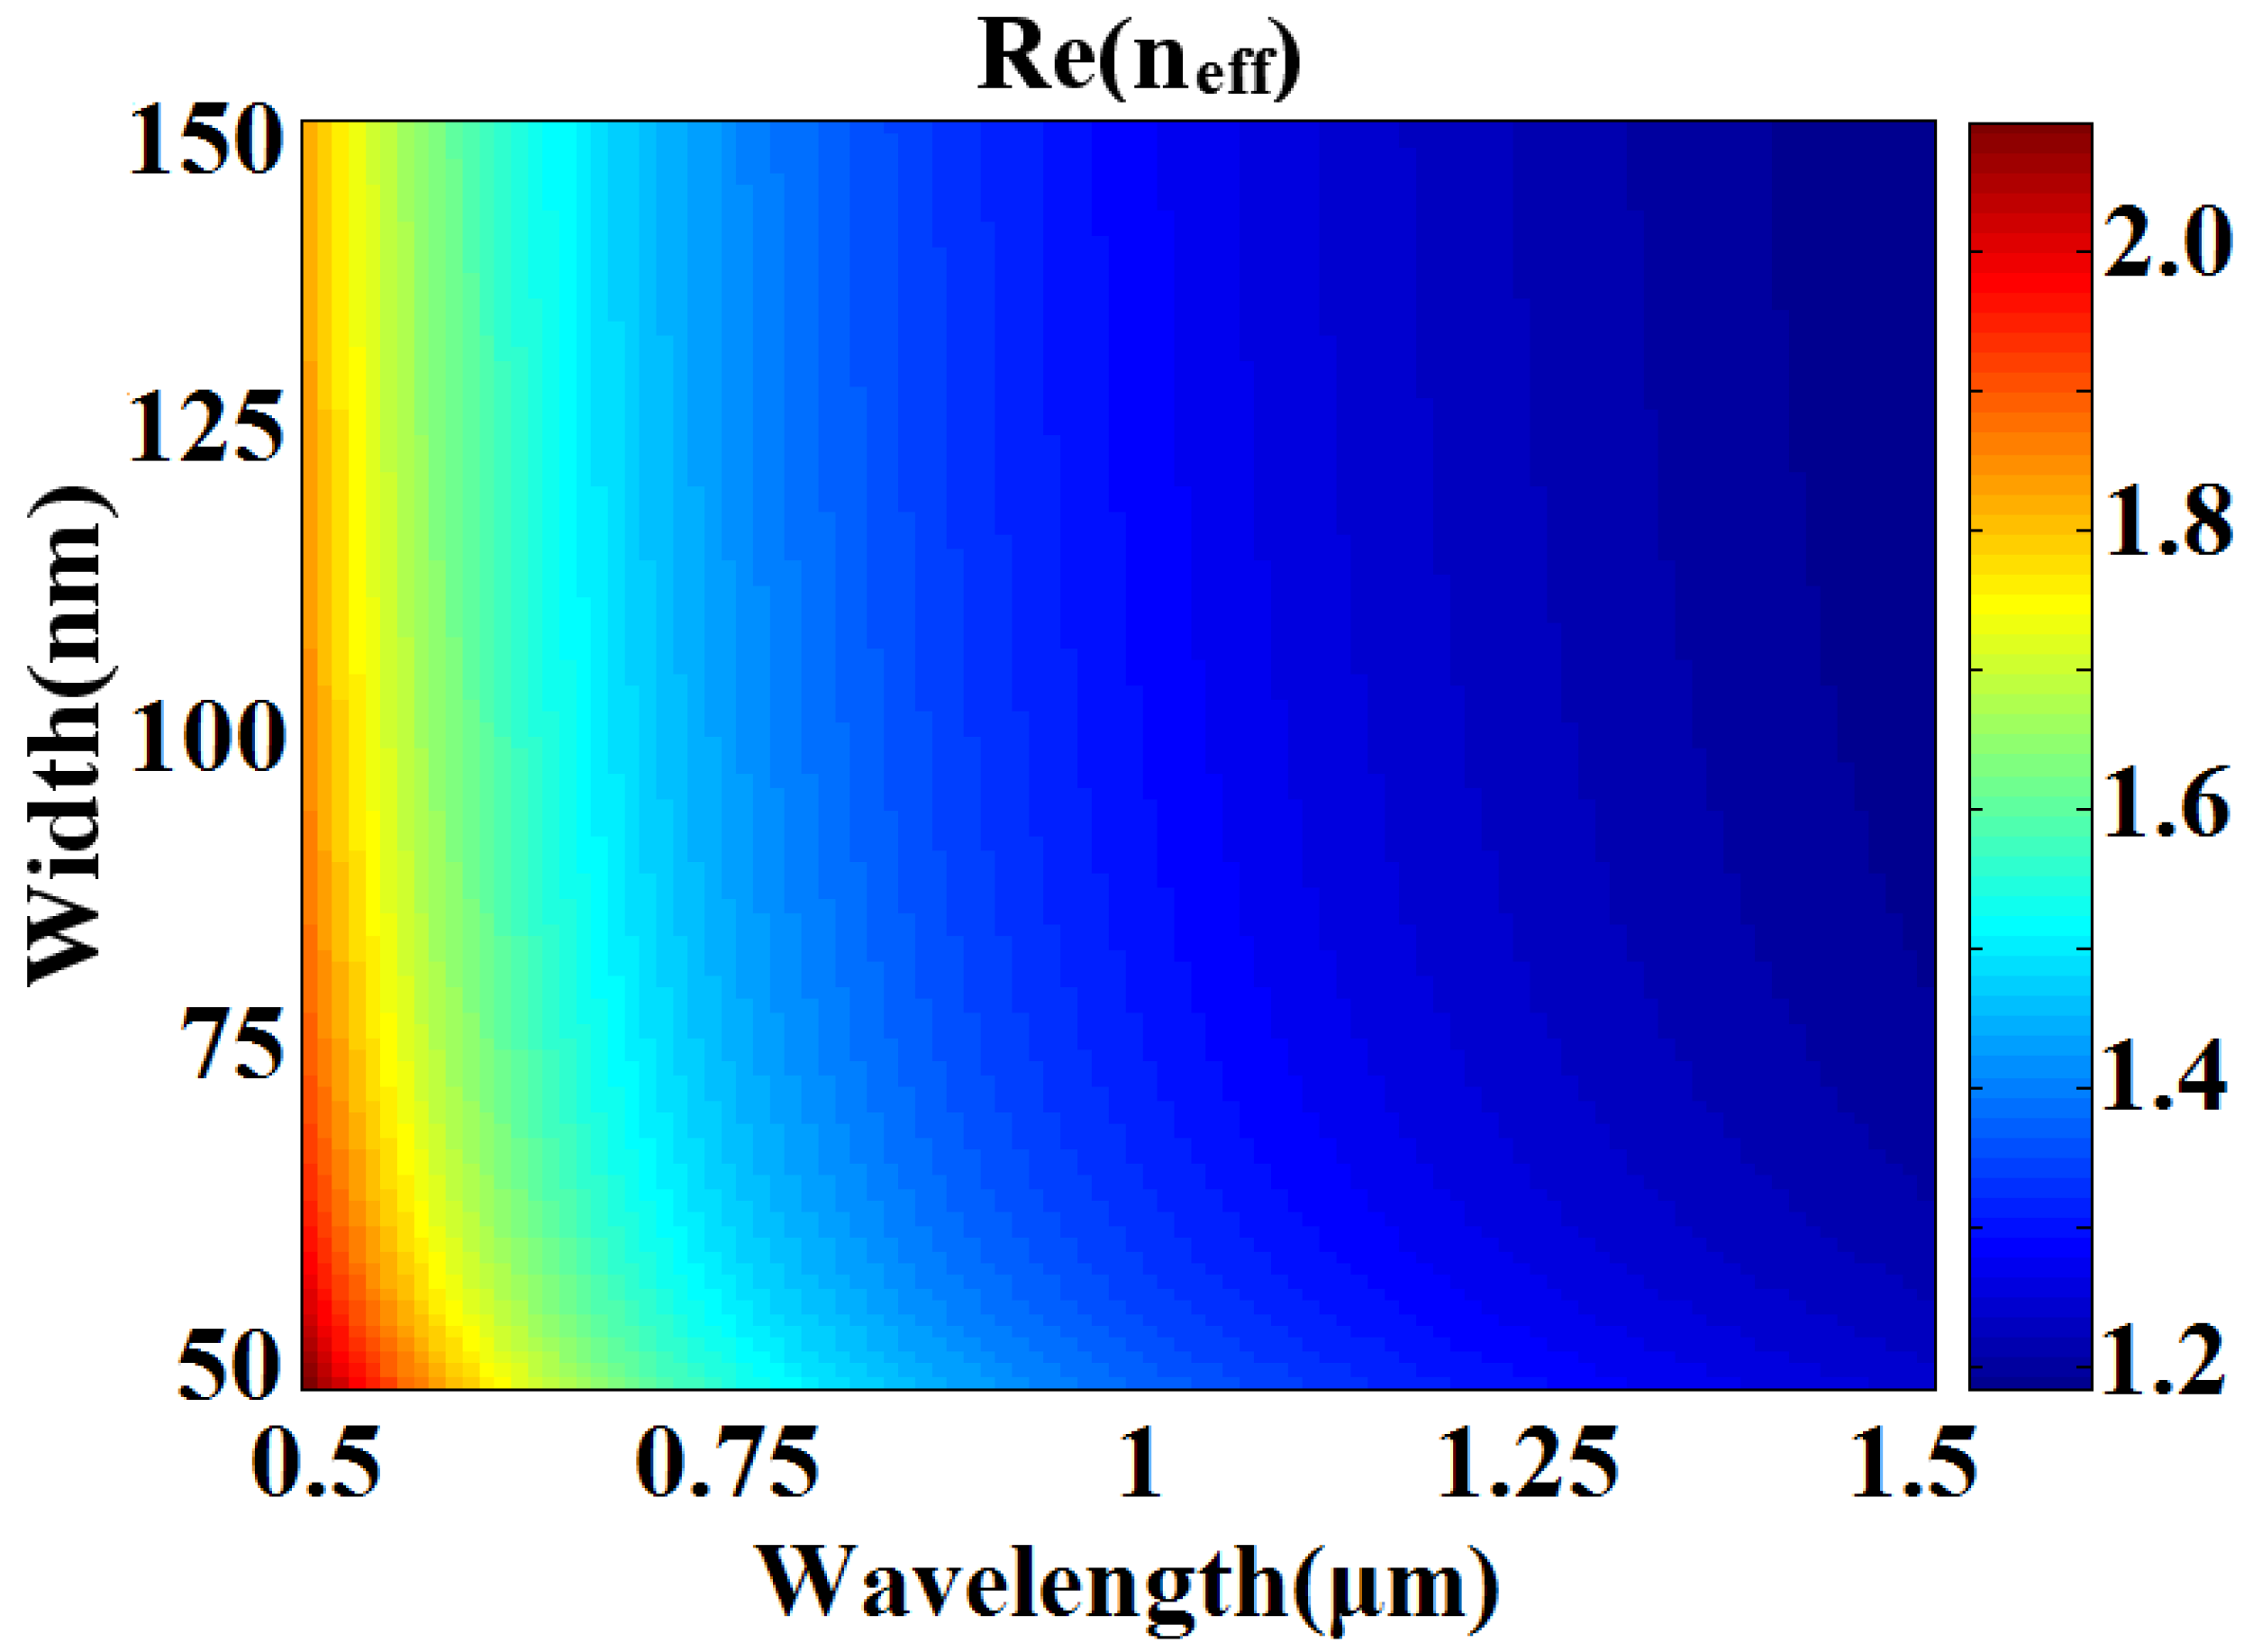
In Equation (2), εm and εi are the dielectric constants of silver and air, respectively. Under a vacuum, the wave vector of light is λ0. It is possible to obtain neff = β/k0 using Equation (2). Figure 2 depicts the real part of neff as a function of d and λ. Once w is determined, Re (neff) can be kept constant for various incident wavelengths.
When incident light passes through this designed structure, one portion is coupled into the resonator while the remainder is reflected and transmitted. Coupled-mode theory can be used to describe the transmission spectrum near the resonant mode, and transmission T can be mathematically expressed as in Equation (3):
T ( ω ) = ( ω ω 0 ) 2 + ( 1 / τ i ) 2 ( ω ω 0 ) 2 + ( 1 / τ i + 1 / τ ω ) 2
In Equation (3), ω and ω0 represent the incident light frequency and the resonance frequency, respectively. The decay rates of the nanocavity internal loss and power that escapes through the waveguide are represented by 1/τi and 1/τω, respectively. Tmin = (1/τi)2/(1/τi + 1/τω)2 at the resonance frequency ω0 can thus be used to calculate the minimum transmission ratio.

3. Results and Discussions

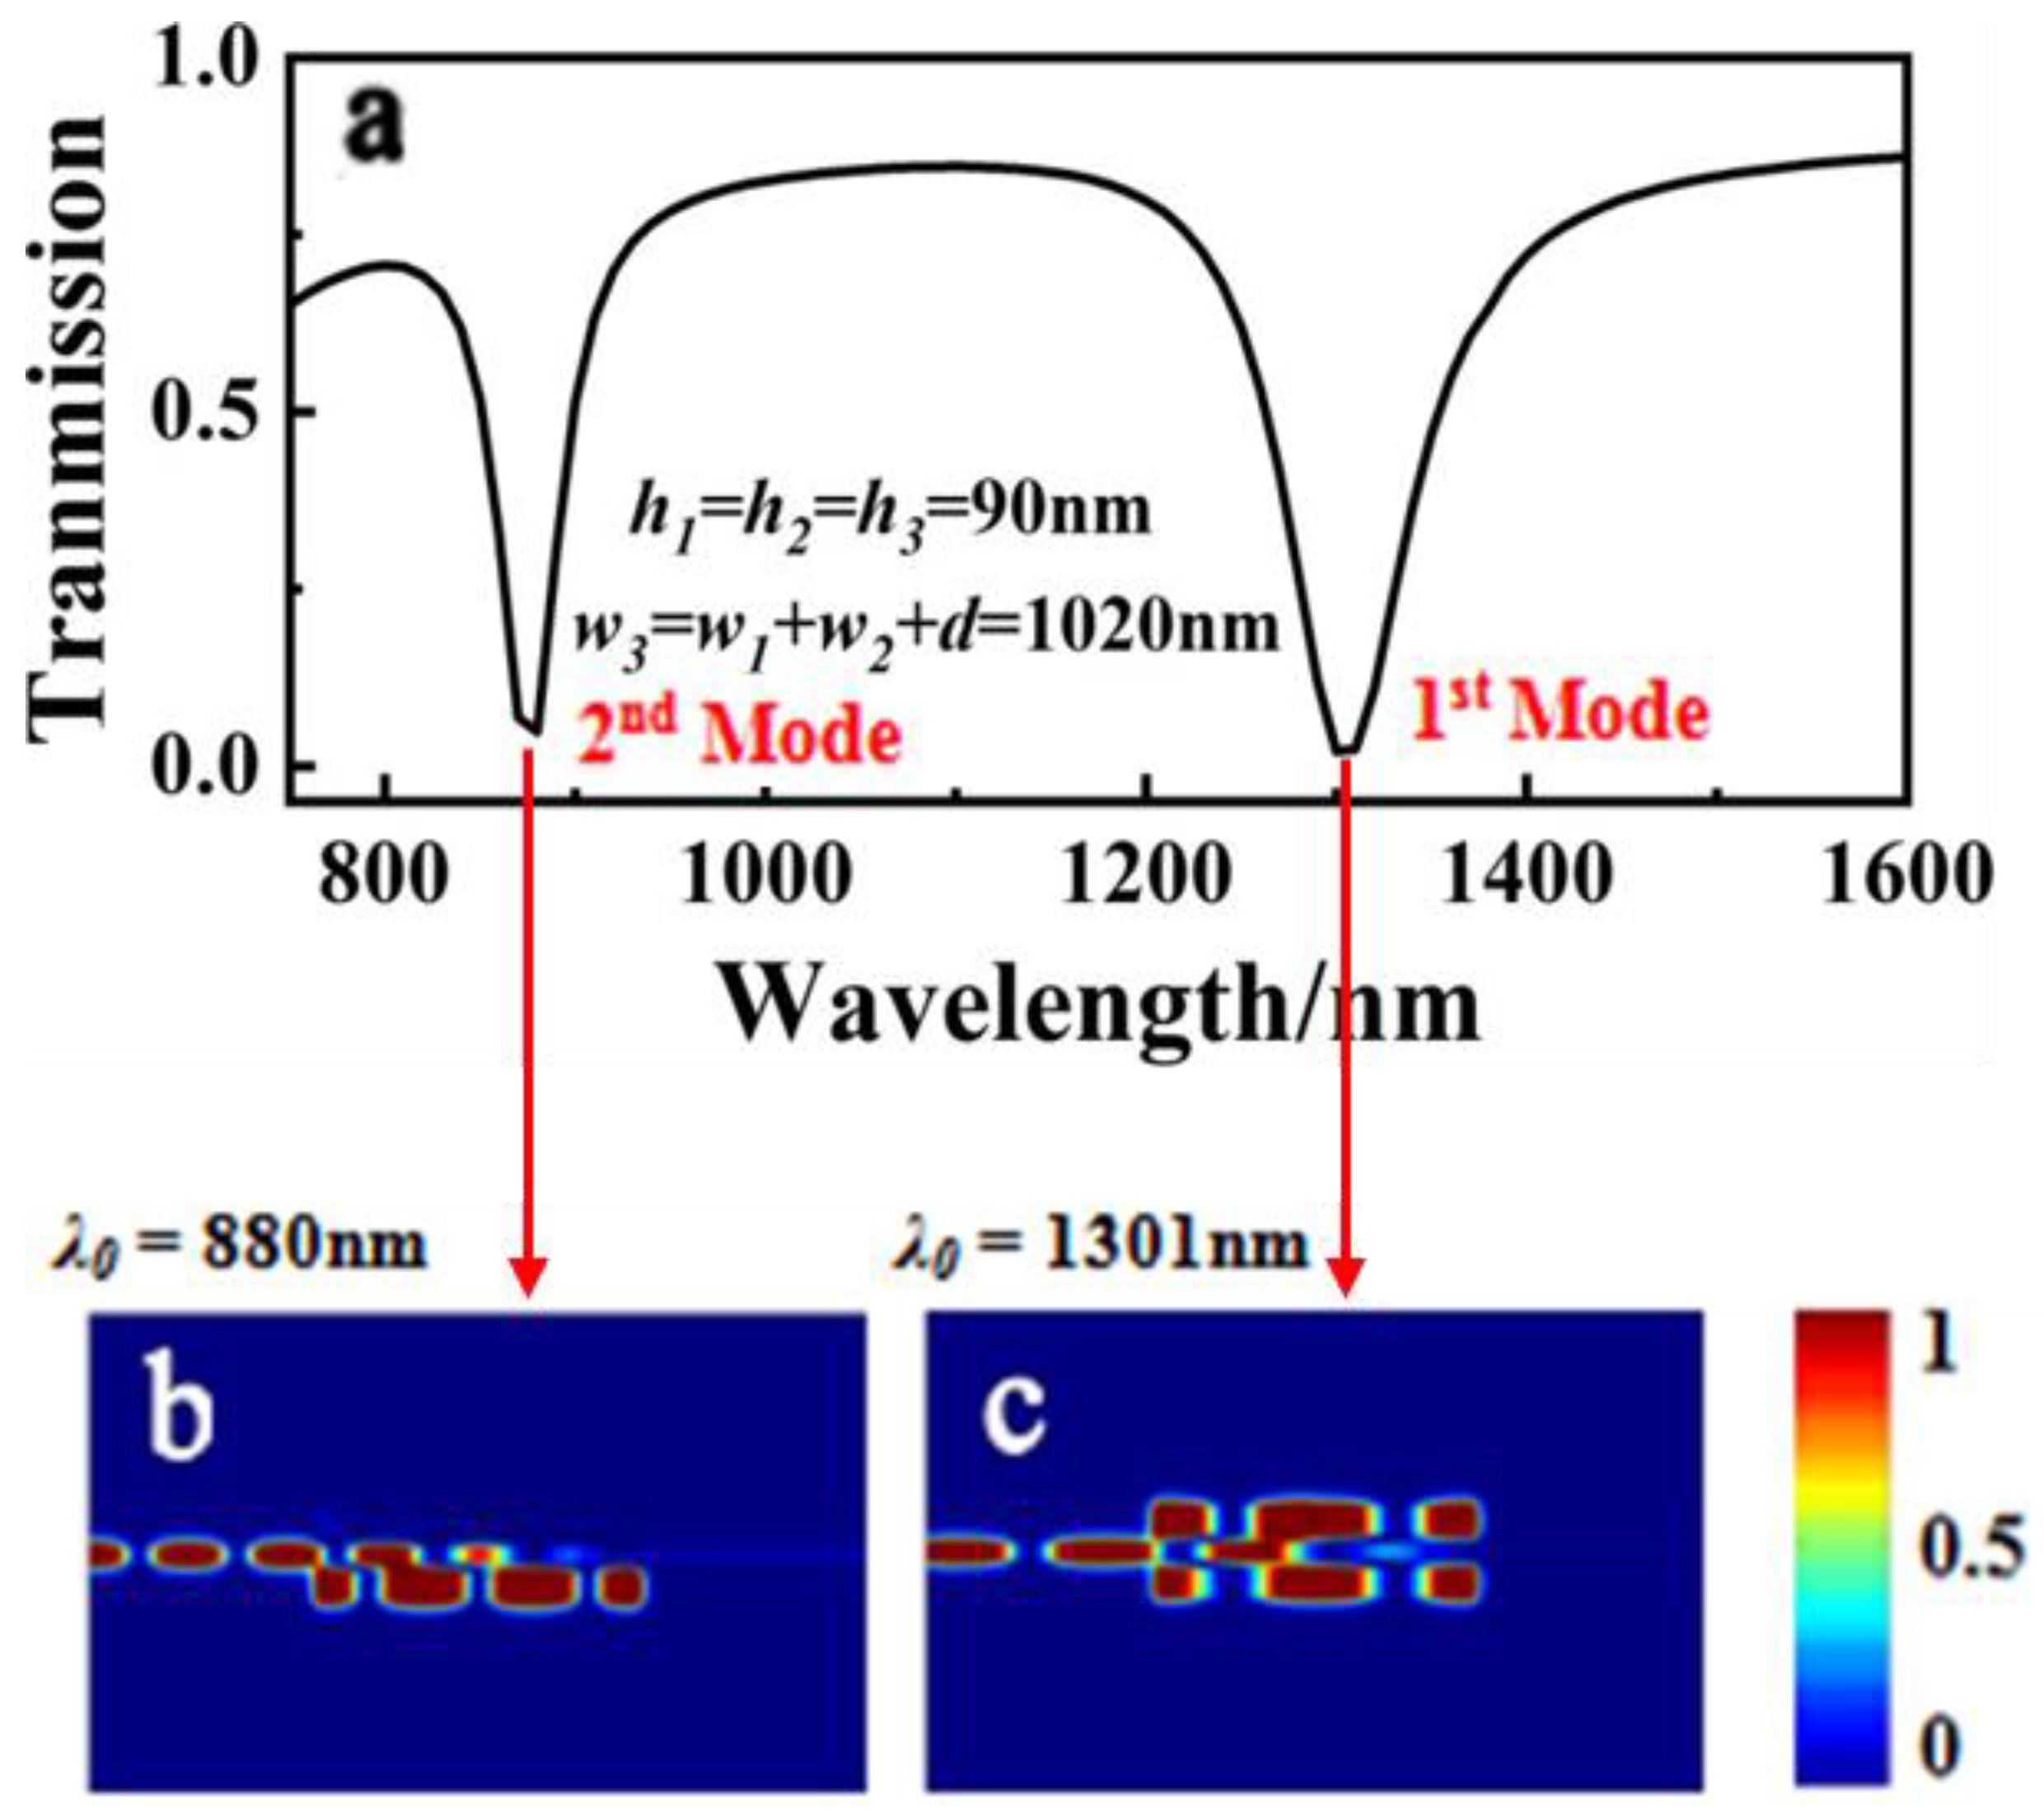
As shown in Figure 3a, two valleys were seen at λ0 = 1301 and 880 nm, representing the first- and second-order modes, respectively, with transmission spectra ranging from 750 nm to 1600 nm. The magnetic field intensity distributions at λ0 = 880 and λ0 = 1301 nm are shown in Figure 3b,c, respectively. The majority of the energy in the incident light at λ0 = 880 nm was coupled into cavity III and reflected back and forth, as shown in Figure 3b. When the wavelength of the incident light was increased to 1301 nm, the majority of the energy was coupled into and reflected back and forth between the three rectangular cavities. These results indicate that a small amount of energy can be transmitted in this mode, which is advantageous for band-stop filter applications.
To investigate the phenomenon of PIT tunability, the effect of changing the cavity III parameters on the transmission spectrum was considered, while the parameters of cavities I and II remained constant. Thus, the width, height, and refractive index of cavity III were gradually altered while the other parameters were set as described above.
The transmission spectrum as a function of cavity III width w3 was considered in the first stage. The PIT window was generated by the destructive interference between cavity III and the other two cavities when w3w1 + w2 + d and w3 was varied from 1020, 1040, 1060, and 1080 to 1100 nm, as shown in Figure 4a. As the width w3 increased, the transmission dip in the first-order mode split into two dips, indicating the appearance of the PIT window. With the increase in destructive interference between cavity III and the other two cavities, the PIT window grew wider and increasingly visible. As the w3 was increased, the PIT transmission peaks exhibited a redshift effect, and the transparency windows showed a progressively off-to-on optical response.
Second, transmission spectra were obtained by varying the height h3 of cavity III, as illustrated in Figure 4b. When the height parameter h3 was increased in 10 nm increments from 90 to 130 nm, an obvious off-to-on multimode PIT response and transmission spectrum blue shift were seen. The Q factor of the PIT windows was calculated as λ0/Δλ, where λ0 represents the transparency peak wavelength of the transparency window and represents the full width at half maximum (FWHM) of the transparency window. When h3 was increased, the Q value decreased significantly, indicating that the height h3 of cavity III had a significant impact on the Q value of the fundamental mode PIT window. This significant feature could be used to resize the Q of the PIT resonance. Various refractive indexes of the filling medium inside cavity III, ranging from 1.0 to 1.08 with a step size of 0.02, were tested to gain an understanding of the effect of changing the refractive index. A series of transmission spectra for adjusting the refractive index are shown in Figure 4c. The transmission spectrum and variation pattern were similar to those shown in Figure 4a,c. Both graphs showed increased transmission and redshifting as the corresponding parameters were increased. As a result, increasing the value of the refractive index n3 was essentially equivalent to increasing the width w3.
The first-order model transparent window is depicted in Figure 5 as h3 = 120 nm, which corresponds to the magnetic field intensity distribution |Hz|2.
As shown in Figure 5b, when the wavelength of incident light was 1251 nm, the majority of the energy was stored in the rectangular cavity III, causing a dip in the transmission spectrum. While λ = 1309 nm, the majority of the energy was coupled to cavities I and II, with only small amounts of energy entering cavity III, as shown in Figure 5d. Little energy was distributed into three rectangular cavities when λ = 1281 nm, as shown in Figure 5c. Meanwhile, SPPs could pass through the waveguide to the output port and acted as a PIT “on” state.
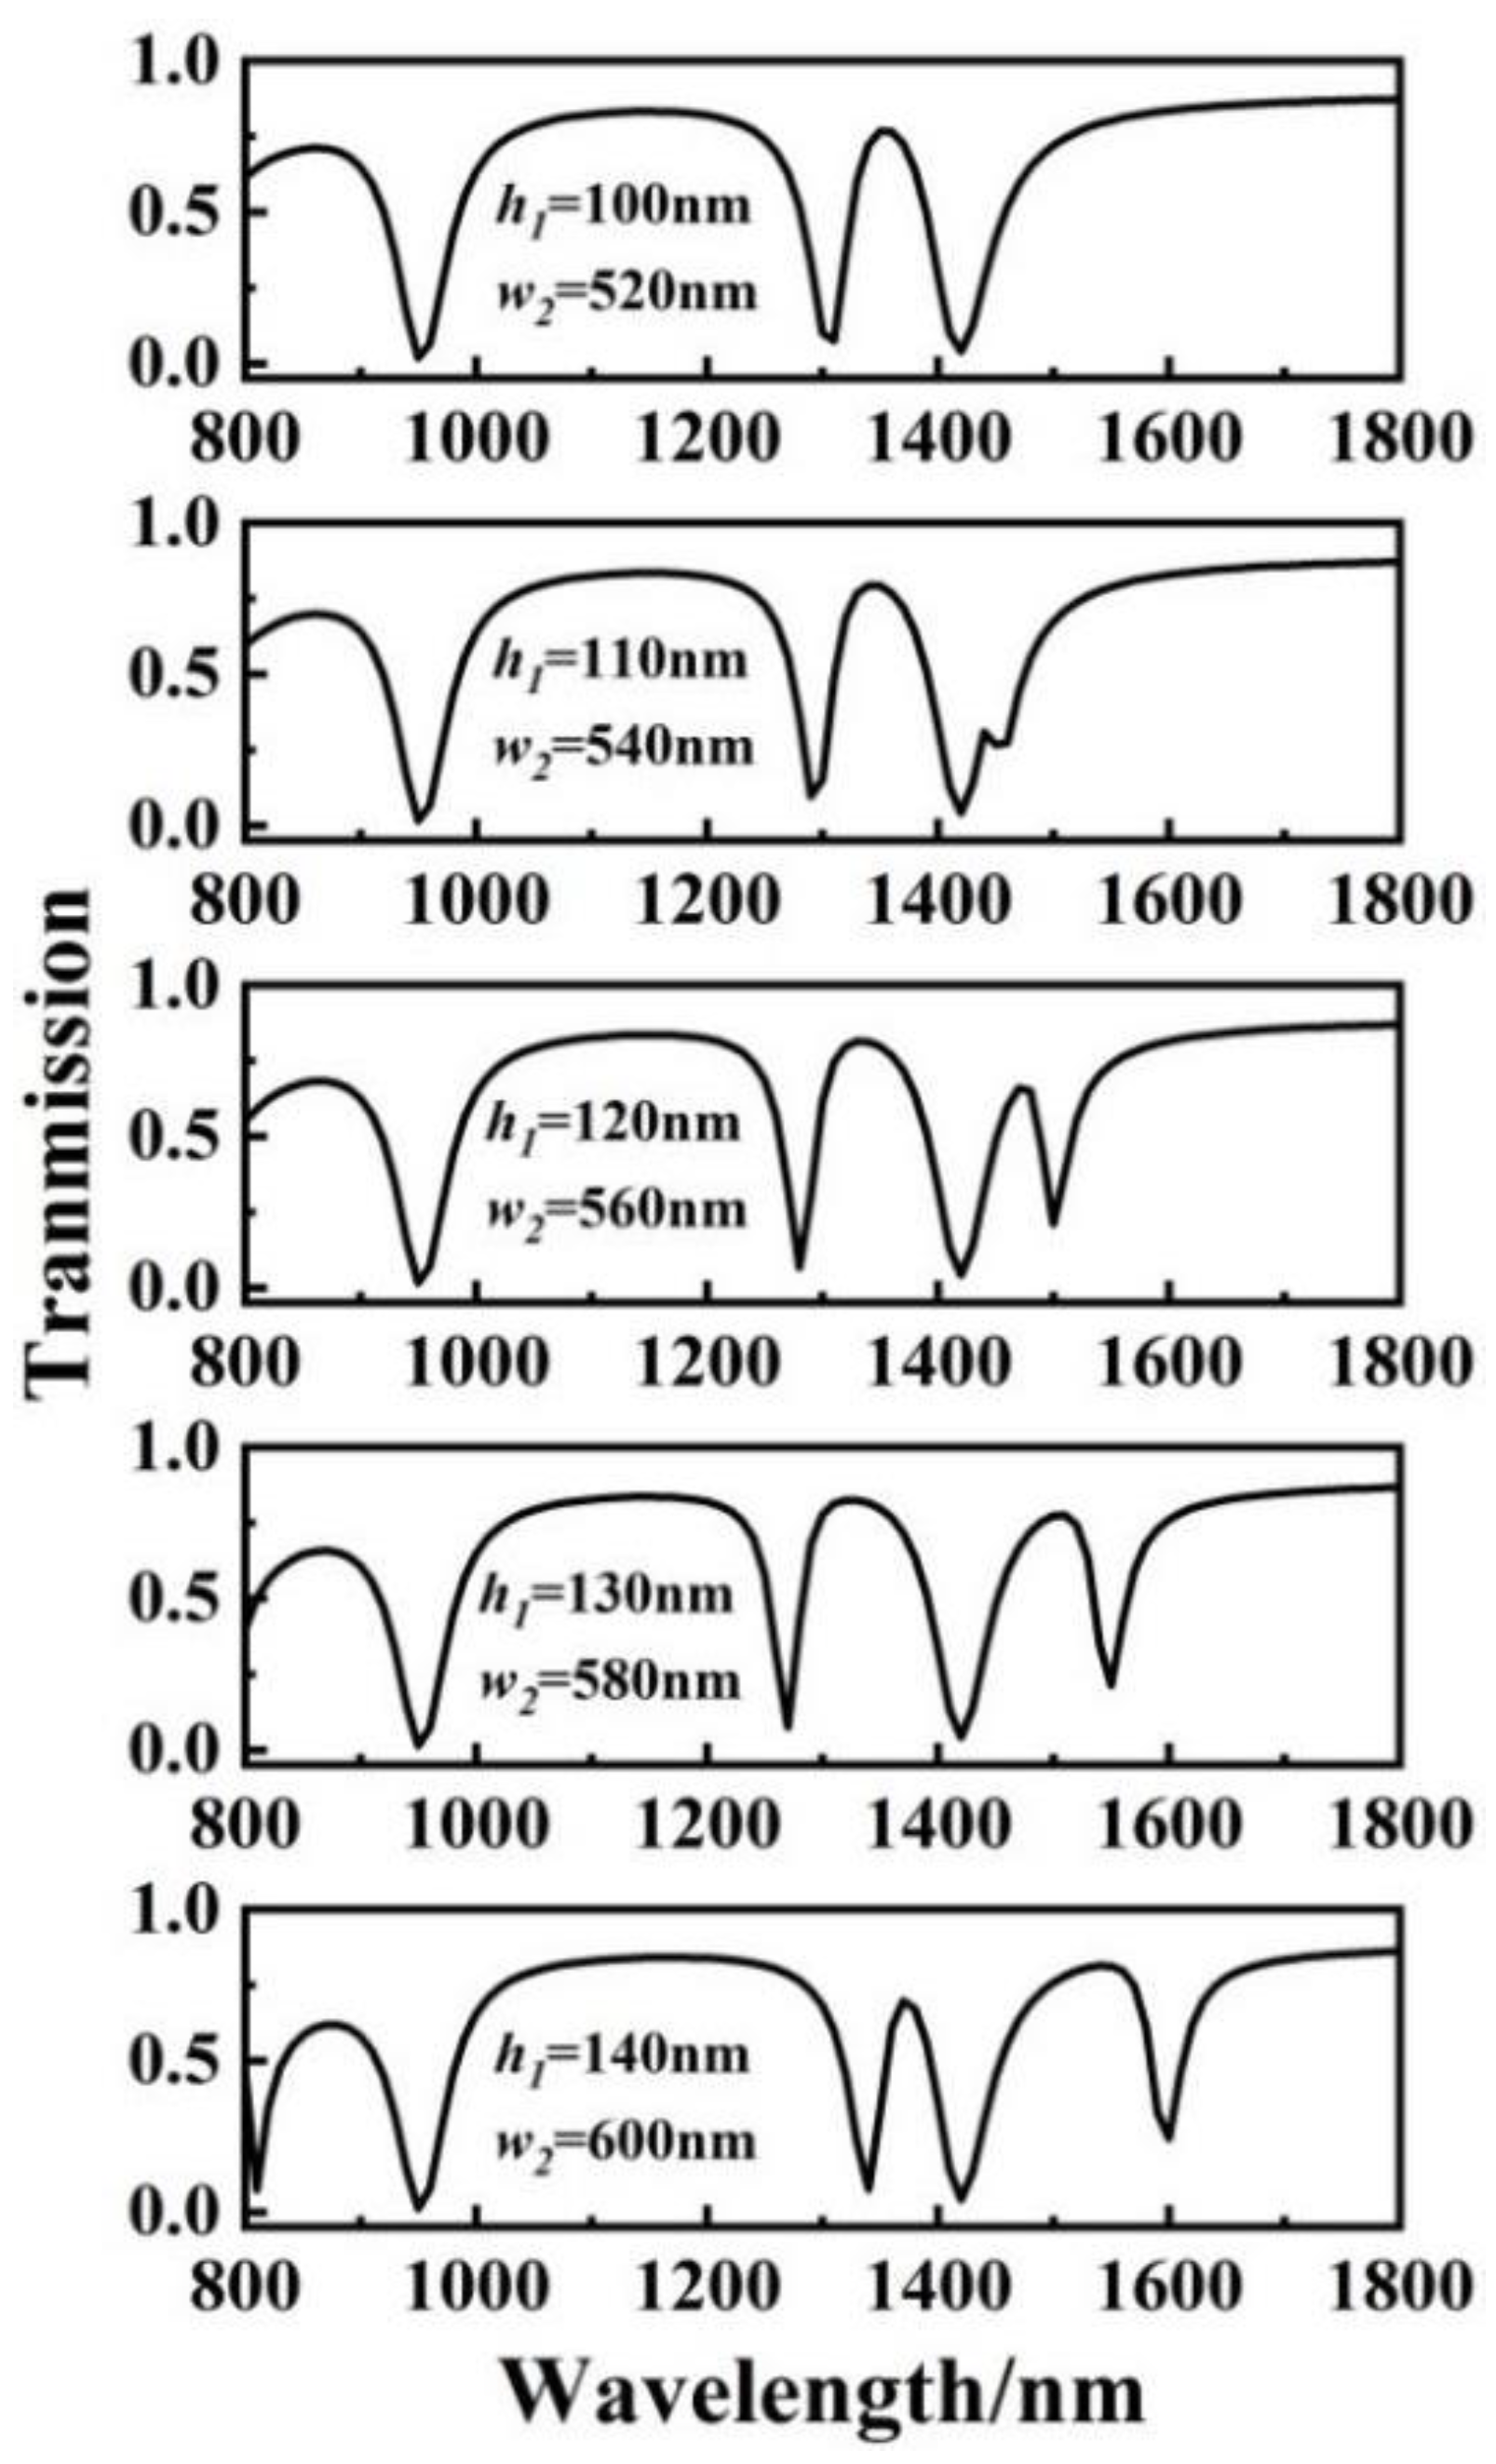
The structure could be easily expanded into a double PIT system by adjusting the parameters of two cavities at the same time. Figure 6 depicts a series of transmission spectra after synchronous adjustment of cavities I and II.
The height h1 of cavity I and the width w2 of cavity II were varied from 100 to 140 nm and 520 to 600 nm with a step of 10 nm and 20 nm, respectively. Other structural parameters remained constant. In the first-order mode, two new transmission peaks appeared, which can be attributed to the double PIT light response process. The light response of the transparent window gradually turned on as h1 was increased from 100 to 140 nm and w1 increased from 520 to 600 nm. In the first-order mode, both the left and right peaks exhibited redshift behavior.
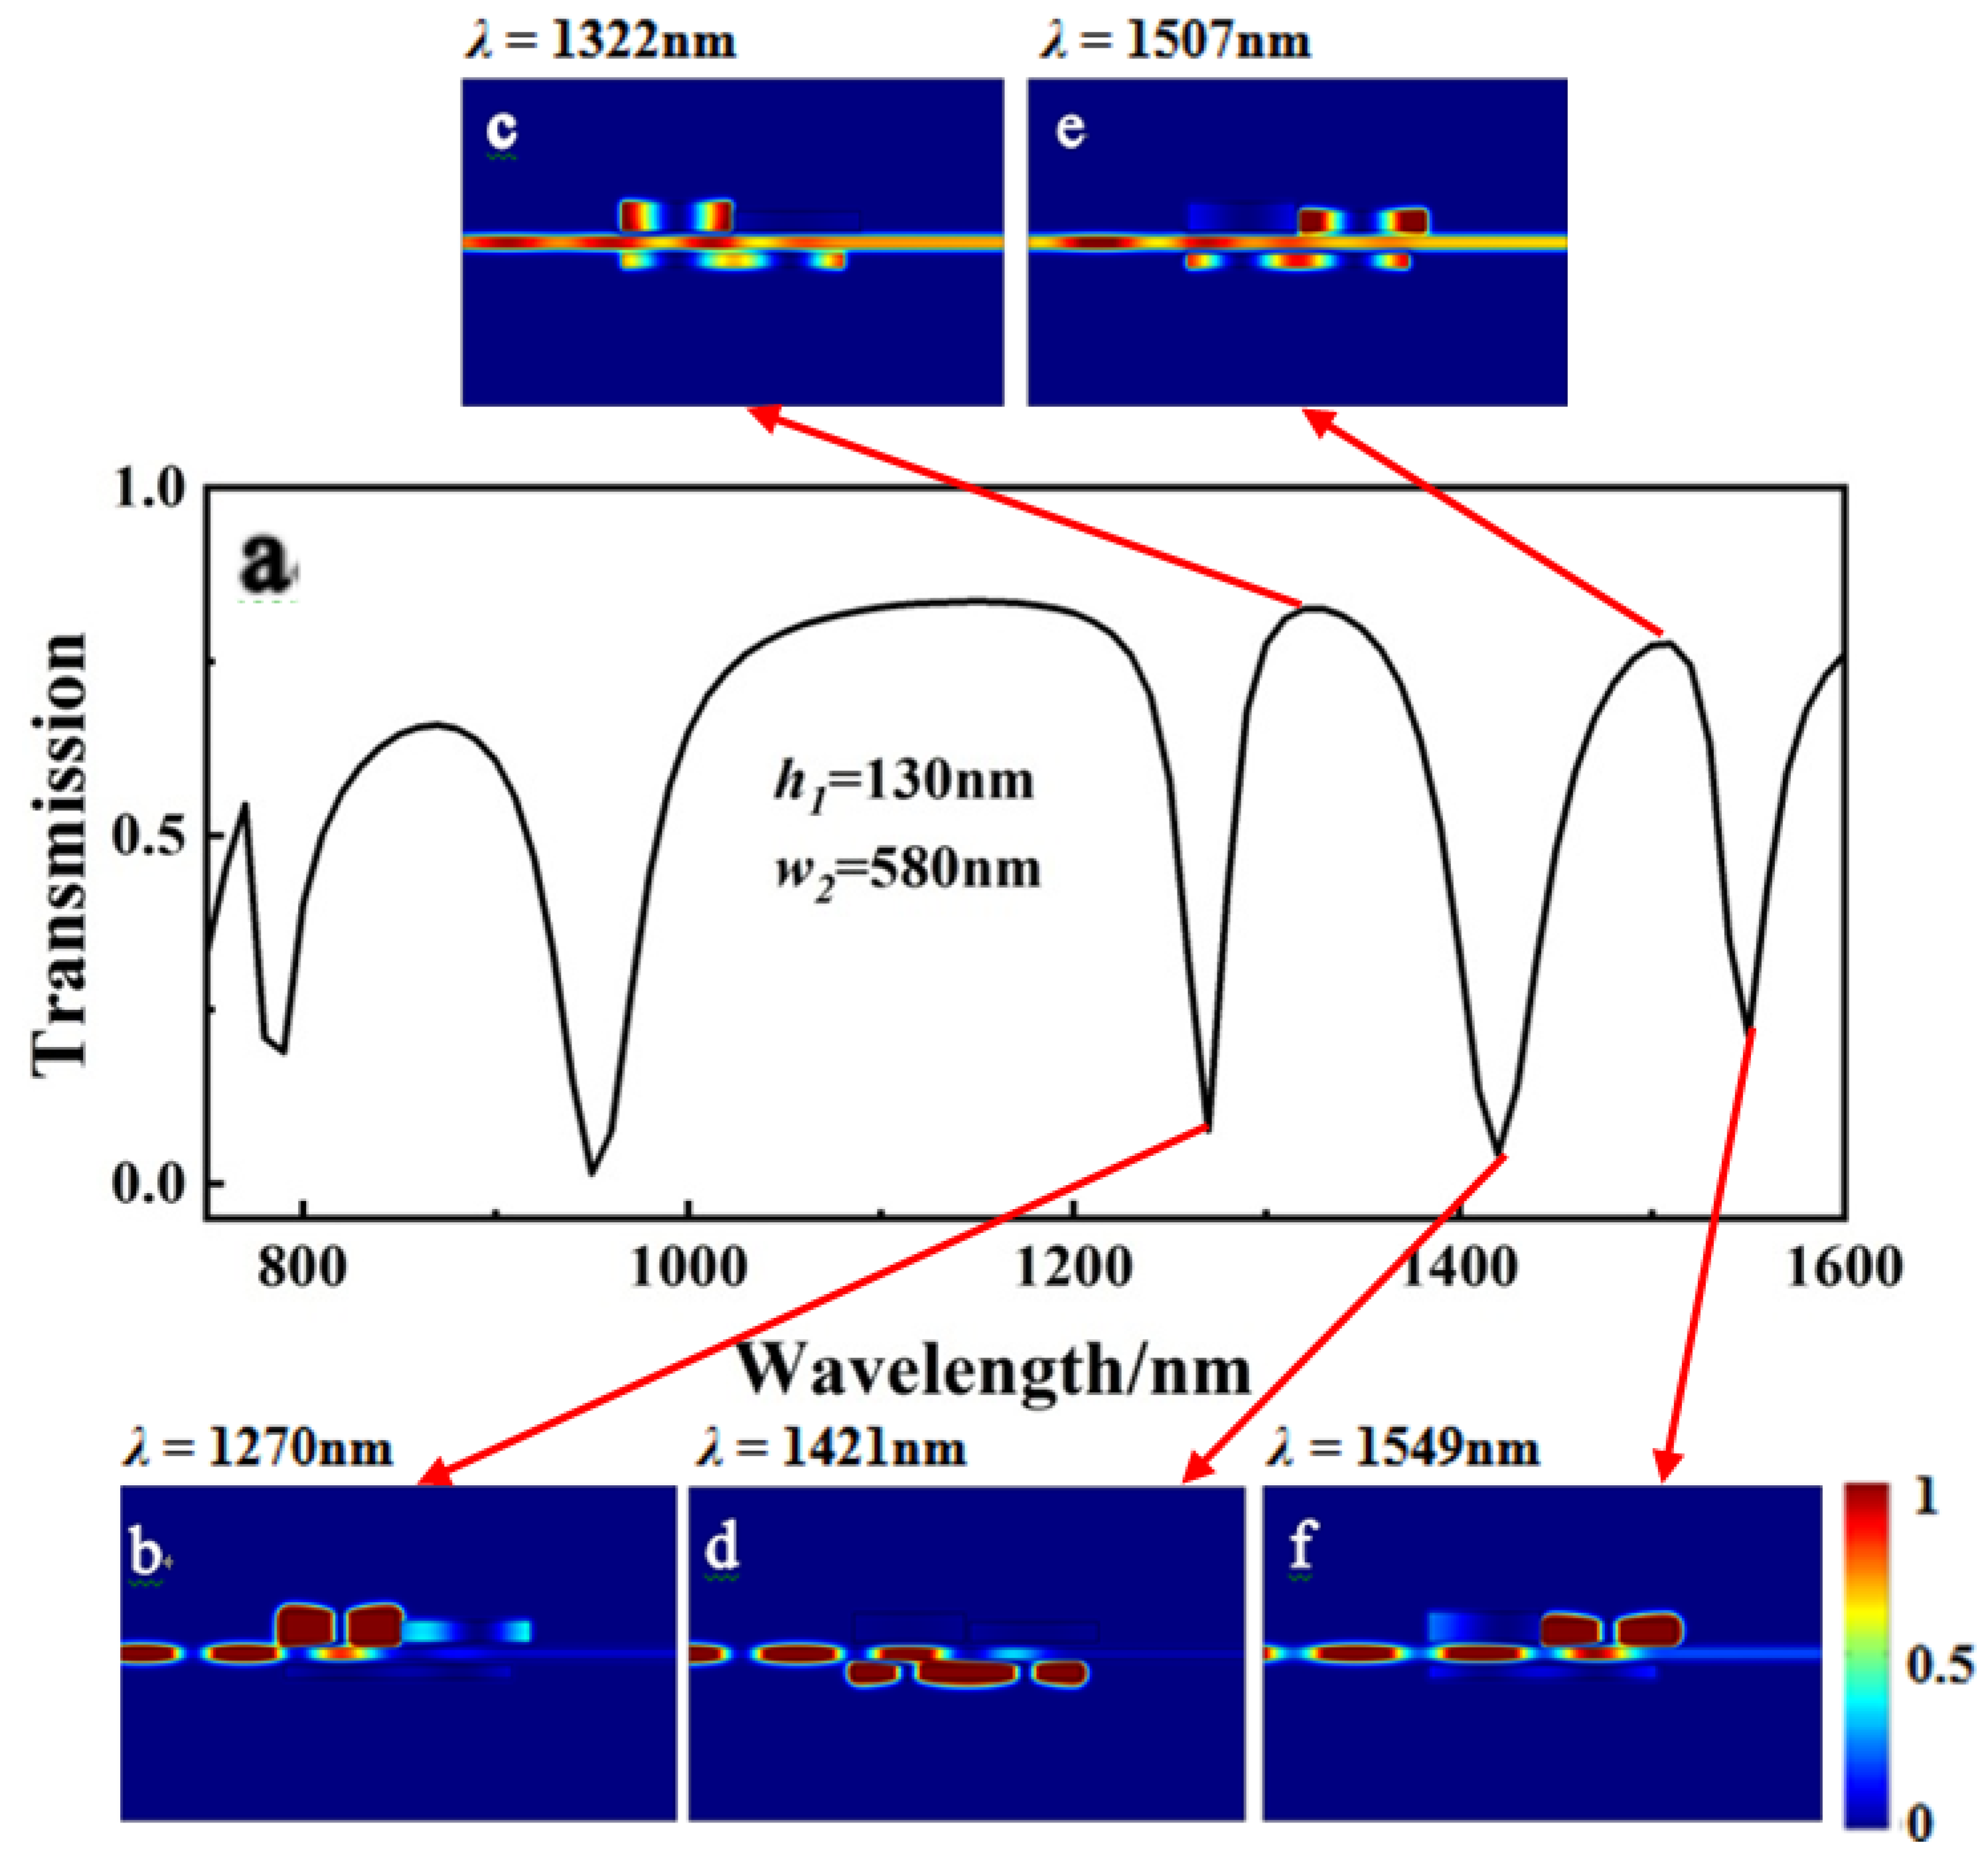
Figure 7 depicts the three dips and two peaks in the first-order mode, which correspond to the magnetic field intensity distribution |Hz|2. Because the energy was almost confined to cavity III, the two field distribution figures are similar to those in Figure 5b and Figure 7d. As illustrated in Figure 7b (λ = 1270 nm) and Figure 7f (λ = 1549 nm), the majority of the energy was coupled into cavities I and II, implying that the right and left new dips in the first-order mode could be controlled by resizing the h1 of cavity I and the w2 of cavity II, respectively. The SPPs bounced between the cavities and the bus waveguide. The system is, therefore, a classic Fabry–Pérot resonator, and the new dip was probably caused by adjusting the height of cavity I and the width of cavity II. As Figure 7e (λ = 1507 nm) shows, part of the energy could be coupled into cavities II and III, and SPPs were able to travel through the bus waveguide to port 2, indicating the “on” state of the PIT.
After resizing the structure of cavity II and simultaneously adjusting the parameters of cavities I and III, we observed two PIT peaks in the first-order mode, wherein one peak was rising while the other was falling.
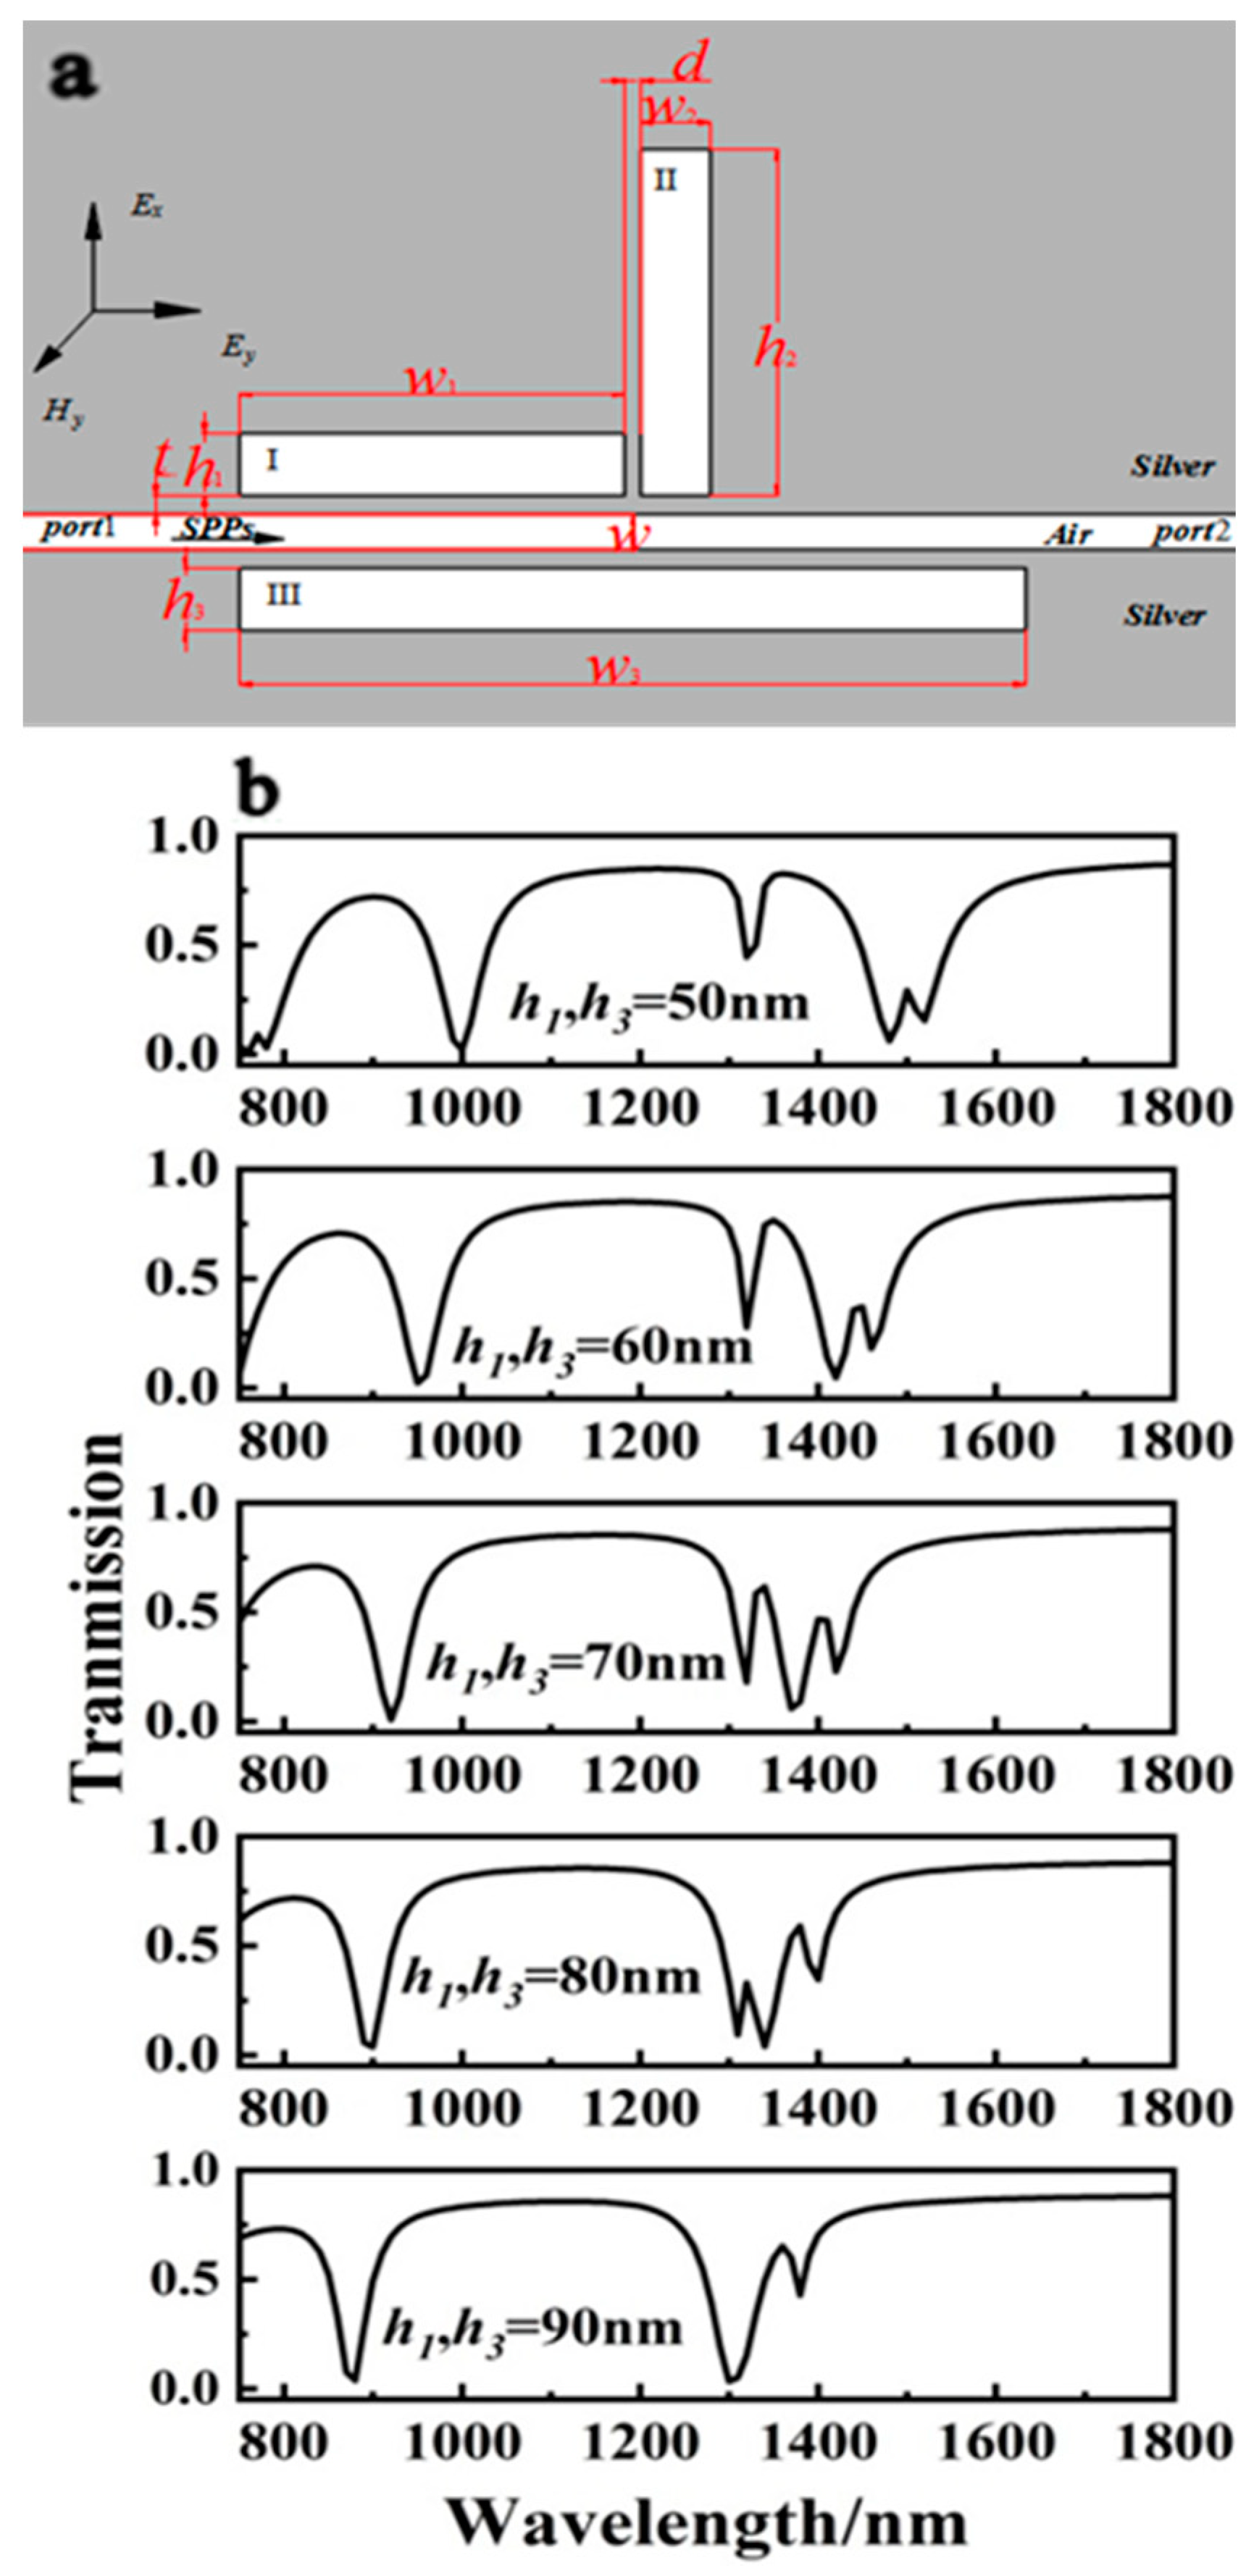
The values for the height h2 and width w2 of cavity II were swapped, but the other parameters remained constant. The height h2 was set to 500 nm, and the width w2 to 90 nm. Figure 8a depicts the structure. The height parameters of cavities I and III, h1 and h3, were then varied synchronously from 50 to 90 nm in 10 nm steps while other variables remained constant. Figure 8b depicts the transmission spectrum and variation rule. The system induced two transparent peaks between 1200 and 1600 nm, which exhibited the phenomenon of one rising and the other falling. As the height of cavities I and III was increased in first-order mode, the right peak decreased while the left peak rose. The height of the two transmission peaks was similar when h1 = h2 = 70 nm (Figure 8b). When h1 = h2 = 90 nm, the left peak in this region disappeared.
When the magnetic field distributions of the right dip in Figure 9a,b (h1 = h2 = 60 nm) (h1 = h2 = 80 nm) were compared, the energy transitioned from being almost uncoupled to cavity I to becoming progressively coupled to cavity I as h1 and h2 increased. It was possible to demonstrate that changing two parameters at the same time altered the energy coupling paths. As a result, the two transmission peaks of the PIT structure could be adjusted in opposing directions.
As shown in Figure 10, the shifting behaviors allowed cavity II to partially overlap with cavity I. Other conditions remained constant, and the effect of changing different cavity II parameters on the transmission spectrum was investigated. In this case, changing the height or width of cavities I and II had no effect on the transmission spectrum. The energy was primarily confined to cavity III because it was much wider than cavity I.
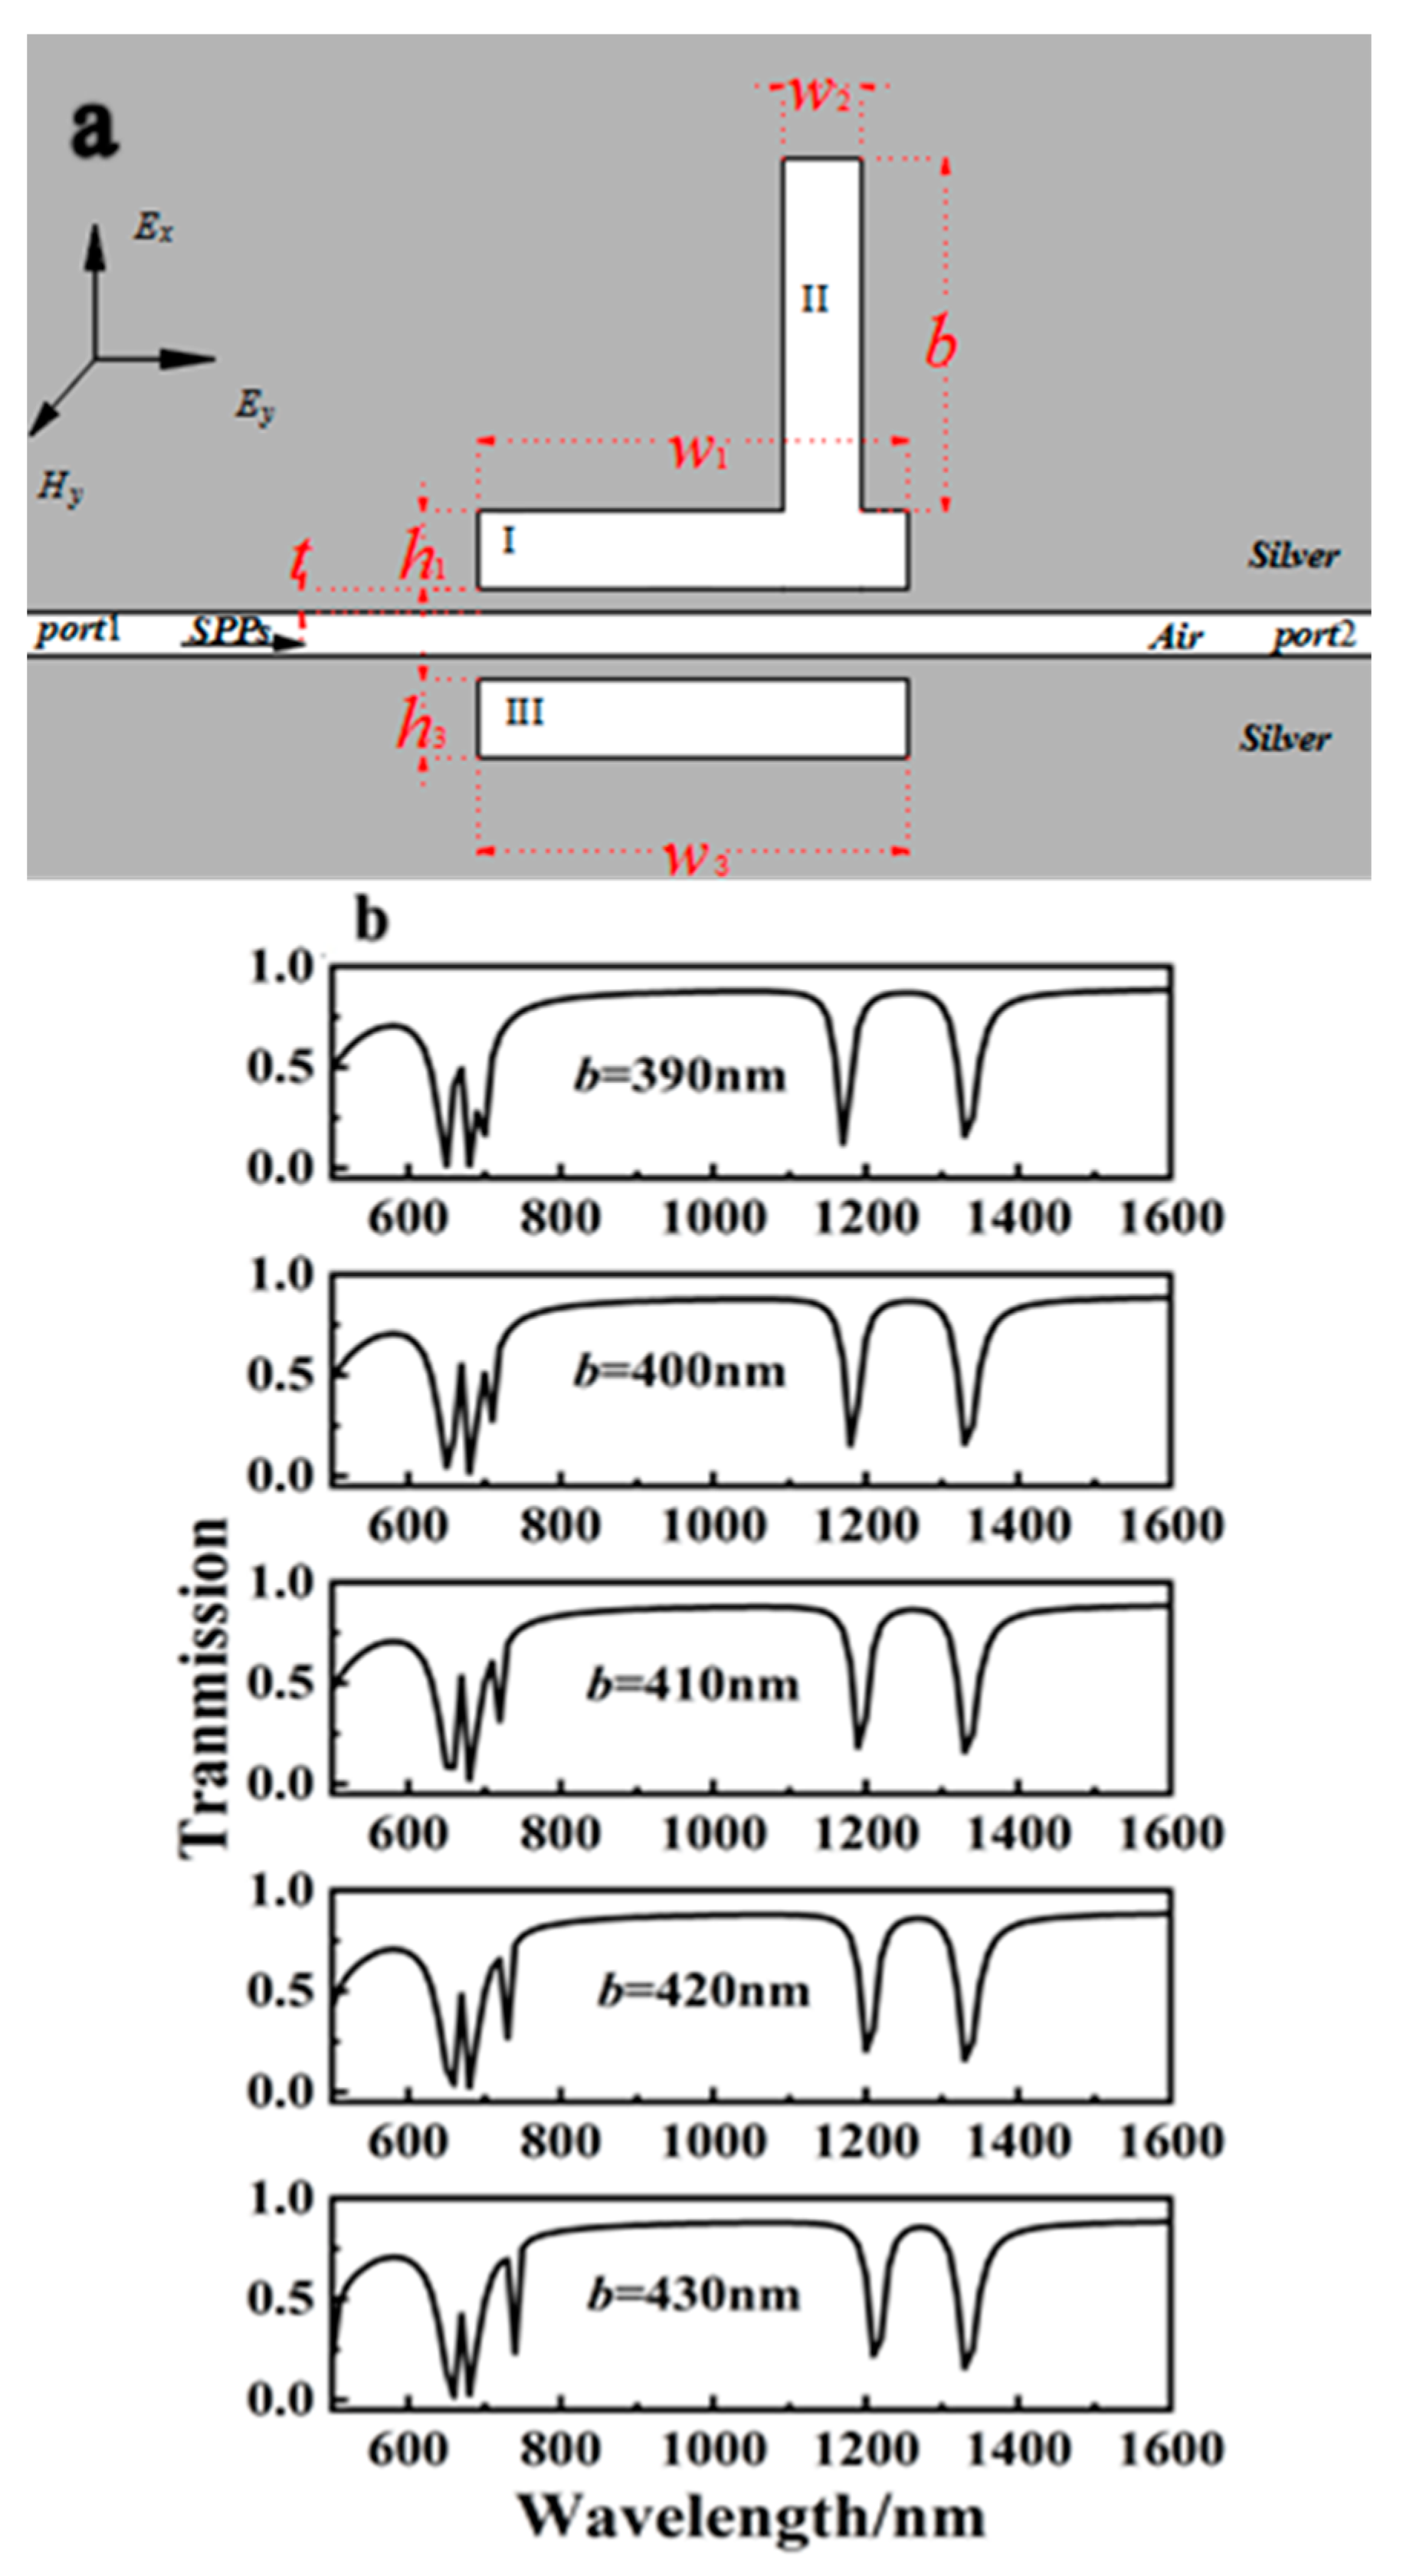
Based on the information presented above, the width of cavity III was reduced to w1 = w3 = 500 nm to investigate the effect of cavity II on the transmission spectrum. Figure 11a depicts the structure and parameters.
The height of cavity II was adjusted correspondingly to the height adjustment of bulge b from Figure 11a. The height of cavity II parameter b was set to 390, 400, 410, 420, and 430 nm. Other variables were held constant. In the two transmission peaks of the second-order mode, the phenomenon of one rising and the other falling was also achieved. As shown in Figure 11b, the left transmission peak in the second-order mode gradually decreased, whereas the right transmission peak in the second-order mode became more visible as b was increased. During the process of b increasing, the two transmission peaks also exhibited a slight redshift.
By comparing the magnetic field distributions of the peaks in Figure 12a,b, we can see that the energy gradually shifted from being primarily coupled into cavities II and III to being coupled into cavities I and III. The energy coupling path in the structure could, therefore, be changed by adjusting only one parameter of cavity II. As a result, the two transparent peaks in the same mode responded differently. These results provide a theoretical basis for designing optical biosensors or other highly integrated optical devices.

4. Conclusions

In this study, the transmission characteristics and rules of SPPs in different structures composed of MIM waveguides and three-rectangle resonators were systematically investigated. Finite element numerical simulation and theoretical analysis were used to test the hypothesis and determine the rule of different modes. Changing the geometrical parameters of the cavities, such as the width and height of a rectangular cavity or the refractive index, caused an off-to-on multi-wavelength PIT optical response and made it possible to control the response intensity. On this basis, a novel phenomenon for two transmission peaks of the same-order mode wherein one peak rises and one falls was discovered and studied. This phenomenon, caused by a change in the energy coupling path, can be realized by changing one or two parameters in the various structures discussed in the paper. As a result, two transmission peaks in the same mode can be simultaneously adjusted in opposite directions at the same time via the structural parameters, allowing for more flexible filtering of different bands. The various structures and rules discussed in this paper can be applied to actively tunable sensors, paving the way for actively tunable sensor experiments.

Author Contributions

R.P. and D.L. conceived and designed the simulation; R.P. and Q.Z. performed the simulation and analyzed the data; R.P. and Z.S. wrote the manuscript under the supervision of R.P., D.L., Q.Z., Z.S., Y.S., X.L. and J.W. contributed to the scientific discussion of the results and reviewed the manuscript. All authors have read and agreed to the published version of the manuscript.

Funding

This research was funded by [the National Natural Science Foundation of China] grant number [12004325], [the Natural Science Foundation of Jiangsu Province] grant number [BK20210076], [the State Key Laboratory Open Fund of Millimeter Waves] grant number [K202105]. And the APC was funded by [the State Key Laboratory Open Fund of Millimeter Waves].

Informed Consent Statement

Not applicable.

Acknowledgments

This work was supported by the National Natural Science Foundation of China (grant no. 12004325), the Natural Science Foundation of Jiangsu Province (grant no. BK20210076), and the State Key Laboratory Open Fund of Millimeter Waves (K202105). Dongdong Liu was supported by the Jiangsu Qinglan project.

Conflicts of Interest

The authors declare no conflict of interest.

References

  1. Kazanskiy, N.L.; Khonina, S.N.; Butt, M.A. Plasmonic sensors based on Metal-insulator-metal waveguides for refractive index sensing applications: A brief review. Physica E 2020, 117, 113798. [Google Scholar] [CrossRef]
  2. Barnes, W.L.; Dereux, A.; Ebbesen, T.W. Surface plasmon subwavelength optics. Nature 2003, 424, 824–830. [Google Scholar] [CrossRef] [PubMed]
  3. Genet, C.; Ebbesen, T.W. Light in tiny holes. Nature 2007, 445, 39–46. [Google Scholar] [CrossRef]
  4. Neutens, P.; Dorpe, P.V.; Vlaminck, I.D.; Lagae, L.; Borghs, G. Electrical detection of confined gap plasmons in metal-insulator-metal waveguides. Nat. Photon. 2009, 3, 283–286. [Google Scholar] [CrossRef]
  5. Huang, B.; Meng, H.Y.; Wang, Q.H.; Wang, H.H.; Zhang, X.; Yu, W.; Tan, C.H.; Huang, X.G.; Wang, F.Q. Plasmonic-Induced Transparency and Slow-Light Effect Based on Stub Waveguide with Nanodisk Resonator. Plasmonics 2016, 11, 543–550. [Google Scholar] [CrossRef]
  6. Haus, H.; Huang, W.P. Couple-mode theory. Proc. IEEE 1991, 79, 1505–1518. [Google Scholar] [CrossRef] [Green Version]
  7. Wang, J.C.; Niu, Y.Y.; Liu, D.D.; Hu, Z.D.; Sang, T.; Gao, S.M. Tunable plasmon-induced transparency effect in MIM side-coupled isosceles trapezoid cavities system. Plasmonics 2018, 13, 609–616. [Google Scholar] [CrossRef]
  8. Song, C.; Qu, S.N.; Wang, J.C.; Tang, B.J.; Xia, X.S.; Liang, X.Y.; Lu, Y.N. Plasmonic tunable filter based on trapezoid resonator waveguide. J. Mod. Opt. 2015, 62, 1400–1404. [Google Scholar] [CrossRef]
  9. Wang, J.C.; Sun, L.; Hu, Z.D.; Liang, X.Y.; Liu, C. Plasmonic-induced transparency of unsymmetrical grooves shaped metal–insulator–metal waveguide. AIP Adv. 2014, 4, 123006. [Google Scholar] [CrossRef]
  10. Steglich, P.; Bondarenko, S.; Mai, C.; Paul, M.; Michael, G.; Weller, M.A. CMOS-compatible silicon photonic sensor for refractive index sensing using local back-side release. IEEE Photonics Technol. Lett. 2020, 32, 1241–1244. [Google Scholar] [CrossRef]
  11. Zhao, L.; Liu, S.; Wang, J.; Shen, X.P.; Cui, T.J. Band-stop filter based on spoof surface plasmon polaritons. Electron. Lett. 2019, 55, 607–609. [Google Scholar] [CrossRef]
  12. Wang, B.J.; Zhu, S.S.; Guo, B. Surface plasmon polaritons in plasma-dielectric-magnetic plasma structure. Plasma Sci. Technol. 2020, 11, 45–51. [Google Scholar] [CrossRef]
  13. Li, L.; Dong, L.; Chen, P.; Yang, K. A low insertion loss low-pass filter based on single comb-shaped spoof surface plasmon polaritons. Int. J. Microw. Wirel. Technol. 2019, 11, 792–796. [Google Scholar] [CrossRef]
  14. Ding, Z.Q.; Dai, D.X.; Shi, Y.C. Ultra-sensitive silicon temperature sensor based on cascaded Mach-Zehnder interferometers. Opt. Lett. 2021, 46, 2787–2790. [Google Scholar] [CrossRef] [PubMed]
  15. Zhou, S.H.; Shen, Z.X.; Kang, R.Y.; Ge, S.J.; Hu, W. Liquid crystal tunable dielectric metamaterial absorber in the terahertz range. Appl. Sci. 2018, 8, 2211. [Google Scholar] [CrossRef] [Green Version]
  16. Liu, H.Q.; Gao, Y.X.; Zhu, B.F.; Ren, G.B.; Jian, S.S. A T-shaped high resolution plasmonic demultiplexer based on perturbations of two nanoresonators. Opt. Commun. 2015, 334, 164–169. [Google Scholar] [CrossRef]
  17. Butt, M.A.; Khonina, S.N.; Kazanskiy, N.L. A plasmonic colour filter and refractive index sensor applications based on metal-insulator-metal square micro-ring cavities. Laser Phys. 2020, 30, 016205. [Google Scholar] [CrossRef]
  18. Liu, S.L.; Ma, X.Y.; Song, M.; Ji, C.Y.; Song, J.; Ji, Y.L.; Ma, S.J.; Jiang, J.; Wu, X.C.; Li, J.F.; et al. Plasmonic Nanosensors with Extraordinary Sensitivity to Molecularly Enantioselective Recognition at Nanoscale Interfaces. ACS Nano 2021, 15, 19535–19545. [Google Scholar] [CrossRef]
  19. Ostovan, A.; Naghavi, S.S. Highly efficient metalloporphyrin-based nanosensors for NO detection. Phys. Chem. Chem. Phys. 2022, 24, 15579–15587. [Google Scholar] [CrossRef]
  20. Ramani, U.; Kumar, H.; Singh, B.K.; Pandey, P.C. Design of surface plasmon resonance based both side polished photonic crystal fiber for highly efficient refractive index sensor. Optik 2021, 248, 168062. [Google Scholar] [CrossRef]
  21. Wang, S.; Yu, S.; Zhao, T.; Wang, Y.; Shi, X. A nanosensor with ultra-high FOM based on tunable malleable multiple Fano resonances in a waveguide coupled isosceles triangular resonator. Optic. Commun. 2020; 465, 125614. [Google Scholar]
  22. Zhu, L.; Li, H.D.; Dong, L.; Zhou, W.J.; Rong, M.X.; Zhang, X.Z.; Guo, J. Dual-band electromagnetically induced transparency (EIT) terahertz metamaterial sensor. Opt. Mater. Express 2021, 11, 2109–2121. [Google Scholar] [CrossRef]
  23. Zhu, S.S.; Wen., P.; Liu, Y.H. Multi-band propagation of spoof surface plasmon polaritons by its high-order modes. Jpn. J. Appl. Phys. 2022, 61, 070907. [Google Scholar] [CrossRef]
  24. Su, W.; Ding., Y.M.; Luo, Y.L.; Liu, Y. A high figure of merit refractive index sensor based on Fano resonance in all-dielectric metasurface. Results Phys. 2020, 16, 102833. [Google Scholar] [CrossRef]
  25. Chen, J.F.; Li, J.N.; Liu, X.; Rohimah, S.; Tian, H.; Qi, D.W. Fano resonance in a MIM waveguide with double symmetric rectangular stubs and its sensing characteristics. Opt. Commun. 2021, 482, 126563. [Google Scholar] [CrossRef]
  26. Zhang, Z.J.; Yang, J.B.; He, X.; Zhang, J.J.; Huang, J.; Chen, D.B.; Han, Y.X. Plasmonic refractive index sensor with high figure of merit based on concentric-rings resonator. Sensors 2018, 18, 116. [Google Scholar] [CrossRef] [Green Version]
  27. Ouyang, X.; Xu, Y.; Feng, Z.W.; Tang, W.Y.; Cao, Y.Y.; Li, X.P. Polychromatic and polarized multilevel optical data storage. Nanoscale 2019, 11, 2447–2452. [Google Scholar] [CrossRef]
  28. Hsu, H.; Cheng, C.Y.; Shiu, J.S.; Chen, L.C.; Chen, Y.F. Quantum fidelity of electromagnetically induced transparency: The full quantum theory. Opt. Express 2022, 30, 2097–2111. [Google Scholar] [CrossRef]
  29. Guo, Y.Y.; Huo, Y.P.; Niu, Q.Q.; He, Q.; Hao, X.X. Band-stop filter based on tunable Fano resonance and electromagnetically induced transparency in metal-dielectric-metal waveguide coupling systems. Phys. Scr. 2020, 96, 015507. [Google Scholar] [CrossRef]
  30. Liu, D.D.; Sun, Y.; Fan, Q.B.; Mei, M.F.; Wang, J.C.; Pan, Y.W.; Lu, J. Tunable Plasmonically Induced Transparency with Asymmetric Multi-rectangle Resonators. Plasmonics 2016, 11, 1621–1628. [Google Scholar] [CrossRef]
  31. Ge, J.H.; You, C.L.; Feng, H.; Li, X.M.; Wang, M.; Dong, L.F.; Veronis, G.; Yun, M.J. Tunable dual plasmon-induced transparency based on a monolayer graphene metamaterial and its terahertz sensing performance. Opt. Express 2020, 28, 31781–31795. [Google Scholar] [CrossRef]
  32. Naghizadeh, S.; Kocabas, S.E. Guidelines for designing 2D and 3D plasmonic stub resonators. J. Opt. Soc. Am. B 2017, 34, 207–217. [Google Scholar] [CrossRef] [Green Version]
  33. Noual, A.; Abouti, O.E.; El Boudouti, E.H.; Akjouj, A.; Pennec, Y.; Djafari-Rouhani, B. Plasmonic-induced transparency in a MIM waveguide with two side-coupled cavities. Appl. Phys. A 2017, 123, 1–7. [Google Scholar] [CrossRef]
  34. Yun, B.F.; Hu, G.H.; Cong, J.W.; Cui, Y.P. Plasmon induced transparency in metal–insulator–metal waveguide by a stub coupled with FP resonator. Mater. Res. Express 2014, 1, 036201. [Google Scholar] [CrossRef]
  35. Mashayekhi, M.Z.; Abbasian, K.; Nurmohammadi, T. Dual-wavelength active and tunable modulation at telecommunication wavelengths using graphene-metal hybrid metamaterial based on plasmon induced transparency. Phys. Scr. 2022, 12, 095503. [Google Scholar] [CrossRef]
  36. Yang, X.D.; Liu, Y.M.; Oulton, R.F.; Yin, X.B.; Zhang, X.Z. Optical forces in hybrid plasmonic waveguides. Nano Lett. 2011, 11, 321–328. [Google Scholar] [CrossRef]
  37. Mohammad, A.Z.; Lambertus, H.L. Dynamically controllable plasmonic tweezers using C-shaped nano-engravings. Appl. Phys. Lett. 2022, 121, 181108. [Google Scholar]
  38. Chen, Y.; Ming, H. Review of surface plasmon resonance and localized surface plasmon resonance sensor. Photonic Sens. 2012, 2, 37–49. [Google Scholar] [CrossRef] [Green Version]
  39. Lin, X.S.; Huang, X.G. Tooth-shaped plasmonic waveguide filters with nanometeric sizes. Opt. Lett. 2008, 33, 2874. [Google Scholar] [CrossRef] [Green Version]
  40. Blessan, T.M.; Venkateswaran, C.; Yogesh, N. All-optical terahertz logic gates based on coupled surface plasmon polariton sub-wavelength waveguiding in bulk Dirac semimetal. Optik 2022, 257, 168795. [Google Scholar] [CrossRef]
  41. Shen, Z.Y.; Xiang, T.Y.; Wu, N.; Wu, J.; Tian, Y.; Yang, H.L. Dual-band electromagnetically induced transparency based on electric dipole-quadrupole coupling in metamaterials. J. Phys. D 2019, 52, 1. [Google Scholar] [CrossRef]
  42. Zou, S.W.; Wang, F.Q.; Liang, R.S.; Xiao, L.P.; Hu, M. A nanoscale refractive index sensor based on asymmetric plasmonic waveguide with a ring resonator: A review. IEEE Sens. J. 2015, 15, 646–650. [Google Scholar] [CrossRef]
  43. Wang, T.C. Generalized temporal coupled-mode theory for a P T-symmetric optical resonator and Fano resonance in a P T-symmetric photonic heterostructure. Opt. Express 2022, 30, 37980–37992. [Google Scholar] [CrossRef] [PubMed]
  44. Qu, S.N.; Song, C.; Xia, X.S.; Liang, X.Y.; Tang, B.J.; Hu, Z.D.; Wang, J.C. Detuned plasmonic Bragg grating sensor based on defect metal-insulator-metal waveguide. Sensors 2016, 16, 784. [Google Scholar] [CrossRef] [PubMed] [Green Version]
  45. Mendez, A.M.; Okayama, H.; Nakajima, H. Silicon optical filter with transmission peaks in wide stopband obtained by anti-symmetric photonic crystal with defect in multimode waveguides. Opt. Express 2018, 26, 1841–1850. [Google Scholar] [CrossRef]
  46. Wang, W.; Zhou, Y.C.; Wang, F.; Tan, J.W.; Teng, H.B.; Wang, H.D. Two-dimensional equivalent Model design of surface acoustic wave devices based on COMSOL. Piezoelectr. Acoustooptics 2021, 43, 605–608. [Google Scholar]
  47. Han, Z.H.; Bozhevlnyi, S.I. Plasmon-induced transparency with detuned ultracompact Fabry-Perot resonators in integrated plasmonic devices. Opt. Express 2011, 19, 3251–3257. [Google Scholar] [CrossRef]
  48. Tang, B.J.; Wang, J.C.; Xia, X.S.; Liang, X.Y.; Song, C.; Qu, S.N. Plasmonic induced transparency and unidirectional control based on the waveguide structure with quadrant ring resonators. Appl. Phys. Express 2015, 8, 032202. [Google Scholar] [CrossRef]
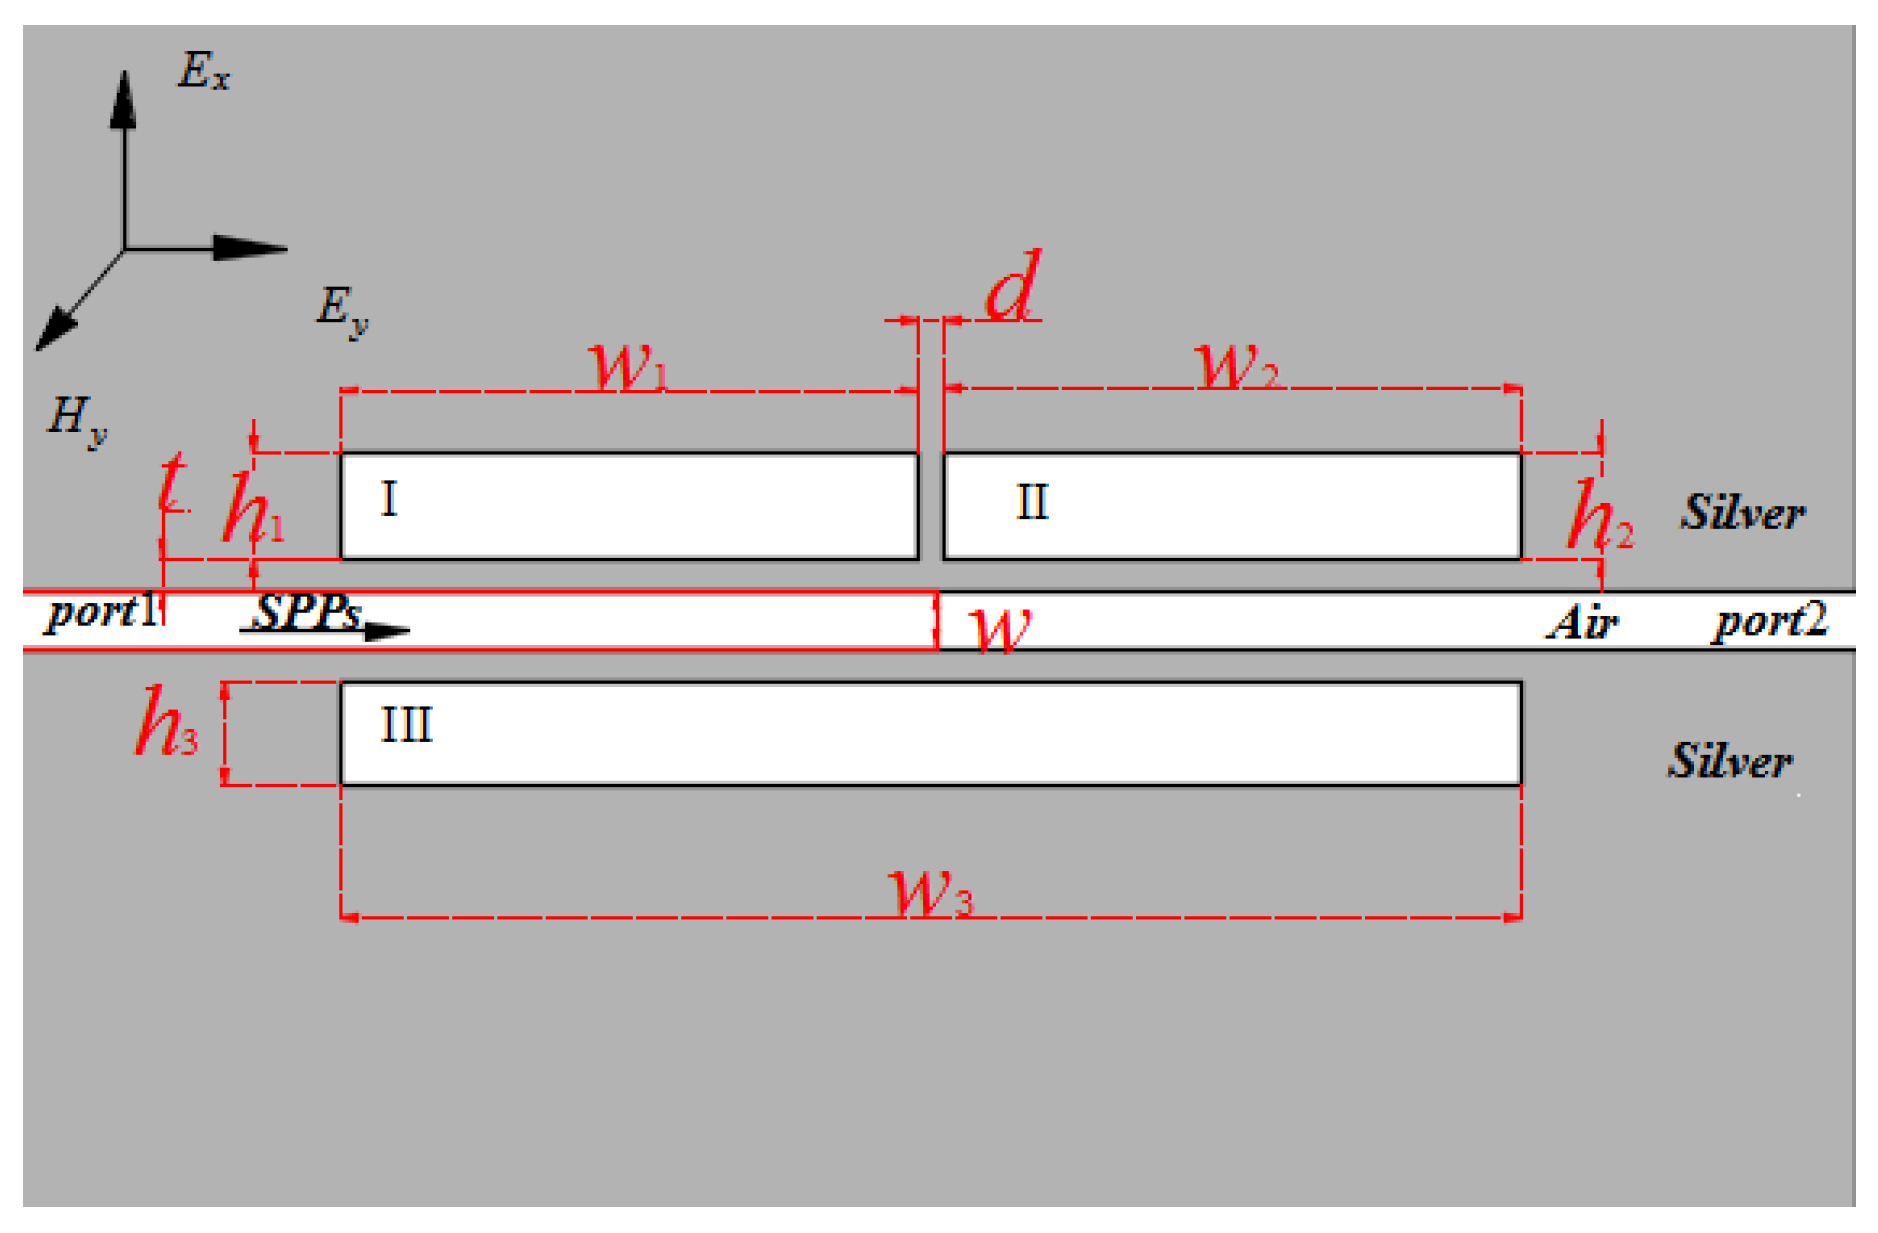
Figure 1. Structure diagram of a MIM structure with three rectangular resonators.
Sensors 23 00226 g001
Figure 2. Real part of the effective refractive index neff versus the incident wavelength λ and the width w in the MIM waveguide.
Sensors 23 00226 g002
Figure 3. (a) Transmission spectrum of the MIM waveguide with the three-rectangle resonators shown in Figure 1 when h1 = h2 = h3 = 90 nm and w3 = w1 + w2 + d = 1020 nm. The field distribution |Hz|2 of the structure at an incident wavelength of (b) 880 nm and (c) 1301 nm.
Sensors 23 00226 g003
Figure 4. Off-to-on transmission spectra of three-rectangle-resonator PIT system with different (a) w3, (b) h3, and (c) n3.
Sensors 23 00226 g004
Figure 5. (a) Transmission spectrum of the MIM waveguide with the three-rectangle resonators shown in Figure 1 when h3 = 120 nm. The field distribution |Hz|2 of the structure at the incident wavelengths of (b) 1251 nm, (c) 1281 nm, and (d) 1309 nm.
Sensors 23 00226 g005
Figure 6. Off-to-on transmission spectra of the three-rectangle-resonator PIT system with different values of h1 and w2.
Sensors 23 00226 g006
Figure 7. (a) Transmission spectrum of the MIM waveguide with the three-rectangle resonators shown in Figure 1 when h1 and w2 were synchronously changed. The field distribution |Hz|2 of the structure at incident wavelengths of (b) 1270 nm, (c) 1322 nm, (d) 1421 nm, (e) 1507 nm, and (f) 1549 nm.
Sensors 23 00226 g007
Figure 8. (a) Structure diagram of MIM with three rectangular resonators after adjusting cavity II. (b) Off-to-on transmission spectra of the four-rectangle-resonator PIT system with different h1 and h3 values.
Sensors 23 00226 g008
Figure 9. The field distribution |Hz|2 of the structure at (a) incident wavelength 1462 nm when h1, h3 = 60 nm; (b) incident wavelength 1397 nm when h1, h3 = 80 nm.
Sensors 23 00226 g009
Figure 10. Structure diagram of MIM with three rectangular resonators after cavities I and II were partially combined.
Sensors 23 00226 g010
Figure 11. (a) Structure diagram of a MIM with three rectangular resonators after cavities I and II were partially combined and w1 = w3 = 500 nm. (b) Off-to-on transmission spectra of the three-rectangle-resonator PIT system.
Sensors 23 00226 g011
Figure 12. (a) The field distribution |Hz|2 of the structure at (a) incident wavelength 666 nm when b = 390 nm; (b) incident wavelength 672 nm when b = 430 nm.
Sensors 23 00226 g012
Disclaimer/Publisher’s Note: The statements, opinions and data contained in all publications are solely those of the individual author(s) and contributor(s) and not of MDPI and/or the editor(s). MDPI and/or the editor(s) disclaim responsibility for any injury to people or property resulting from any ideas, methods, instructions or products referred to in the content.