
Bio-Inspired Micromachined Volumetric Flow Sensor with a Big Dynamic Range for Intravenous Systems


Abstract
:1. Introduction
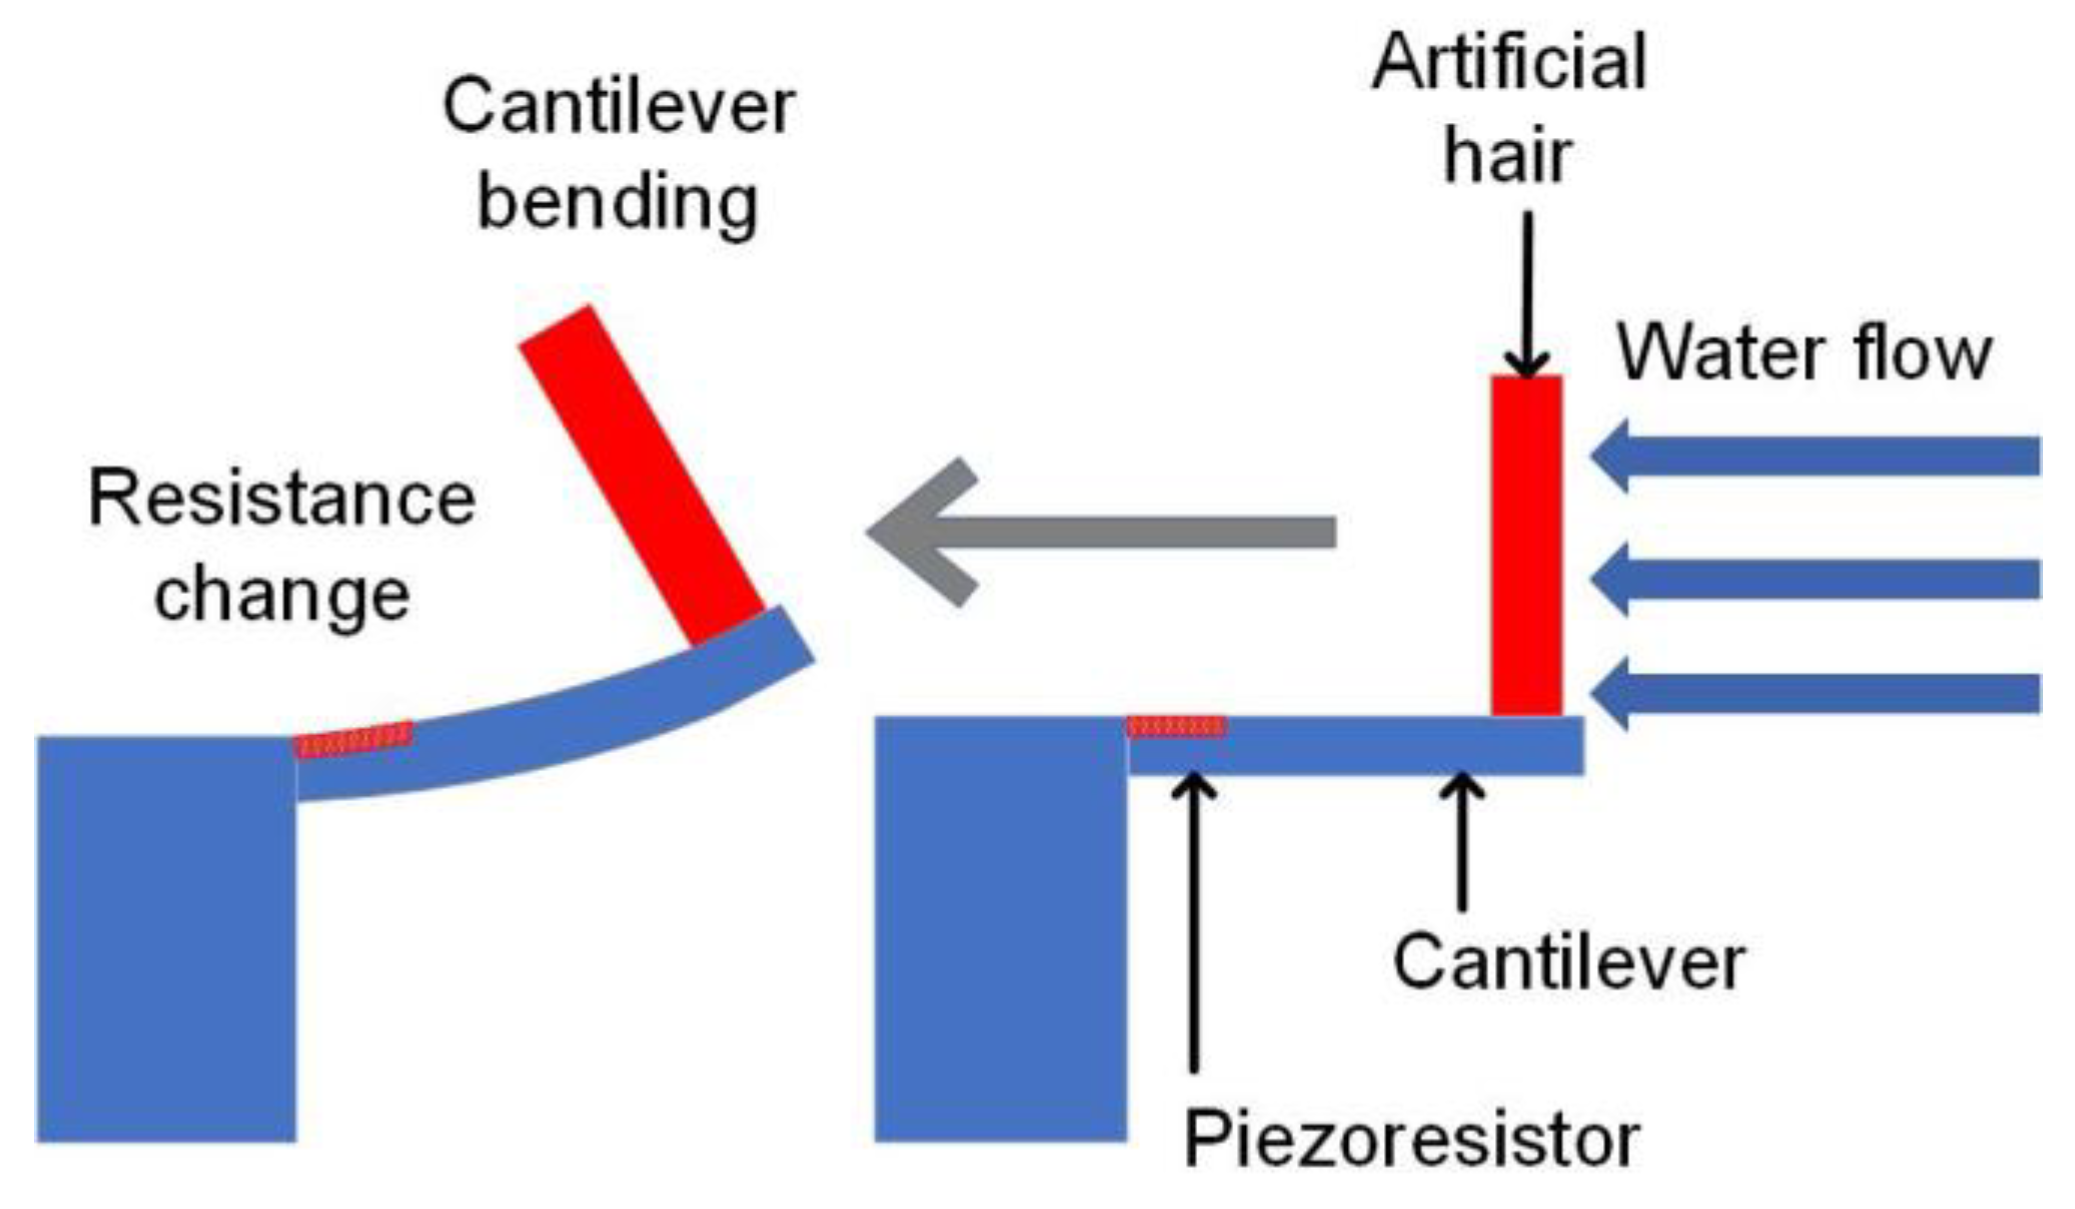
2. Sensor Design
2.1. Sensor Design
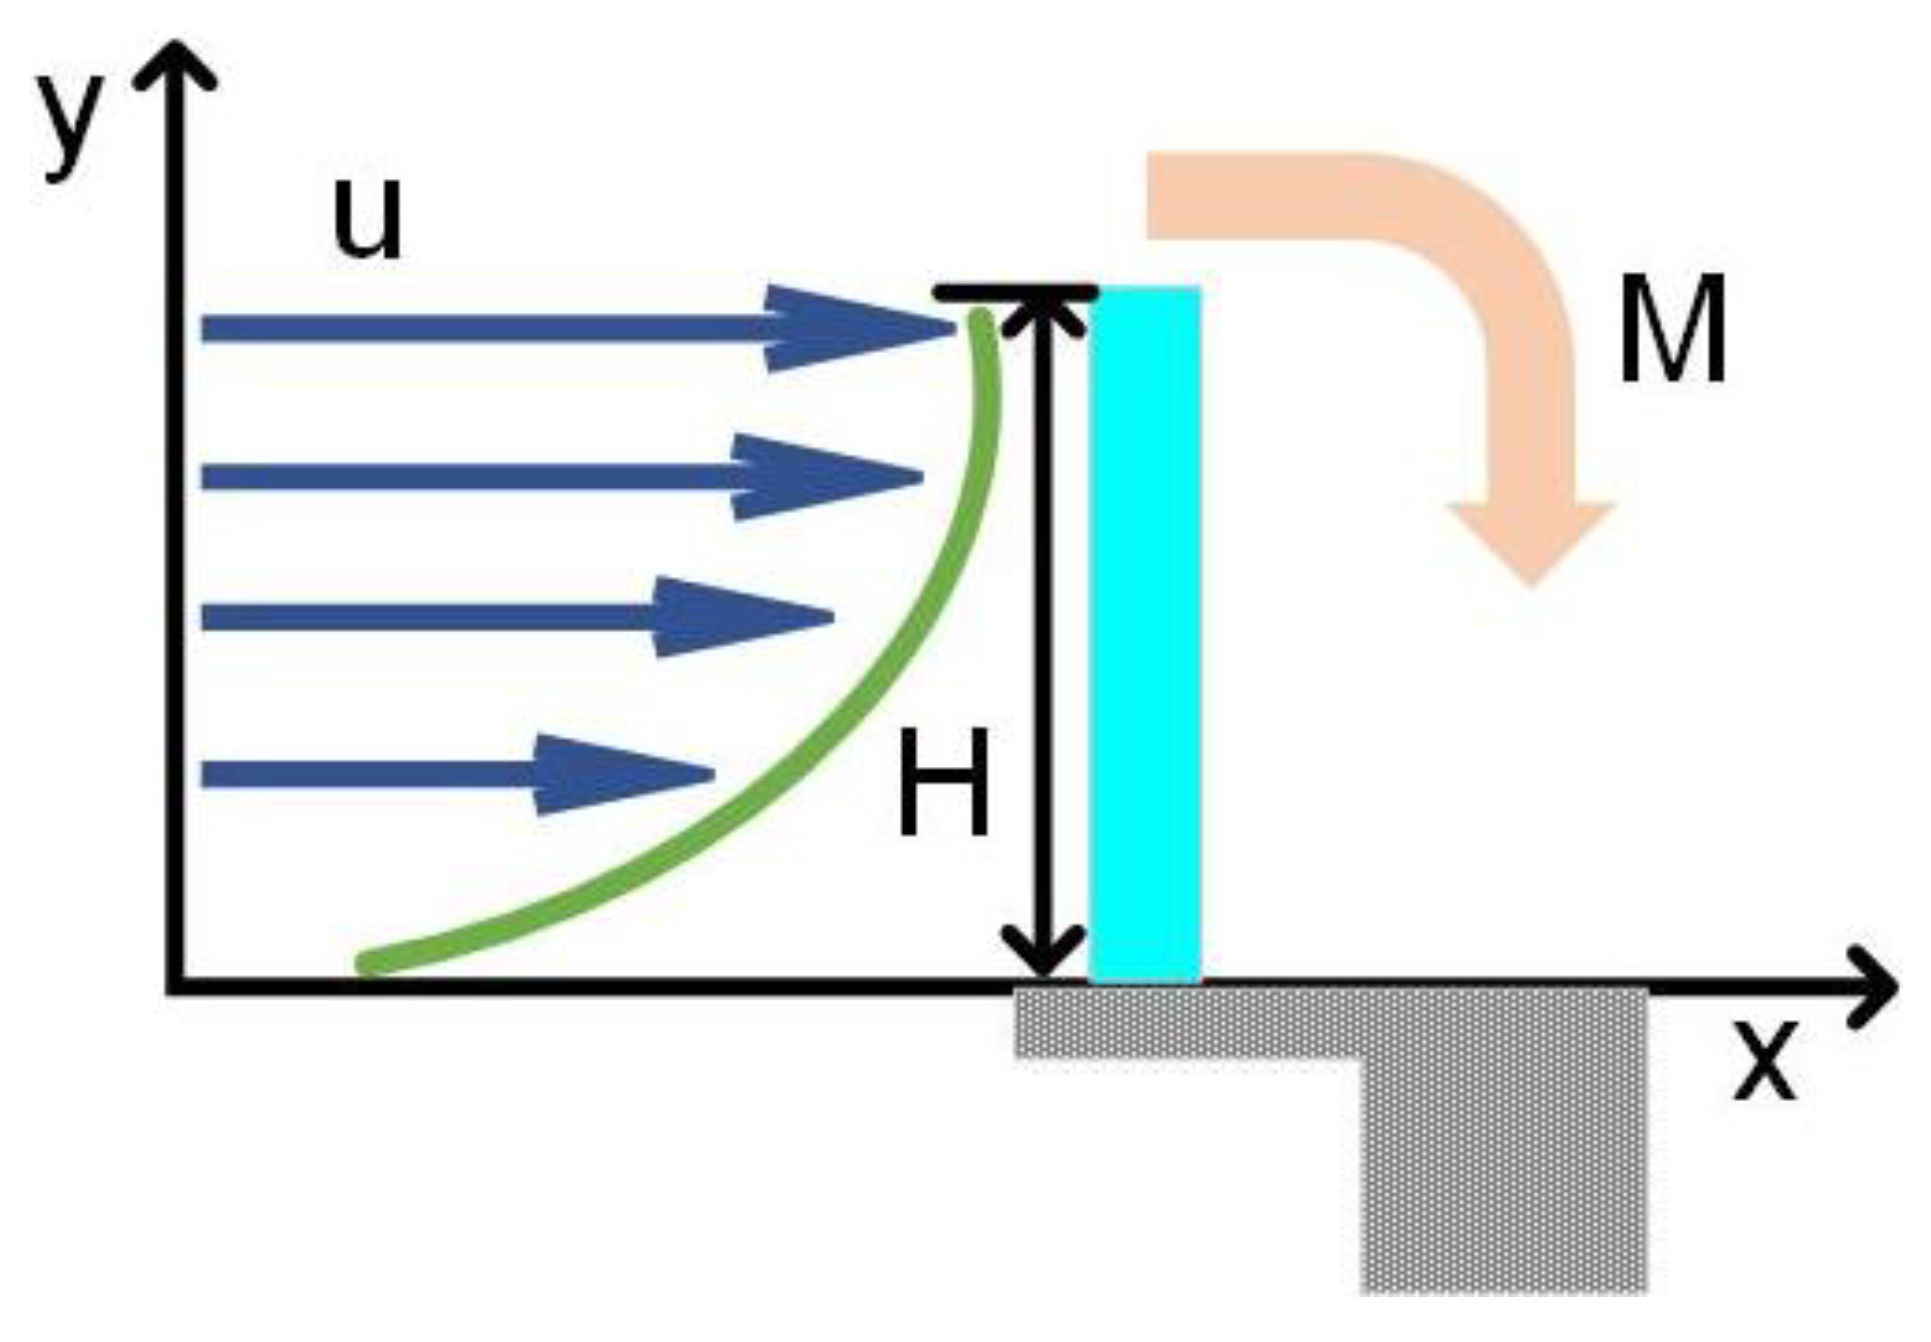
2.2. DC Flow Hydrodynamic Mode
2.2.1. Local Flow Profile and Volumetric Flow Rate
2.2.2. Strain Estimate of the Cantilever Beam
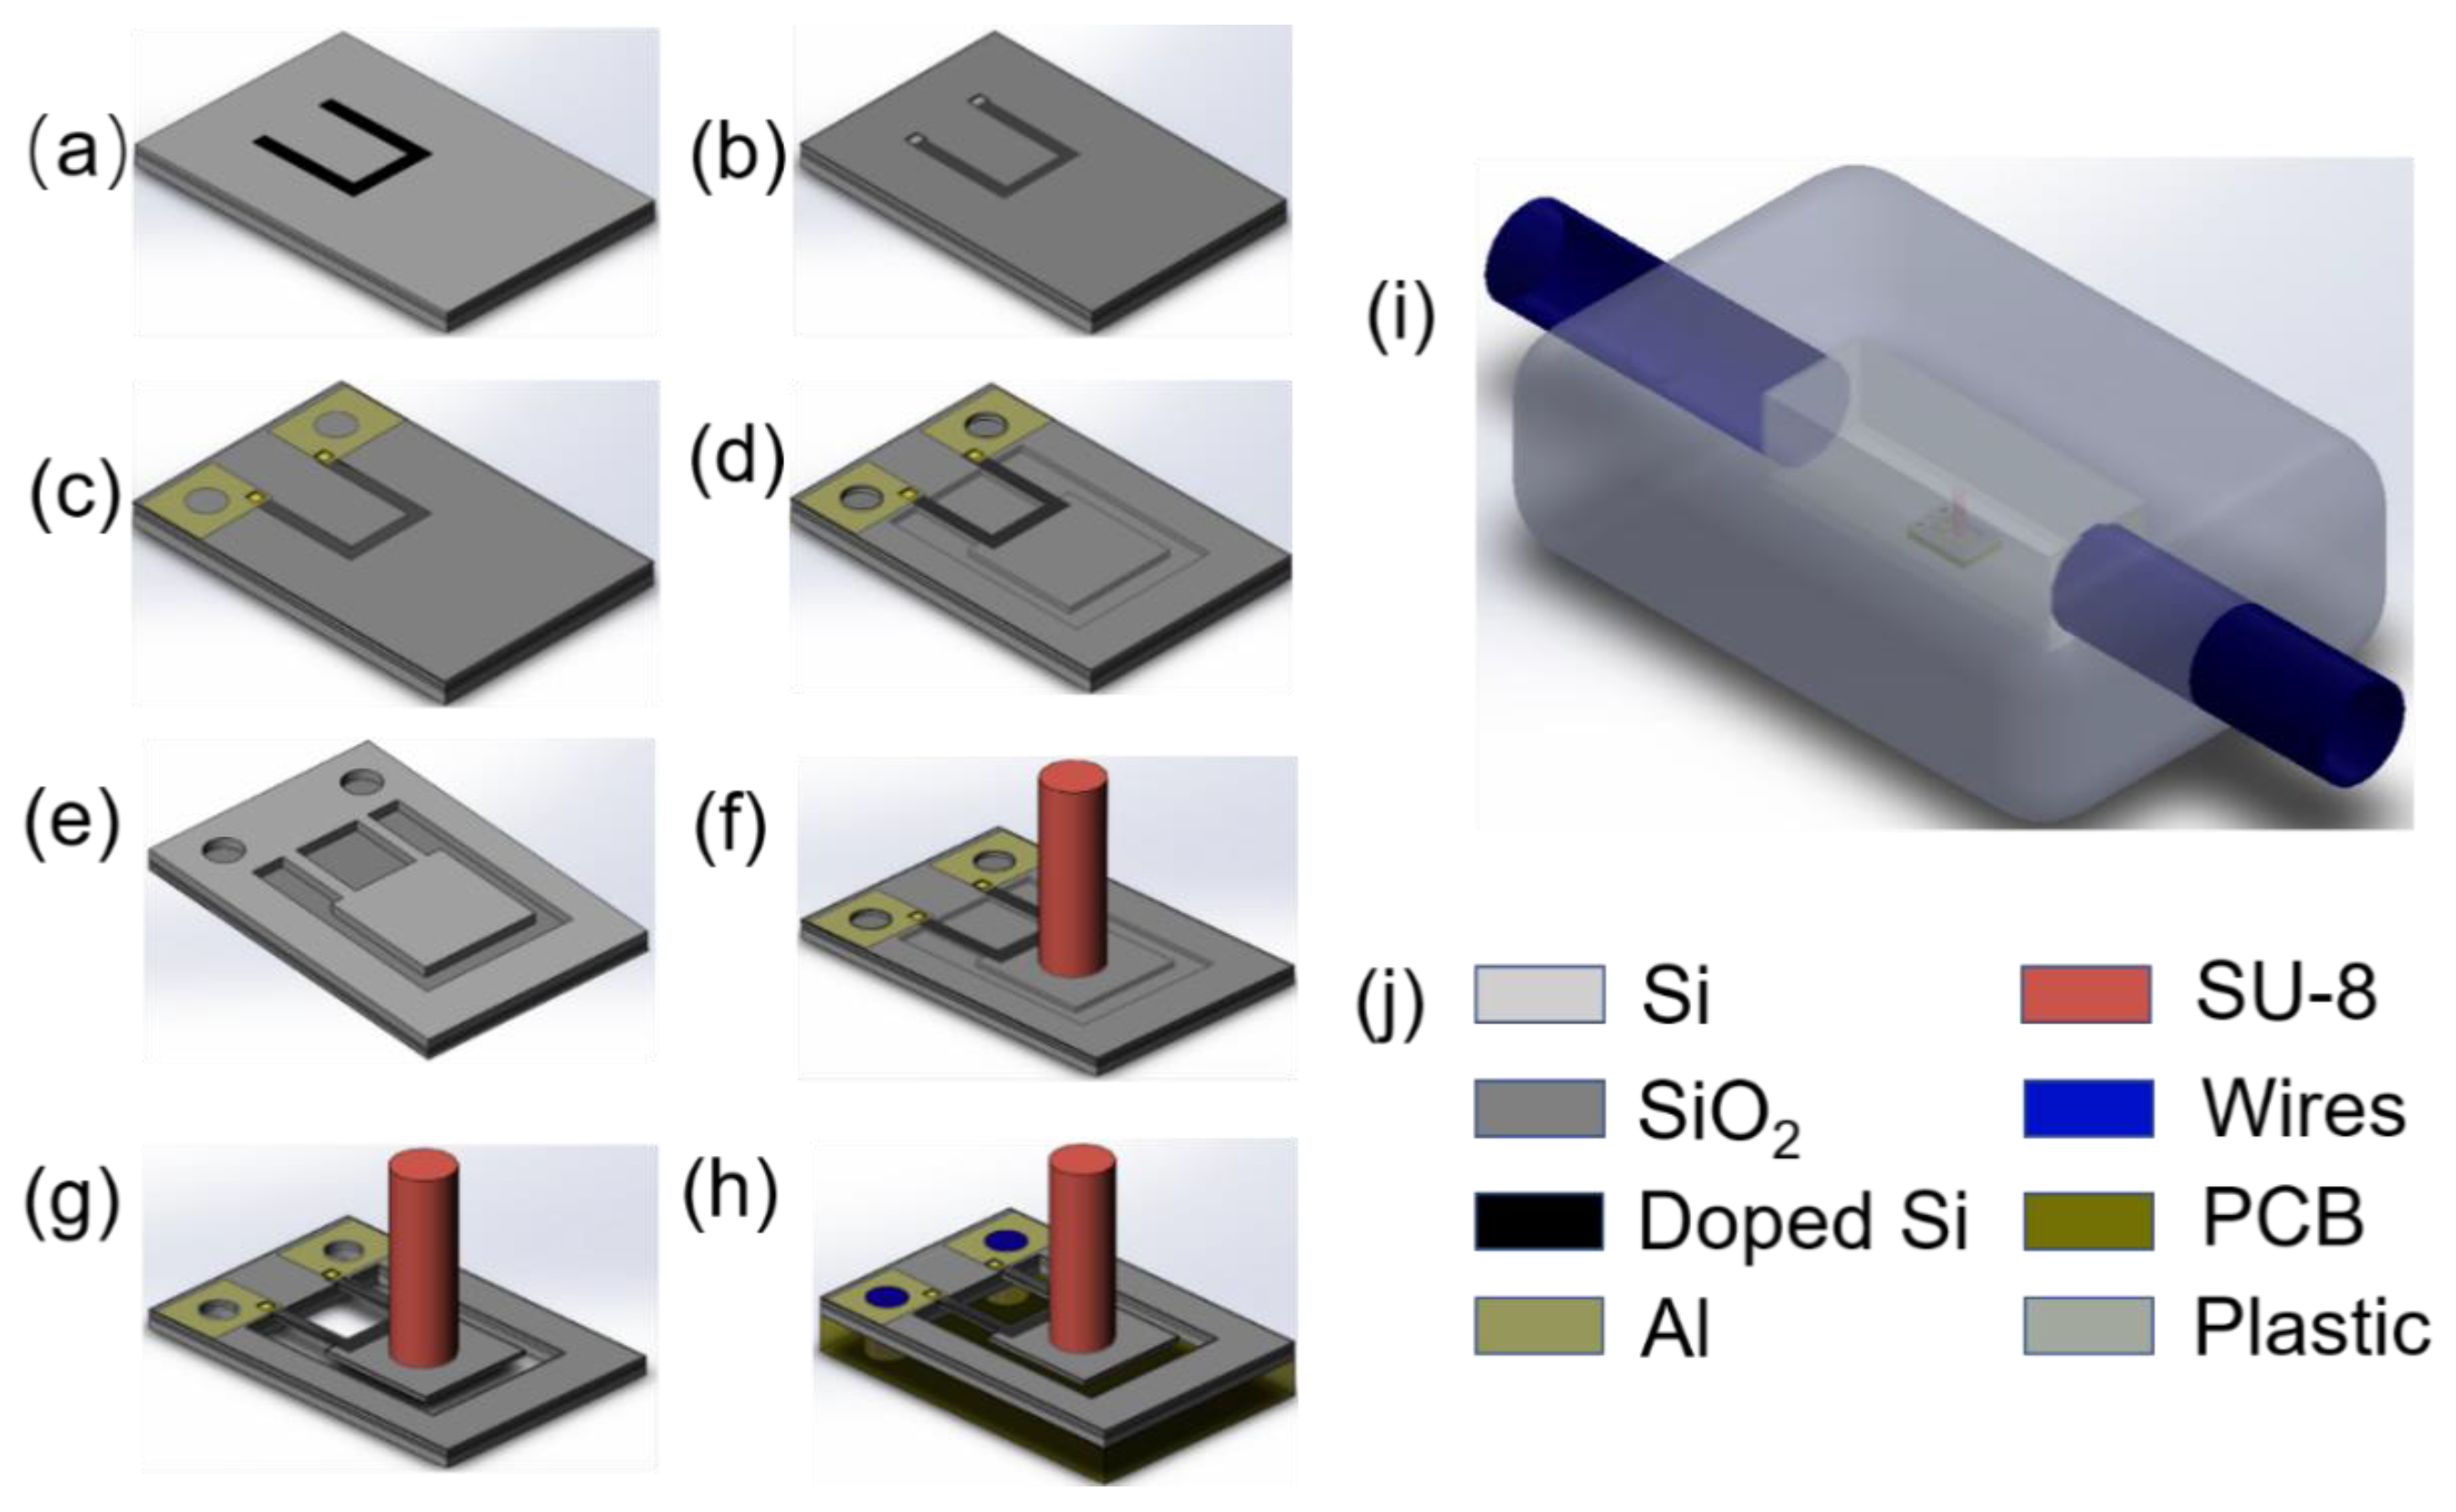
3. Fabrication
3.1. Sensor Fabrication
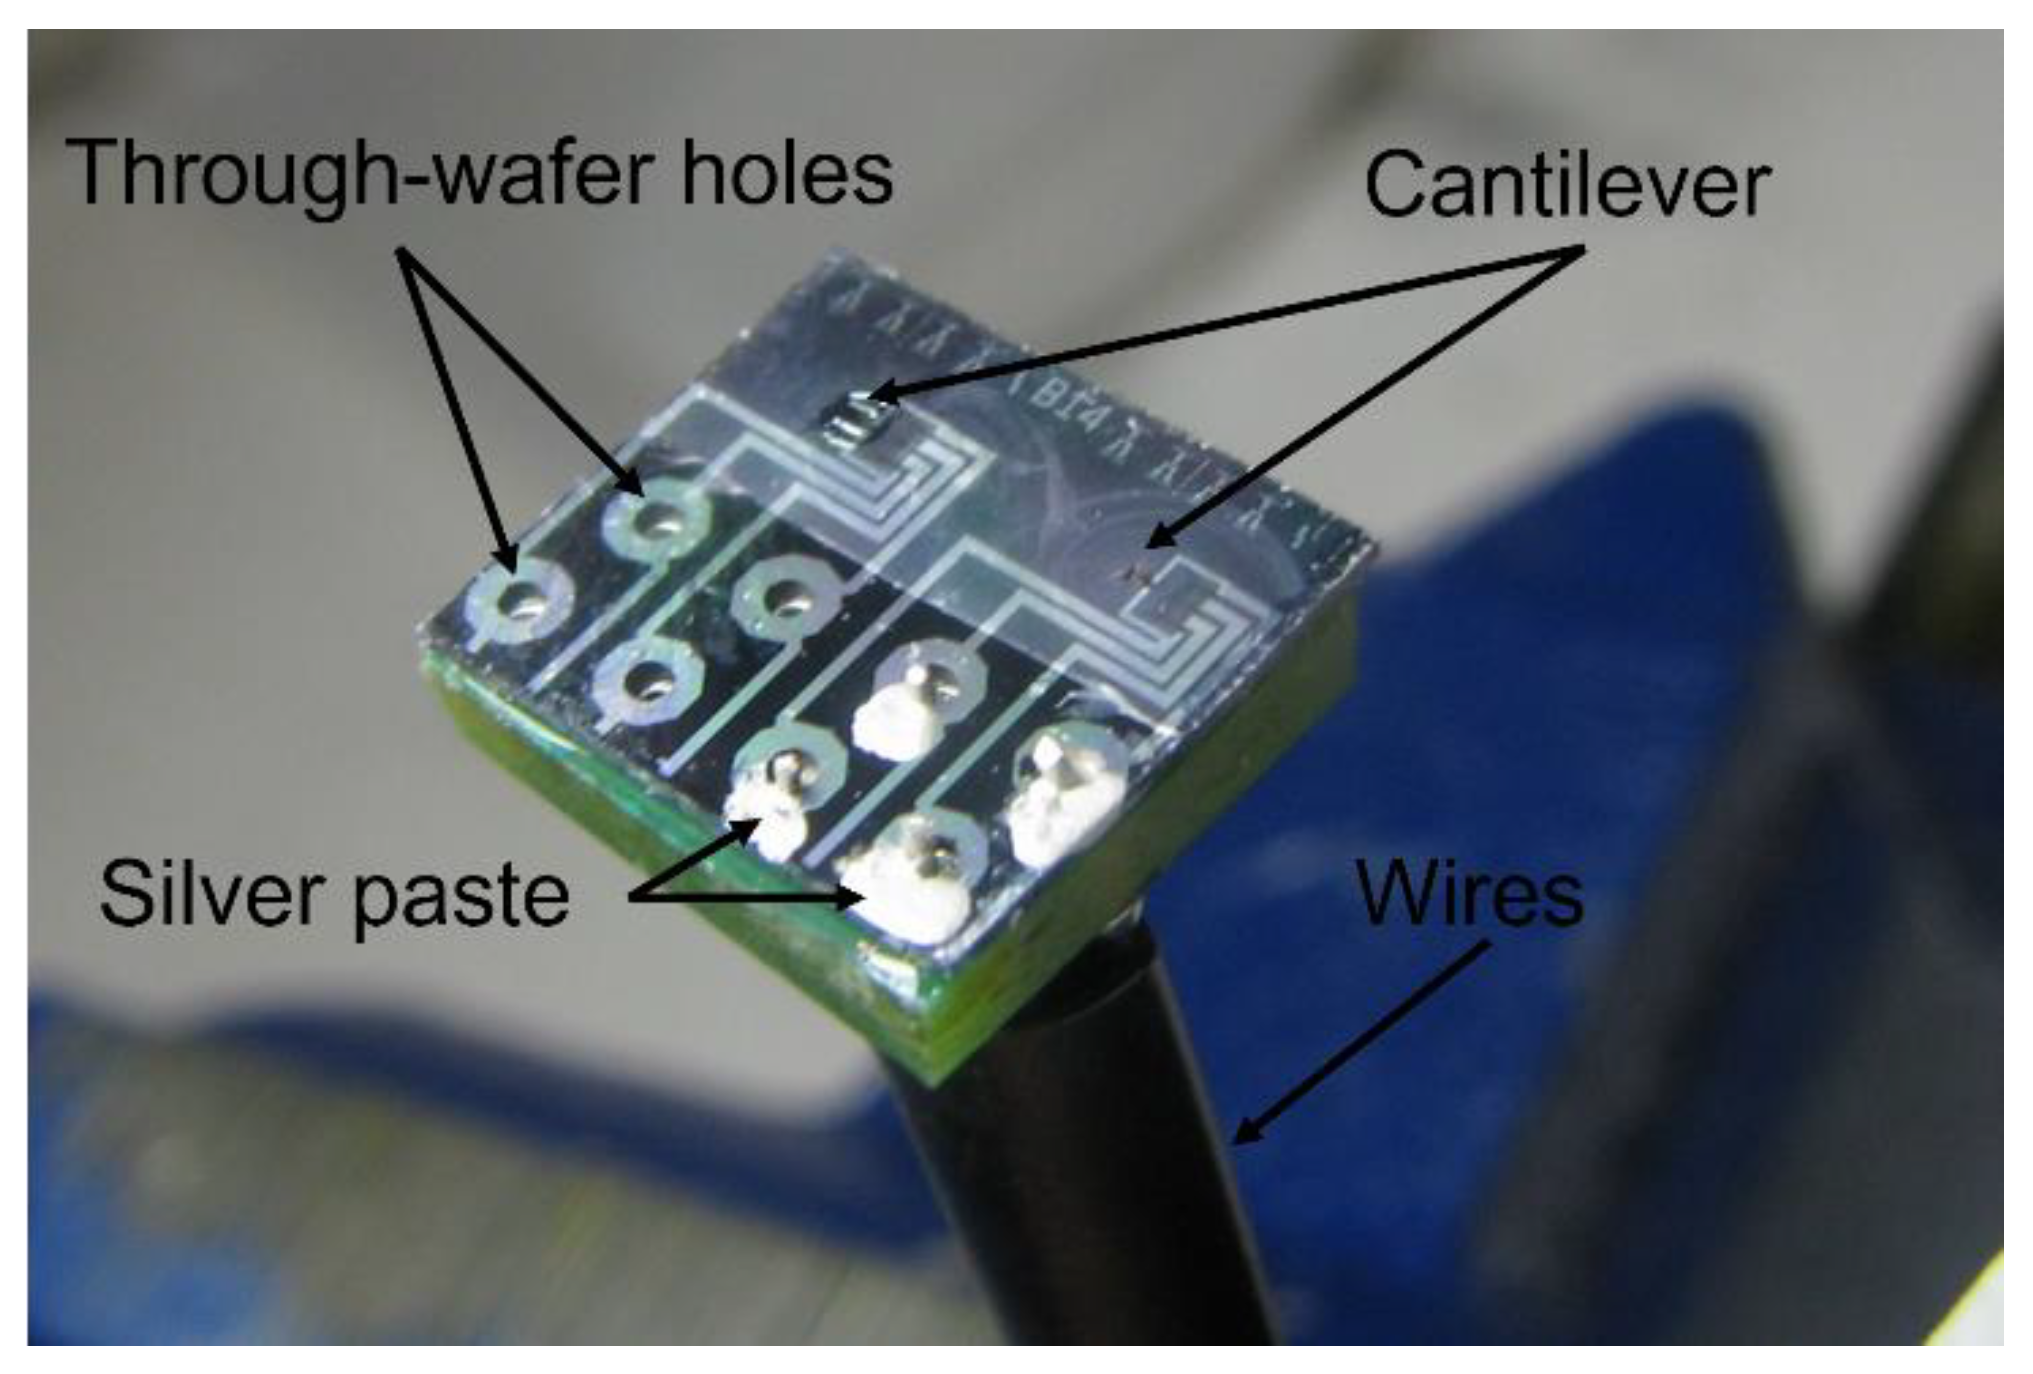
3.2. Sensor Packaging
4. Characterization and Discussion
5. Conclusions
Supplementary Materials
Author Contributions
Funding
Institutional Review Board Statement
Informed Consent Statement
Data Availability Statement
Acknowledgments
Conflicts of Interest
References
- Nour, M.A.; Hussain, M.M. A Review of the Real-Time Monitoring of Fluid-Properties in Tubular Architectures for Industrial Applications. Sensors 2020, 20, 3907. [Google Scholar] [CrossRef]
- Sheikh, S.I.M.; Hassan, E.E.M.; Iqbal, S. Capacitance Based Monitoring of a Three-Phase Crude-Oil Flow. IEEE Trans. Instrum. Meas. 2019, 69, 1213–1218. [Google Scholar] [CrossRef]
- Wu, T.; Wu, H.; Du, Y.; Peng, Z. Progress and trend of sensor technology for on-line oil monitoring. Sci. China Technol. Sci. 2013, 56, 2914–2926. [Google Scholar] [CrossRef]
- Tian, B.; Li, H.F.; Yang, H.; Song, D.L.; Bai, X.W.; Zhao, Y.L. A MEMS SOI-based piezoresistive fluid flow sensor. Rev. Sci. Instrum. 2018, 89, 025001. [Google Scholar] [CrossRef] [PubMed]
- Ejeian, F.; Azadi, S.; Razmjou, A.; Orooji, Y.; Kottapalli, A.; Ebrahimi Warkiani, M.; Asadnia, M. Design and applications of MEMS flow sensors: A review. Sens. Actuators A Phys. 2019, 295, 483–502. [Google Scholar] [CrossRef]
- Cobo, A.; Sheybani, R.; Meng, E. MEMS: Enabled Drug Delivery Systems. Adv. Healthc. Mater. 2015, 4, 969–982. [Google Scholar] [CrossRef]
- Abbasnejad, B.; Thorby, W.; Razmjou, A.; Jin, D.; Asadnia, M.; Ebrahimi Warkiani, M. MEMS piezoresistive flow sensors for sleep apnea therapy. Sens. Actuators A Phys. 2018, 279, 577–585. [Google Scholar] [CrossRef]
- Jiang, P.; Zhu, R. Elimination of Drifts in Long-Duration Monitoring for Apnea-Hypopnea of Human Respiration. Sensors 2016, 16, 1779. [Google Scholar] [CrossRef] [Green Version]
- Shokoueinejad, M.; Fernandez, C.; Carroll, E.; Wang, F.; Levin, J.; Rusk, S.; Glattard, N.; Mulchrone, A.; Zhang, X.; Xie, A.; et al. Sleep apnea: A review of diagnostic sensors, algorithms, and therapies. Physiol. Meas. 2017, 38, R204–R252. [Google Scholar] [CrossRef]
- Judy, J.W. Microelectromechanical systems (MEMS): Fabrication, design and applications. Smart Mater. Struct. 2001, 10, 1115–1134. [Google Scholar] [CrossRef]
- Jiang, T.; Deng, L.; Qiu, W.; Liang, J.; Wu, Y.; Shao, Z.; Wang, D.; Zhang, M.; Qian, X.; Zhong, J.; et al. Wearable breath monitoring via a hot-film/calorimetric airflow sensing system. Biosens. Bioelectron. 2020, 163, 112288. [Google Scholar] [CrossRef]
- Kuo, J.T.W.; Yu, L.; Meng, E. Micromachined Thermal Flow Sensors—A Review. Micromachines 2012, 3, 550–573. [Google Scholar] [CrossRef] [Green Version]
- Pommois, R.; Furusawa, G.; Kosuge, T.; Yasunaga, S.; Hanawa, H.; Takahashi, H.; Kan, T.; Aoyama, H. Micro Water Flow Measurement Using a Temperature-Compensated MEMS Piezoresistive Cantilever. Micromachines 2020, 11, 647. [Google Scholar] [CrossRef]
- Kottapalli, A.G.P.; Bora, M.; Kanhere, E.; Asadnia, M.; Miao, J.; Triantafyllou, M.S. Cupula-Inspired Hyaluronic Acid-Based Hydrogel Encapsulation to Form Biomimetic MEMS Flow Sensors. Sensors 2017, 17, 1728. [Google Scholar] [CrossRef] [Green Version]
- Raoufi, M.A.; Moshizi, S.A.; Razmjou, A.; Wu, S.; Ebrahimi Warkiani, M.; Asadnia, M. Development of a Biomimetic Semicircular Canal With MEMS Sensors to Restore Balance. IEEE Sens. J. 2019, 19, 11675–11686. [Google Scholar] [CrossRef]
- Zhang, X.; Shan, X.; Xie, T.; Miao, J. A new sensor inspired by the lateral-line system of fish using the self-powered d33 mode piezoelectric diaphragm for hydrodynamic sensing. Mech. Syst. Signal Process. 2020, 141, 106476. [Google Scholar] [CrossRef]
- Bora, M.; Kottapalli, A.G.P.; Miao, J.M.; Triantafyllou, M.S. Fish-inspired self-powered microelectromechanical flow sensor with biomimetic hydrogel cupula. Adv. Mater. 2017, 5, 1604827. [Google Scholar] [CrossRef] [Green Version]
- Nguyen, S.D.; Paprotny, I.; Wright, P.K.; White, R.M. MEMS capacitive flow sensor for natural gas pipelines. Sens. Actuators A Phys. 2015, 231, 28–34. [Google Scholar] [CrossRef]
- Haneveld, J.; Lammerink, T.S.J.; de Boer, M.J.; Sanders, R.G.P.; Mehendale, A.; Lötters, J.C.; Dijkstra, M.; Wiegerink, R.J. Modeling, design, fabrication and characterization of a micro Coriolis mass flow sensor. J. Micromech. Microeng. 2010, 20, 125001. [Google Scholar] [CrossRef]
- Vadivelu, B.; Meyyazhagan, A.; Palanisamy, S.; Anand, V.; Chelliapan, K.K.Y. Synthesis of silver nanoparticles from fish scale extract of Cyprinus carpio and its decolorization activity of textile dyes. J. Environ. Treat. Technol. 2020, 8, 870–874. [Google Scholar]
- Ha, N.S.; Lu, G.X. A review of recent research on bio-inspired structures and materials for energy absorption applications. Compos. Part B-Eng. 2020, 181, 107496. [Google Scholar] [CrossRef]
- Argyrakis, P.; Hamilton, A.; Webb, B.; Zhang, Y.; Gonos, T.; Cheung, R. Fabrication and characterization of a wind sensor for integration with a neuron circuit. Microelectron. Eng. 2007, 84, 1749–1753. [Google Scholar] [CrossRef]
- Bian, Y.; Zhang, Y.; Xia, X. Design and Fabrication of a Multi-electrode Metal-core Piezoelectric Fiber and Its Application as an Airflow Sensor. J. Bionic Eng. 2016, 13, 416–425. [Google Scholar] [CrossRef]
- Dagamseh, A.M.K.; Lammerink, T.S.J.; Kolster, M.L.; Bruinink, C.M.; Wiegerink, R.J.; Krijnen, G.J.M. Dipole-source localization using biomimetic flow-sensor arrays positioned as lateral-line system. Sens. Actuators A Phys. 2010, 162, 355–360. [Google Scholar] [CrossRef]
- Han, Z.; Liu, L.; Wang, K.; Song, H.; Chen, D.; Wang, Z.; Niu, S.; Zhang, J.; Ren, L. Artificial Hair-Like Sensors Inspired from Nature: A Review. J. Bionic Eng. 2018, 15, 409–434. [Google Scholar] [CrossRef]
- Jiang, Y.; Ma, Z.; Zhang, D. Flow field perception based on the fish lateral line system. Bioinspir. Biomim. 2019, 14, 041001. [Google Scholar] [CrossRef]
- Xue, C.; Chen, S.; Zhang, W.; Zhang, B.; Zhang, G.; Qiao, H. Design, fabrication, and preliminary characterization of a novel MEMS bionic vector hydrophone. Microelectron. J. 2007, 38, 1021–1026. [Google Scholar] [CrossRef]
- Bai, B.; Ren, Z.; Ding, J.; Xu, W.; Zhang, G.; Liu, J.; Zhang, W.; Xue, C.; Zhang, B.; Wang, R. Cross-supported planar MEMS vector hydrophone for high impact resistance. Sens. Actuators A Phys. 2017, 263, 563–570. [Google Scholar] [CrossRef]
- Nannan, C.; Tucker, C.; Engel, J.M.; Yingchen, Y.; Pandya, S.; Chang, L. Design and Characterization of Artificial Haircell Sensor for Flow Sensing with Ultrahigh Velocity and Angular Sensitivity. J. Microelectromech. Syst. 2007, 16, 999–1014. [Google Scholar] [CrossRef]
- Kim, B.J.; Meng, E. Micromachining of Parylene C for bioMEMS. Polym. Adv. Technol. 2016, 27, 564–576. [Google Scholar] [CrossRef]
- Golda-Cepa, M.; Engvall, K.; Hakkarainen, M.; Kotarba, A. Recent progress on parylene C polymer for biomedical applications: A review. Prog. Org. Coat. 2020, 140, 105493. [Google Scholar] [CrossRef]
- White, F.M.; Majdalani, J. Viscous Fluid Flow; McGraw-Hill: New York, NY, USA, 2006; Volume 3. [Google Scholar]
- Marty, F.; Rousseau, L.; Saadany, B.; Mercier, B.; Francais, O.; Mita, Y.; Bourouina, T. Advanced etching of silicon based on deep reactive ion etching for silicon high aspect ratio microstructures and three-dimensional micro- and nanostructures. Microelectron. J. 2005, 36, 673–677. [Google Scholar] [CrossRef]
- Tan, C.P.; Craighead, H.G. Surface Engineering and Patterning Using Parylene for Biological Applications. Materials 2010, 3, 1803–1832. [Google Scholar] [CrossRef] [Green Version]
- Alagundagi, S.S.; Pasala, K.; Arora, M. Opto-Electronic System for Intravenous Infusion Monitoring. In Proceedings of the 10th International Conference on Communication Systems and Networks (COMSNETS), Bangalore, India, 3–7 January 2018; pp. 688–692. [Google Scholar]
- Cho, J.H.; Wei, Q.; Lee, J.; Seong, K.W.; Kim, M.-N. The Design of a Wireless Flexible Capacitive Sensor Detection System to Detect Liquid Level in Plastic Bag Intravenous Drip Sets. Biomed. Eng. Lett. 2011, 1, 247–253. [Google Scholar] [CrossRef]
- Wang, M.; Chen, J. A high-precision gravity intravenous infusion rate meter using CMUT arrays. In Proceedings of the 2009 IEEE International Ultrasonics Symposium, Rome, Italy, 20–23 September 2009; pp. 1355–1358. [Google Scholar]
- Preethi, S.; Akshaya, A.; Seshadri, H.; Kumar, V.; Devi, R.S.; Rengarajan, A.; Thenmozhi, K.; Praveenkumar, P. IoT based Healthcare Monitoring and Intravenous Flow Control. In Proceedings of the 10th International Conference on Computer Communication and Informatics (ICCCI), Coimbatore, India, 22–24 January 2020; pp. 290–295. [Google Scholar]
- Oros, D.; Pencic, M.; Sulc, J.; Cavic, M.; Stankovski, S.; Ostojic, G.; Ivanov, O. Smart Intravenous Infusion Dosing System. Appl. Sci. 2021, 11, 513. [Google Scholar] [CrossRef]
- van der Eijk, A.C.; van Rens, R.M.; Dankelman, J.; Smit, B.J. A literature review on flow-rate variability in neonatal IV therapy. Paediatr. Anaesth. 2013, 23, 9–21. [Google Scholar] [CrossRef]
- Sherwin, C.M.; Medlicott, N.J.; Reith, D.M.; Broadbent, R.S. Intravenous drug delivery in neonates: Lessons learnt. Arch. Dis. Child 2014, 99, 590–594. [Google Scholar] [CrossRef]
- Hagihghi, R.; Razmjou, A.; Orooji, Y.; Warkiani, M.E.; Asadnia, M. A miniaturized piezoresistive flow sensor for real-time monitoring of intravenous infusion. J. Biomed. Mater. Res. B Appl. Biomater. 2020, 108, 568–576. [Google Scholar] [CrossRef]
- Cahyanurani, A.; Hadiyoso, S.; Aulia, S.; Faqih, M. Design and development of a monitoring and controlling system for multi-intravenous infusion. In Journal of Physics: Conference Series; IOP Publishing: Bristol, UK, 2019; Volume 1367. [Google Scholar] [CrossRef] [Green Version]
- Shen, Z.Y.; Kottapalli, A.G.P.; Subramaniam, V.; Miao, J.M.; Asadnia, M.; Triantafyllou, M. Biomimetic Flow Sensors for Biomedical Flow Sensing in Intravenous Tubes. In Proceedings of the 15th IEEE Sensors Conference, Orlando, FL, USA, 30 October–3 November 2016. [Google Scholar]
- Lee, D.; Kim, J.; Park, Y.; Lee, K.-H.; Kim, C.; Kwon, O.; Kim, S.; Lee, S.-R. Sensitive and reliable thermal micro-flow sensor for a drug infusion system. Sens. Actuators A Phys. 2020, 309, 112033. [Google Scholar] [CrossRef]


Disclaimer/Publisher’s Note: The statements, opinions and data contained in all publications are solely those of the individual author(s) and contributor(s) and not of MDPI and/or the editor(s). MDPI and/or the editor(s) disclaim responsibility for any injury to people or property resulting from any ideas, methods, instructions or products referred to in the content. |
© 2022 by the authors. Licensee MDPI, Basel, Switzerland. This article is an open access article distributed under the terms and conditions of the Creative Commons Attribution (CC BY) license (https://creativecommons.org/licenses/by/4.0/).
Share and Cite
Zhang, L.; Yang, Y.; Bertos, G.A.; Liu, C.; Hu, H. Bio-Inspired Micromachined Volumetric Flow Sensor with a Big Dynamic Range for Intravenous Systems. Sensors 2023, 23, 234. https://doi.org/10.3390/s23010234
Zhang L, Yang Y, Bertos GA, Liu C, Hu H. Bio-Inspired Micromachined Volumetric Flow Sensor with a Big Dynamic Range for Intravenous Systems. Sensors. 2023; 23(1):234. https://doi.org/10.3390/s23010234
Chicago/Turabian StyleZhang, Lansheng, Yingchen Yang, Georgios A. Bertos, Chang Liu, and Huan Hu. 2023. "Bio-Inspired Micromachined Volumetric Flow Sensor with a Big Dynamic Range for Intravenous Systems" Sensors 23, no. 1: 234. https://doi.org/10.3390/s23010234