
Evaluation of a Respiration Rate Sensor for Recording Tidal Volume in Calves under Field Conditions

 ,
,  ,
,  and
and 
Abstract
:1. Introduction
2. Animals, Materials and Methods
2.1. Study Design
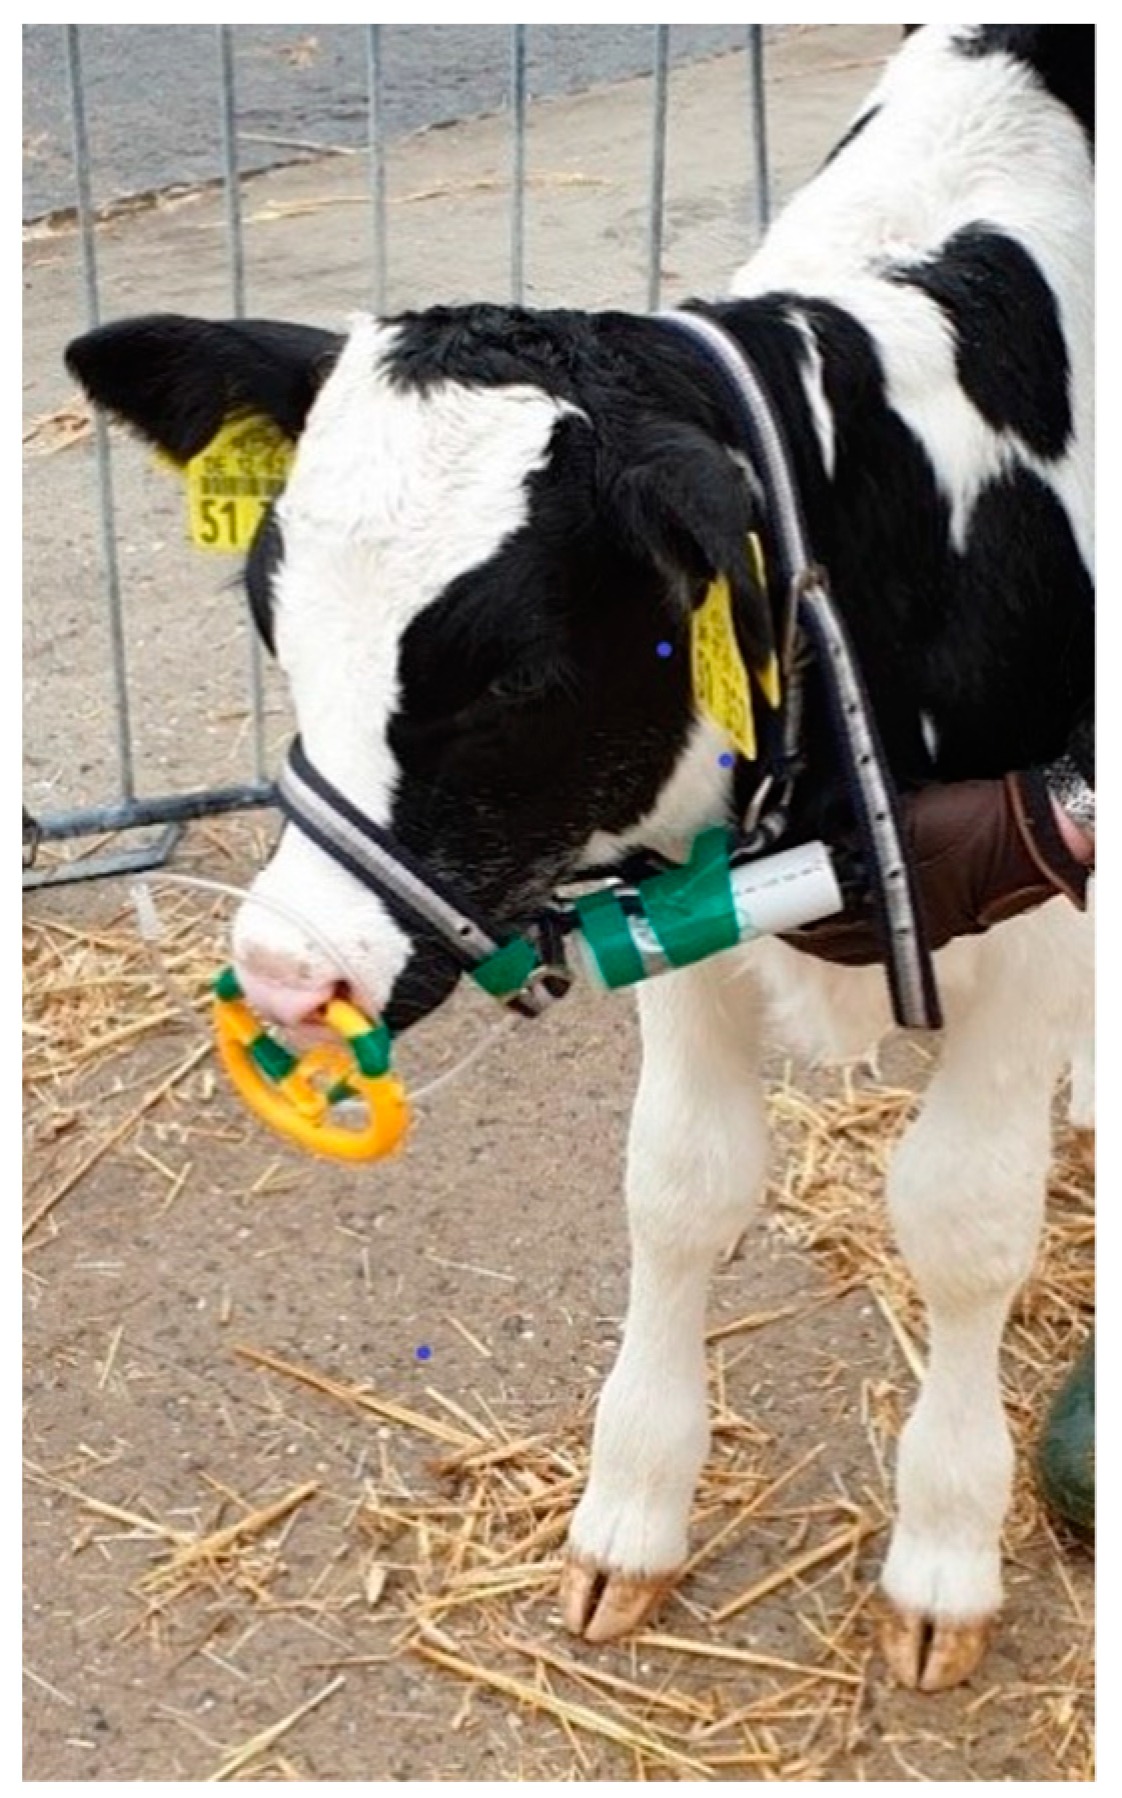
2.2. Measurements with the RR Sensor
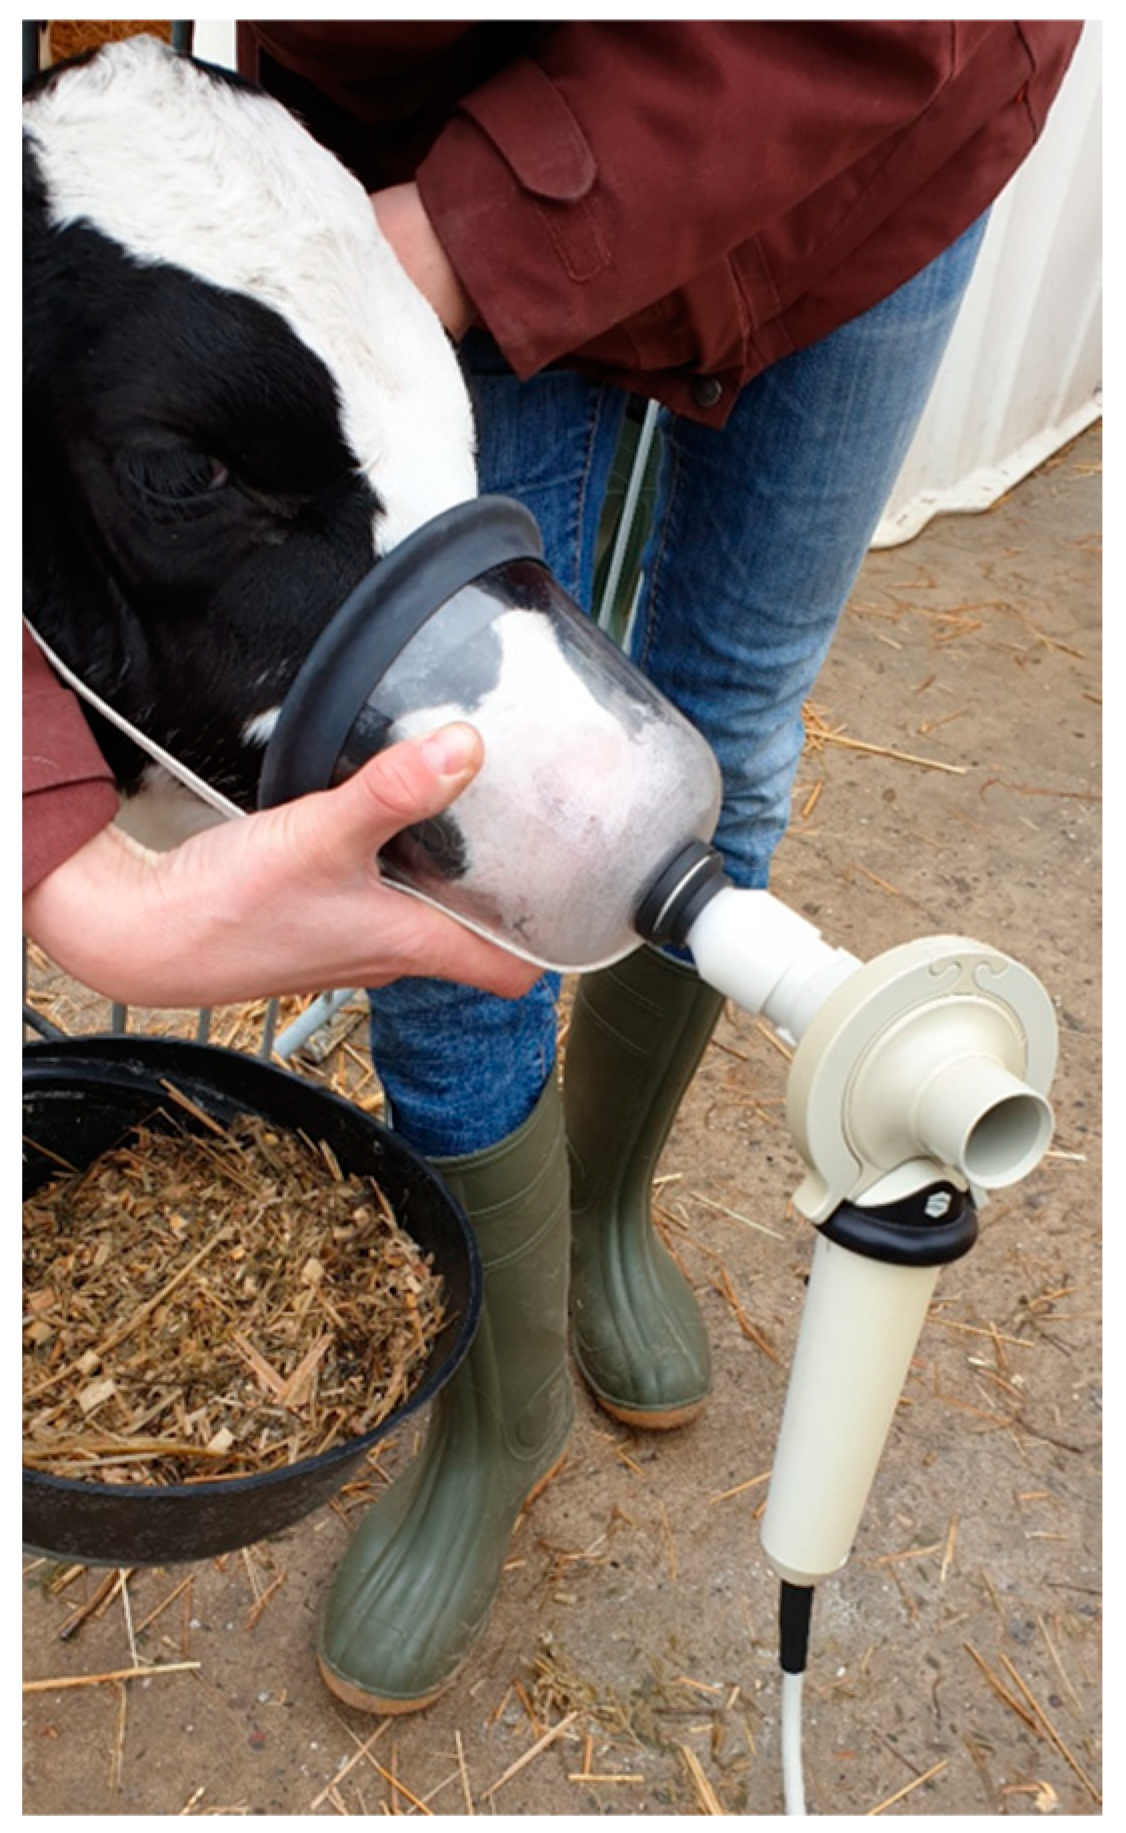
2.3. Measurements with the IOS
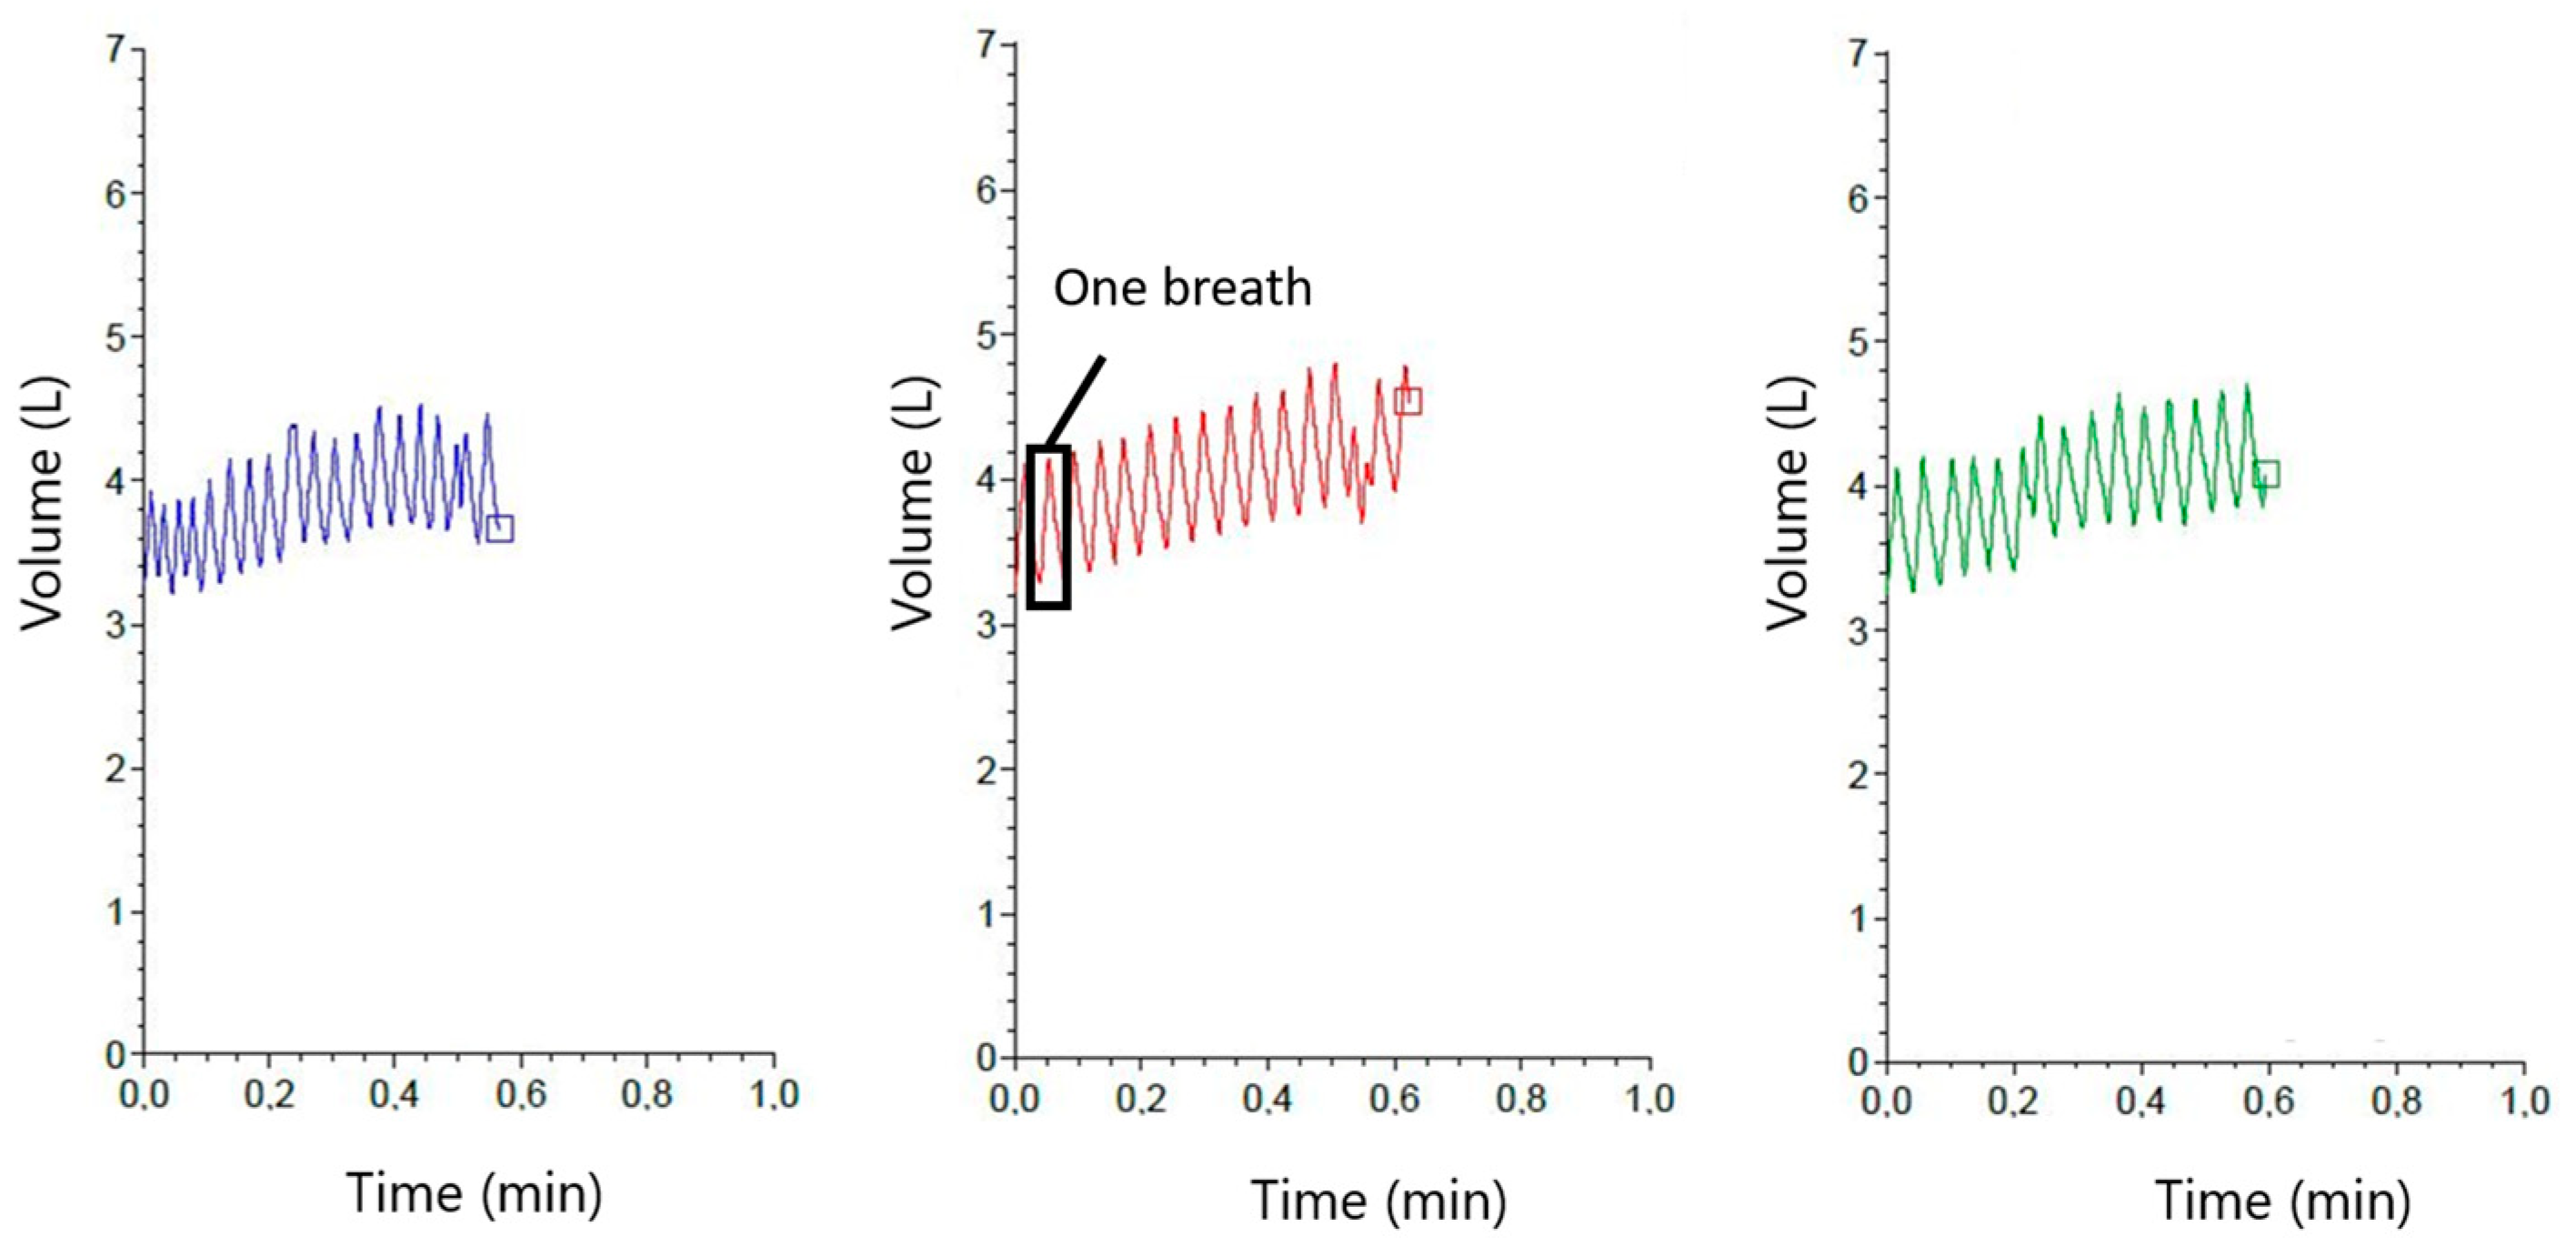
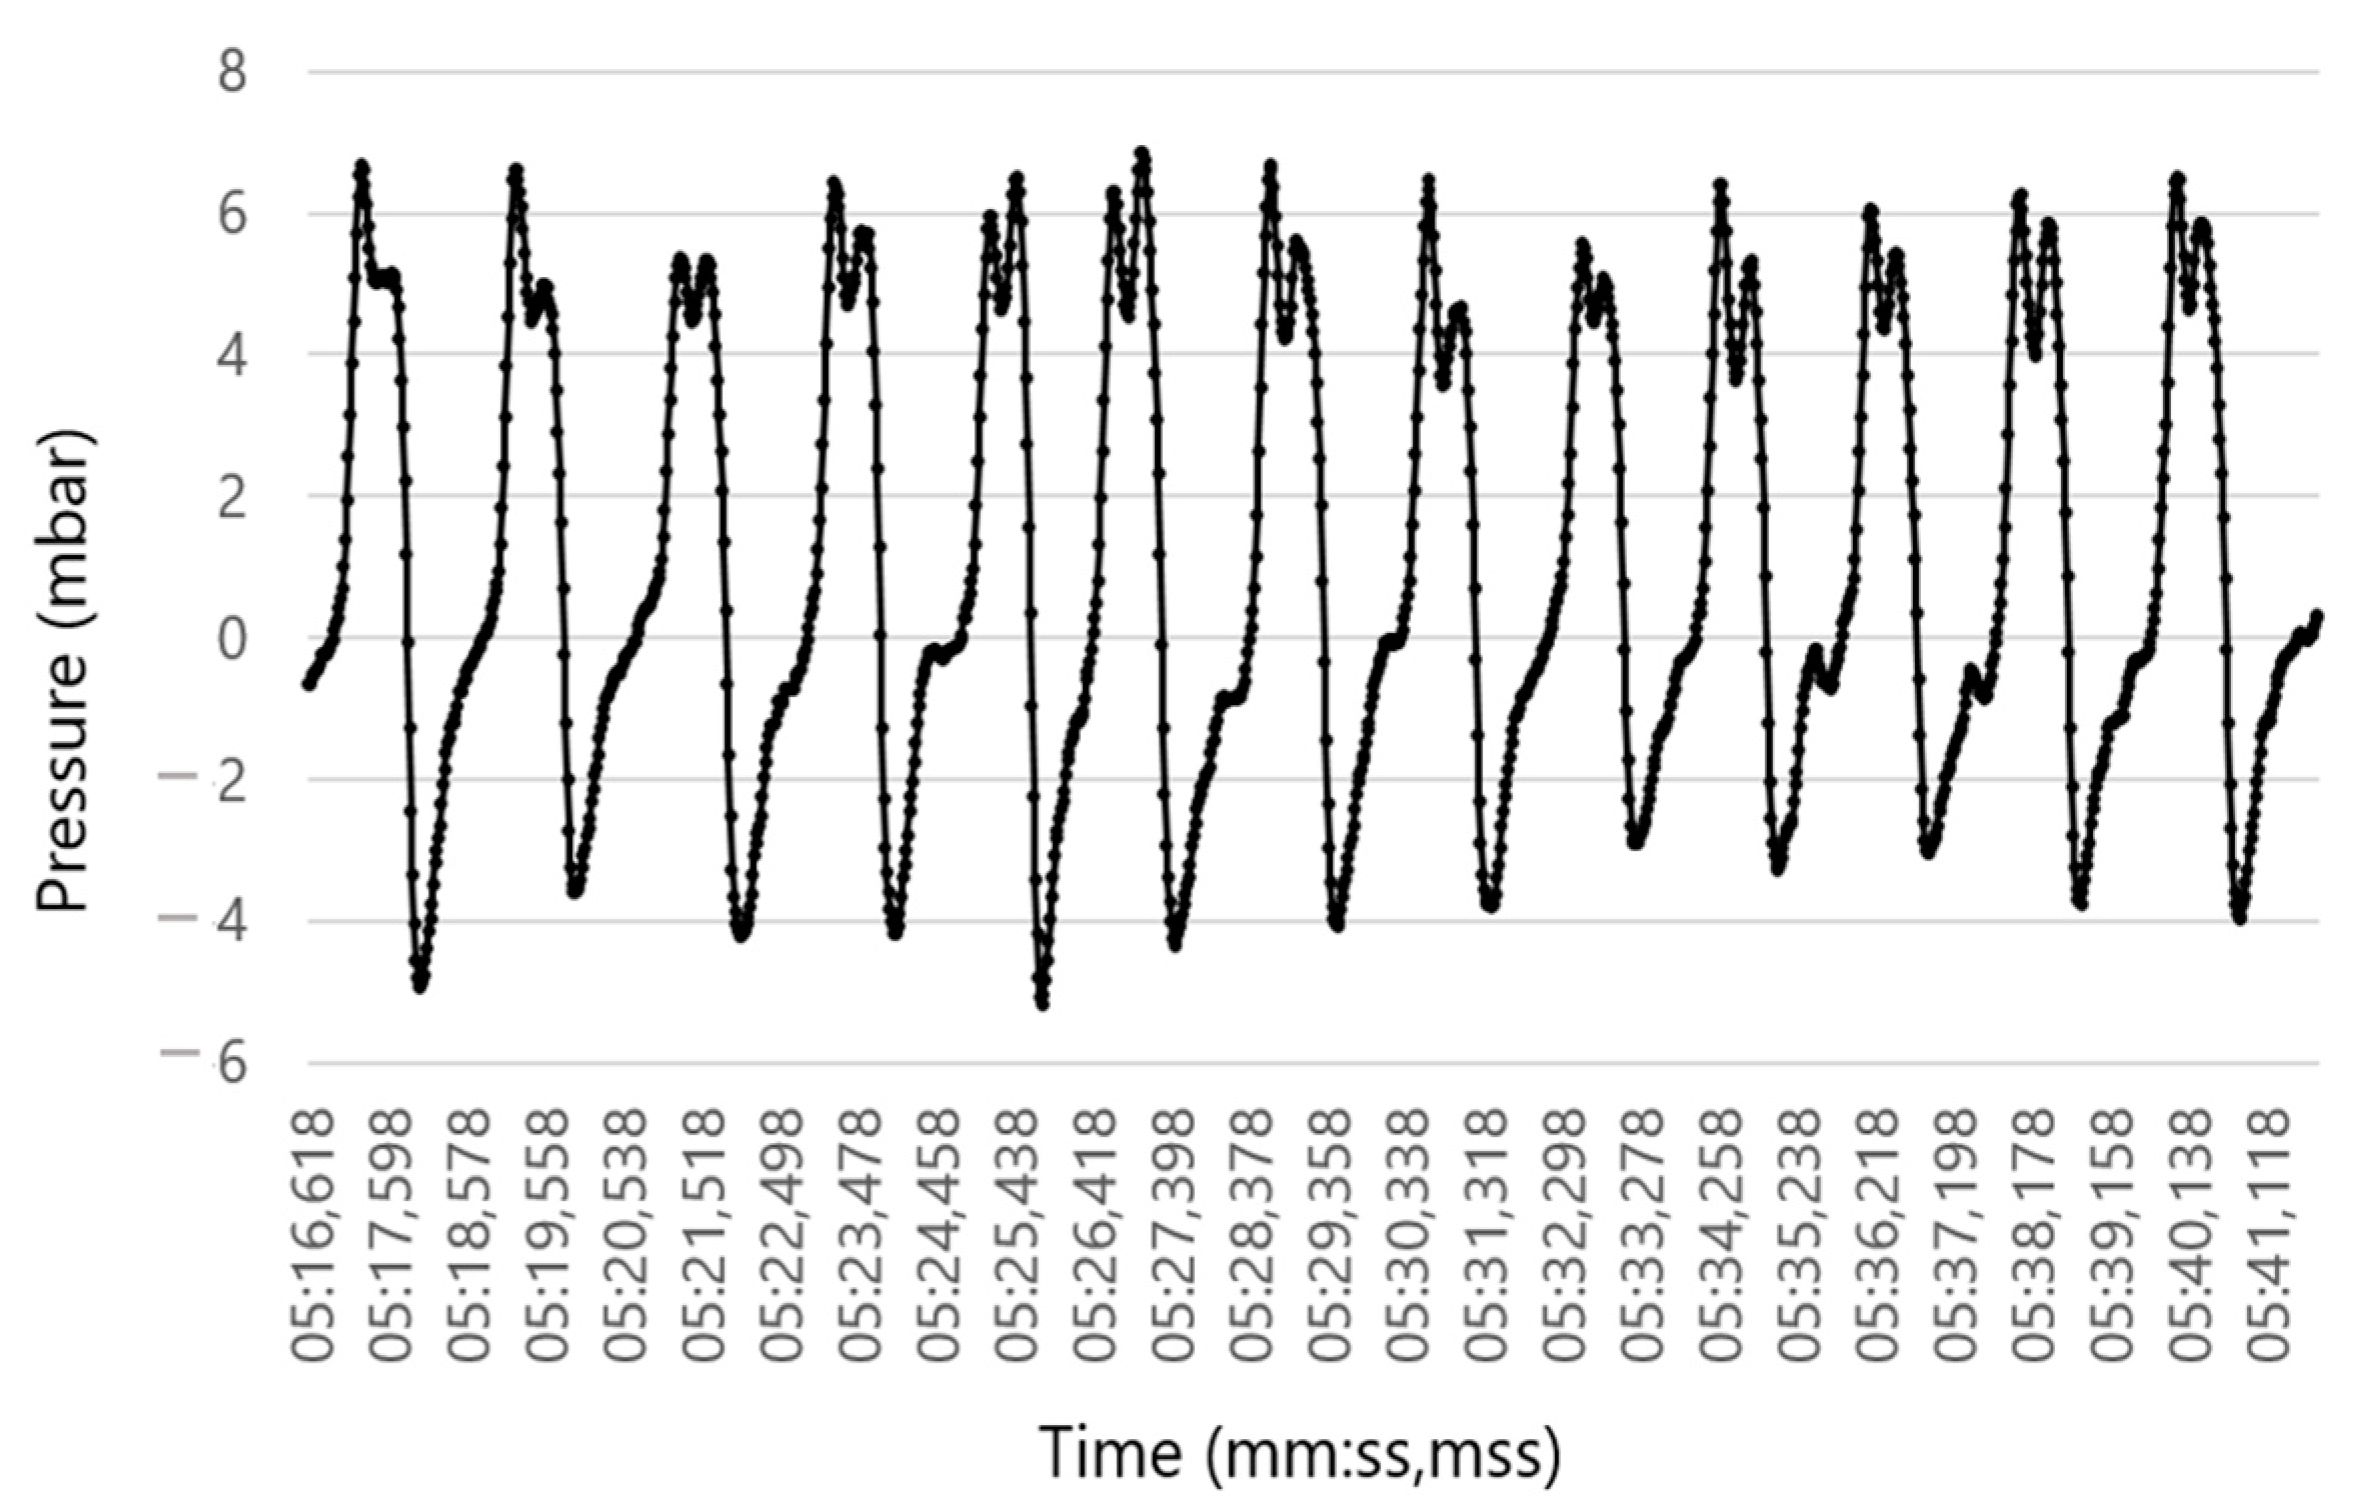
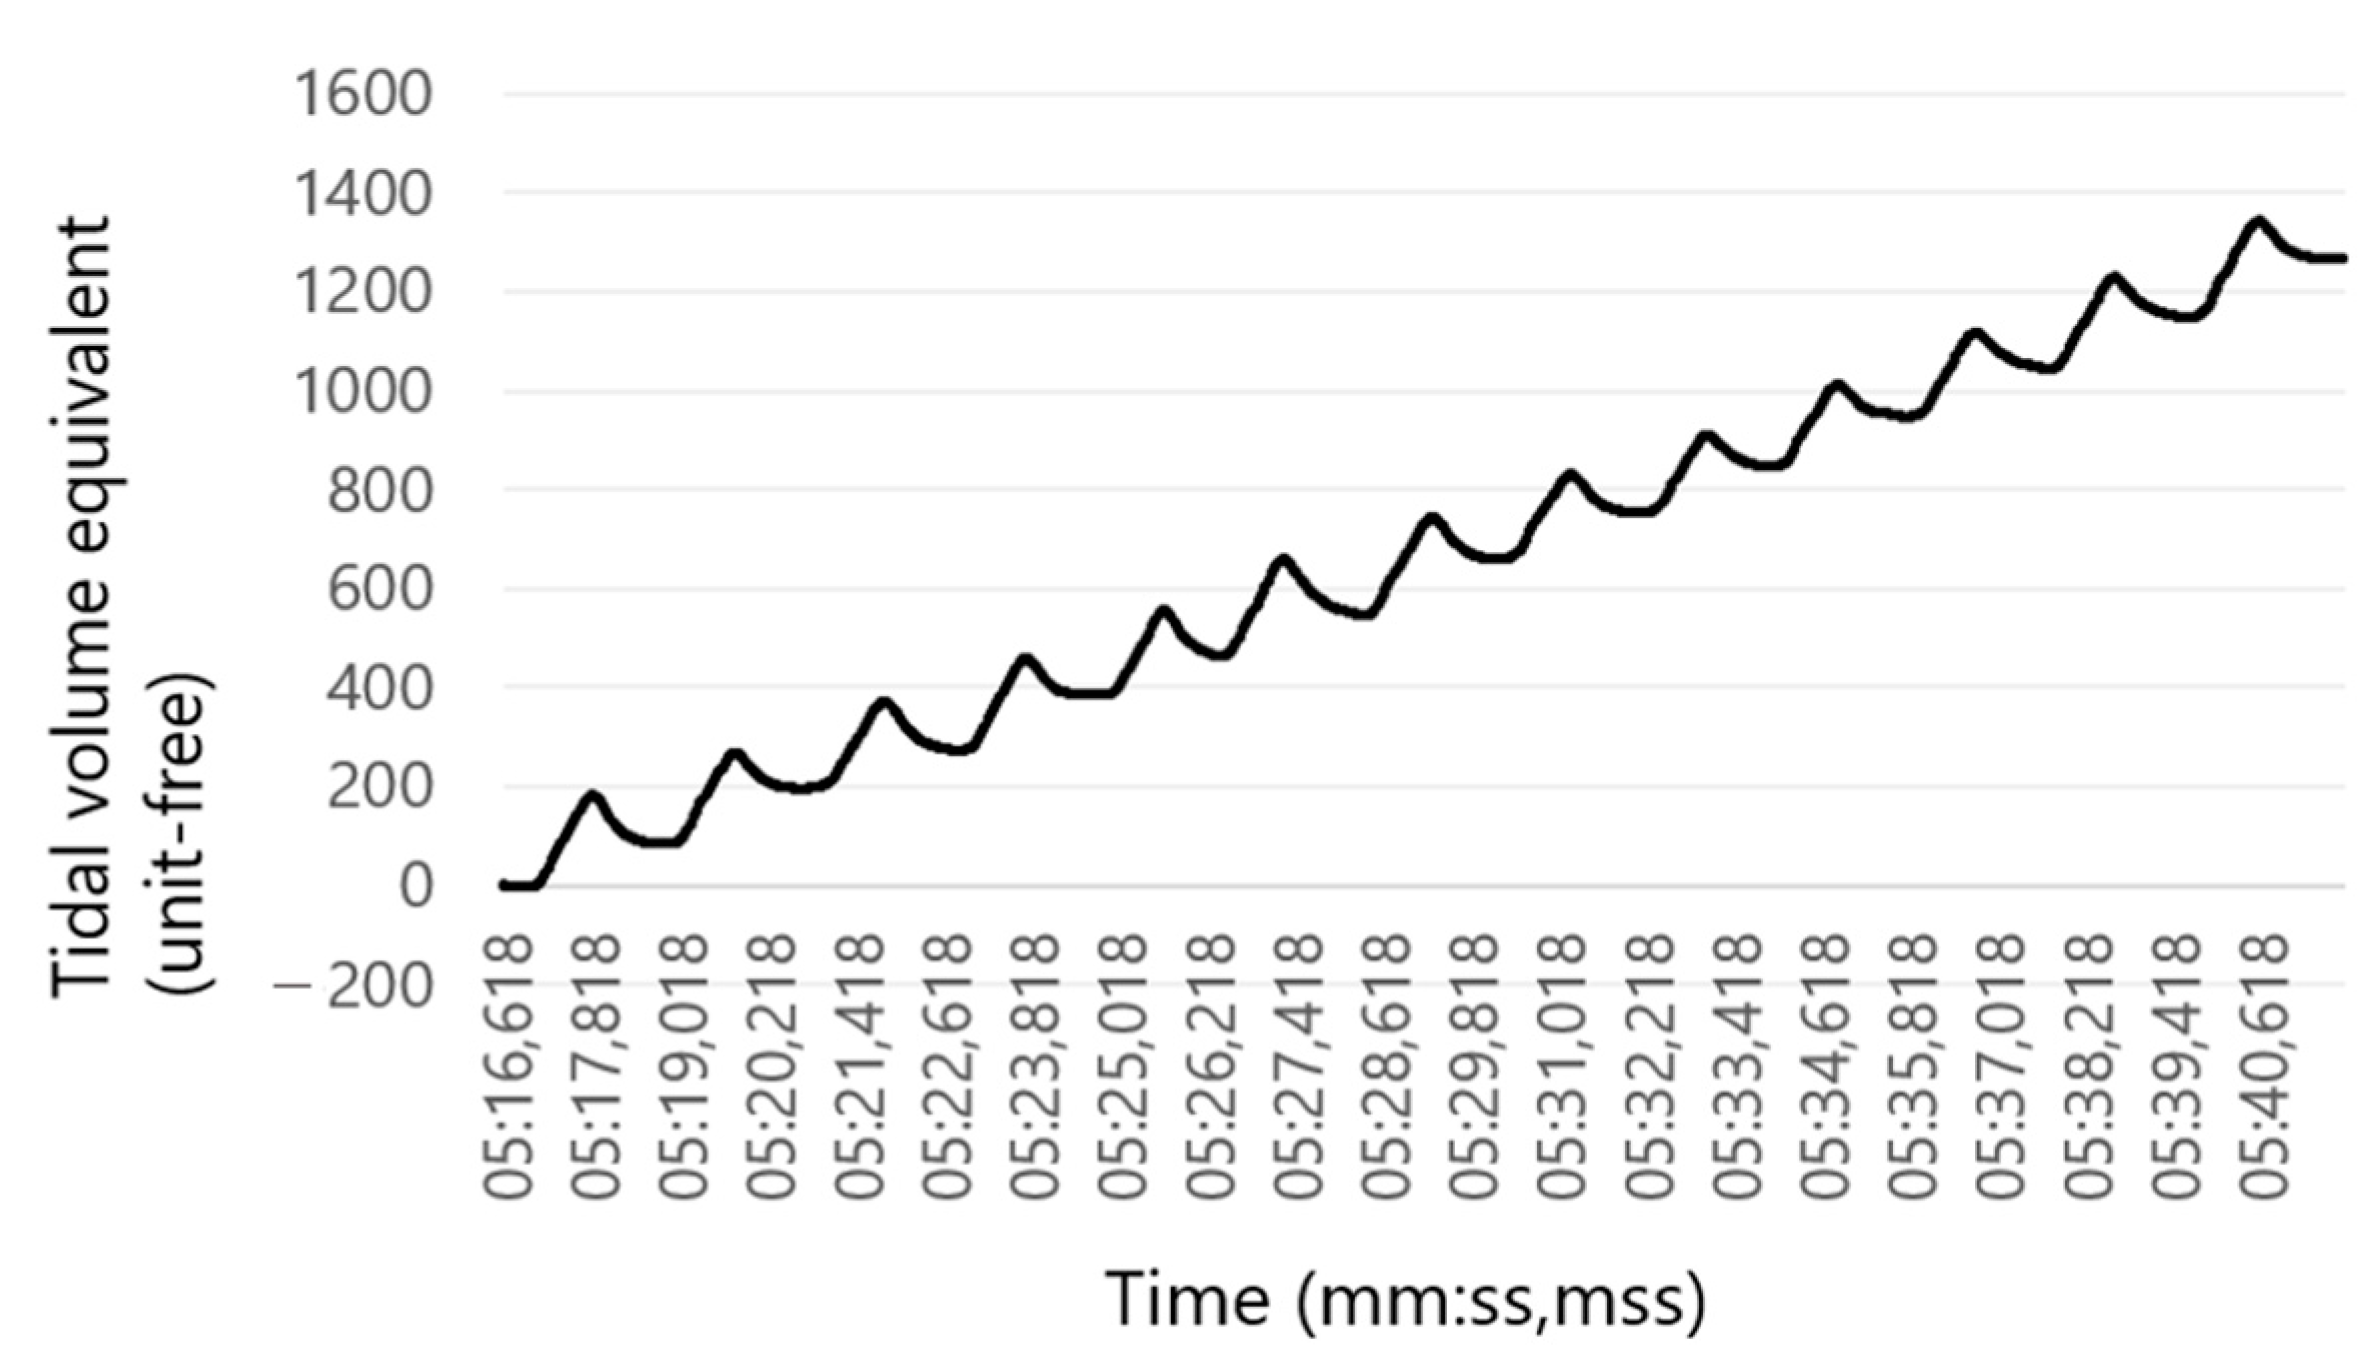
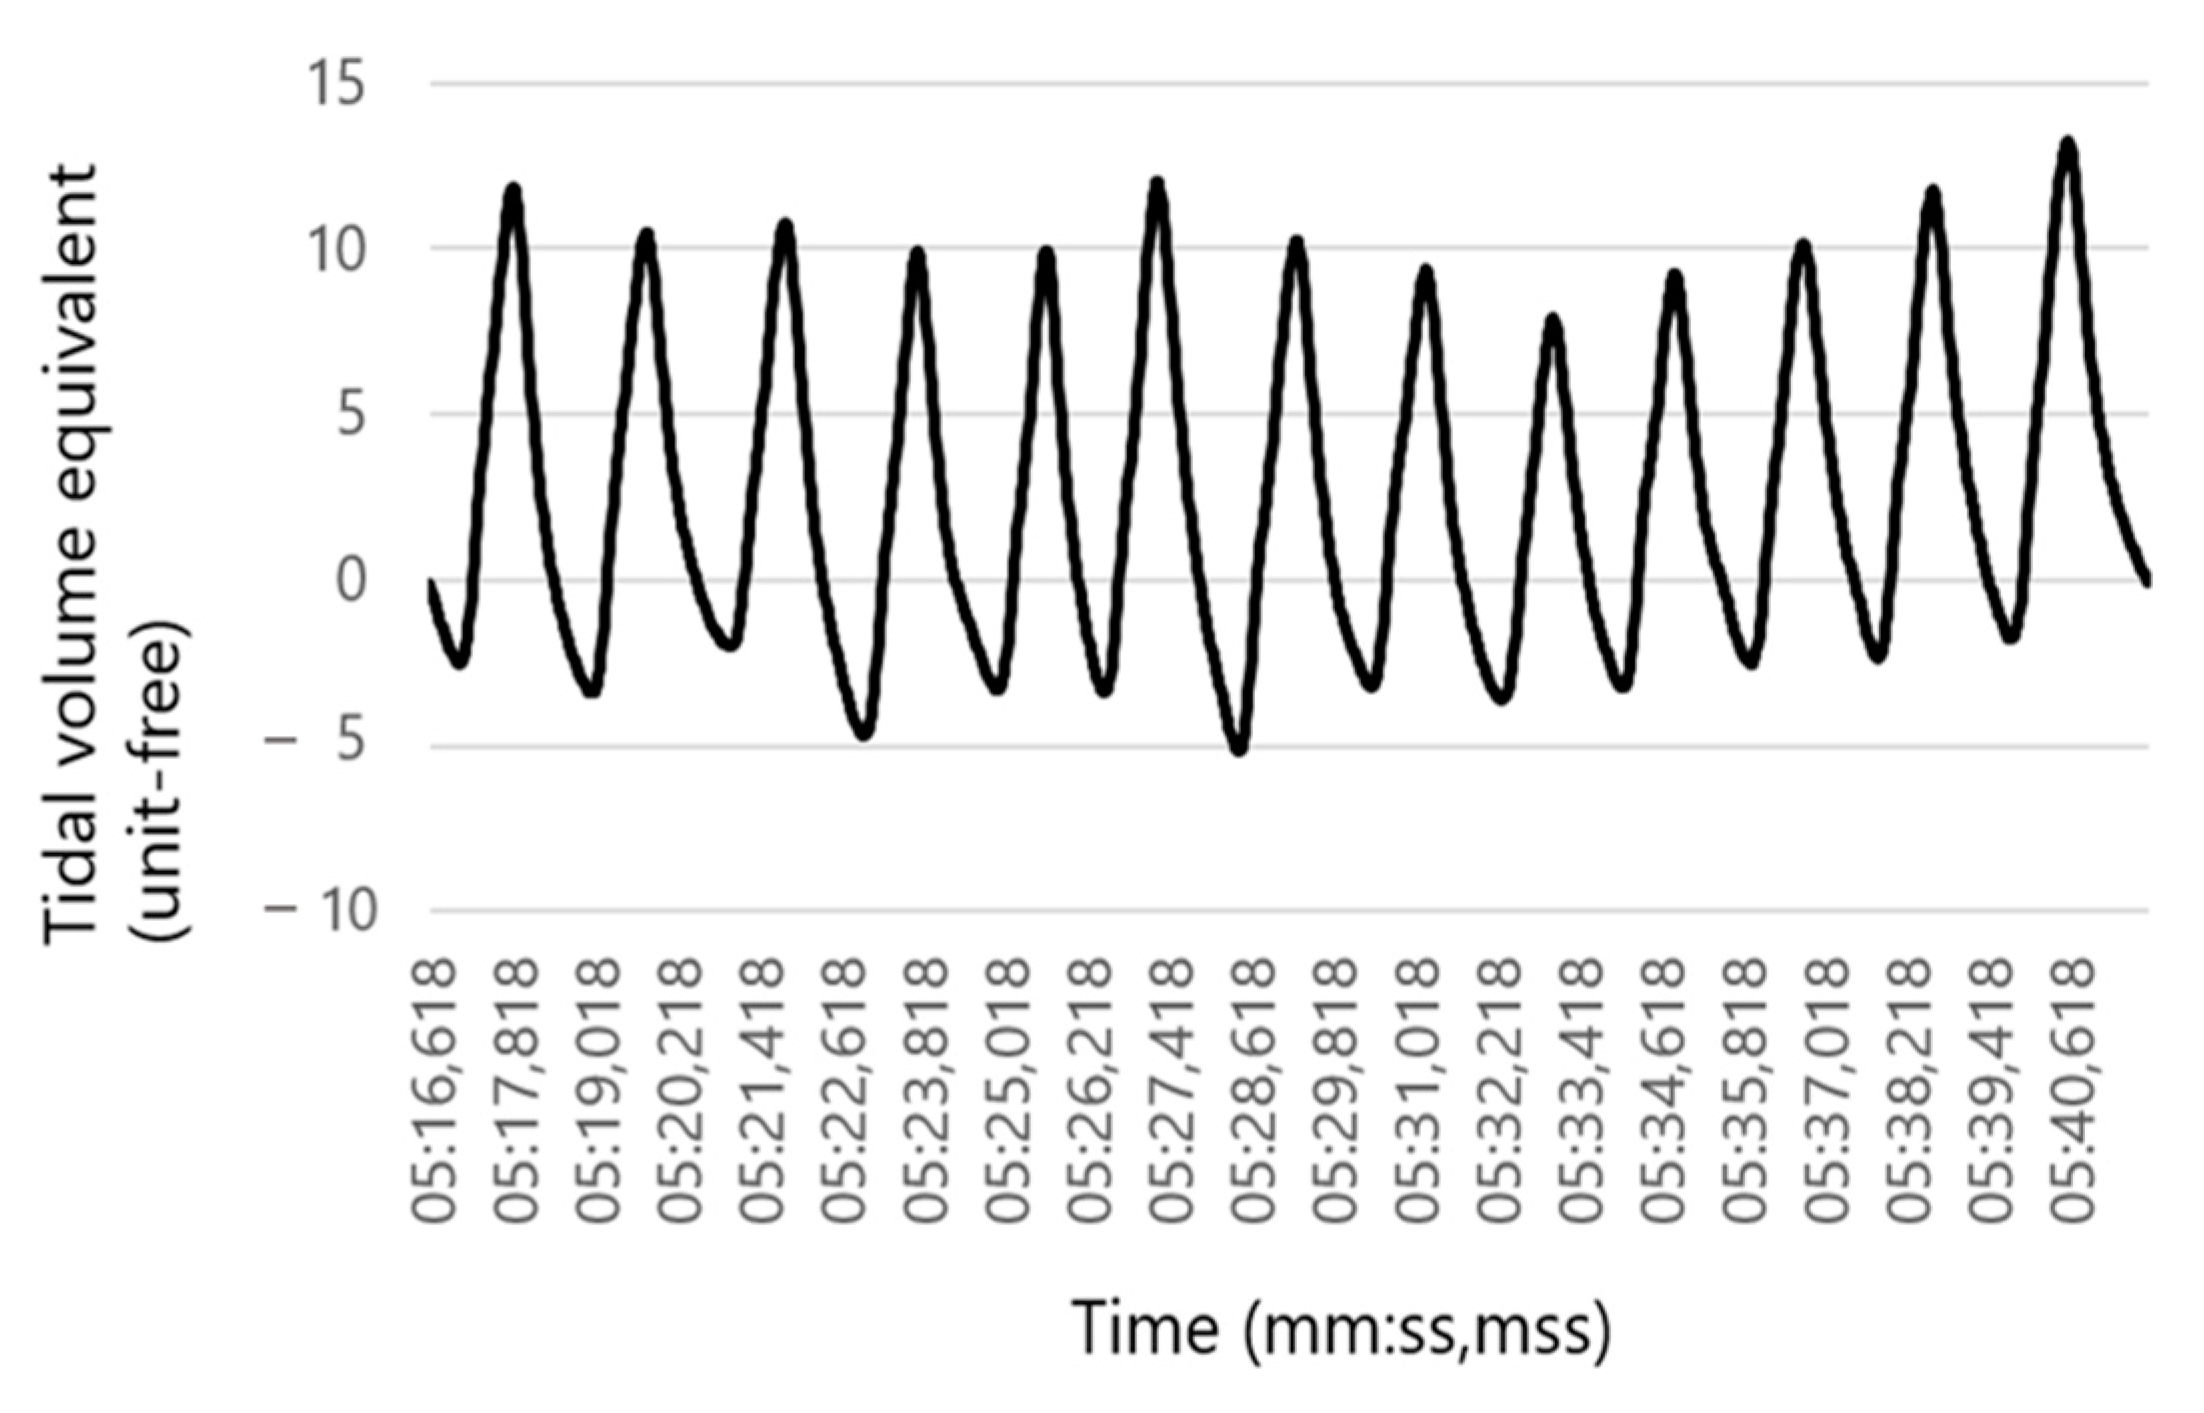
2.4. Data Evaluation (RR Sensor)
3. Statistical Analysis
3.1. Sensor Calibration
3.2. Z-Score Transformation
3.3. Normality Testing
3.4. Non-Parametric Test
3.5. Correlations
4. Results
5. Discussion
Limitations and Future Research
6. Conclusions
Author Contributions
Funding
Institutional Review Board Statement
Informed Consent Statement
Data Availability Statement
Acknowledgments
Conflicts of Interest
References
- Veit, H.; Farrel, R. The anatomy and physiology of the bovine respiratory system relating to pulmonary disease. Cornell Vet. 1978, 68, 555–581. [Google Scholar] [PubMed]
- Gustin, P.; Bakima, M.; Art, T.; Lekeux, P.; Lomba, F. Pulmonary function values and growth in belgian white and blue double-muscled cattle. Res. Vet. Sci. 1988, 45, 405–410. [Google Scholar] [CrossRef]
- Weekley, L.B.; Veit, H.P. Potential morphologic and physiological factors that may predispose the bovine lung to respiratory-disease. Compend. Contin. Educ. Pract. Vet. 1995, 17, 974–982. [Google Scholar]
- Gros, G. Respiration. In Physiology of Domestic Animals; Engelhardt, W.v., Breves, G., Eds.; Enke: Stuttgart, Germany, 2000. [Google Scholar]
- Reece, W.O.; Rowe, E.W. The respiratory system. In Functional Anatomy and Physiology of Domestic Animals, 5th ed.; John Wiley & Sons: Hoboken, NJ, USA, 2018. [Google Scholar]
- Koch, C.; Reinhold, P. Gesunde lungen für gesunde kälber und leistungsfähige milchkühe. Die Milchprax. 2015, 49, 20–25. [Google Scholar]
- Puig, A.; Ruiz, M.; Bassols, M.; Fraile, L.; Armengol, R. Technological tools for the early detection of bovine respiratory disease in farms. Animals 2022, 12, 2623. [Google Scholar] [CrossRef]
- Cramer, C.; Ollivett, T.L. Behavior assessment and applications for brd diagnosis: Preweaned dairy calves. Anim. Health Res. Rev. 2020, 21, 188–191. [Google Scholar] [CrossRef]
- Wisnieski, L.; Amrine, D.E.; Renter, D.G. Predictive modeling of bovine respiratory disease outcomes in feedlot cattle: A narrative review. Livest. Sci. 2021, 251, 104666. [Google Scholar] [CrossRef]
- Bleul, U.; Wey, C.; Meira, C.; Waldmann, A.; Mosing, M. Assessment of postnatal pulmonary adaption in bovine neonates using electric impedance tomography (eit). Animals 2021, 11, 3216. [Google Scholar] [CrossRef]
- Ider, M.; Maden, M. Biomarkers of infectious pneumonia in naturally infected calves. Am. J. Vet. Res. 2022, 83, ajvr.21.10.0172. [Google Scholar] [CrossRef]
- Martin, M.; Kleinhenz, M.D.; Montgomery, S.R.; Blasi, D.A.; Almes, K.M.; Baysinger, A.K.; Coetzee, J.F. Assessment of diagnostic accuracy of biomarkers to assess lung consolidation in calves with induced bacterial pneumonia using receiver operating characteristic curves. J. Anim. Sci. 2022, 100, skab368. [Google Scholar] [CrossRef]
- Masset, N.; Assié, S.; Herman, N.; Jozan, T.; Herry, V. Ultrasonography of the cranial part of the thorax is a quick and sensitive technique to detect lung consolidation in veal calves. Vet. Med. Sci. 2022, 8, 1229–1239. [Google Scholar] [CrossRef] [PubMed]
- Fiore, E.; Lisuzzo, A.; Beltrame, A.; Contiero, B.; Gianesella, M.; Schiavon, E.; Tessari, R.; Morgante, M.; Mazzotta, E. Lung ultrasonography and clinical follow-up evaluations in fattening bulls affected by bovine respiratory disease (brd) during the restocking period and after tulathromycin and ketoprofen treatment. Animals 2022, 12, 994. [Google Scholar] [CrossRef] [PubMed]
- Porter, M.M.; McDonald, P.O.; Slate, J.R.; Kreuder, A.J.; McGill, J.L. Use of thoracic ultrasonography to improve disease detection in experimental brd infection. Front. Vet. Sci. 2021, 8, 763972. [Google Scholar] [CrossRef]
- Carslake, C.; Vázquez-Diosdado, J.A.; Kaler, J. Machine learning algorithms to classify and quantify multiple behaviours in dairy calves using a sensor: Moving beyond classification in precision livestock. Sensors 2021, 21, 88. [Google Scholar] [CrossRef]
- Sun, D.; Webb, L.; van der Tol, P.P.J.; van Reenen, K. A systematic review of automatic health monitoring in calves: Glimpsing the future from current practice. Front. Vet. Sci. 2021, 8, 761468. [Google Scholar] [CrossRef] [PubMed]
- Collie, D.D.S. Pulmonary-function changes and clinical findings associated with chronic respiratory-disease in calves. Br. Vet. J. 1992, 148, 33–40. [Google Scholar] [CrossRef]
- Chernitskiy, A.; Shabunin, S.; Kuchmenko, T.; Safonov, V. On-farm diagnosis of latent respiratory failure in calves. Turk. J. Vet. Anim. Sci. 2019, 43, 707–715. [Google Scholar] [CrossRef]
- Lawnick, U.; Reinhold, P.; Doll, K. The therapeutic effect of inhalation of hypertonic saline solution in calves with bronchopneumonia. Tierarztl. Prax. Ausg. Grosstiere/Nutztiere 2005, 33, 373–382. [Google Scholar] [CrossRef]
- Ostermann, C.; Linde, S.; Siegling-Vlitakis, C.; Reinhold, P. Evaluation of pulmonary dysfunctions and acid–base imbalances induced by chlamydia psittaci in a bovine model of respiratory infection. Multidiscip. Resp. Med. 2014, 9, 10. [Google Scholar] [CrossRef]
- Lohr, M.; Prohl, A.; Ostermann, C.; Diller, R.; Greub, G.; Reinhold, P. Effect of parachlamydia acanthamoebae on pulmonary function parameters in a bovine respiratory model. Vet. J. 2016, 213, 9–15. [Google Scholar] [CrossRef]
- Strutzke, S.; Fiske, D.; Hoffmann, G.; Ammon, C.; Heuwieser, W.; Amon, T. Technical note: Development of a noninvasive respiration rate sensor for cattle. J. Dairy Sci. 2019, 102, 690–695. [Google Scholar] [CrossRef] [PubMed]
- Lowe, G.; Sutherland, M.; Waas, J.; Schaefer, A.; Cox, N.; Stewart, M. Infrared thermography-a non-invasive method of measuring respiration rate in calves. Animals 2019, 9, 535. [Google Scholar] [CrossRef] [PubMed]
- Kim, S.; Hidaka, Y. Breathing pattern analysis in cattle using infrared thermography and computer vision. Animals 2021, 11, 207. [Google Scholar] [CrossRef] [PubMed]
- Reinhold, P.; Smith, H.J.; Close, R.; Genicot, B.; Lekeux, P. Validation of impulse oscillometry in friesian and blue belgian calves with respect to changes in extrathoracic upper airway resistance. Res. Vet. Sci. 1998, 65, 93–101. [Google Scholar] [CrossRef]
- Smith, H.; Reinhold, P.; Goldman, M. Forced oscillation technique and impulse oscillometry. Eur. Respir. Monogr. 2005, 31, 72–105. [Google Scholar]
- Correlation Coefficient Using Z-Transformation. Sample Size Estimation—Correlation. Available online: https://cuhk.edu.hk (accessed on 30 March 2022).
- Sedgwick, P. Spearman’s rank correlation coefficient. BMJ 2014, 349, g7327. [Google Scholar] [CrossRef]
- Lachin, J.M. Introduction to sample size determination and power analysis for clinical trials. Control. Clin. Trials 1981, 2, 93–113. [Google Scholar] [CrossRef]
- Fraebel, Y. The Exponential Smoothing 1st Order; University of Applied Sciences: Munich, Germany, 2019; p. 10. [Google Scholar]
- Rossier, P.H.; Bühlmann, A.; Wiesinger, K. Appendix: Formulas, correction factors, reagents, tables. In Physiolgy and Pathophysiology of Respiration; Springer: Berlin/Heidelberg, Germany, 1958. [Google Scholar]
- Meyberg, K.; Vachenauer, P. Differential- and integral calculus, vector- and matrix calculus. In Higher Mathematics 1, 5th ed.; Springer: Berlin/Heidelberg, Germany, 1999. [Google Scholar]
- Razali, N.M.; Yap, B.W. Power comparisons of shapiro-wilk, kolmogorov-smirnov, lilliefors and anderson-darling tests. J. Stat. Model. Anal. 2011, 2, 21–33. [Google Scholar]
- Jovanov, E.; Raskovic, D.; Hormigo, R. Thermistor-based breathing sensor for circadian rhythm evaluation. Biomed. Sci. Instrum. 2001, 37, 493–497. [Google Scholar]
- Patro, S.G.; Sahu, D.-K.K. Normalization: A preprocessing stage. Int. Adv. Res. J. Sci. Eng. Technol. 2015, 2, 20–22. [Google Scholar] [CrossRef]
- Divine, G.; Norton, H.J.; Hunt, R.; Dienemann, J. A Review of Analysis and Sample Size Calculation Considerations for Wilcoxon Tests. Anaesth. Analg. 2013, 117, 699–710. [Google Scholar] [CrossRef] [PubMed]
- Berger, V.; Zhou, Y. Kolmogorov–Smirnov test: Overview. In StatsRef: Statistics Refernce Online; John Wiley and Sons: Hoboken, NJ, USA, 2014. [Google Scholar]
- Armstrong, R.A. When to use the bonferroni correction. Ophthalmic Physiol. Opt. 2014, 34, 502–508. [Google Scholar] [CrossRef]
- Zhou, M.; Huynh, T.T.T.; Koerkamp, P.; Dixhoorn, I.; Amon, T.; Aarnink, A.J.A. Effects of increasing air temperature on skin and respiration heat loss from dairy cows at different relative humidity and air velocity levels. J. Dairy Sci. 2022, 105, 7061–7078. [Google Scholar] [CrossRef] [PubMed]
- Berman, A. Estimates of heat stress relief needs for Holstein dairy cows. J. Anim. Sci. 2005, 83, 1377–1384. [Google Scholar] [CrossRef] [PubMed]
- Sensor, F. Hdi Series Amplified Pressure Sensors. Available online: https://www.first-sensor.com/de/produkte/drucksensoren/drucksensoren-mit-verstaerktem-ausgangssignal/hdi/ (accessed on 18 January 2023).
- Gouna. Available online: https://www.gouna.tech/#features (accessed on 24 April 2023).


| Parameter | Unit | Min | 0.25 | Median | 0.75 | Max |
|---|---|---|---|---|---|---|
| RR (RR sensor) | breaths per min (bpm) | 19 | 30 | 36 | 47 | 82 |
| Vt equivalent (RR sensor) | unit-free | 6 | 15 | 19 | 30 | 60 |
| Vmin equivalent (RR sensor) | unit-free | 260 | 529 | 762 | 1079 | 1946 |
| RR (IOS) | bpm | 20 | 31 | 34 | 40 | 71 |
| Vt (IOS) | mL | 425 | 600 | 700 | 773 | 1000 |
| Vmin (IOS) | L | 18 | 21 | 24 | 27 | 45 |
| Vt/kg (IOS) | mL/kg | 6.64 | 7 | 11.11 | 12.38 | 14.29 |
| Parameter | p-Value | Difference |
|---|---|---|
| Raw RR (RR sensor) and RR (IOS) | 0.7291 | No |
| Raw Vt (RR sensor) and Vt (IOS) | 0.9914 | No |
| Raw Vmin (RR sensor) and Vmin (IOS) | 0.9655 | No |
| Calibrated RR_(RR sensor) and RR (IOS) | 0.8596 | No |
| Calibrated Vt and Vt (IOS) | 0.8288 | No |
| Calibrated Vmin and Vmin (IOS) | 0.768 | No |
| Parameter | Number of Cases | Spearman Correlation | p Value |
|---|---|---|---|
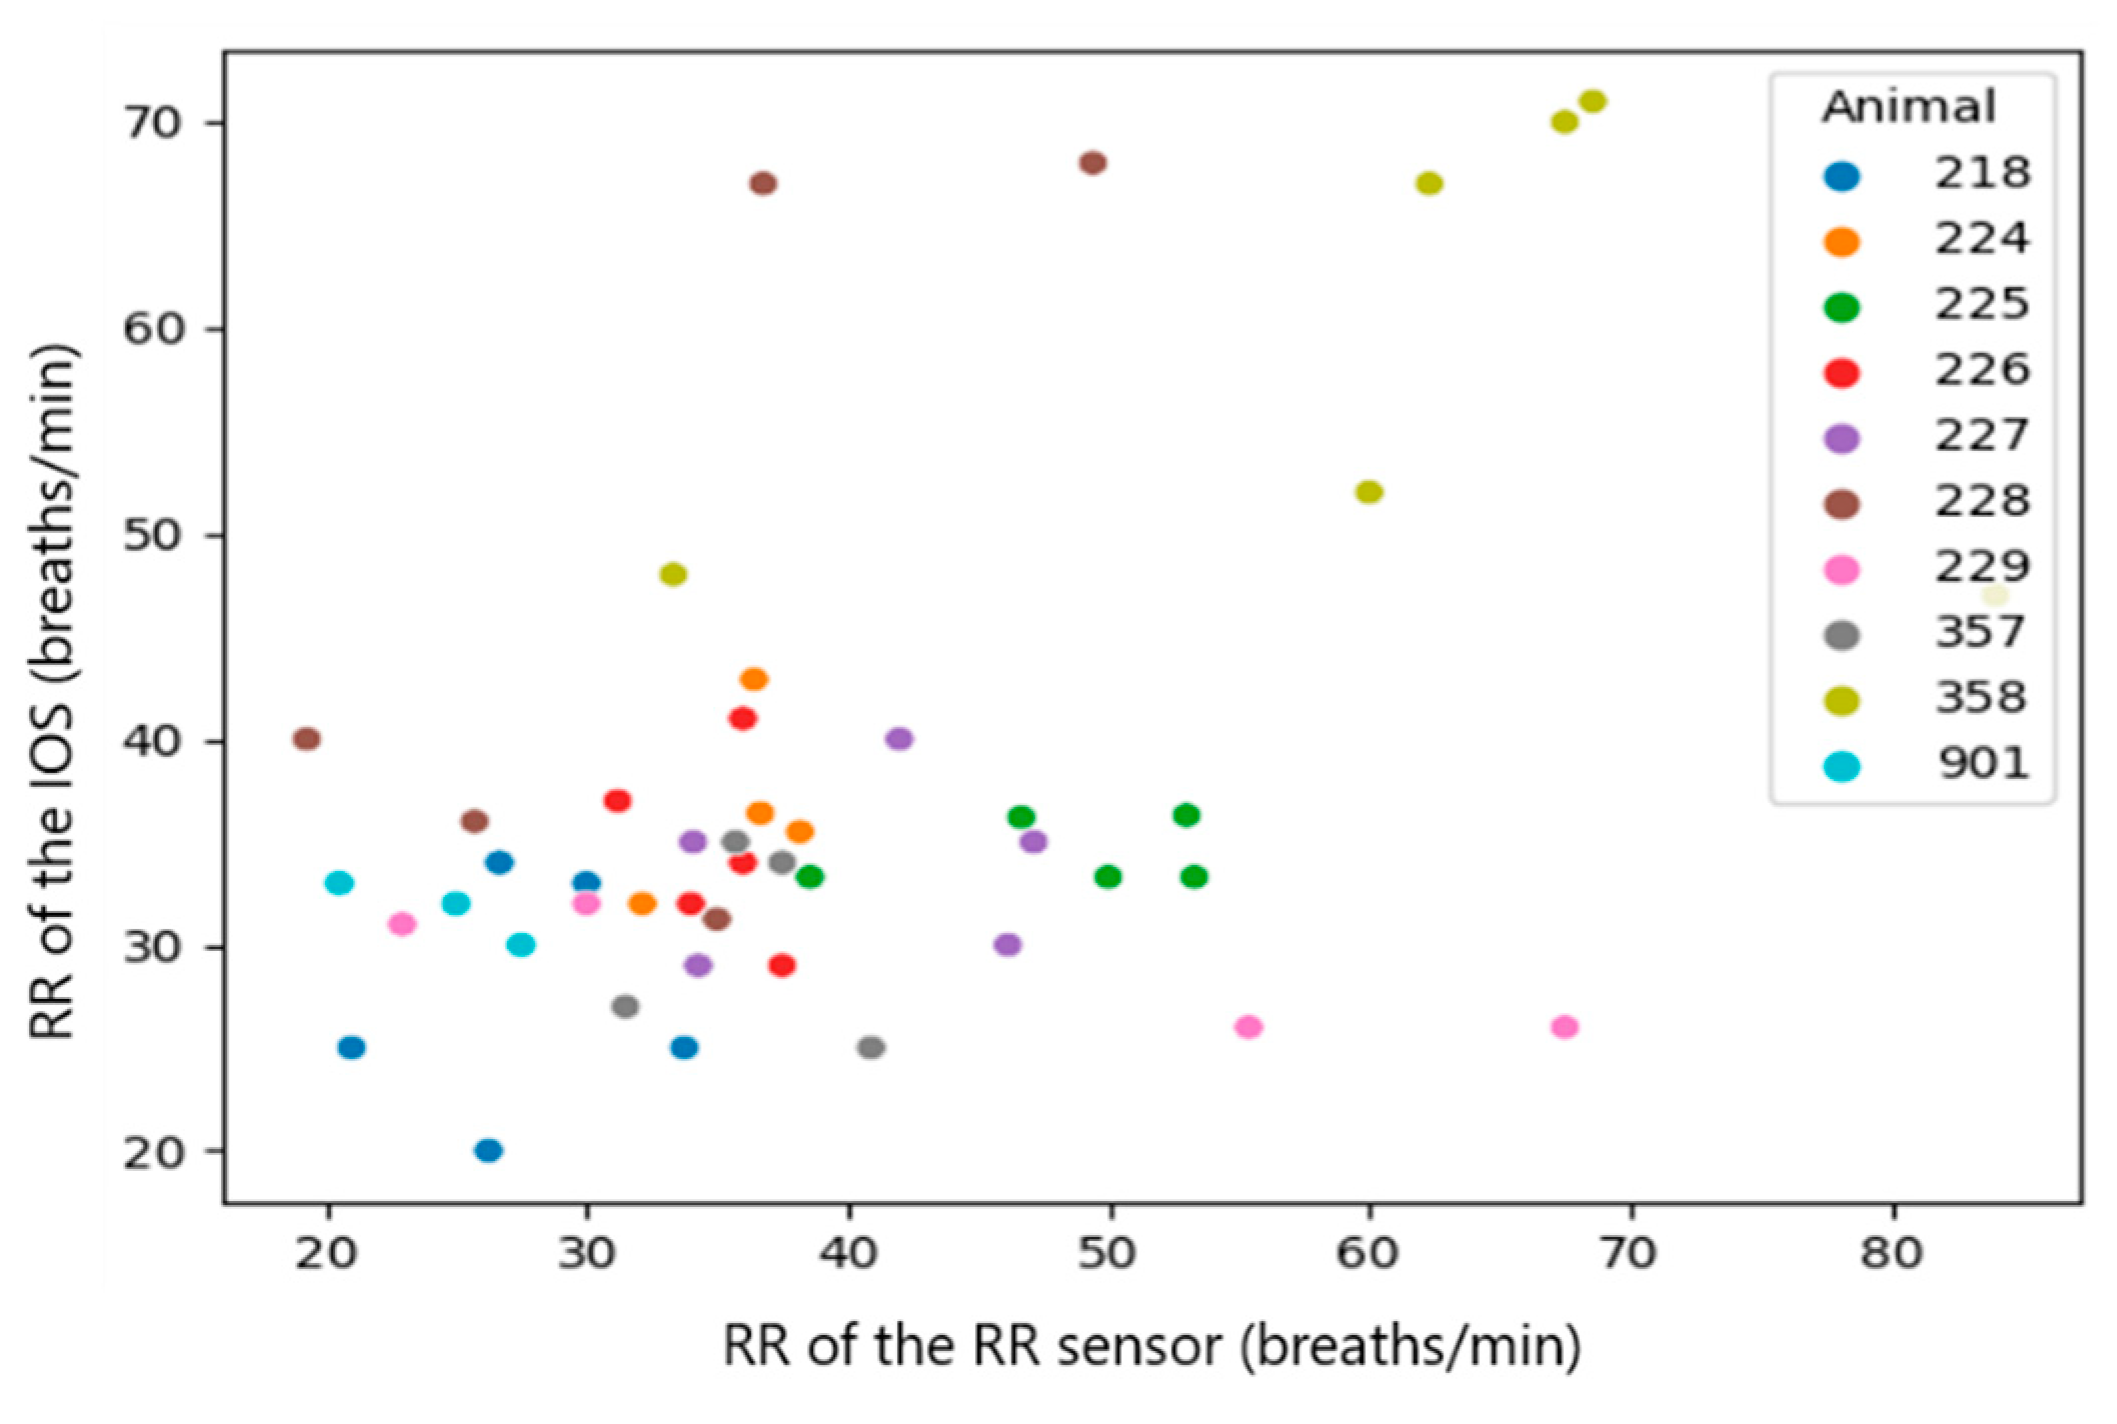
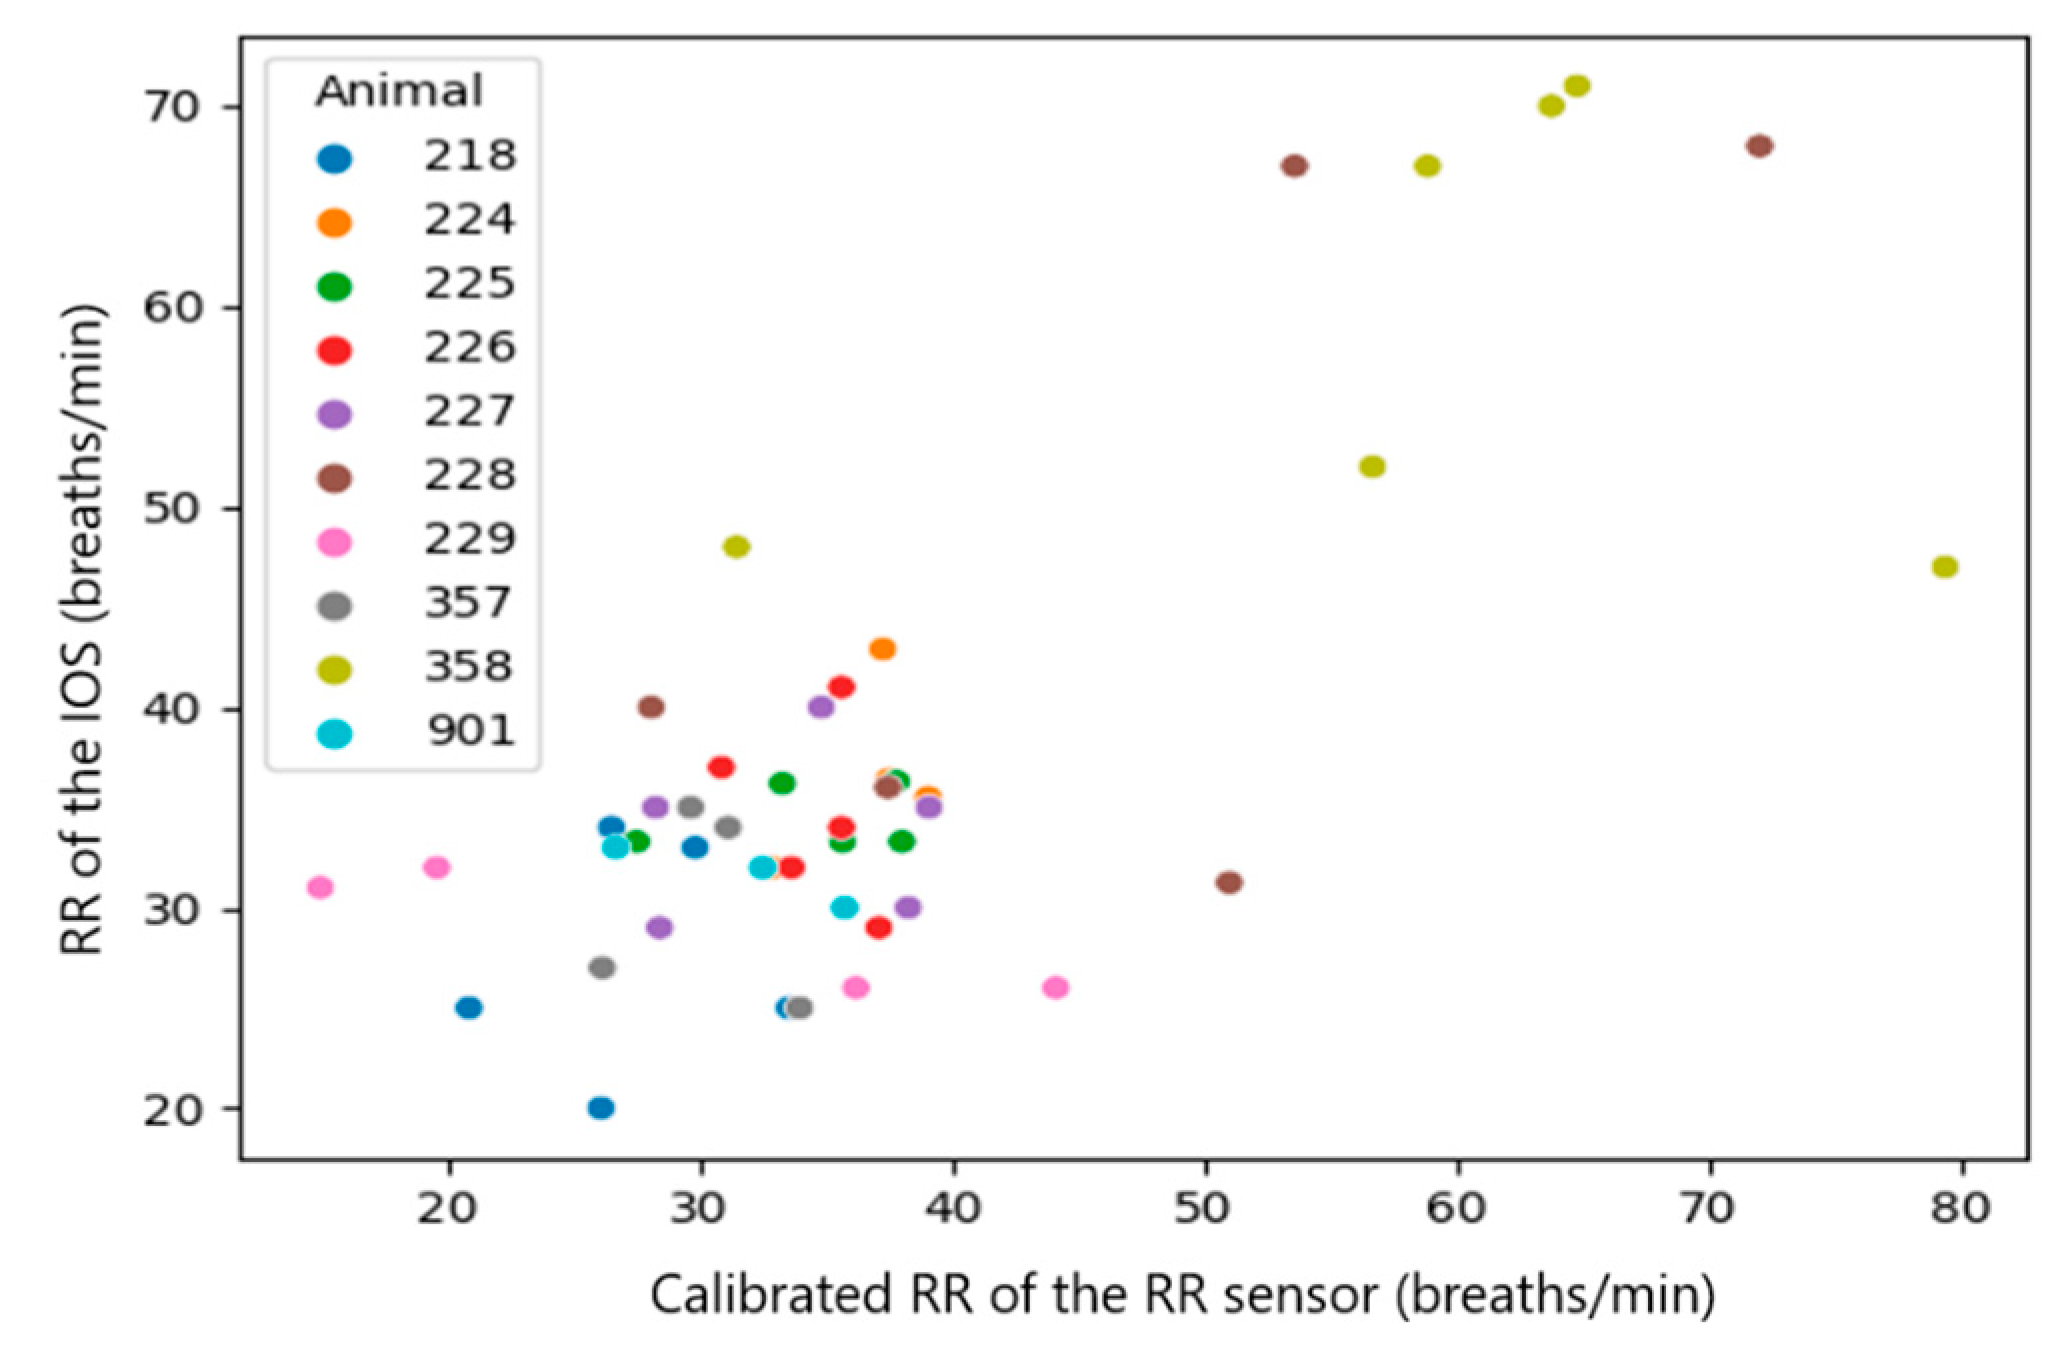
| RR_calibrated (RR sensor) and RR (IOS) | all observations (n = 46) | 0.4813 | 0.0007 |
| Median per calf (n = 10) | 0.9515 | 0.000022799 | |
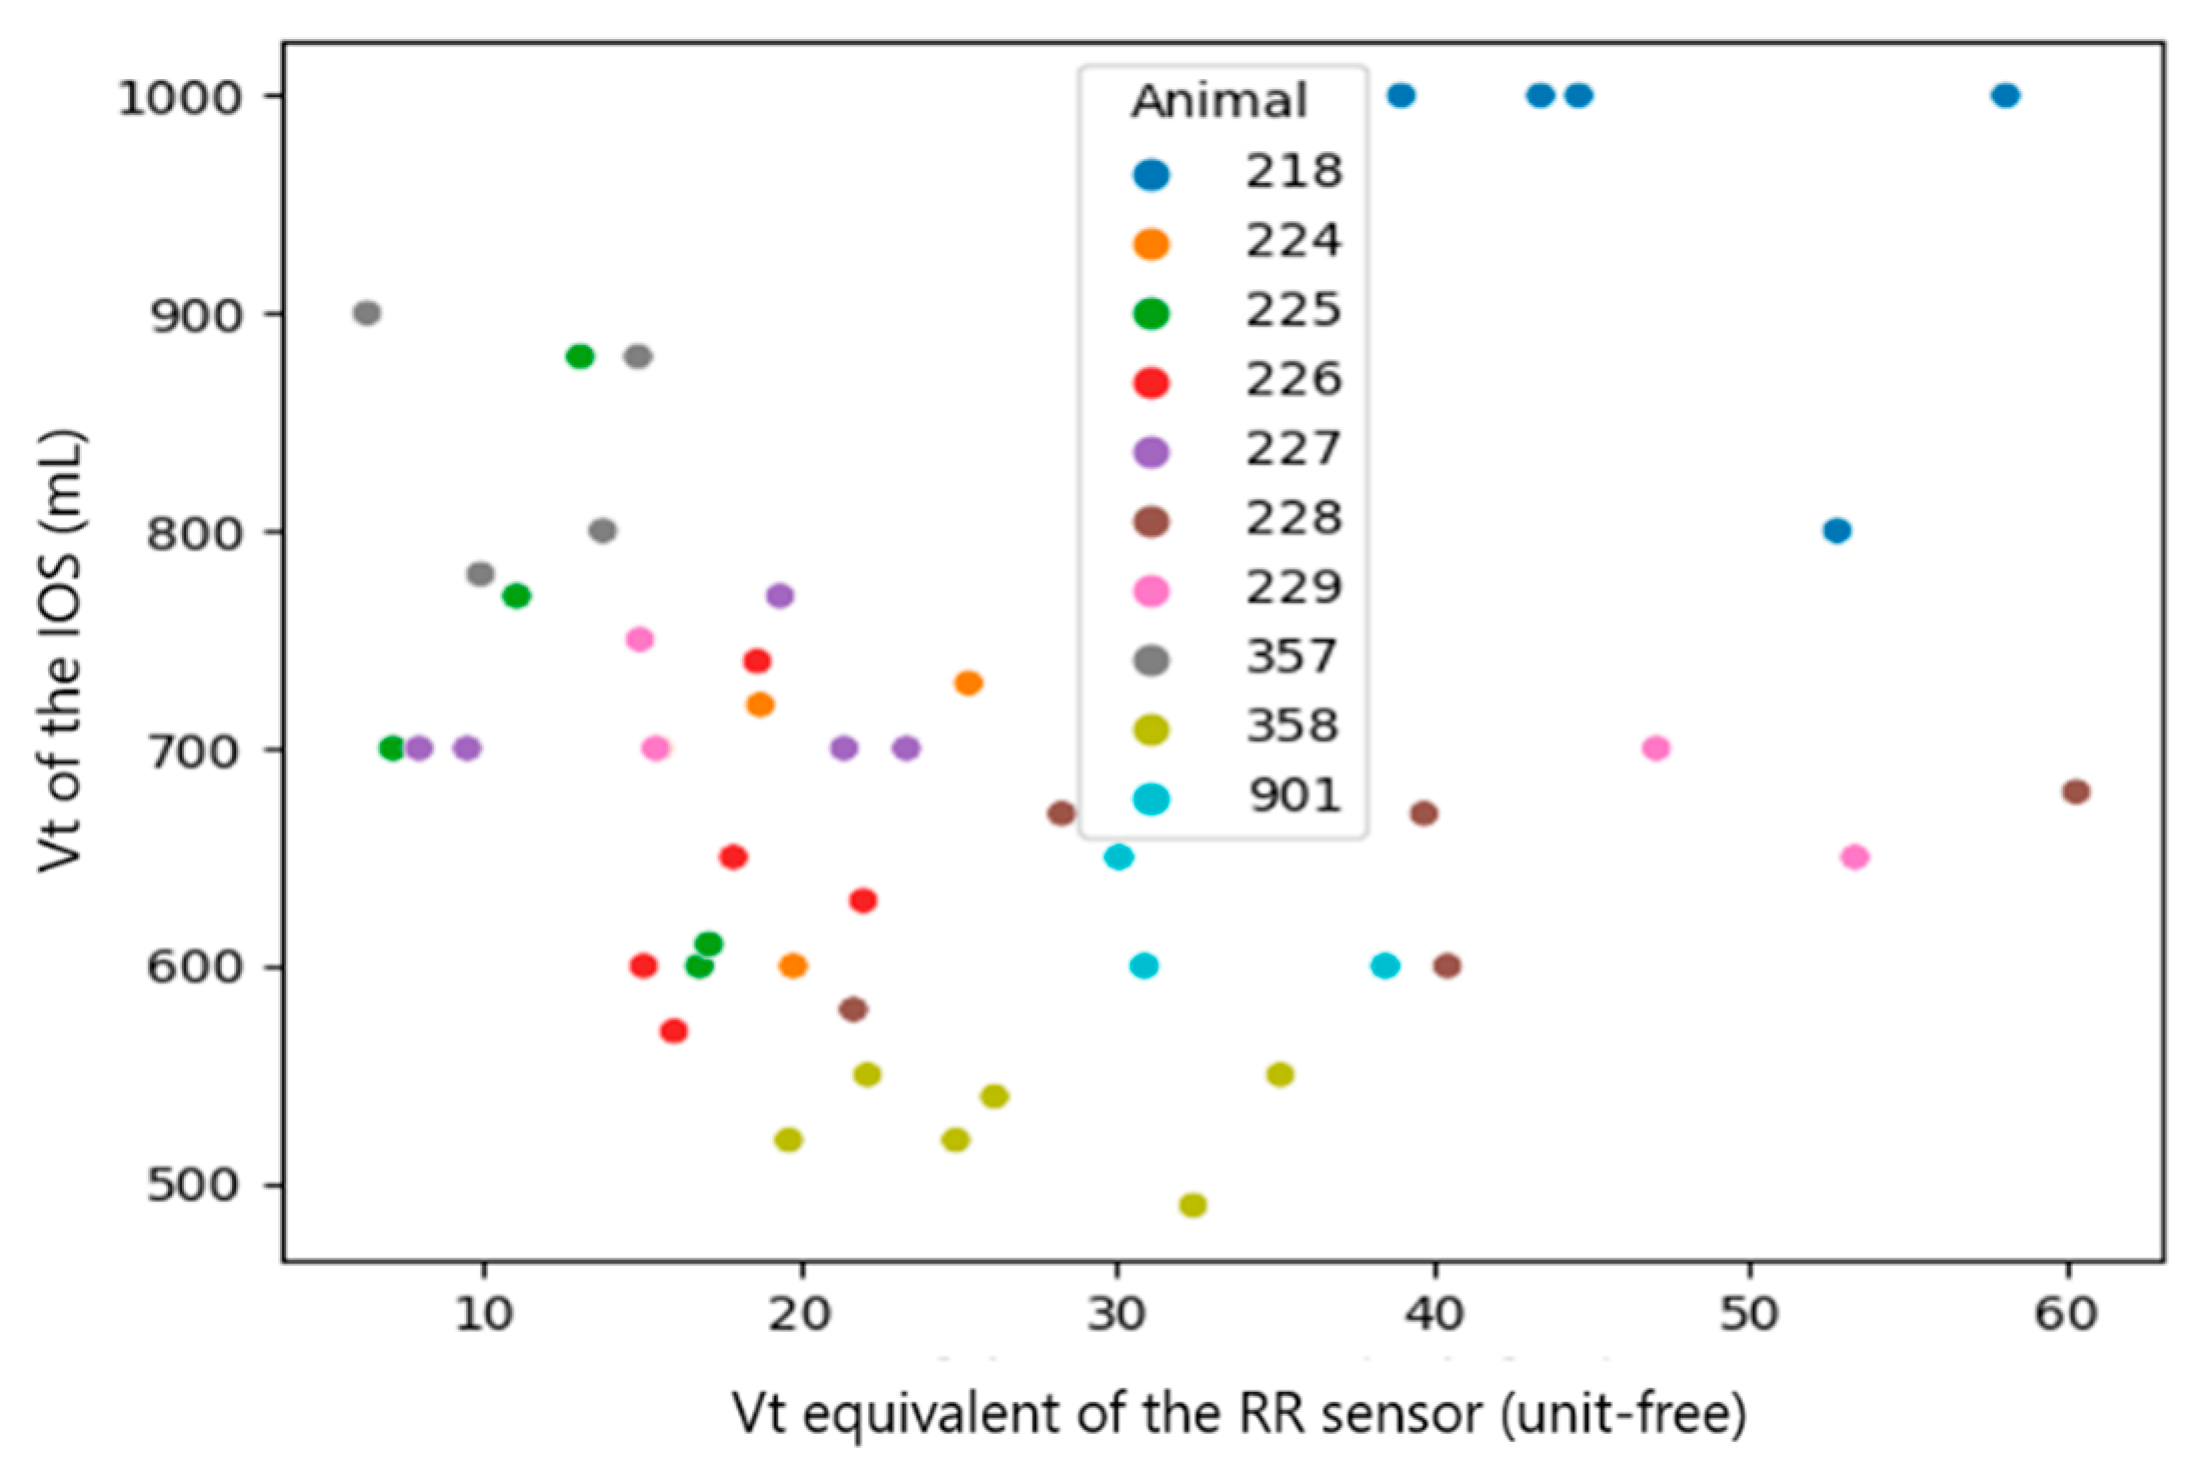
| Vt_calibrated (RR sensor) and Vt (IOS) | all observations (n = 46) | 0.3709 | 0.0112 |
| Median per calf (n = 10) | 0.9142 | 0.0002 | |
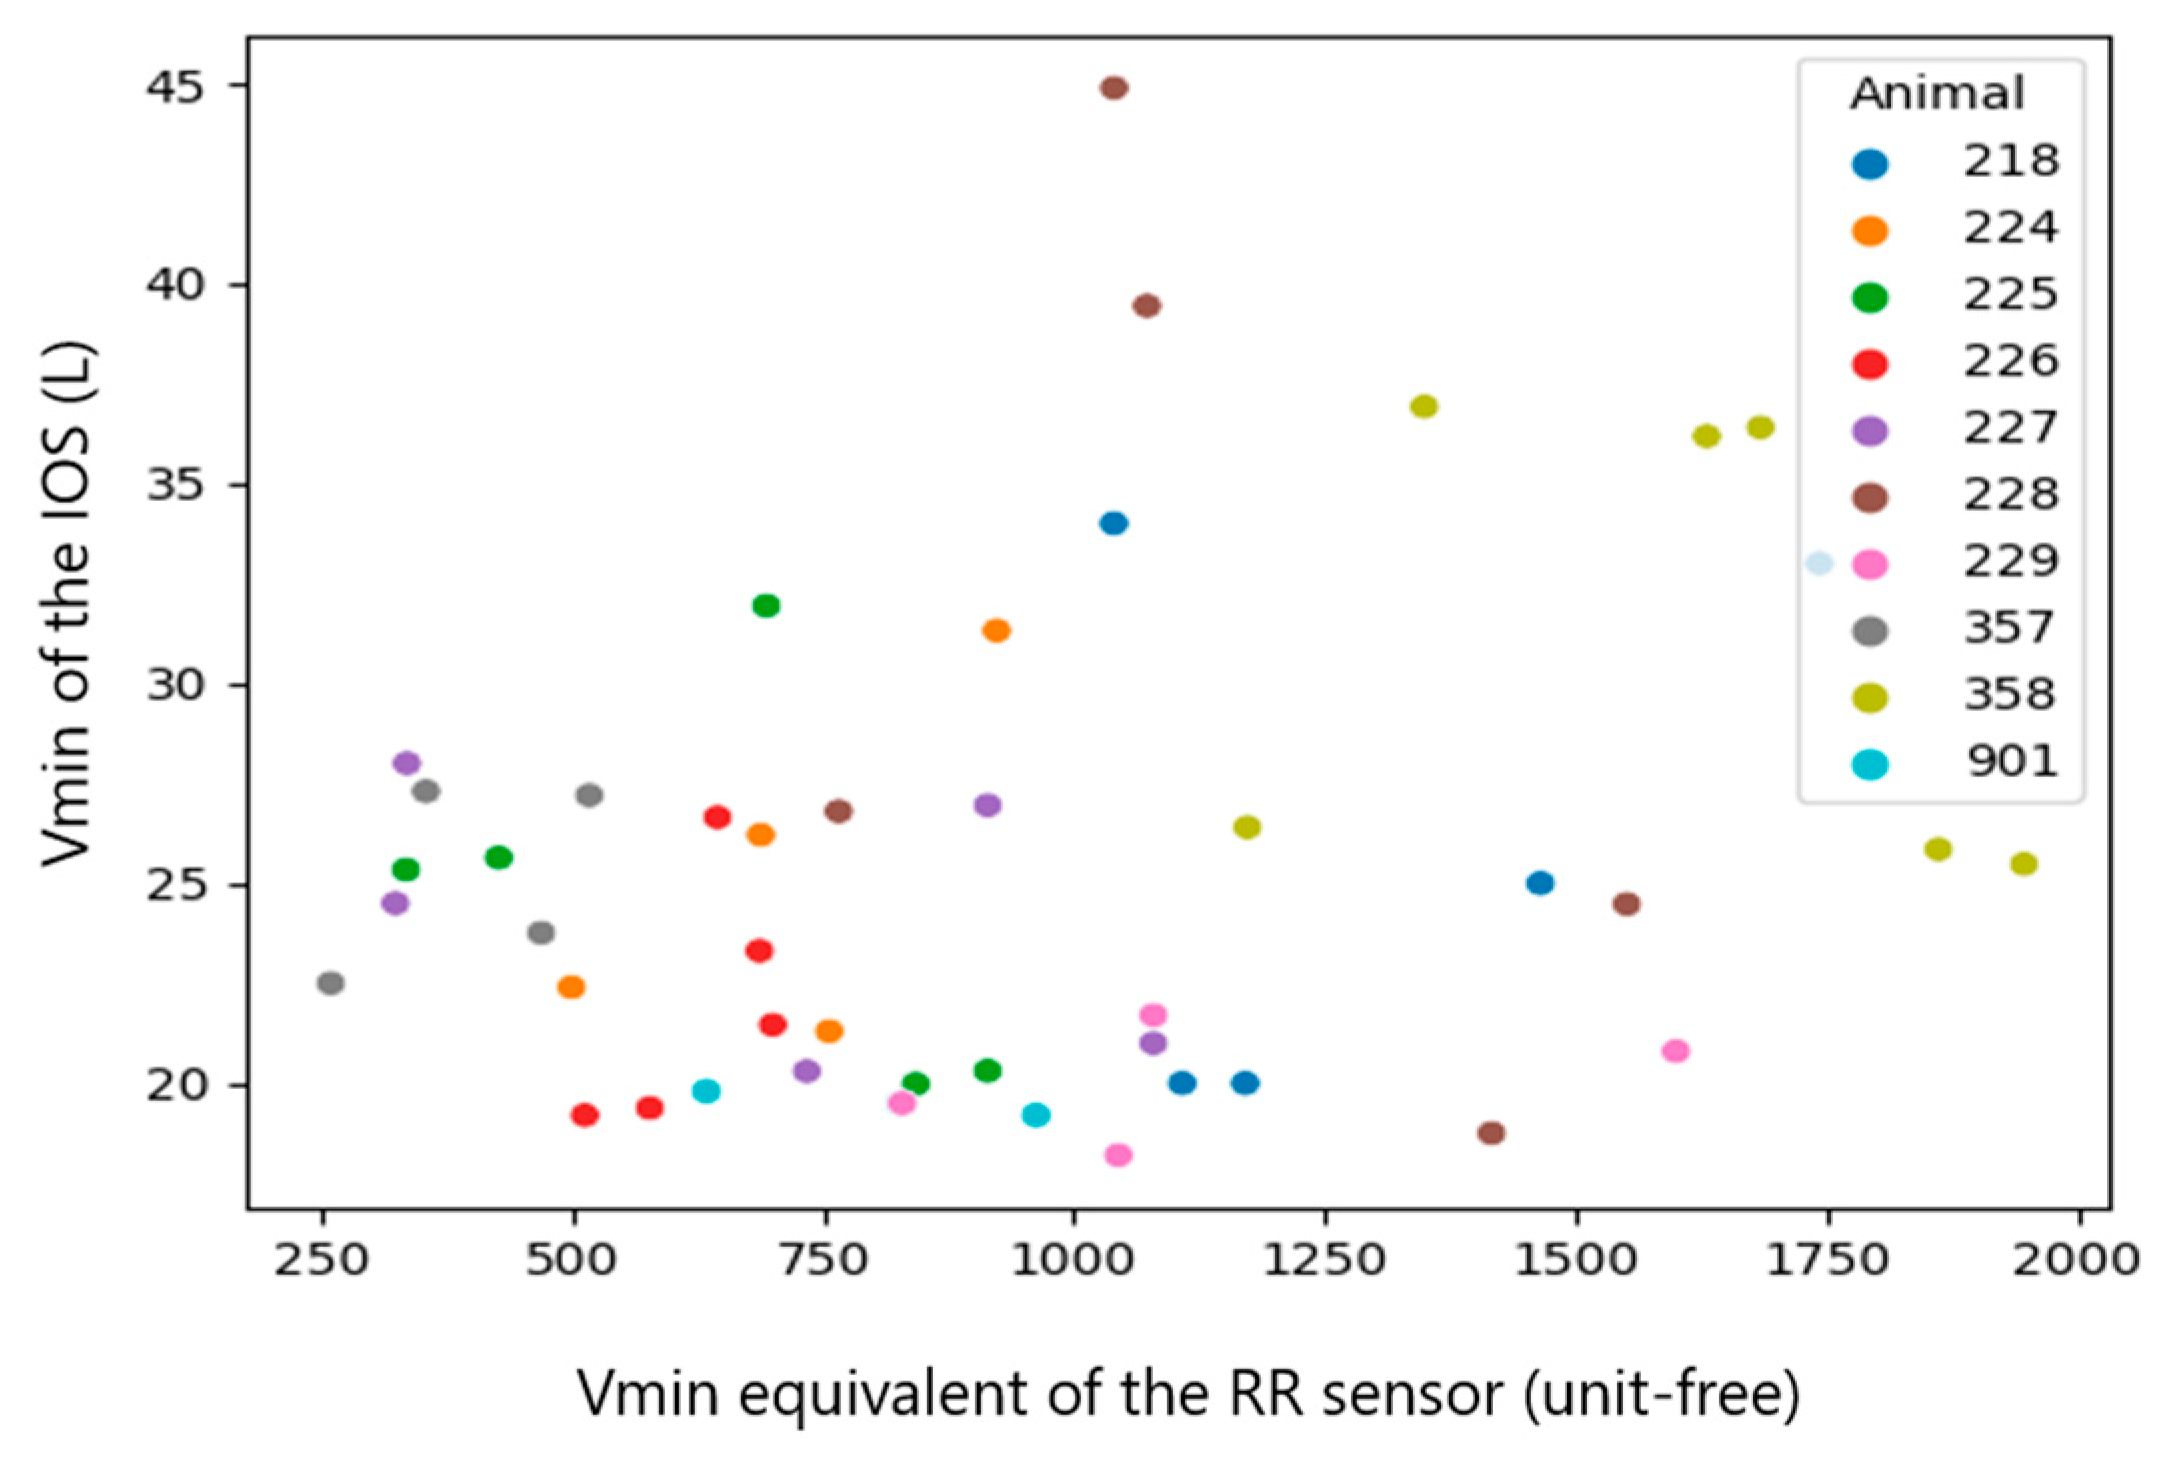
| Vmin_calibrated (RR sensor) and Vmin (IOS) | all observations (n = 46) | 0.2246 | 0.1334 |
| Median per calf (n = 10) | 0.5636 | 0.0897 |
| Parameter | Spearman Correlation | p-Value |
|---|---|---|
| RR and Vt equivalent (RR sensor) | −0.513 | 0.0003 |
| Calibrated RR and Vt equivalent (RR sensor) | −0.4621 | 0.0012 |
| RR and Vt (IOS) | −0.5438 | 0.000094007 |
Disclaimer/Publisher’s Note: The statements, opinions and data contained in all publications are solely those of the individual author(s) and contributor(s) and not of MDPI and/or the editor(s). MDPI and/or the editor(s) disclaim responsibility for any injury to people or property resulting from any ideas, methods, instructions or products referred to in the content. |
© 2023 by the authors. Licensee MDPI, Basel, Switzerland. This article is an open access article distributed under the terms and conditions of the Creative Commons Attribution (CC BY) license (https://creativecommons.org/licenses/by/4.0/).
Share and Cite
Dißmann, L.; Reinhold, P.; Smith, H.-J.; Amon, T.; Sergeeva, A.; Hoffmann, G. Evaluation of a Respiration Rate Sensor for Recording Tidal Volume in Calves under Field Conditions. Sensors 2023, 23, 4683. https://doi.org/10.3390/s23104683
Dißmann L, Reinhold P, Smith H-J, Amon T, Sergeeva A, Hoffmann G. Evaluation of a Respiration Rate Sensor for Recording Tidal Volume in Calves under Field Conditions. Sensors. 2023; 23(10):4683. https://doi.org/10.3390/s23104683
Chicago/Turabian StyleDißmann, Lena, Petra Reinhold, Hans-Jürgen Smith, Thomas Amon, Alisa Sergeeva, and Gundula Hoffmann. 2023. "Evaluation of a Respiration Rate Sensor for Recording Tidal Volume in Calves under Field Conditions" Sensors 23, no. 10: 4683. https://doi.org/10.3390/s23104683