This section is divided by subheadings. It provides a concise and precise description of the experimental results, their interpretations, as well as the experimental conclusions that can be drawn.
3.1. Sensor Characterization
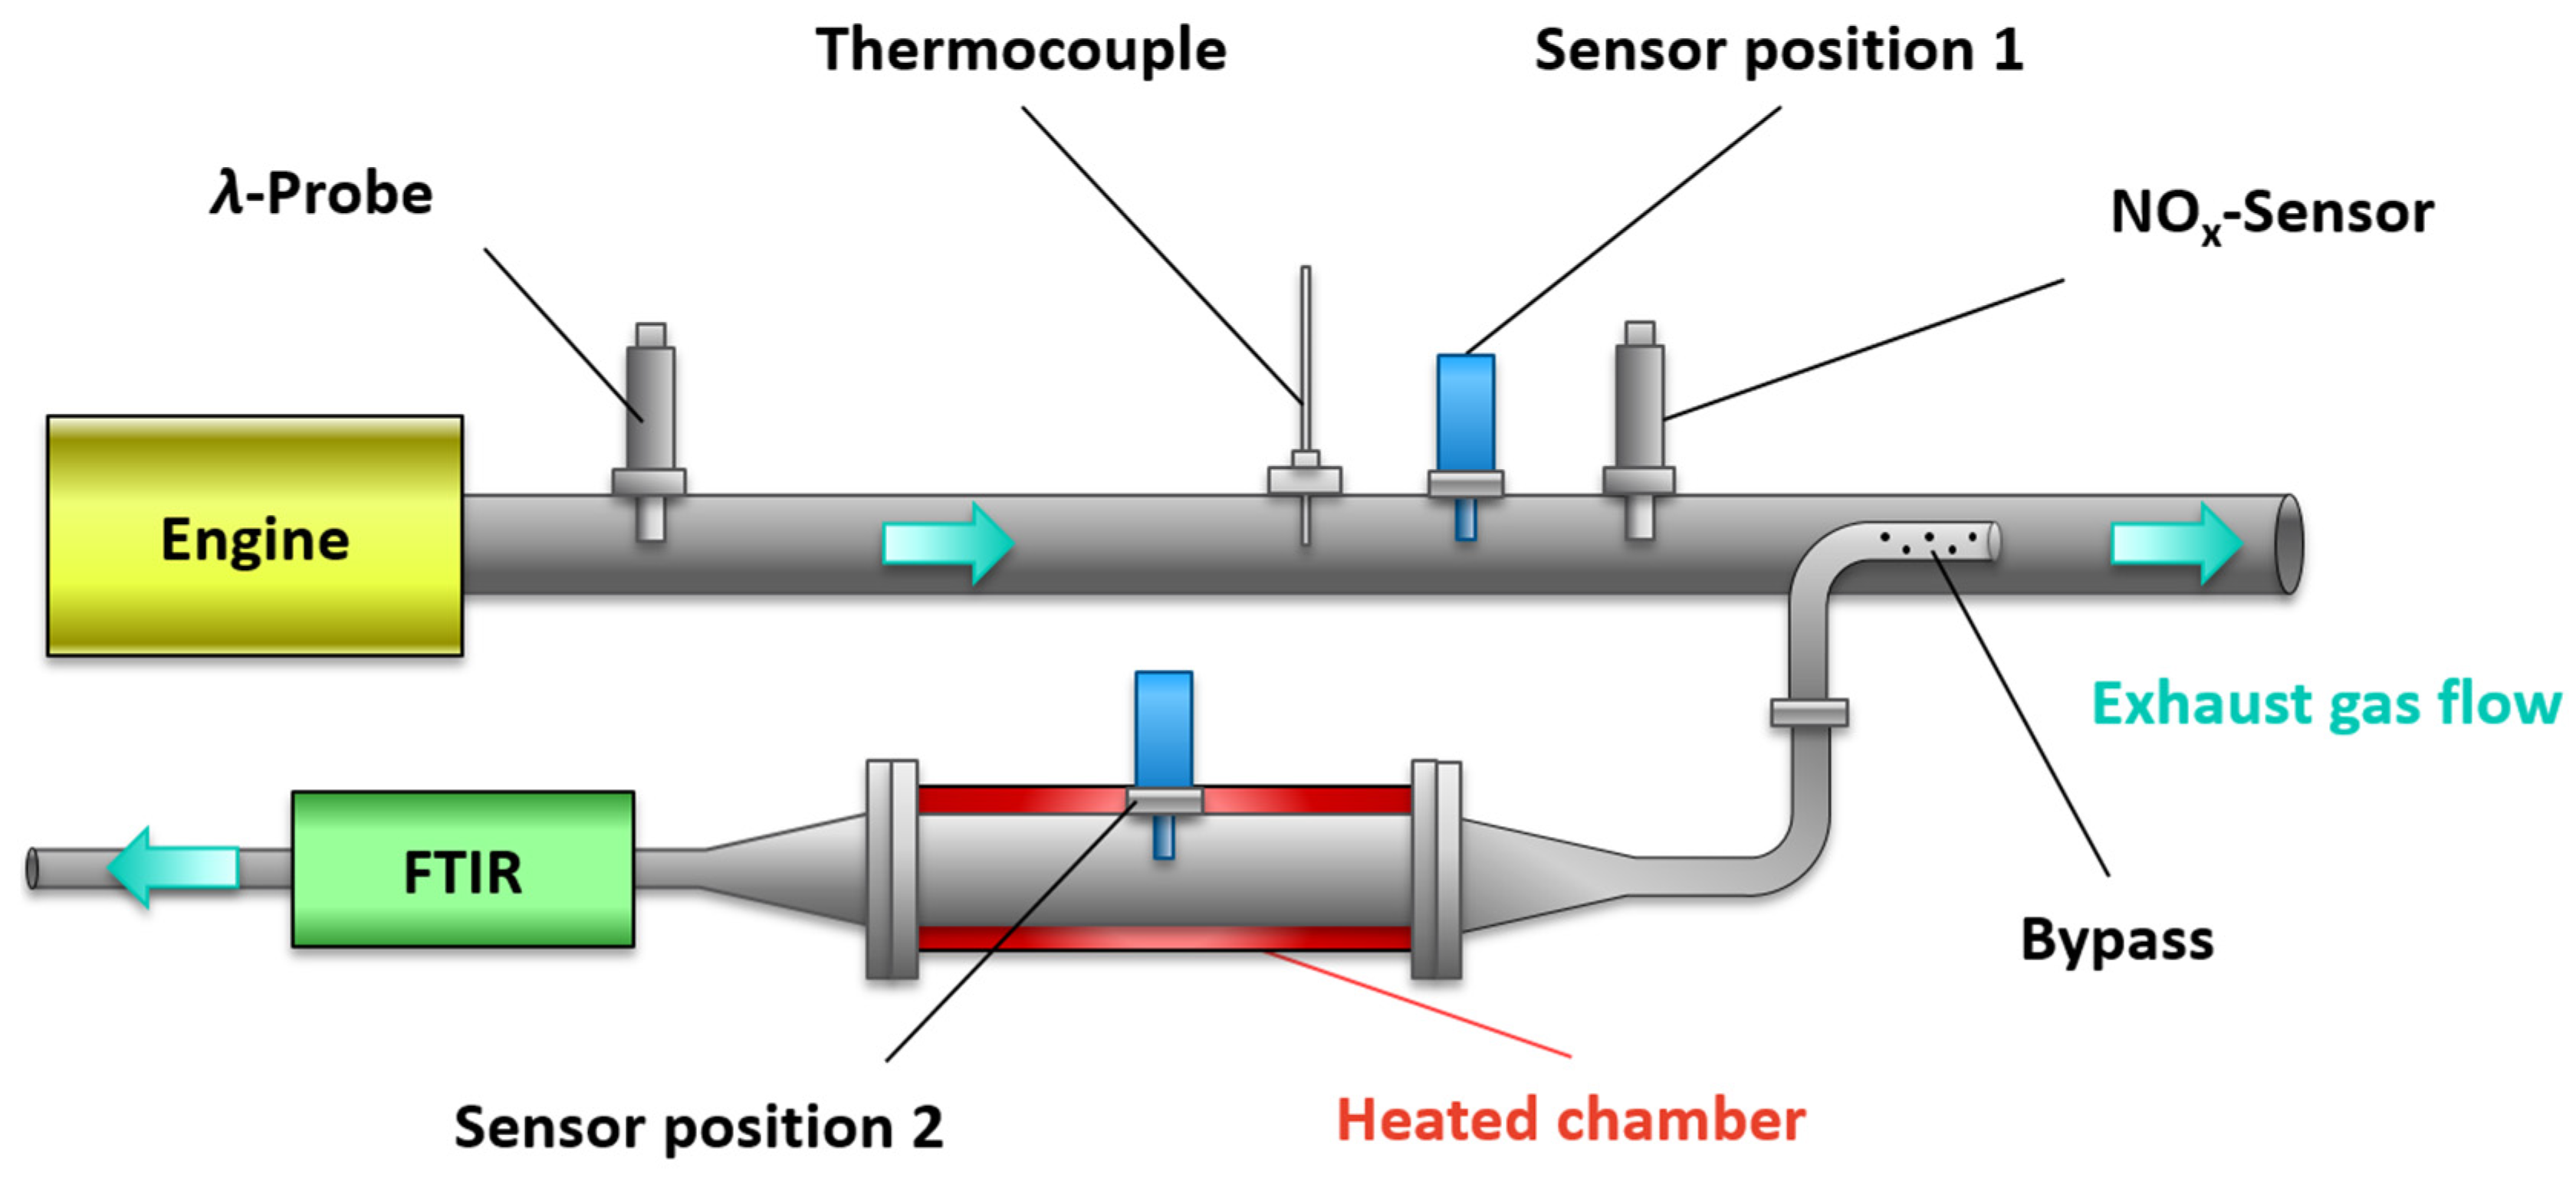
For the sensor characterization (calibration curves), the signal in the bypass measurement (
Figure 3, position 2) was investigated at constant operating conditions in the exhaust gas. While the determination of the sensitivity to oxygen was sufficient for the BFAT film, both the NO
x sensitivity and the cross-sensitivity to oxygen stoichiometry (
λ) had to be analyzed for the KMnO
4 film. For this purpose, different operating parameters were set on the engine, covering an oxygen stoichiometry of about 1.65 <
λ < 6.75 and NO
x concentrations of about 100 ppm <
cNOx < 1050 ppm. Both variables (
λ,
cNOx) were varied independently from each other to separate their contributions. Different oxygen stoichiometries
λ were adjusted by changing the boost pressure
pBoost. The NO
x concentration could be modified by specifically adjusting the injection angle
αinjection with the ECU.
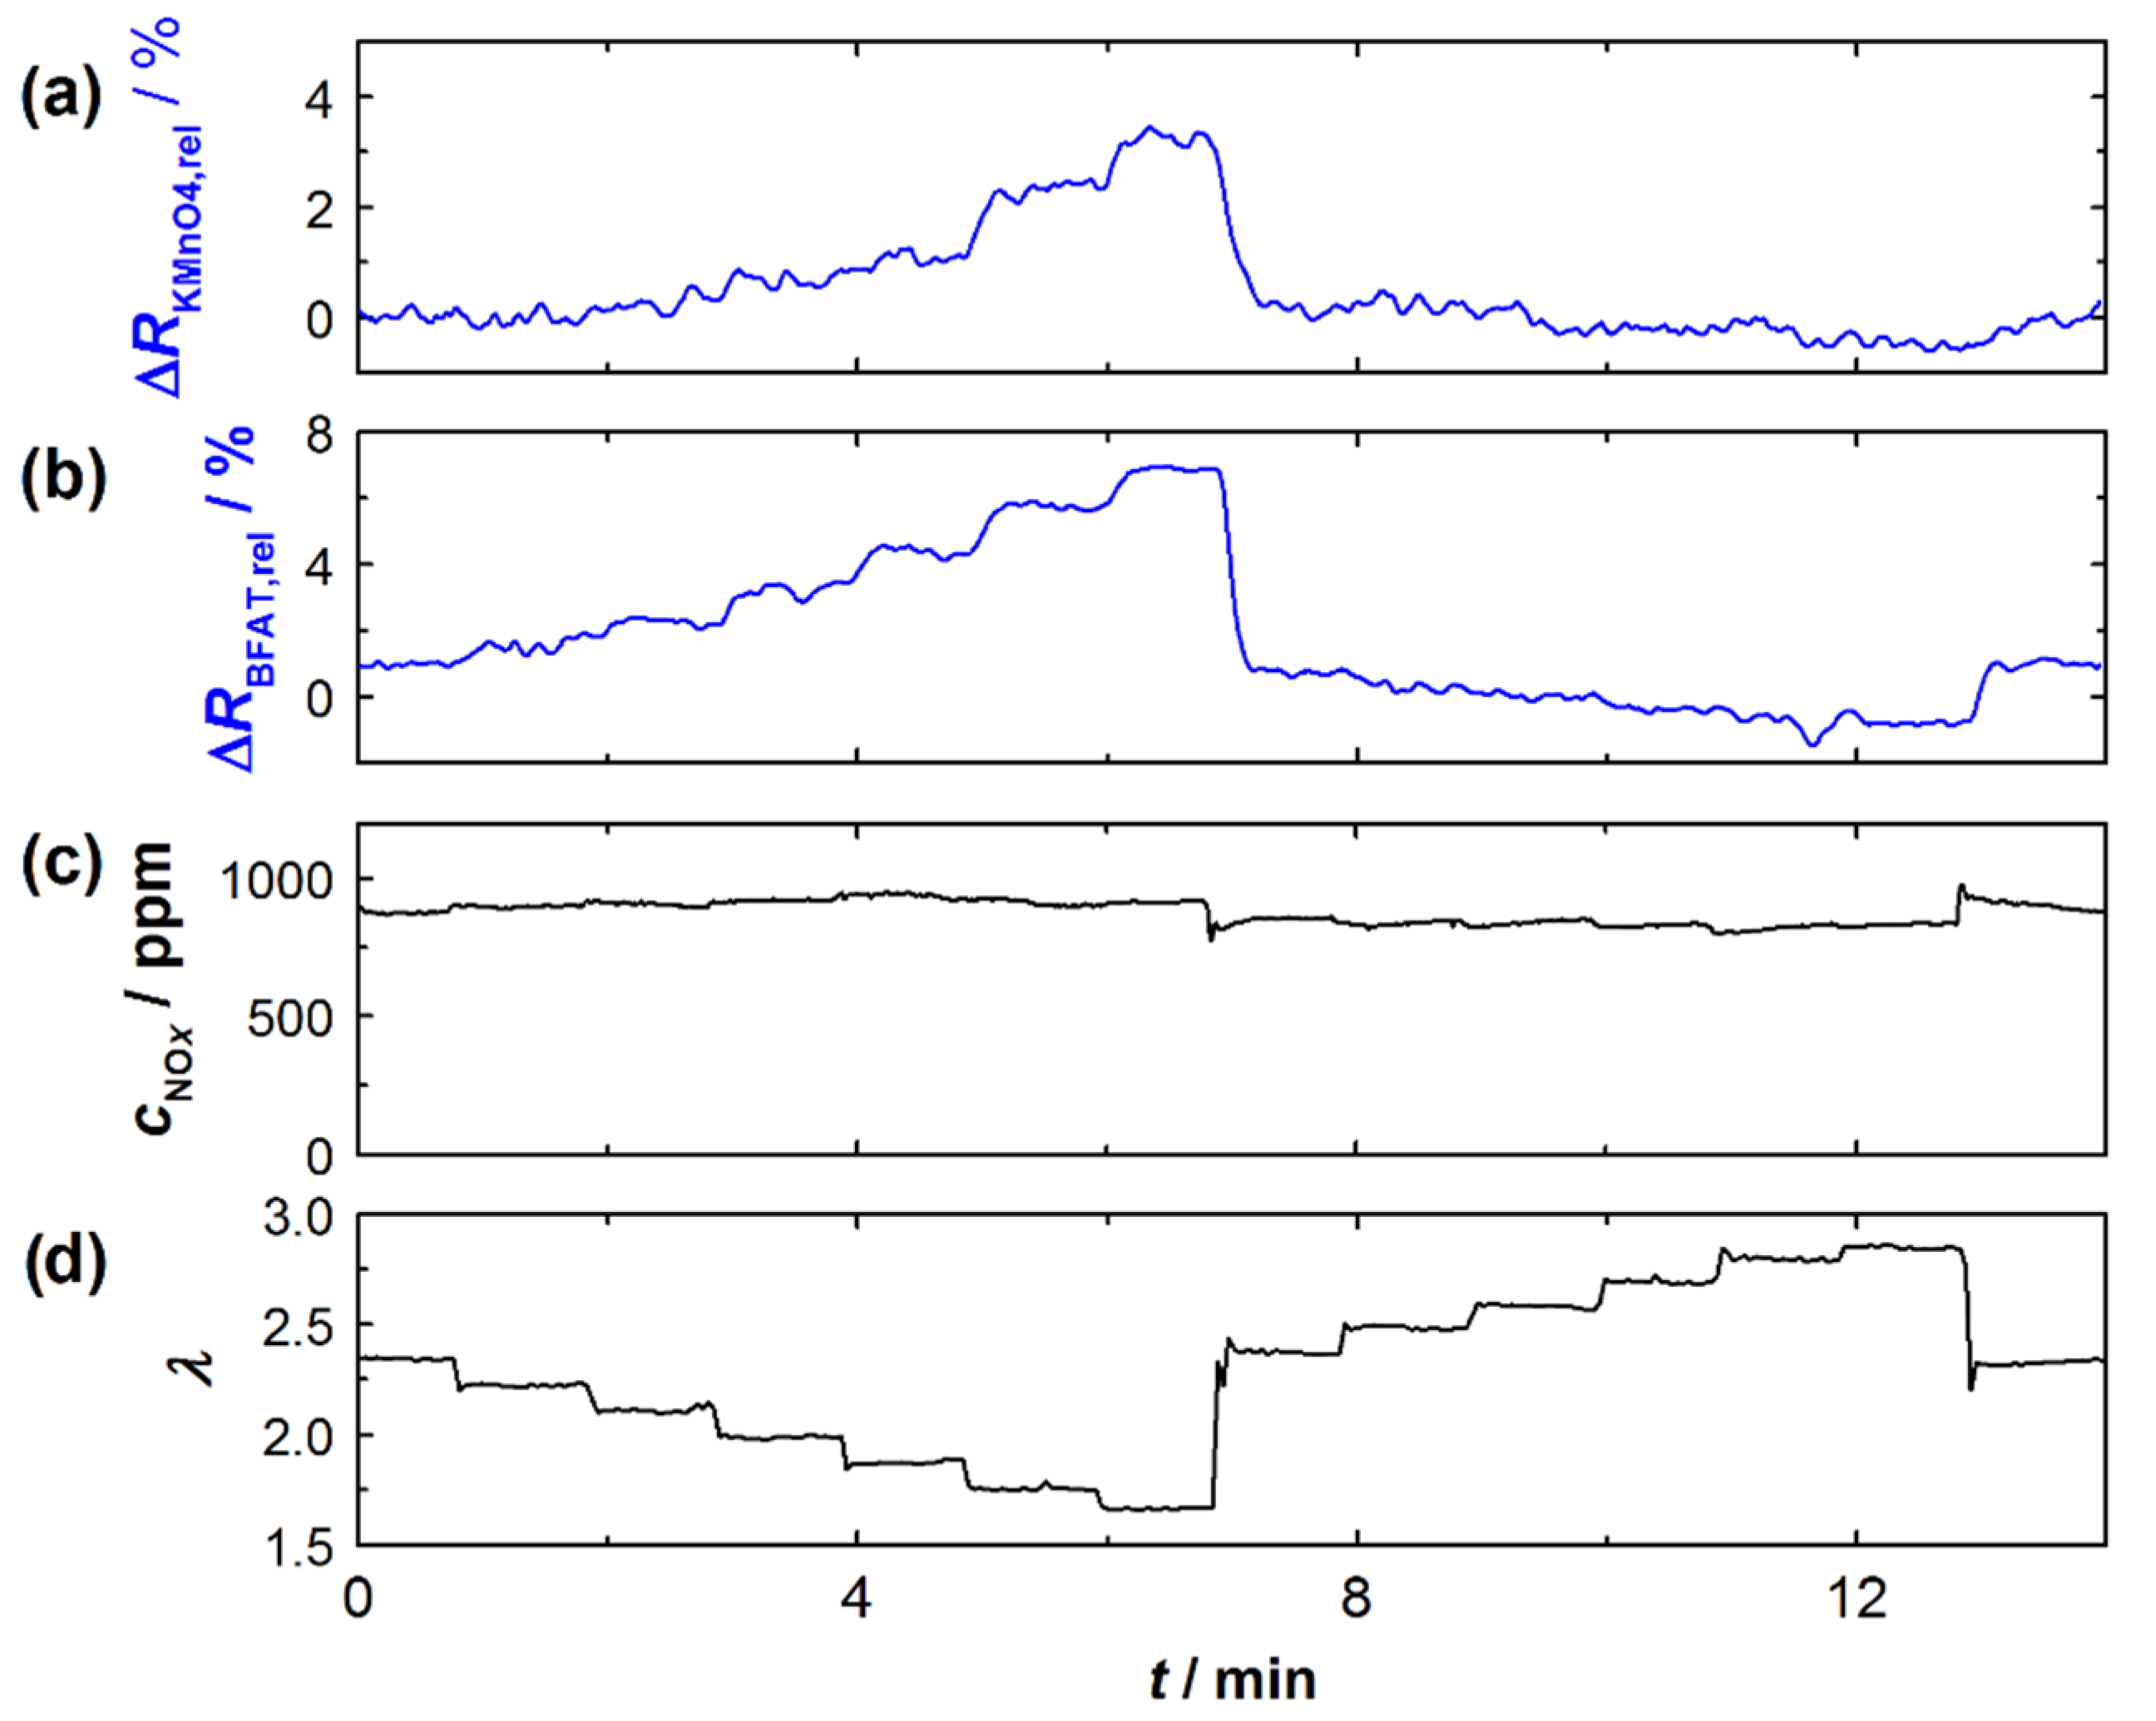
Figure 4 exemplarily shows an experiment on the effect of oxygen stoichiometry
λ in the exhaust gas. At the top (
Figure 4a), the relative signal amplitudes of the KMnO
4 and BFAT films (blue) are shown. Below that, in
Figure 4b,
cNOx and
λ are listed (black), each measured with the NO
x sensor and the UEGO lambda probe close to the engine (as sketched in
Figure 3). While
λ was changed stepwise, the NO
x concentration in the exhaust gas remained (almost) unchanged. As can be seen, the resistances of both sensor films responded to changes in
λ in the exhaust gas. Moreover, it could be observed that the changes increased noticeably with lower
λ. This behavior was also previously observed for the BFAT film in [
14], although in a smaller operating window. Experiments similar to those shown in
Figure 4 were performed at different operating parameters in order to obtain representative data for a wider operating window of the sensor. In addition, the experiments on the
cNOx dependence of the KMnO
4 were performed. As expected, the signal from the BFAT film showed no response to the changes in
cNOx during these experiments.
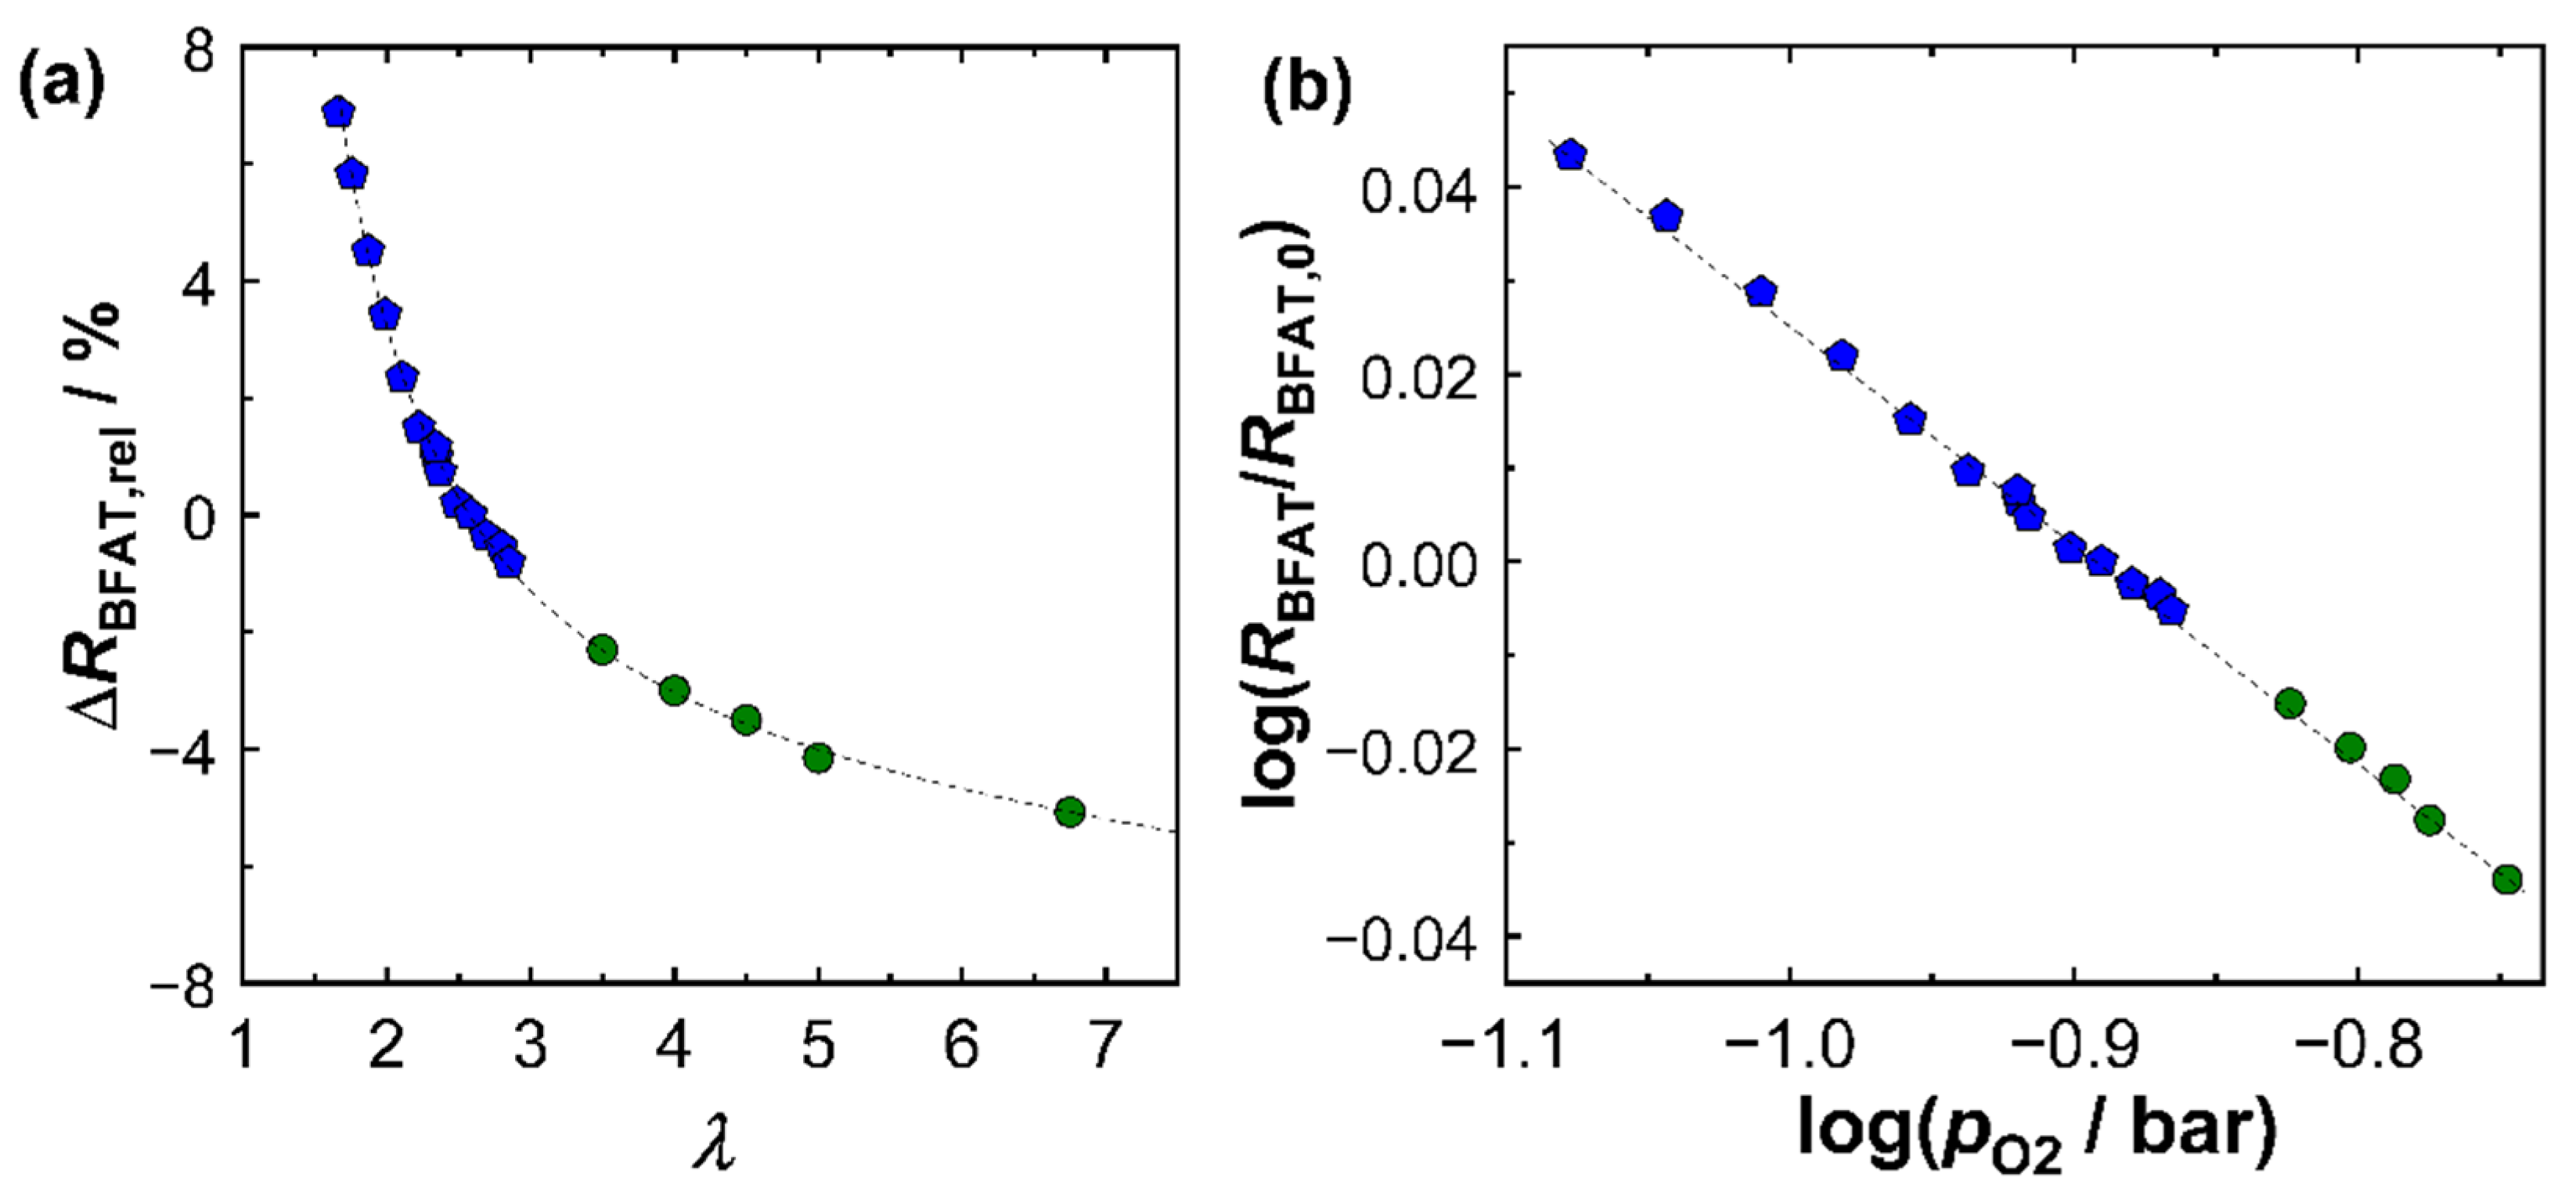
Based on this series of investigations, a superordinate calibration for the sensitivities of both sensor films considering multiple operation modes is presented as follows. First,
Figure 5 shows the signal of the BFAT film as a function of the oxygen concentration in the exhaust gas.
Figure 5a shows the relative change in resistivity (Δ
RBFAT,rel) versus oxygen stoichiometry
λ. The change in signal amplitude was based on the BFAT resistance value at
λ = 2.50. The blue data points were derived directly from
Figure 4. Points from other operating points are shown in green. In the wider operating window, the trend of a smaller sensitivity with a leaner exhaust gas composition was further confirmed. The plausible reason for this phenomenon was that, at large lambda values, the
pO2 in the exhaust gas hardly changed and was close to the air concentration (21% O
2).
If the change in resistance of the BFAT film was plotted against the
pO2 (logarithmically), as in
Figure 5b, a linear relationship was obtained. The dependence confirmed that the sensing mechanism followed expectations from the defect chemistry of the BFAT material, i.e., the formation of holes
by filling oxygen vacancies. This was also confirmed by the slope in the resistance
RBFAT in
Figure 5b, which was calculated to be −0.235. Considering that +1/4 was typically found for the BFAT conductivity σ (∝1/R), the primary p-type conduction character at high oxygen partial pressures was a plausible finding and was in line with previous studies [
25,
28].
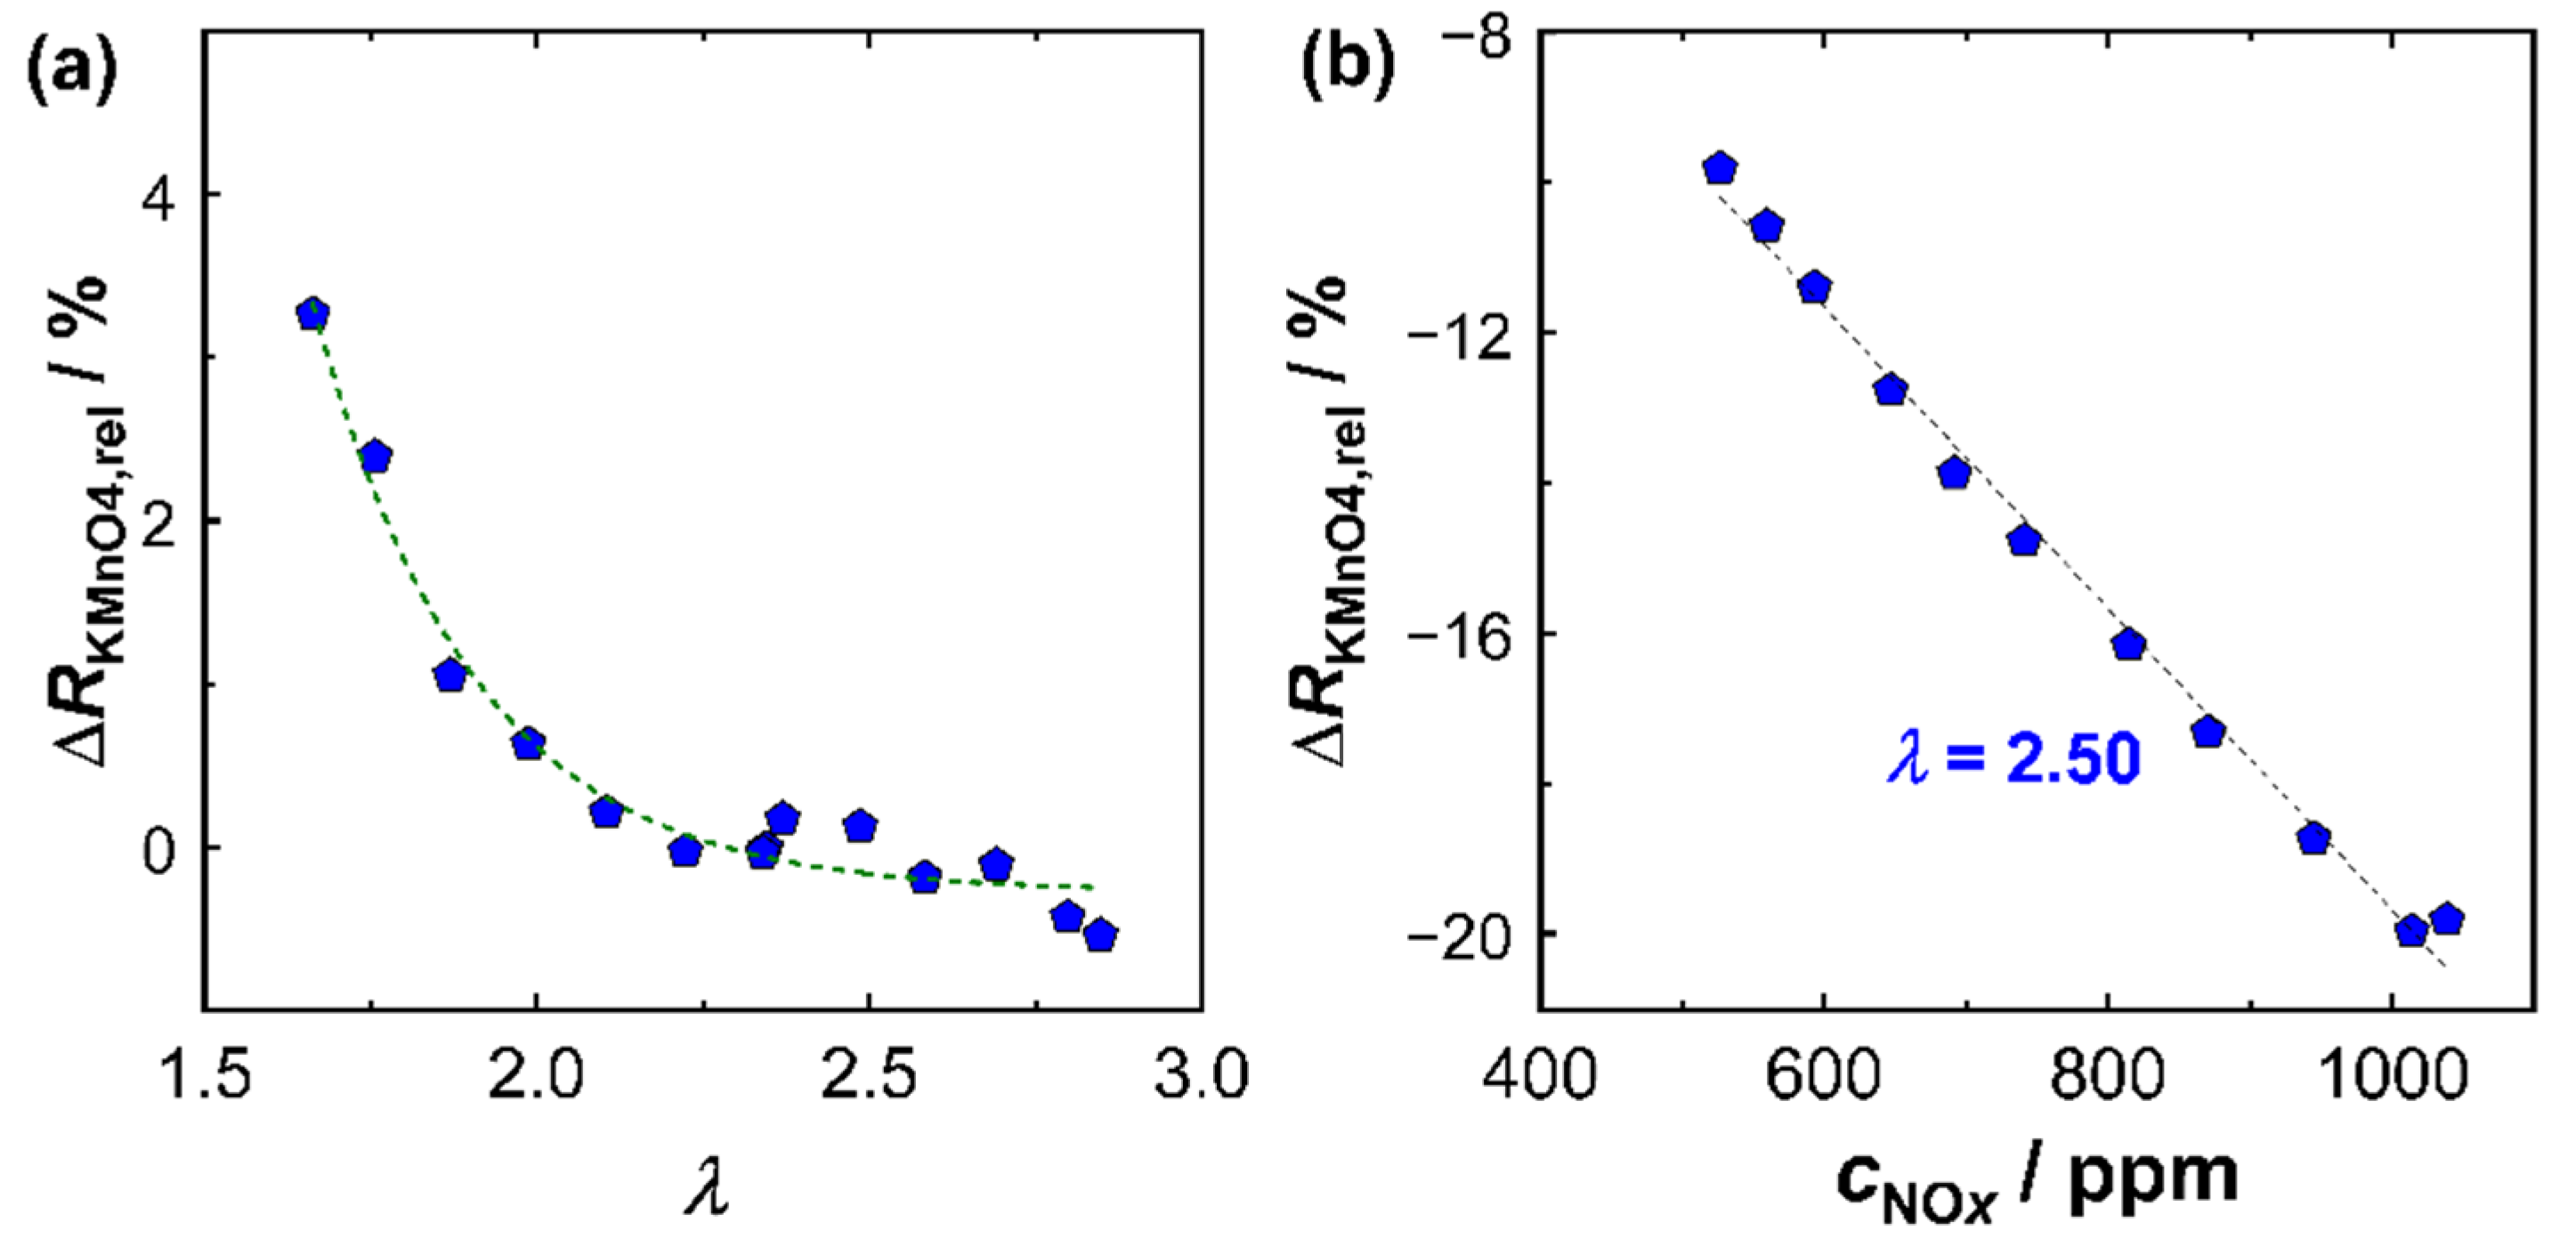
From the same experiments, the
λ cross-sensitivity of the KMnO
4 film was determined, which is summarized in
Figure 5a, again referring to
λ = 2.50. At low lambda values (
λ < 2.50), a significant influence of oxygen stoichiometry on the resistance of the KMnO
4 film was observed. On the other hand, at high excess oxygen values (
λ > 2.5), the influence could almost be neglected. Applied on engine operation, this result meant that the cross-sensitivities had to be taken into account, especially at high loads (high engine power), since these operating points were usually associated with a drop to lower
λ. At operating points with high excess oxygen, on the other hand, such as idle engine phases, the NO
x sensor response remained largely unaffected by
λ.
Last but not least, the NO
x sensitivity of the KMnO
4 film had to be determined. For this purpose, experiments with different NO
x concentrations were performed in a similar manner.
Figure 6b shows the result of the investigation at high NO
x concentrations (525 ppm <
cNOx < 1040 ppm) at a constant oxygen stoichiometry
λ = 2.50. In the investigated operating window, there was a direct proportionality of the relative resistance change to
cNOx in the exhaust gas. This correlation was also found in other operation modes. However, it was also observed that the sensitivity of the KMnO
4 film
was a function of the oxygen stoichiometry
λ and confirmed findings from laboratory experiments of previous studies [
14]. The sensitivity of the KMnO
4 film
was defined by Equation (3) as:
In this study, a proportionality between NO
x sensitivity and oxygen stoichiometry was assumed. The variables used to calculate the current NO
x sensitivity were statistically determined from a series of different operating modes that could be used for an operating field between 1.65 <
λ < 6.75 and
cNOx < 1050 ppm:
with the oxygen stoichiometry
in the exhaust gas determined by the response of the BFAT film. At the reference lambda value of
λ = 2.5, the KMnO
4-film had a NO
x sensitivity of about 20%/(1000 ppm NO
x), which was in line with
Figure 6b. The NO
x sensitivity never decreased below 15%/(1000 ppm NO
x) for lean exhausts (
λ > 1), but could rise by a factor of more than 1.5 for high oxygen stoichiometries (
λ > 6). Equation (4) represents a simple approach to determine
. In laboratory studies [
14,
16], it was found that the sensitivity of KMnO
4 depended not only on
λ but also on
cNOx itself, specifically that
decreased with higher NO
x concentrations. According to the former results, the correlation shown in
Figure 6b was therefore expected to be nonlinear over a wider range of NO
x concentrations, especially with a higher
at low NO
x concentrations. However, these conditions were technically not accessible due to restrictions in the ECU to guarantee a proper engine operation. Furthermore, during engine operation a correlation between
λ and
cNOx was observed: during periods of low load (idle phases), high lambda values (
λ > 5) were typical. At the same time,
cNOx was small (<200 ppm) due to low combustion temperatures. Following the previous findings, both high
λ and low
cNOx thus favored a high
for these exhaust gas compositions. Conversely, lower
λ (<3) and high
cNOx (>500 ppm) appeared, particularly at high engine loads, which reduced
in those cases. This trend is included in Equation (3) by the calibration measurements. Equation (3) therefore probably does not represent the isolated effect of
λ on
, but rather considers the combined effect of oxygen stoichiometry
λ and NO
x concentration. During multiple experiments at the engine,
was observed to decrease by about one third due to the contribution of both effects. A more extensive investigation of the separate contributions of
λ and
cNOx in real exhaust gas would be interesting from a research standpoint, but, as stated above, was hardly possible due to the limited range individual operating parameters that were allowed in the ECU. In addition, they would provide only a minor benefit for the application itself, since a correlation between both contributions could be observed anyway. The chosen approach was therefore a simple and effective method, but still applied only to the engine operating window investigated in this study.
3.2. Performance during Dynamic Engine Operation
First, it was investigated whether the above characterization of the sensitive films could be used to correctly determine the oxygen stoichiometry and the NO
x concentration when measured in the bypass (sensor position 2). The sensor operation temperature was again 600 °C. For this purpose, initial tests were conducted on the engine test bench with operating point variations, which are shown in
Figure 7. Specifically, operating points representing a wide range of different
λ and
cNOx were chosen here.
Figure 7a,b are plots of the relative resistance changes (Δ
RKMnO4,rel, Δ
RBFAT,rel) of the KMnO
4 and the BFAT film (blue), respectively. In
Figure 7c,d,
cNOx and
λ in the exhaust gas are presented, again measured with the NO
x sensor and the UEGO lambda probe (black). In addition,
cNOx was also recorded with the FITR (green). In blue, the calculated curves from the signals of the two sensitive films (
λBFAT,
cNOx,Sens) are shown. The oxygen stoichiometry
λBFAT in
Figure 7d was determined accordingly from the data of the BFAT film. The calculation of
cNOx,Sens was carried out from the combined information of both sensitive films (BFAT and KMnO
4) and thus included the corrections for the
λ-dependent resistance and the NO
x sensitivity
of the KMnO
4 film.
The derived
λ signal (measured and calculated as described above) obtained from the BFAT film coincided with the signal of the commercial UEGO lambda probe and reliably reproduced the real conditions in the exhaust gas. The
λ signal from the BFAT film (
Figure 7d) was stable and accurate, especially at low lambda values, which was plausible based on the increasing
pO2 sensitivity (
Figure 5a,b). At high
λ, the calculated oxygen stoichiometry exhibited a larger noise. Since the oxygen concentration hardly changed here due to the already high
pO2 in the exhaust and, consequently, the expected signal amplitude of the BFAT film was lower, interferences played a more crucial role in this case. However, it should also be mentioned at this point that even the output of the commercial UEGO lambda probes could differ strongly under these conditions. The reliability of the exact values must therefore be critically rated for both sensors.
The derived NO
x signal
cNOx,Sens (measured and calculated as described above) obtained from the NO
x sensitive film also coincided with the NO
x concentration
cNOx measured with the FTIR (
Figure 7c). The approach with
λ-correction of the resistance and the NO
x sensitivity provided plausible results in the entire operating window, which were equally confirmed by the commercial NO
x sensor and by the FTIR data. Our experience here showed that significantly better results were obtained, especially when correcting the KMnO
4 sensitivity. As expected, the oxygen cross-sensitivity of the KMnO
4 film was mainly required in the range of λ < 2.5. Similar to the calculated lambda
λBFAT, operating points with low
cNOx and high lambda (12 min <
t < 15 min) were more affected by perturbations. An analysis of the calculation showed that these perturbations were mainly directly due to signal fluctuations in the KMnO
4 film, which originated from the high sensitivity
at these operating points. Instead, error propagation from the
λ-correction was largely avoided with the BFAT film since O
2 cross-sensitivity played a small role under these conditions. Nevertheless, the data showed that both films responded rapidly and that the oxygen stoichiometry and NO
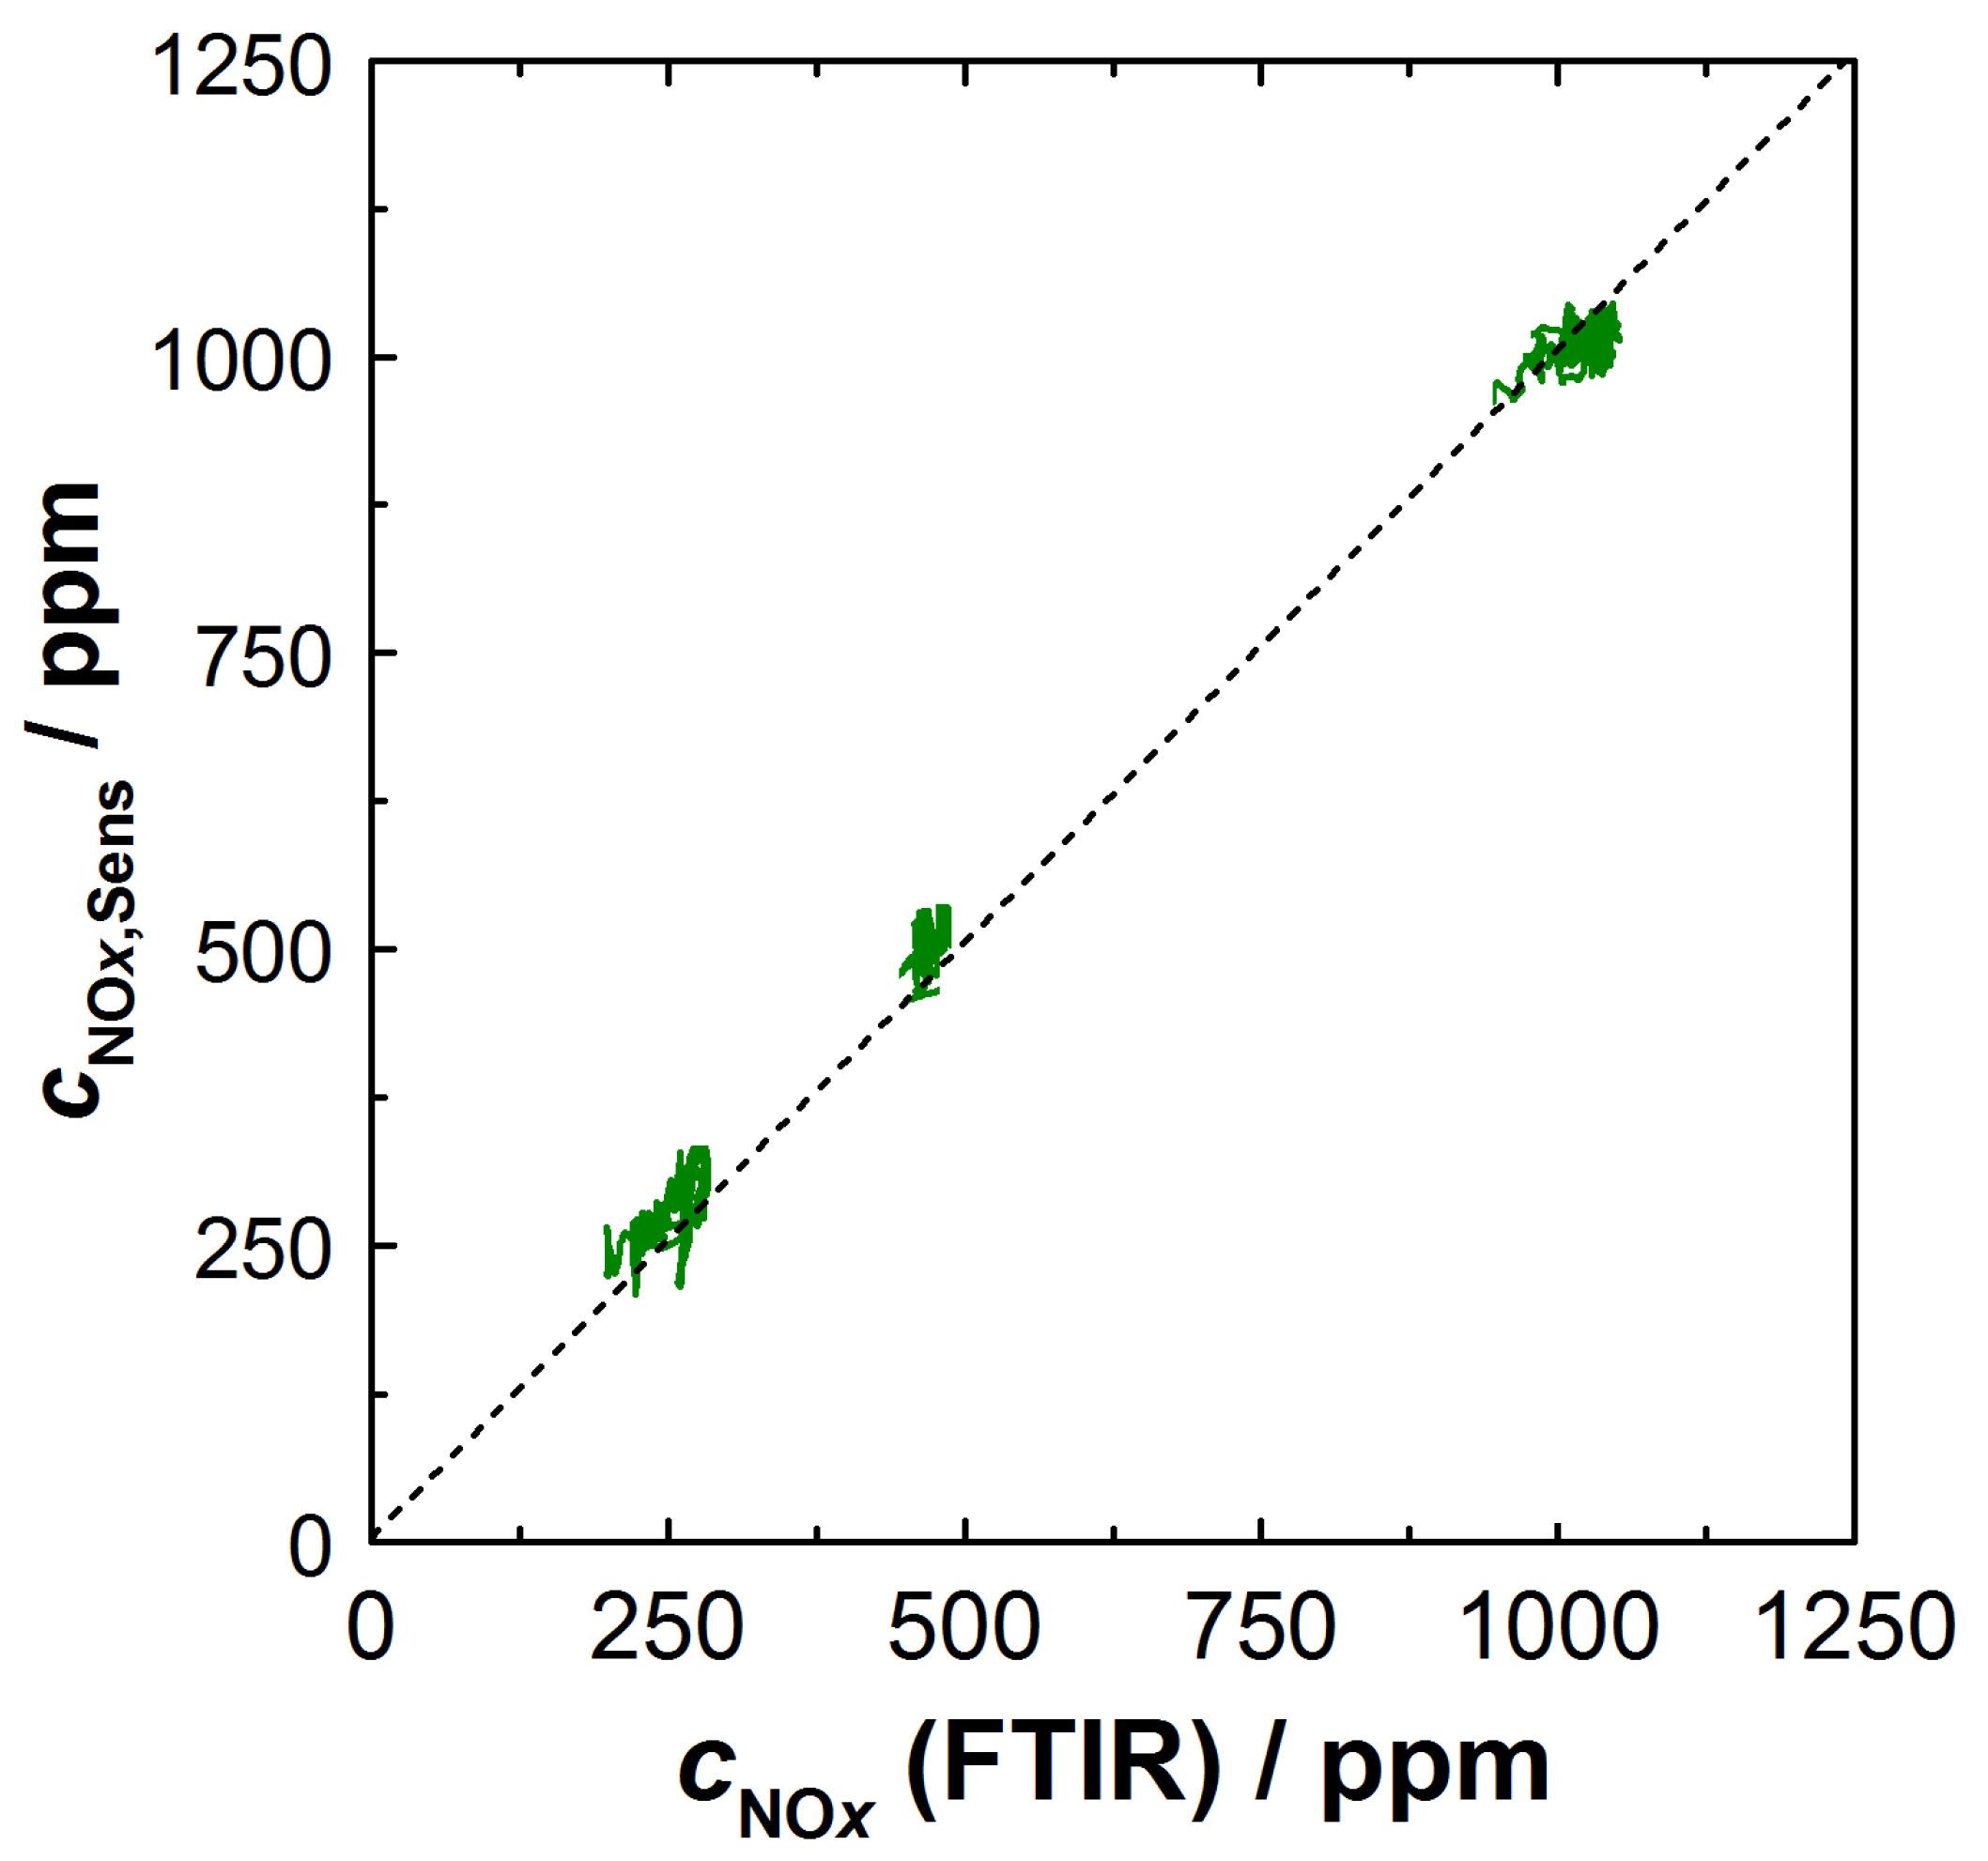
x concentration could be resolved in time during dynamic transitions to a different operating point. The NO
x concentration could be reliably calculated from the resistance signals of the two films; this is also shown in
Figure 8. There, the calculated concentration
cNOx,Sens was plotted against the NO
x concentration measured by FTIR. Shown are the steady-state operating points from the experiment in
Figure 7. The measured data are along the angle bisector and confirm that almost identical values for the NO
x concentration were obtained with both measurement systems.
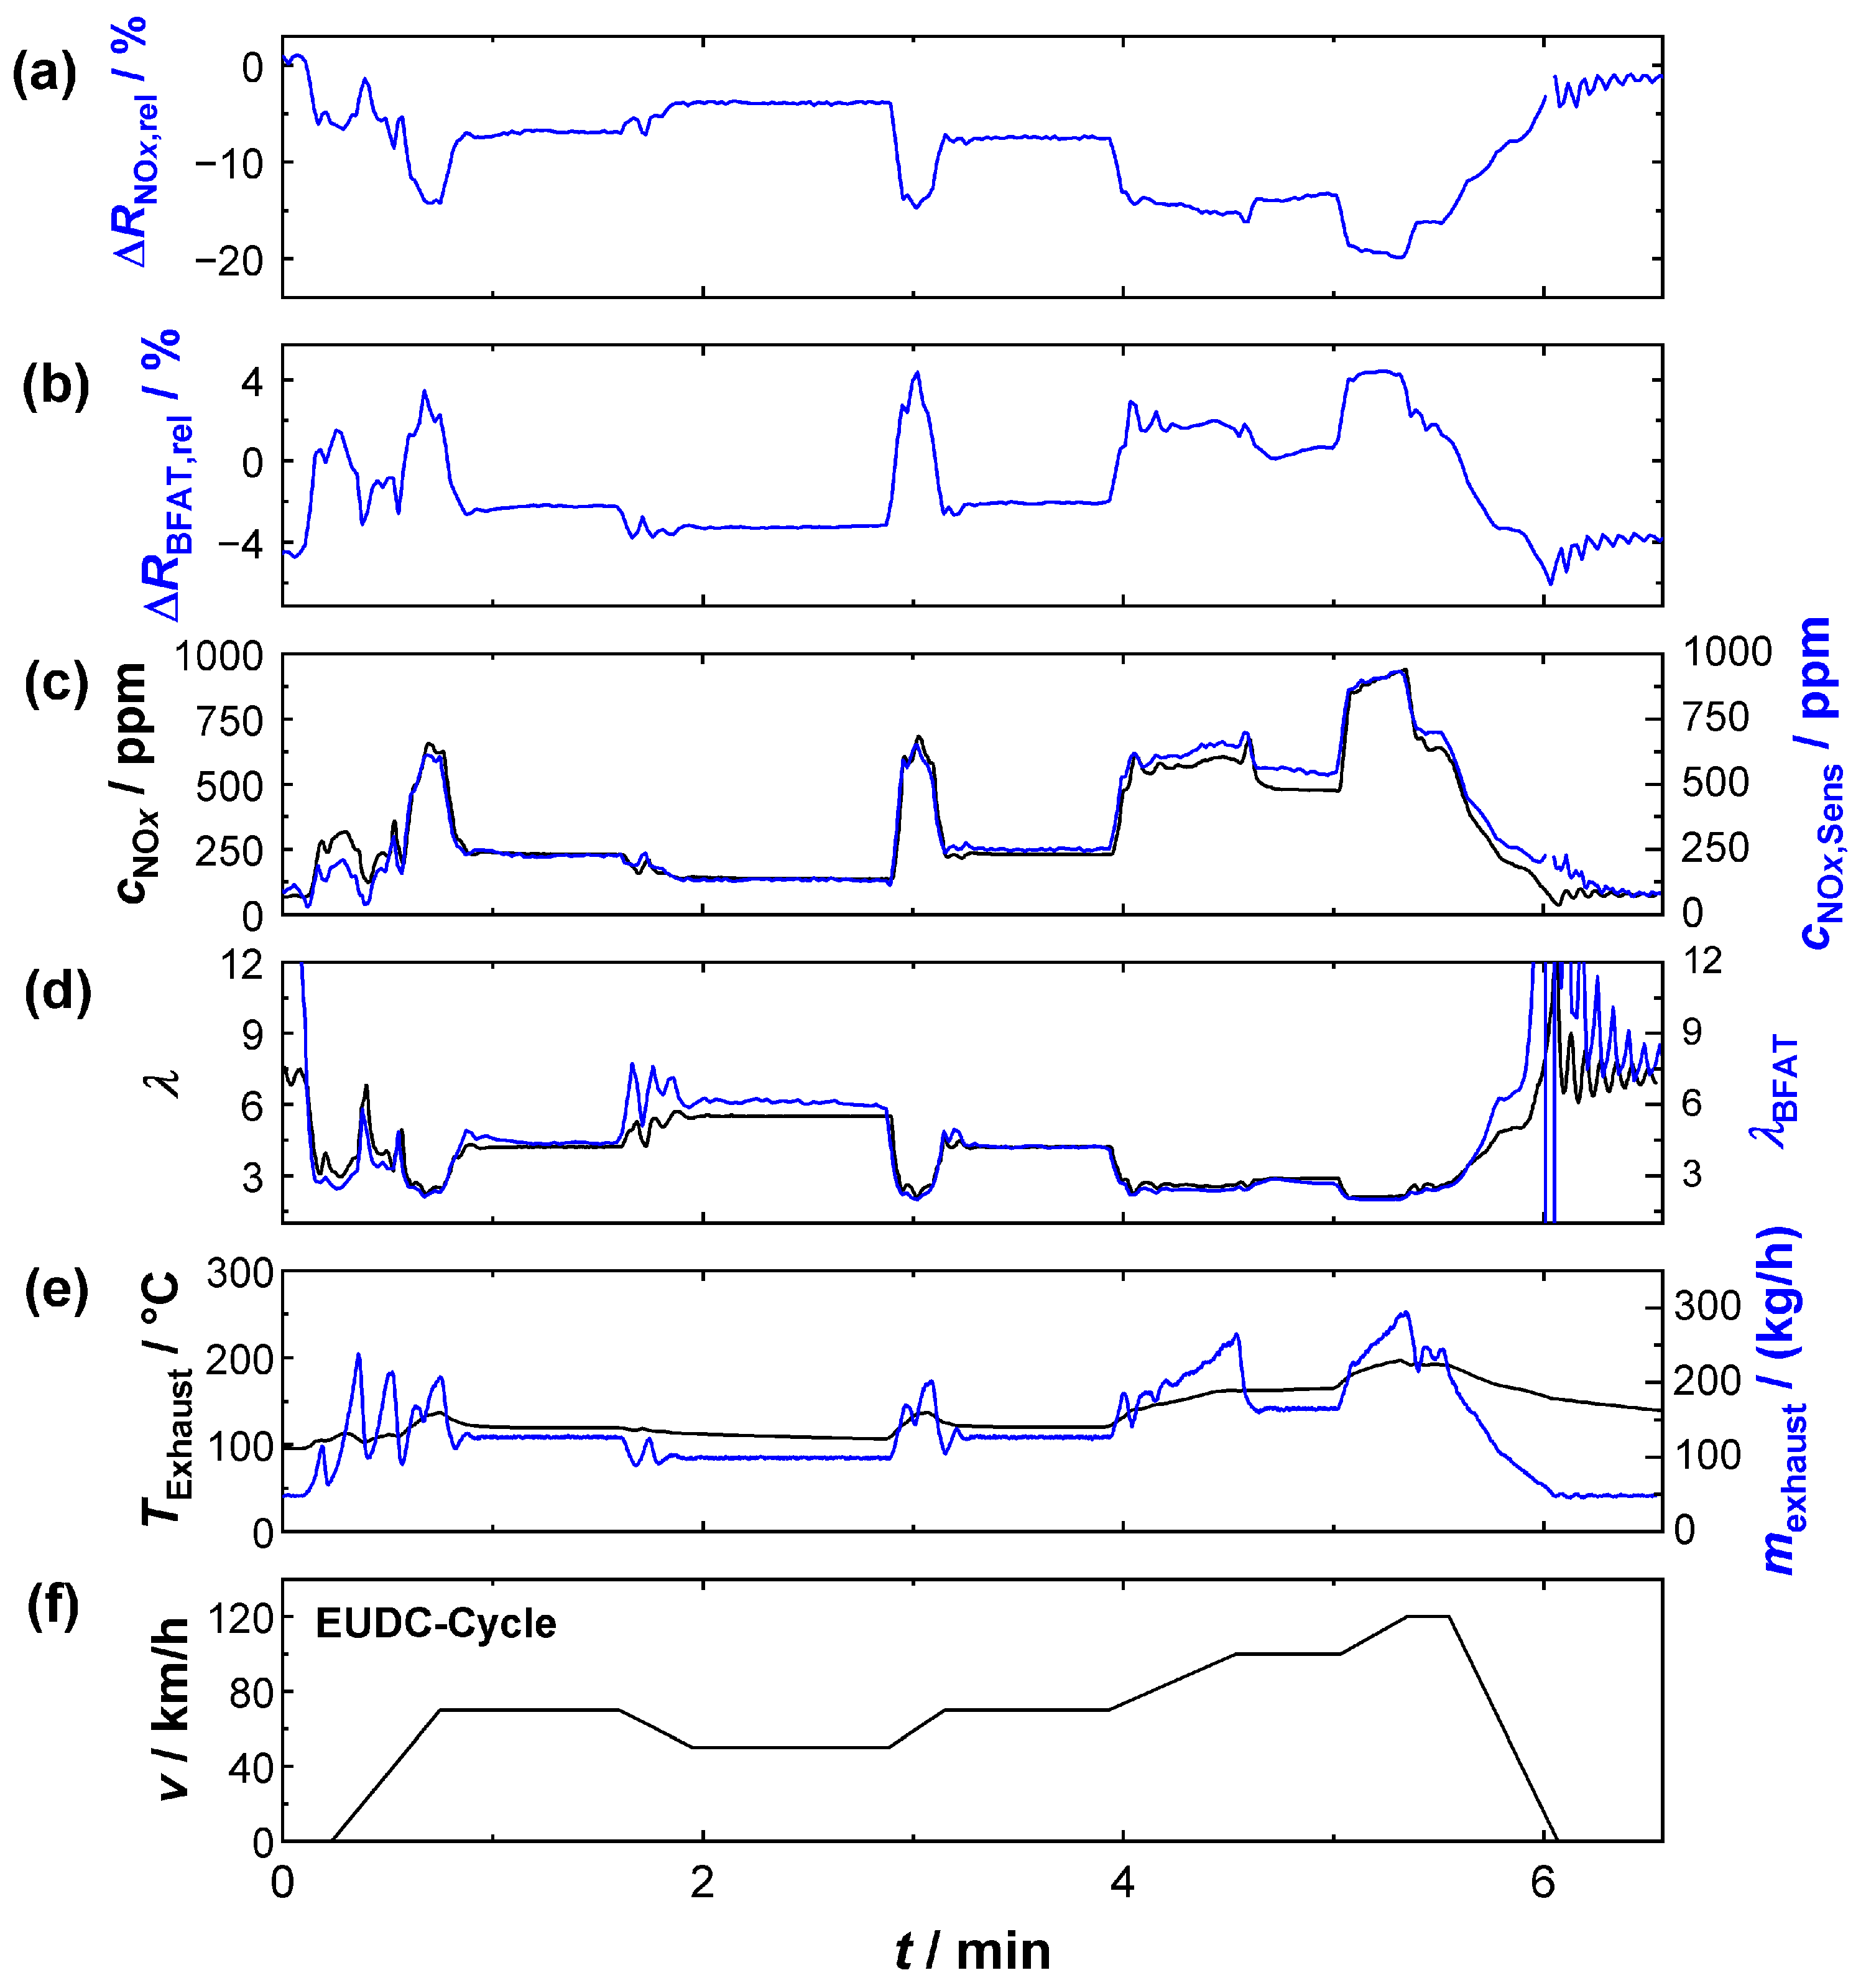
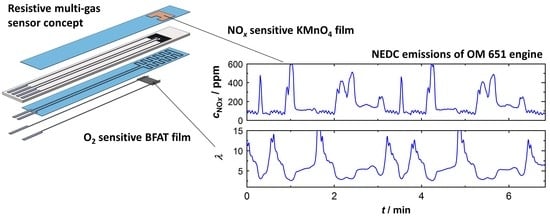
Once the calibration was successfully applied to measurements in the bypass, the following section presents a series of experiments that were carried out with the sensor in the full exhaust gas stream (sensor position 1). An NEDC was established on the engine test bench to represent dynamic driving conditions. The official test cycle consisted of an urban driving cycle (UDC) (executed four times with low engine power and acceleration) and an extra-urban driving cycle (EUDC), which simulated driving at higher speeds. The results of two of these UDCs are shown in
Figure 8. The top two plots again contain the relative resistance signals of the KMnO
4 (
Figure 9a) and of the BFAT (
Figure 9b) films. Below that, in
Figure 9c,d, the signals (
λ,
cNOx) from the conventional exhaust gas sensor are again shown in black and the signals derived from the multi-gas sensor (
λBFAT,
cNOx,Sens) are shown in blue. The FTIR data were not included this time, since the sometimes very dynamic conditions could not be resolved due to the limited time resolution of the FTIR device. The exhaust gas mass flow data (black) from the engine controller and the exhaust gas temperature (blue) near the probe are also shown (
Figure 9e). The bottom graph,
Figure 9f, shows the velocity during the NEDC.
The segment shown in
Figure 9 comprises two urban cycles. Each cycle in turn comprised several acceleration phases with partial load operation, in which lambda values in the range of 2 <
λ < 5 were typical (e.g.,
t = 2.3 min). During the short acceleration phases, the exhaust gas mass flow (
Figure 9e) temporarily increased and oxygen stoichiometry
λ drops (
Figure 9d), and peaks in the NO
x concentration (
Figure 9c) were simultaneously observed. For both exhaust gas properties (
λ,
cNOx), the multi-gas sensor provided similar values to the commercial sensors during these operating phases. Even NO
x peaks were detected and the concentrations were also quantitatively similar (peaks up to 500 ppm), despite the highly dynamic conditions during the acceleration phases.
Between the phases of partial-load operation there were sections where the engine was mainly idling at low power (e.g., t = 5 min). In these phases, the ECU obviously set the oxygen stoichiometry to a higher oscillating lambda value. The λ-oscillation was also detected at the BFAT film. The amplitude of the resistance change was quantitatively small due to the small pO2 changes under these conditions but sufficiently high to derive a plausible lambda value. However, the calculated curve could only partially follow the oscillation frequency due to the limited timely resolution of the resistivity measurement (<0.7 Hz) at the BFAT film. In addition, it should not be ignored that the sensor positions of the UEGO lambda probe (close to the engine) and the multi-gas sensor were different and thus different local oxygen stoichiometries could be present at the sensors due to diffusion. Although the evidence could not be provided here, we assumed, based on the flanks of the resistivity signal, that the film itself responded faster to the oxygen stoichiometry in the exhaust gas than could be detected during data acquisition.
Oscillations were also observed for cNOx during idle engine phases. The concentrations here were small and were below 200 ppm. Again, identical cNOx, and even similar oscillation amplitudes, could be measured with the multi-gas sensor, which was obviously a benefit from the higher sensitivity under these conditions. Thus, the measurement also showed that the oscillating oxygen stoichiometry hardly affected the NOx measurement, but the achievable accuracy at these operating points mainly depended on the signal quality of the KMnO4 film. In summary, the determination of exhaust gas characteristics with the multi-gas sensor succeeded in partial-load engine modes. The results of the resistive sensor principle were comparable with those of the established sensor technology.
Based on the findings from the UDC, the results of the extra-urban cycle (EUDC) are shown in
Figure 10. The signals listed and the assignments of colors are identical to
Figure 9. Unlike the UDC, the average engine power was higher to simulate driving outside of urban areas; the exhaust gas mass flows and the temperatures were therefore higher. At the same time, idling phases hardly played a role. For the exhaust gas composition, this meant a lower (average) oxygen stoichiometry and higher NO
x raw emissions (peaks > 900 ppm). In this case, too, the determination of
λ and
cNOx worked successfully with the multi-gas sensor. Despite the more dynamic conditions during the acceleration phases, all flanks were recorded and the exhaust gas properties could also be quantified. Unlike in the UDC, the oxygen cross-sensitivity of the KMnO
4 film also played a more important role in this cycle due to the temporarily lower
λ-values. This effect could be corrected in the calculation by the oxygen information obtained from the BFAT film, which also showed higher signal amplitudes under these conditions.
Figure 9e and
Figure 10e also show that flow conditions and exhaust gas temperatures were by no means constant during the test. The results from the NEDC cycle (UDC, EUDC) were all the more surprising, because such effects at the sensor were not considered in this study. On closer inspection (e.g.,
Figure 10e), the measurements showed that deviations between the multi-gas sensor and the commercially available probes were more likely to occur during rapid changes in the engine operation mode. An evaluation, which, e.g., also considered the heating power of the sensor, could probably improve the quality of the measurement even more. Nevertheless, the experiments showed that even the simplified method was sufficient to determine plausible results for the resistive multi-gas sensor.
Finally, the accuracy of the multi-gas sensor was quantified and compared with the specifications of commercial sensors and probes. For this purpose, it made sense to look at the KMnO
4 and BFAT layers separately, starting with the latter. For the oxygen sensitive film, similar observations could be made as for commercial wideband probes: the sensor accuracy was significantly higher at low lambda values due to the higher change in
pO2. Towards leaner oxygen stoichiometries, the measurement accuracy decreased noticeably, since the
pO2 hardly changed anymore. In this case, a uniform quantification of the measurement uncertainty for the entire measurement range was therefore not practicable. Following the example of commercial probes, we therefore decided to refer the accuracy to a specific lambda value (here,
λ = 2.59). For the measurements at static conditions, a standard deviation of the sensor signal of ±0.038 was observed. Typical wideband sensors (such as Bosch LSU 4.9 [
35]) showed ±0.05 according to their specifications at
λ = 1.7, which was a similar level. In dynamic conditions, the deviations could be greater. However, in this case, a direct comparison between the two sensors was not recommended due to the different sensor positions in the exhaust pipe.
To determine
cNOx, the reference sensor (Continental UniNO
x-Sensor [
35]) had an accuracy of ±10% for
cNOx > 100 ppm (the latter condition was met for almost all operating conditions investigated). In most phases, including the NEDC cycle, the multi-gas sensor and the reference sensor did not differ by more than ±25 ppm. Exceptions were again observed under highly dynamic conditions (short acceleration phases with high
cNOx). However, one should keep in mind the different sensor positions. Considering the ±10% accuracy of commercial sensors, we therefore assumed that the multi-gas sensor could provide similar accuracies. This was also supported by the analysis with the FTIR in
Figure 8. Furthermore, commercial NO
x sensors typically came with their own electronics for sensor operation and evaluation. Compared with commercial standards the evaluation presented here was carried out with simple methods, mainly focused on the material effects. It is likely that more detailed analysis could improve the sensor’s potential even further in future studies.


 ,
, 