
Unified Environment for Real Time Control of Hybrid Energy System Using Digital Twin and IoT Approach


Abstract
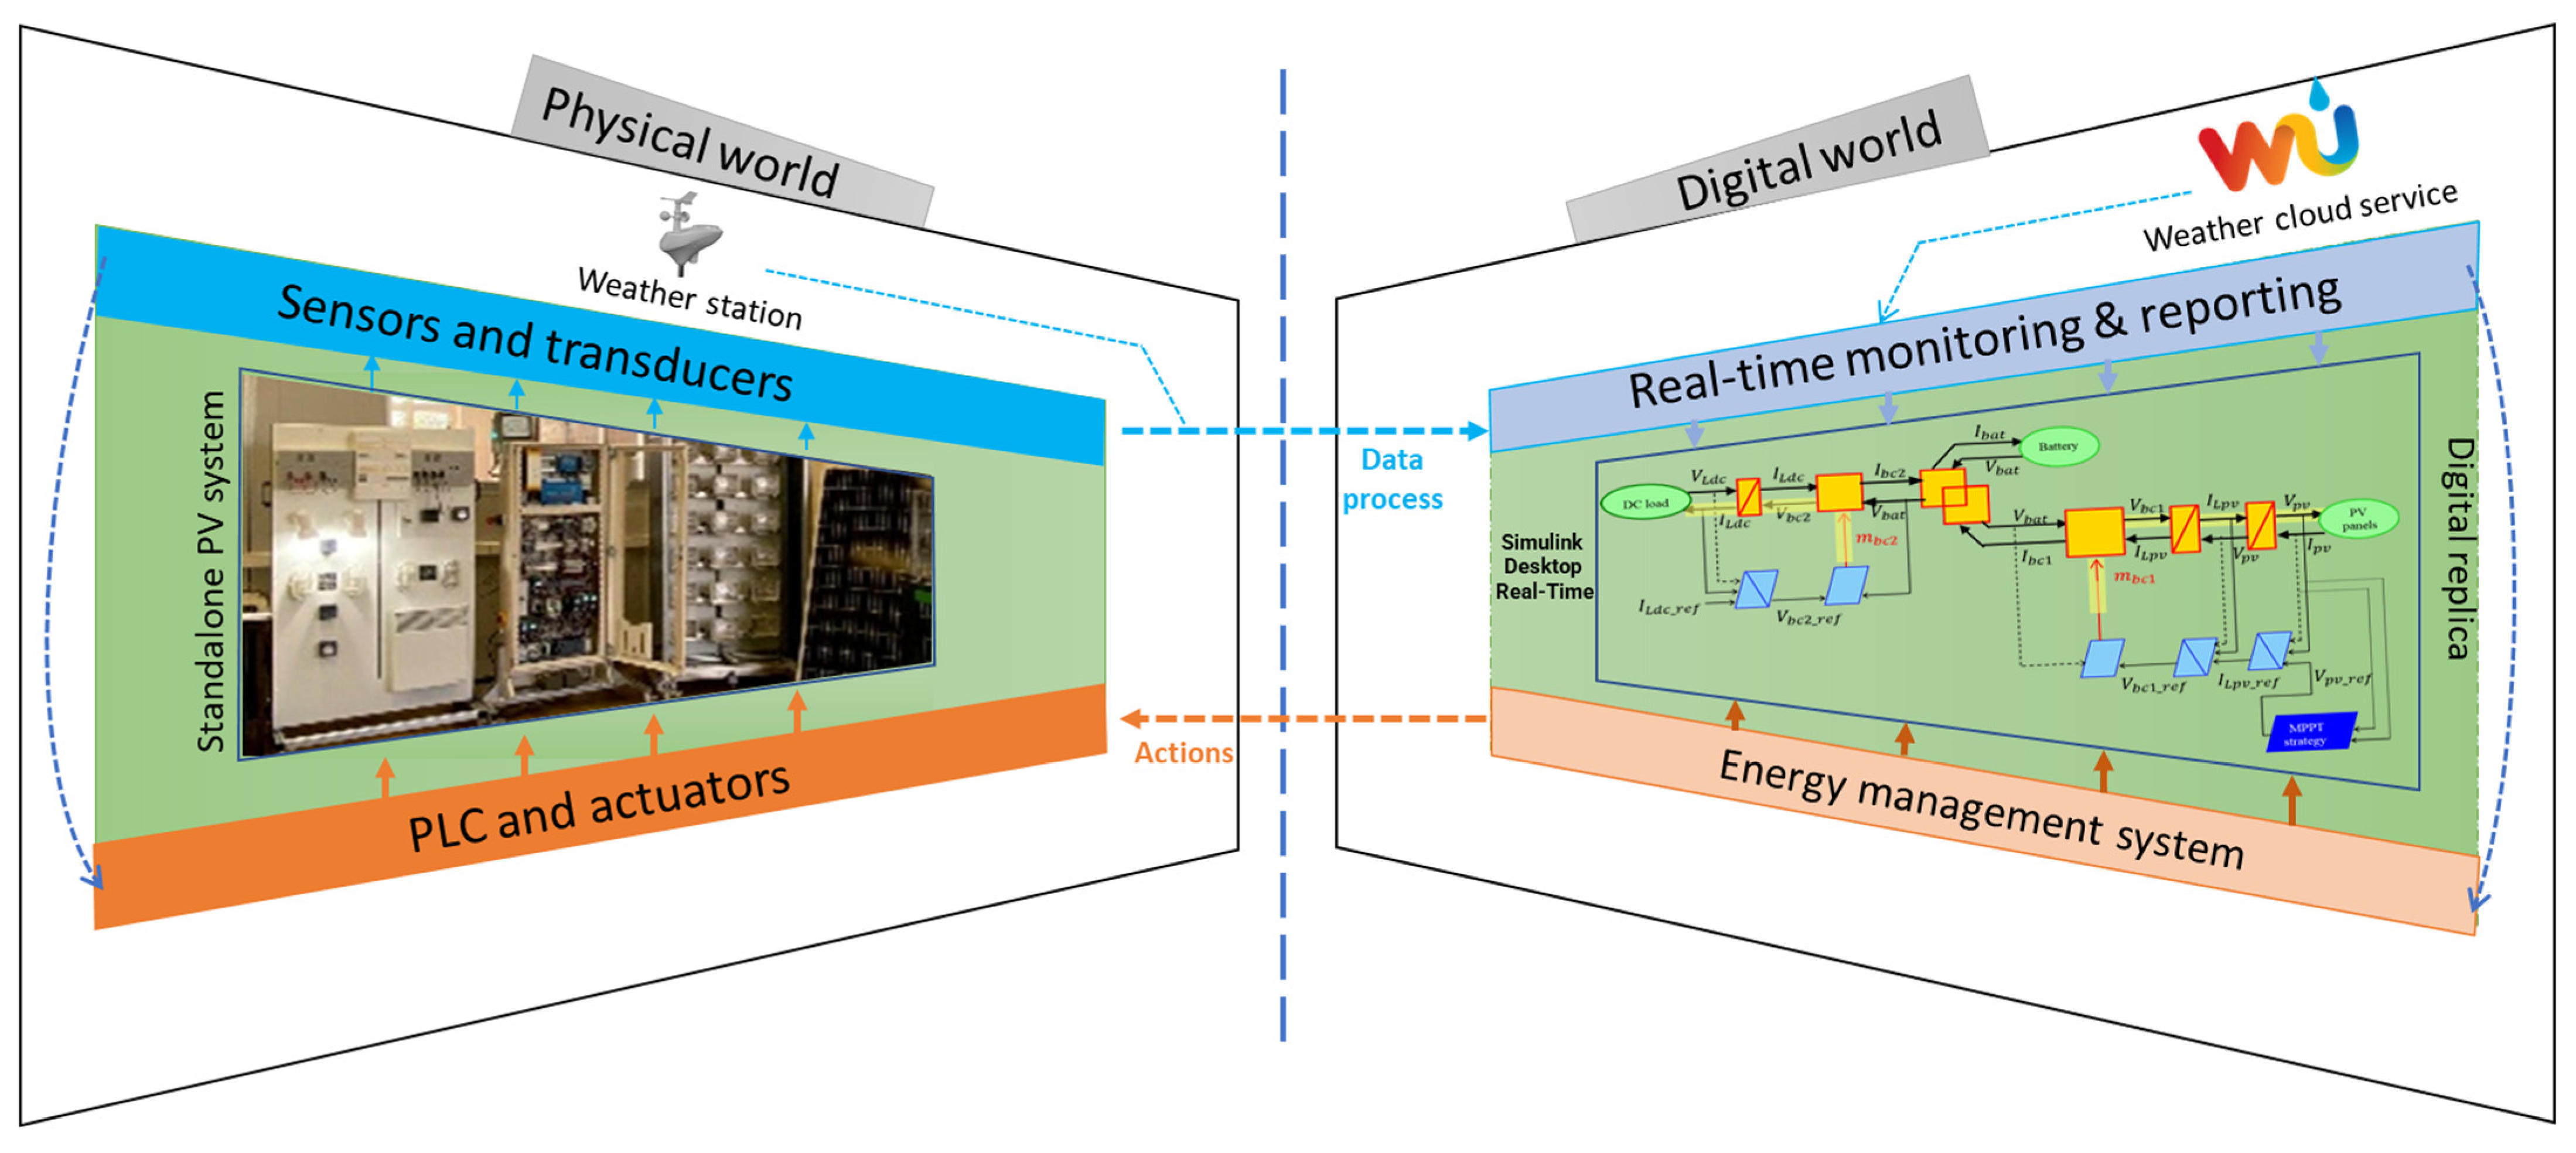
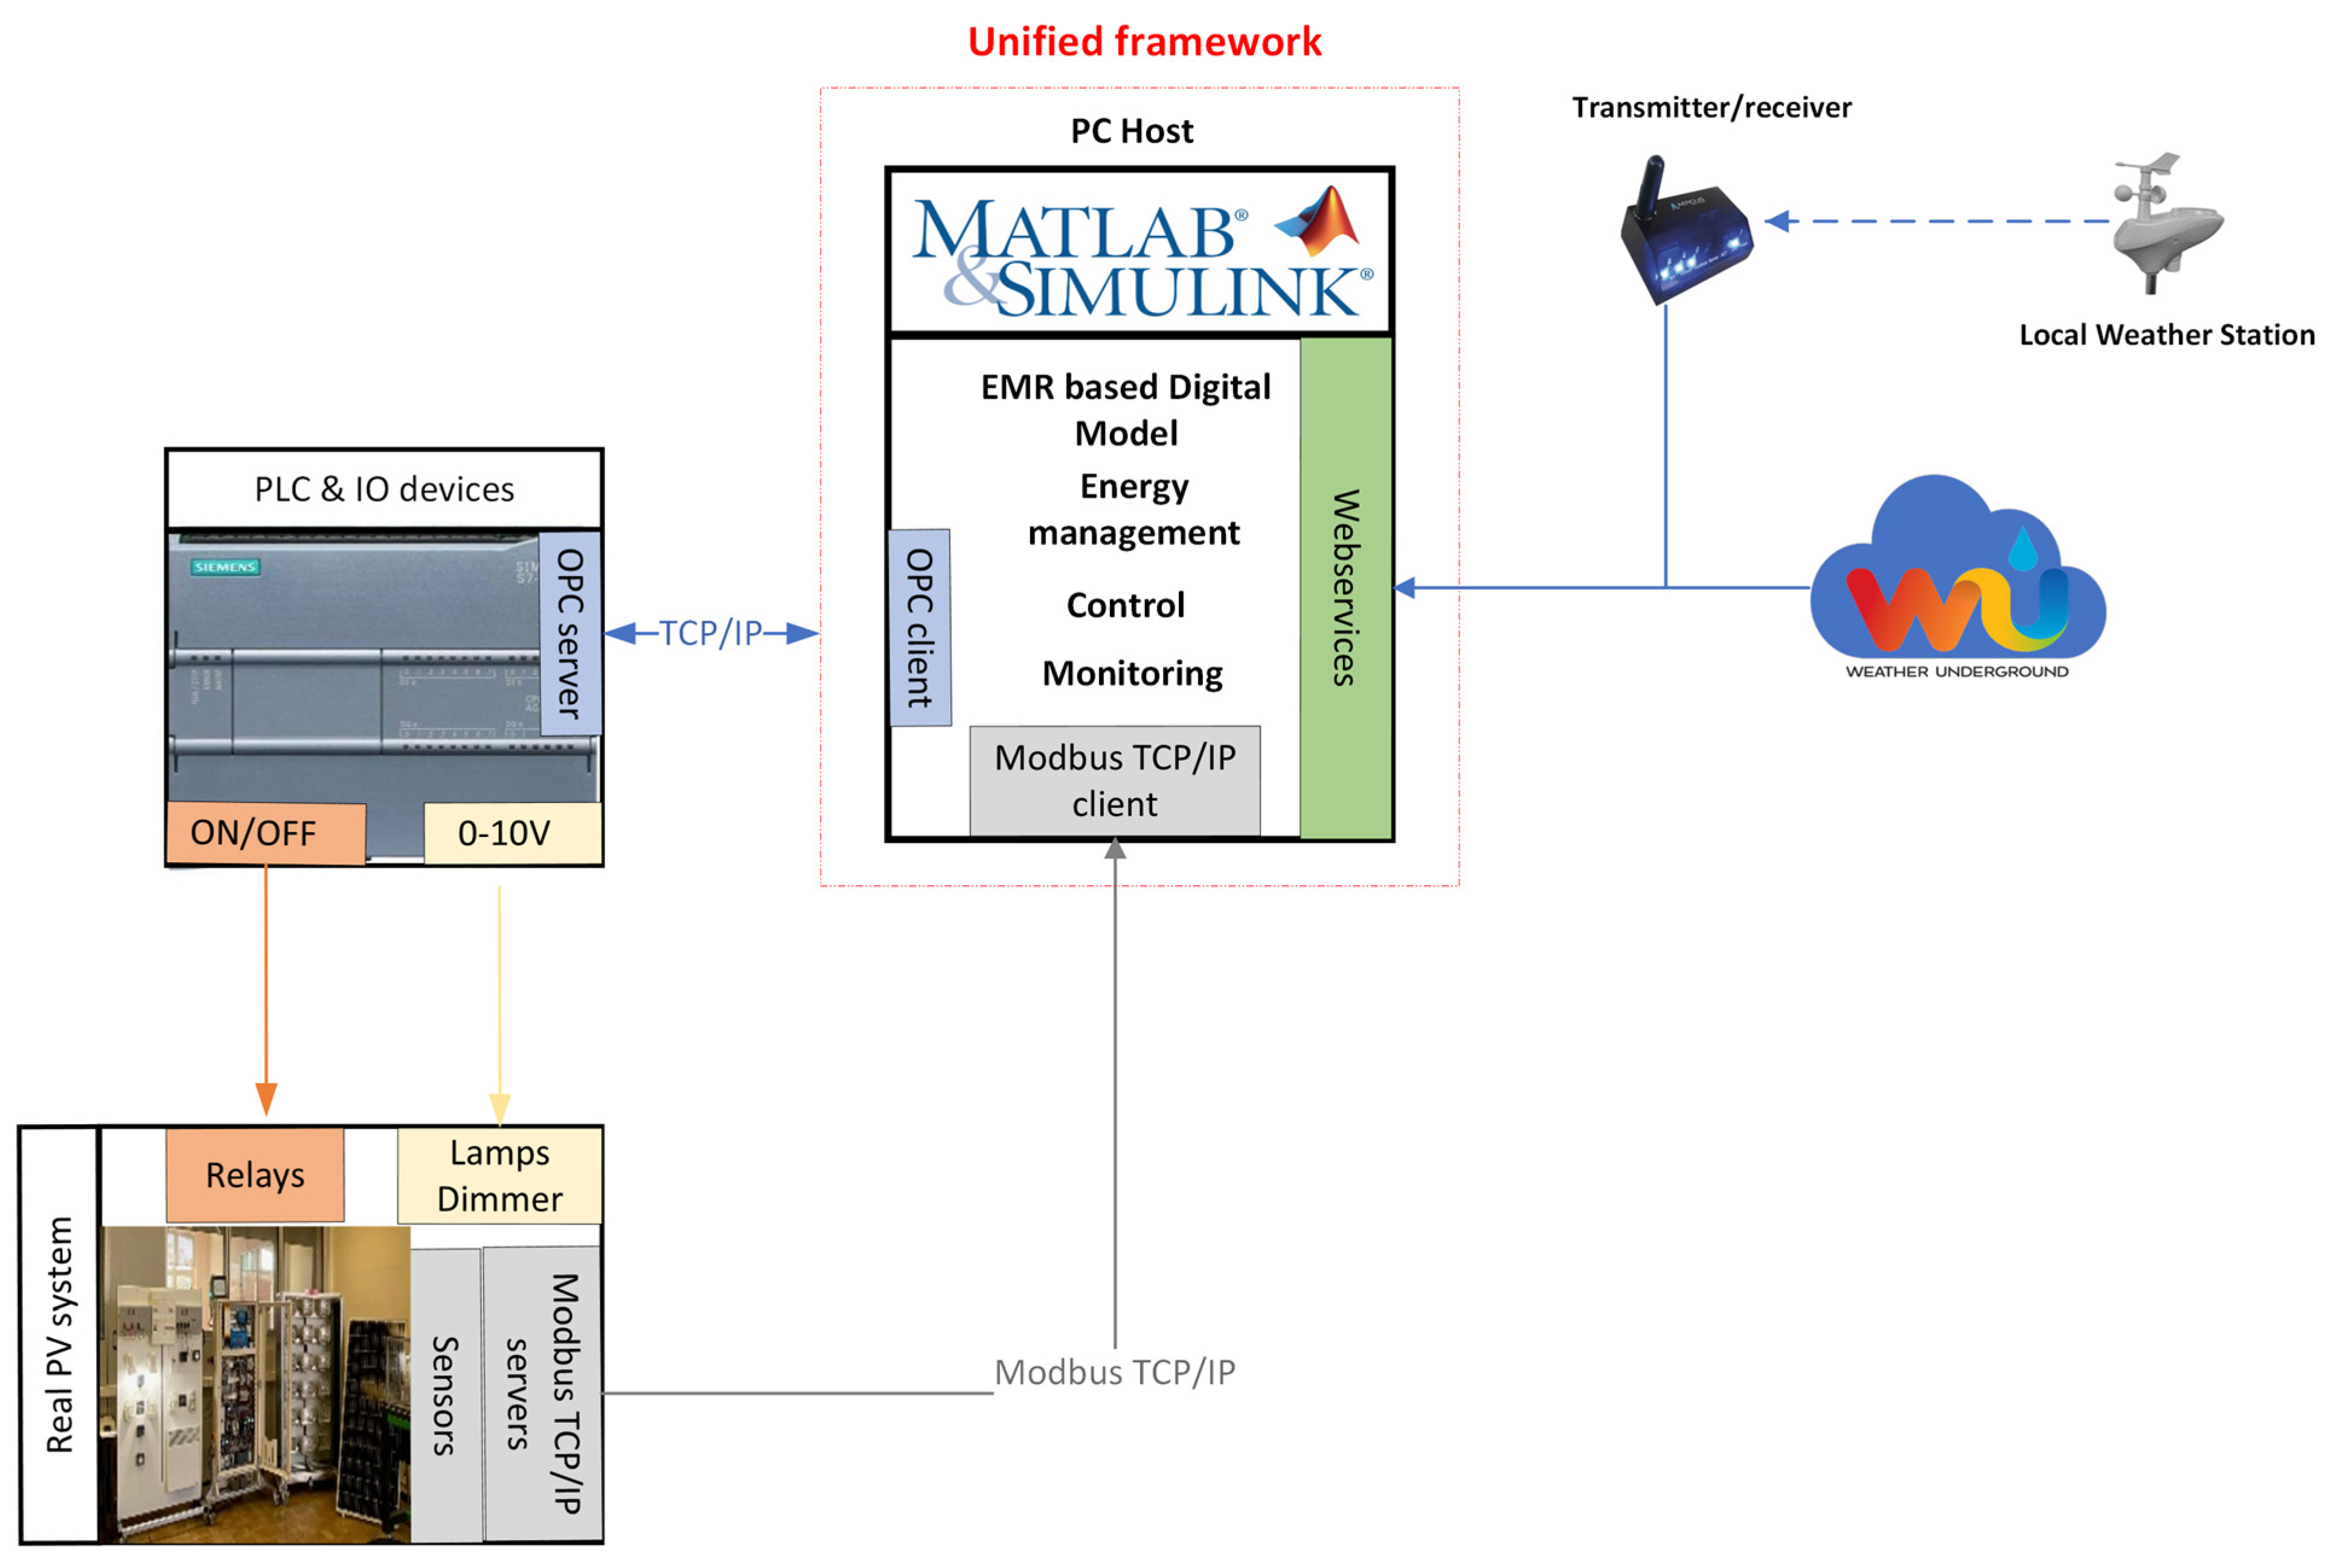
:1. Introduction
- -
- Physical system: made up of two PV panels, batteries, DC loads, a solar emulator, and a weather station.
- -
- Smart sensors and actuators: including devices required for control and monitoring purposes.
- -
- Digital counterpart implemented in MATLAB: including mainly EMR-based model, Real-Time monitoring, and control systems.
2. Literature Review
- -
- Real-time access to multi-protocol data for monitoring purposes.
- -
- Modelling, simulation, and real-time control of PV systems
- -
- Implementing of innovative energy management systems
- -
- Reporting
3. Materials and Methods
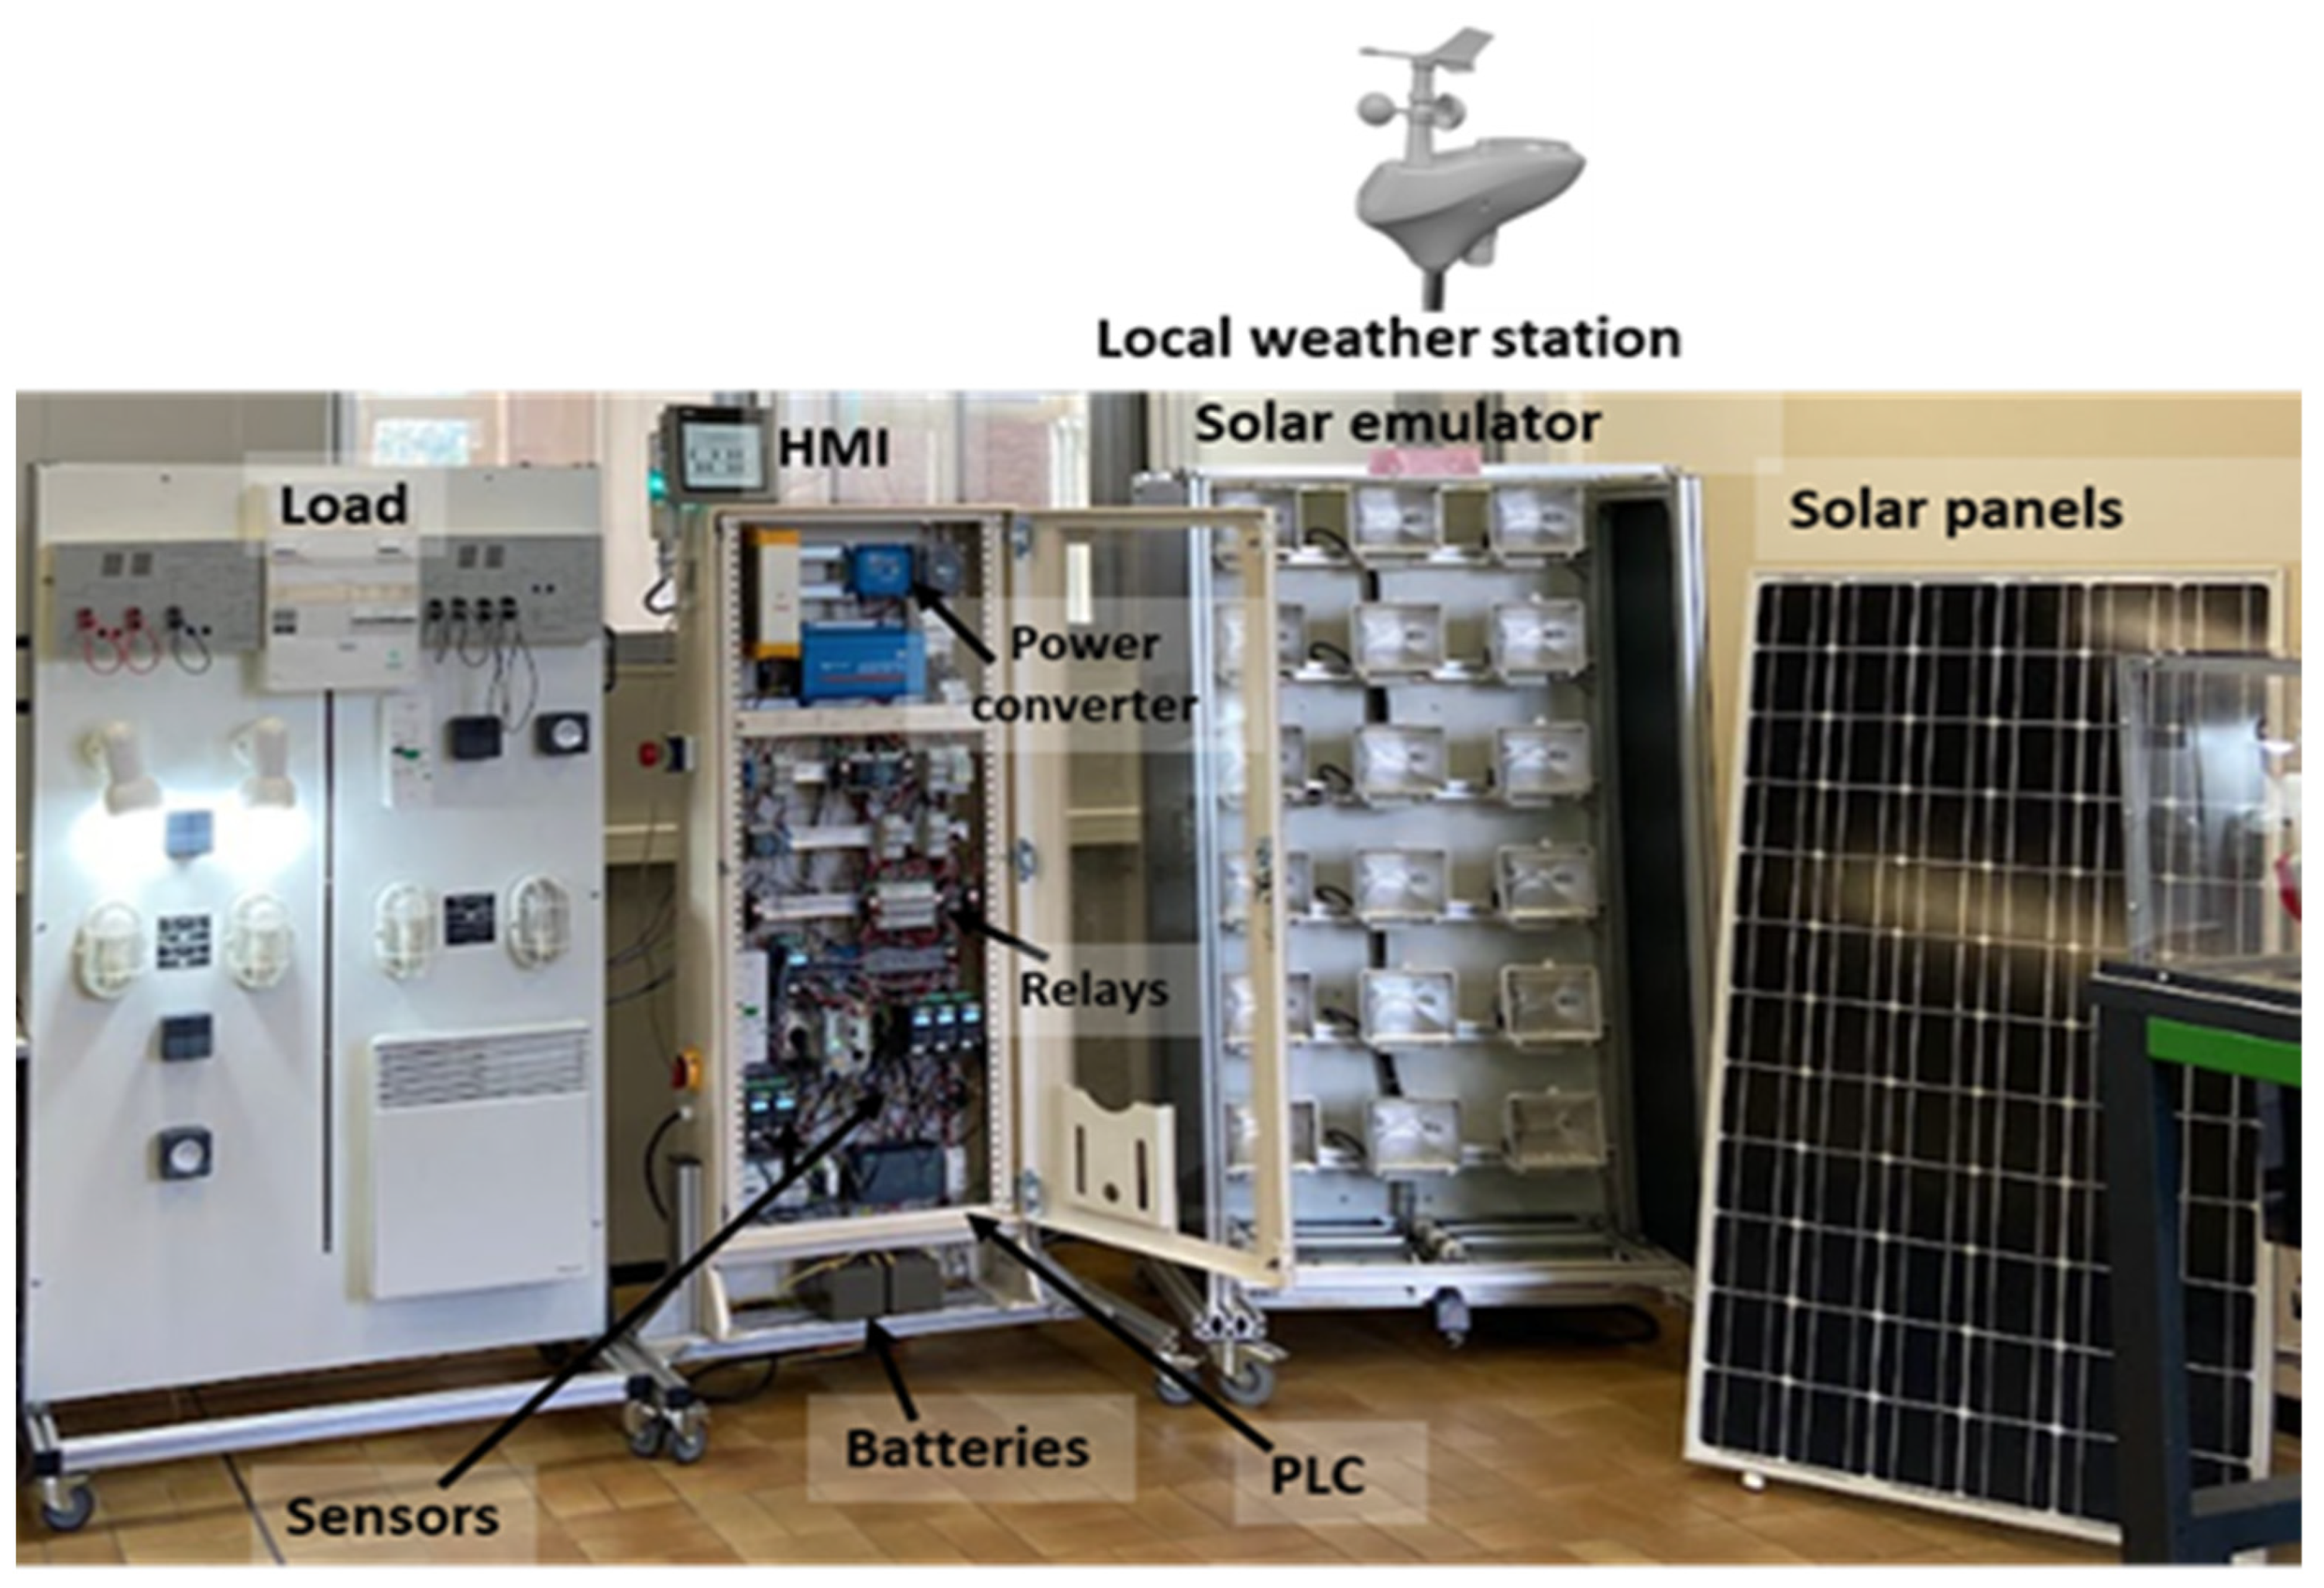
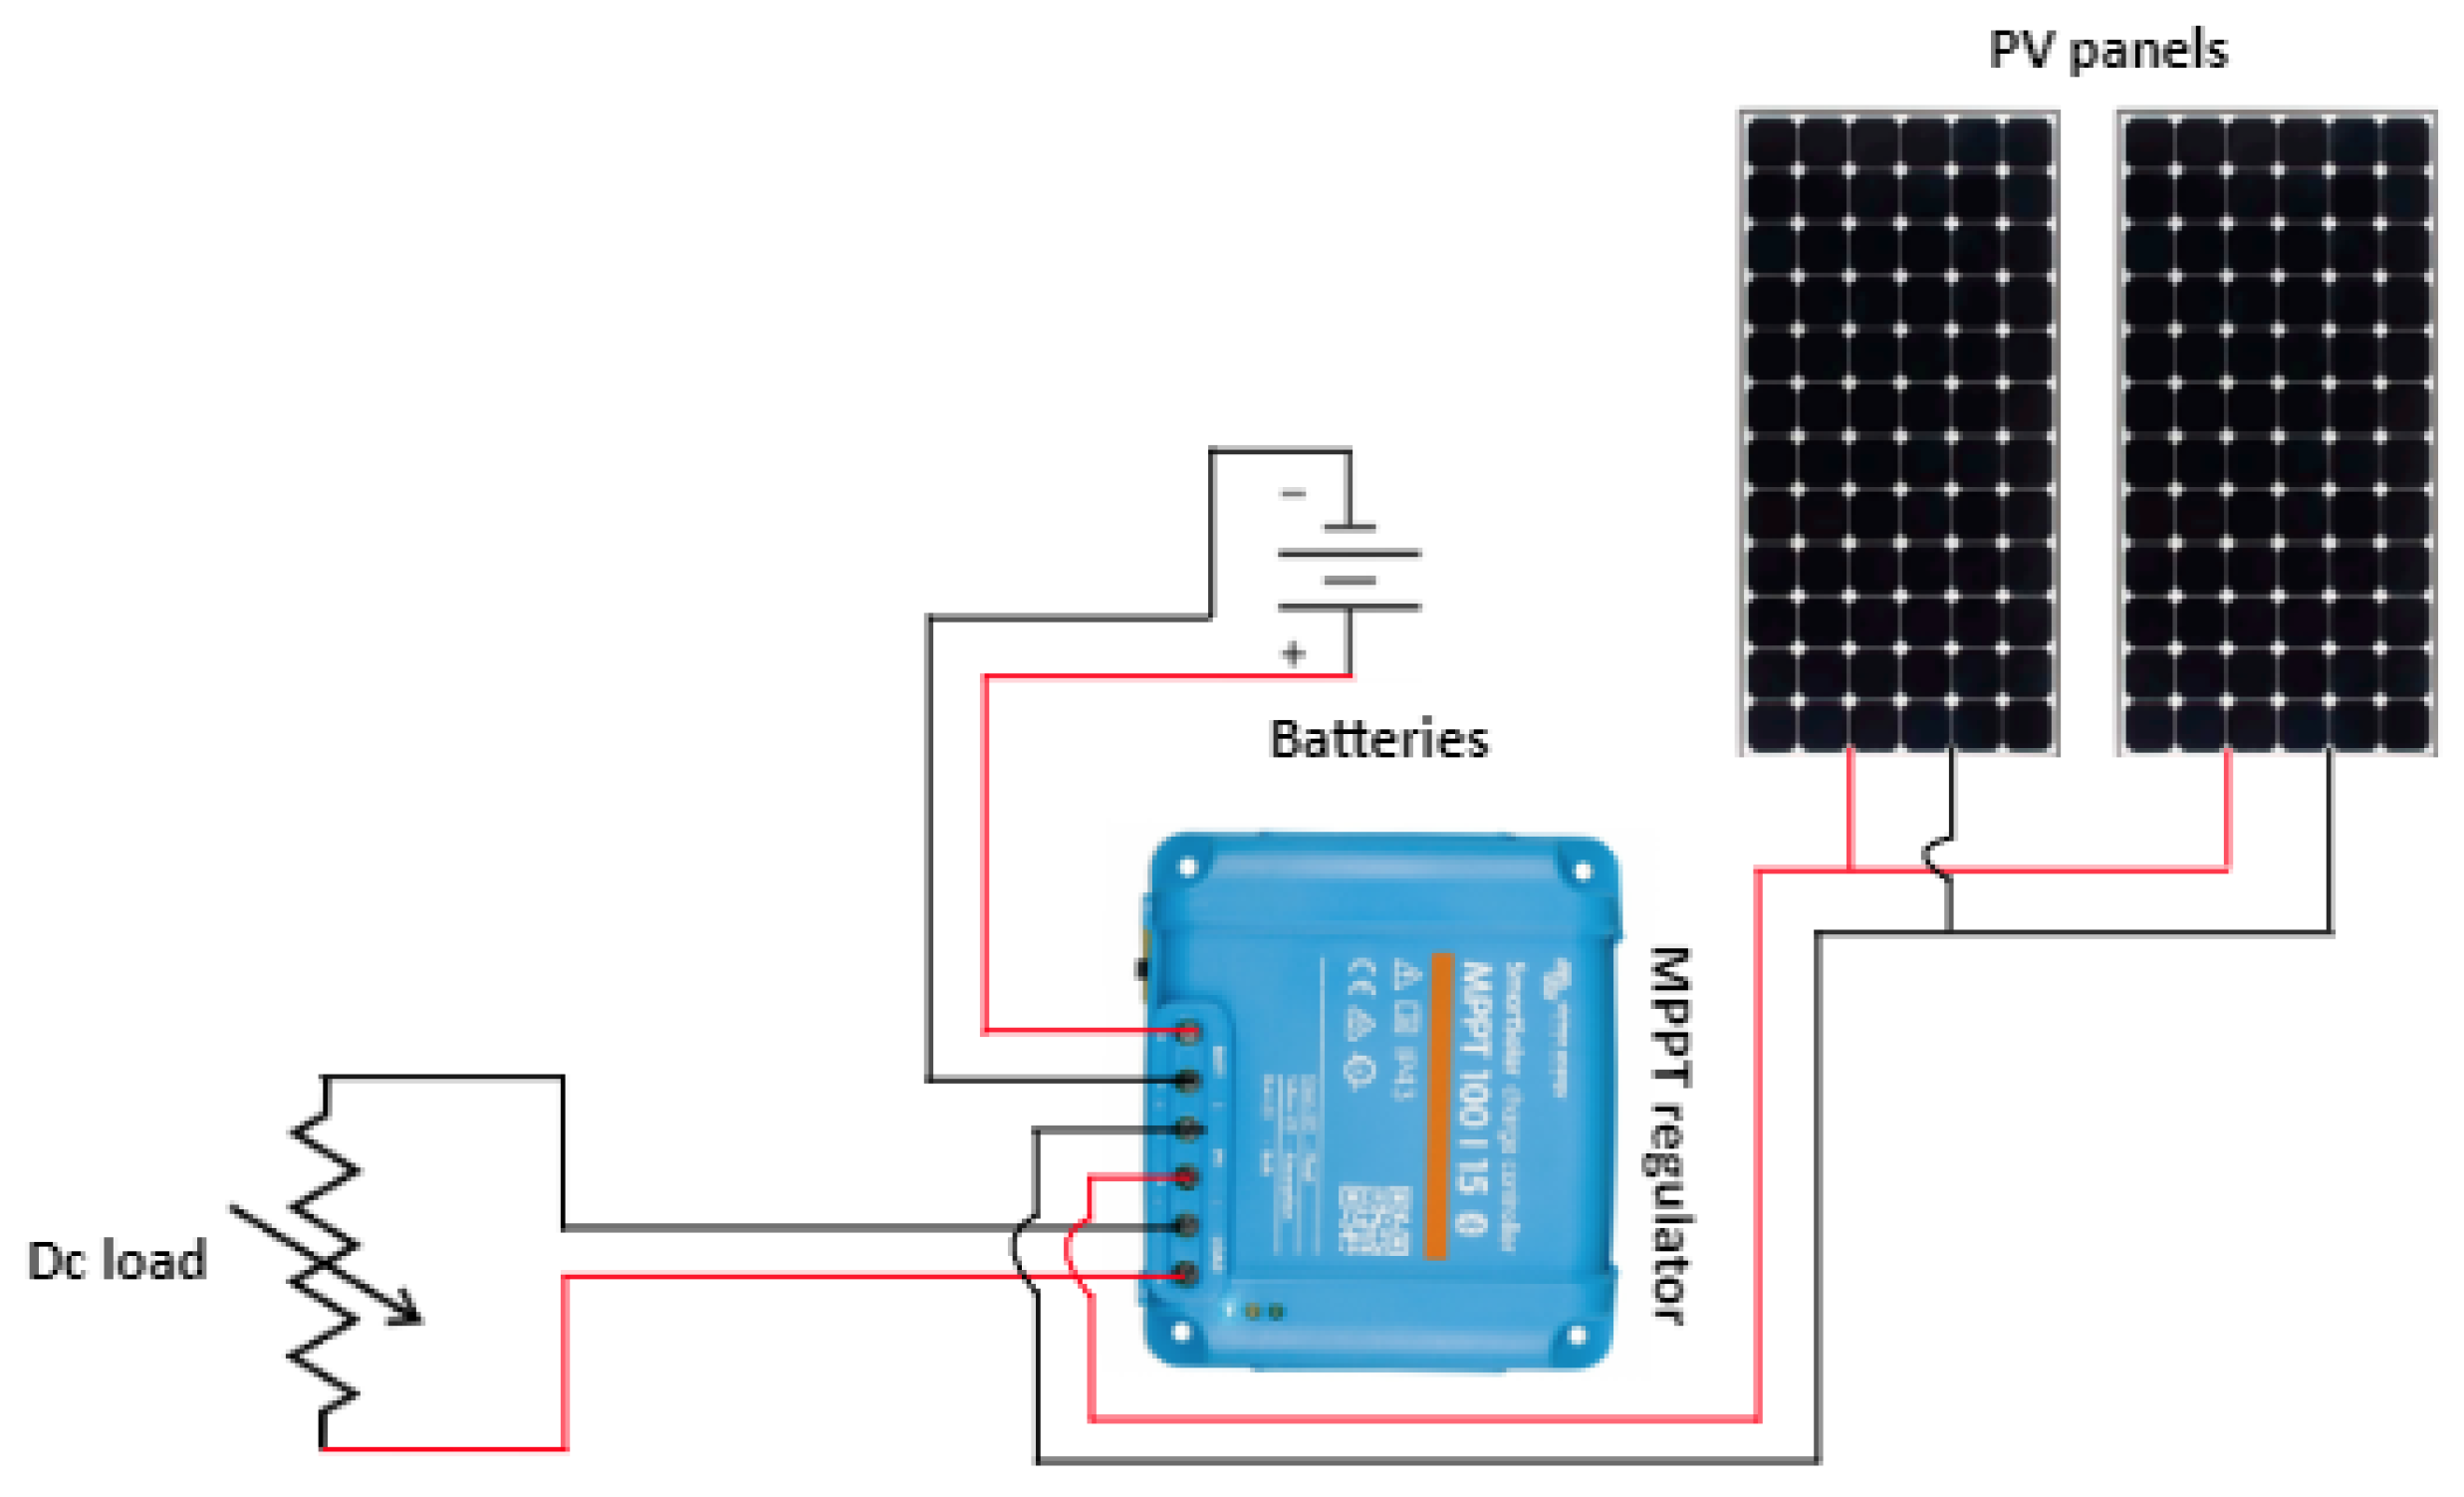
3.1. PV System Description
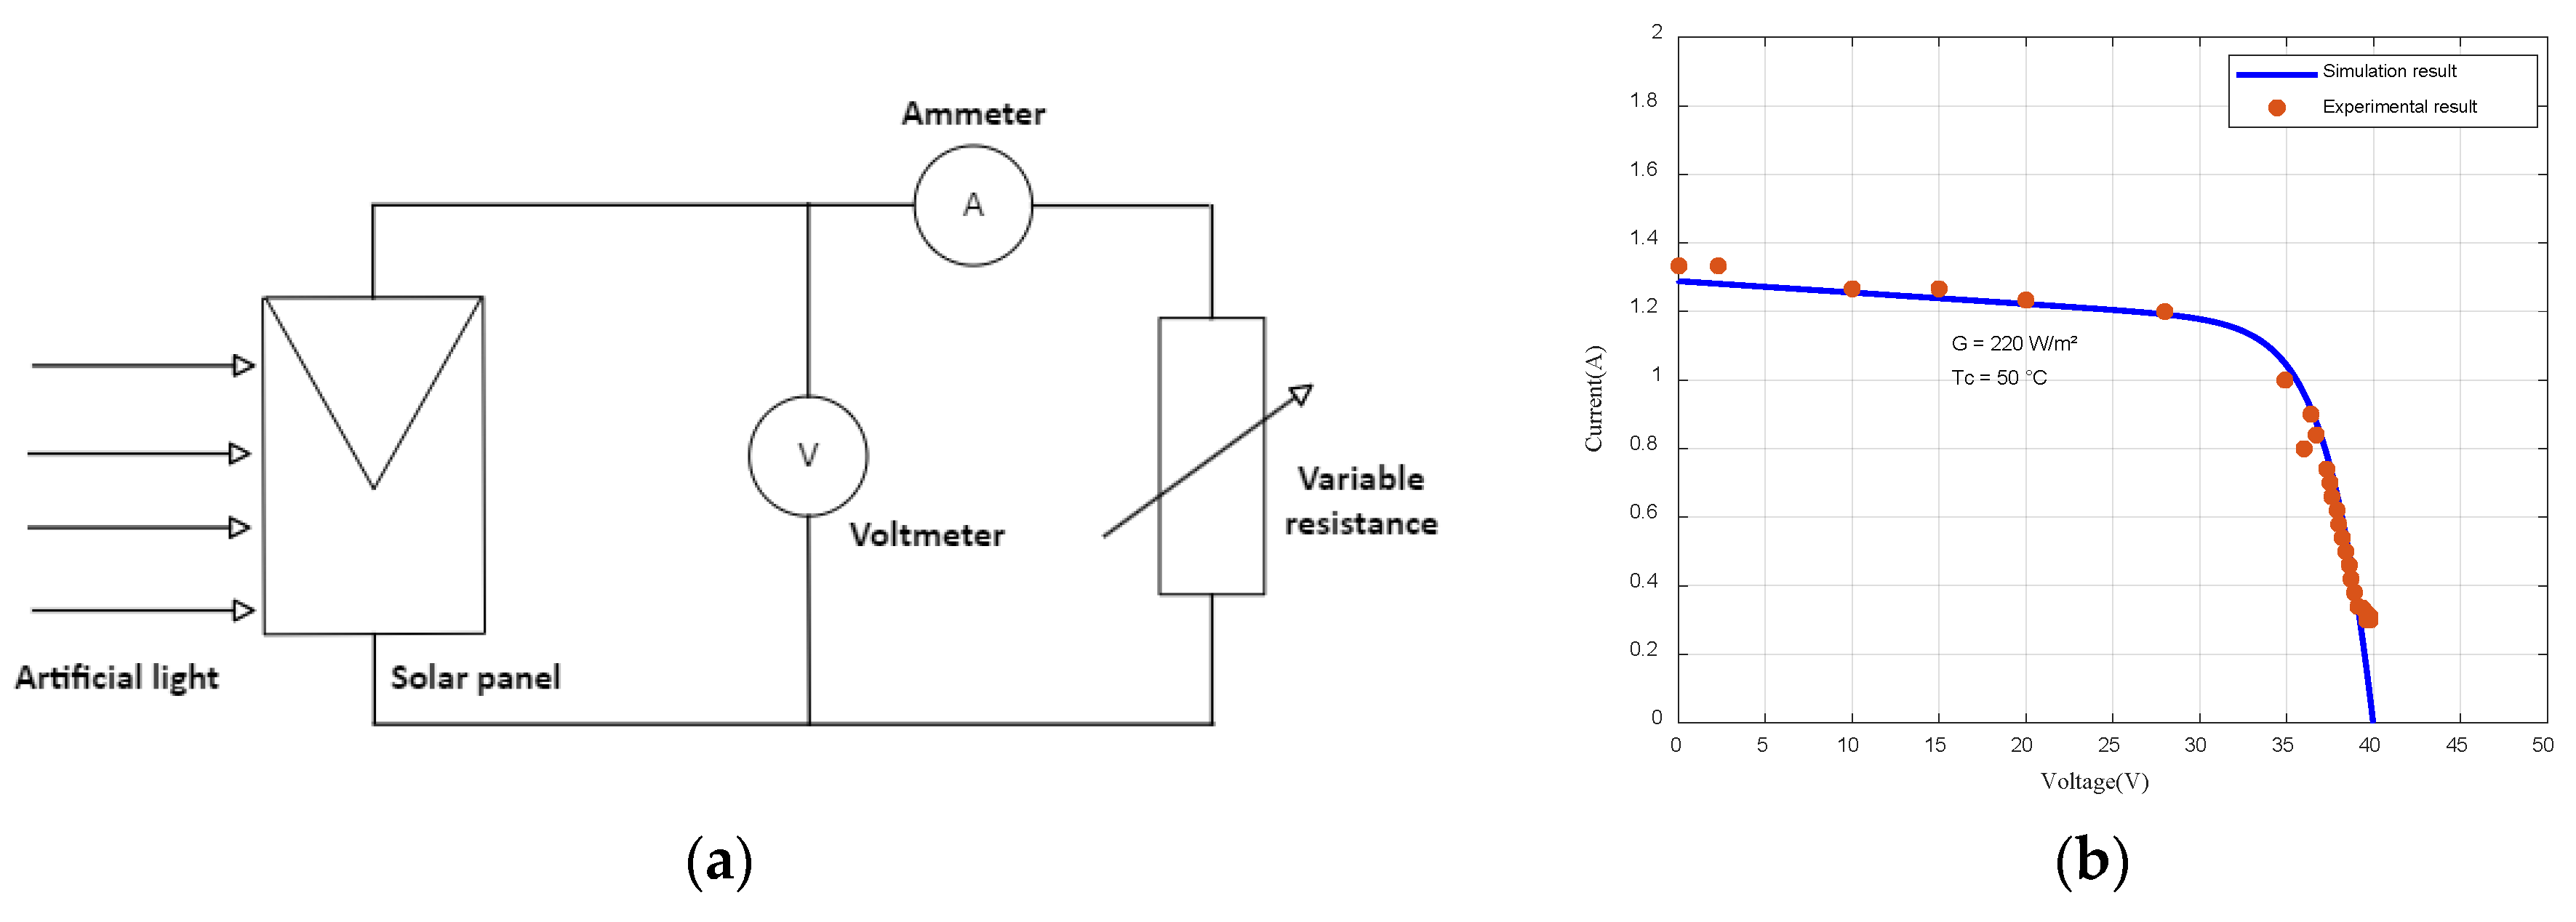
- Solar emulator as artificial light source,
- 2 × 215 Wp photovoltaic panels (SunPower Co., San José, CA, USA),
- 28 Ah batteries as storage system (Victron Energy B.V., Almere, The Netherlands),
- DC loads.
- Power converters (Victron Energy B.V., Almere, The Netherlands).
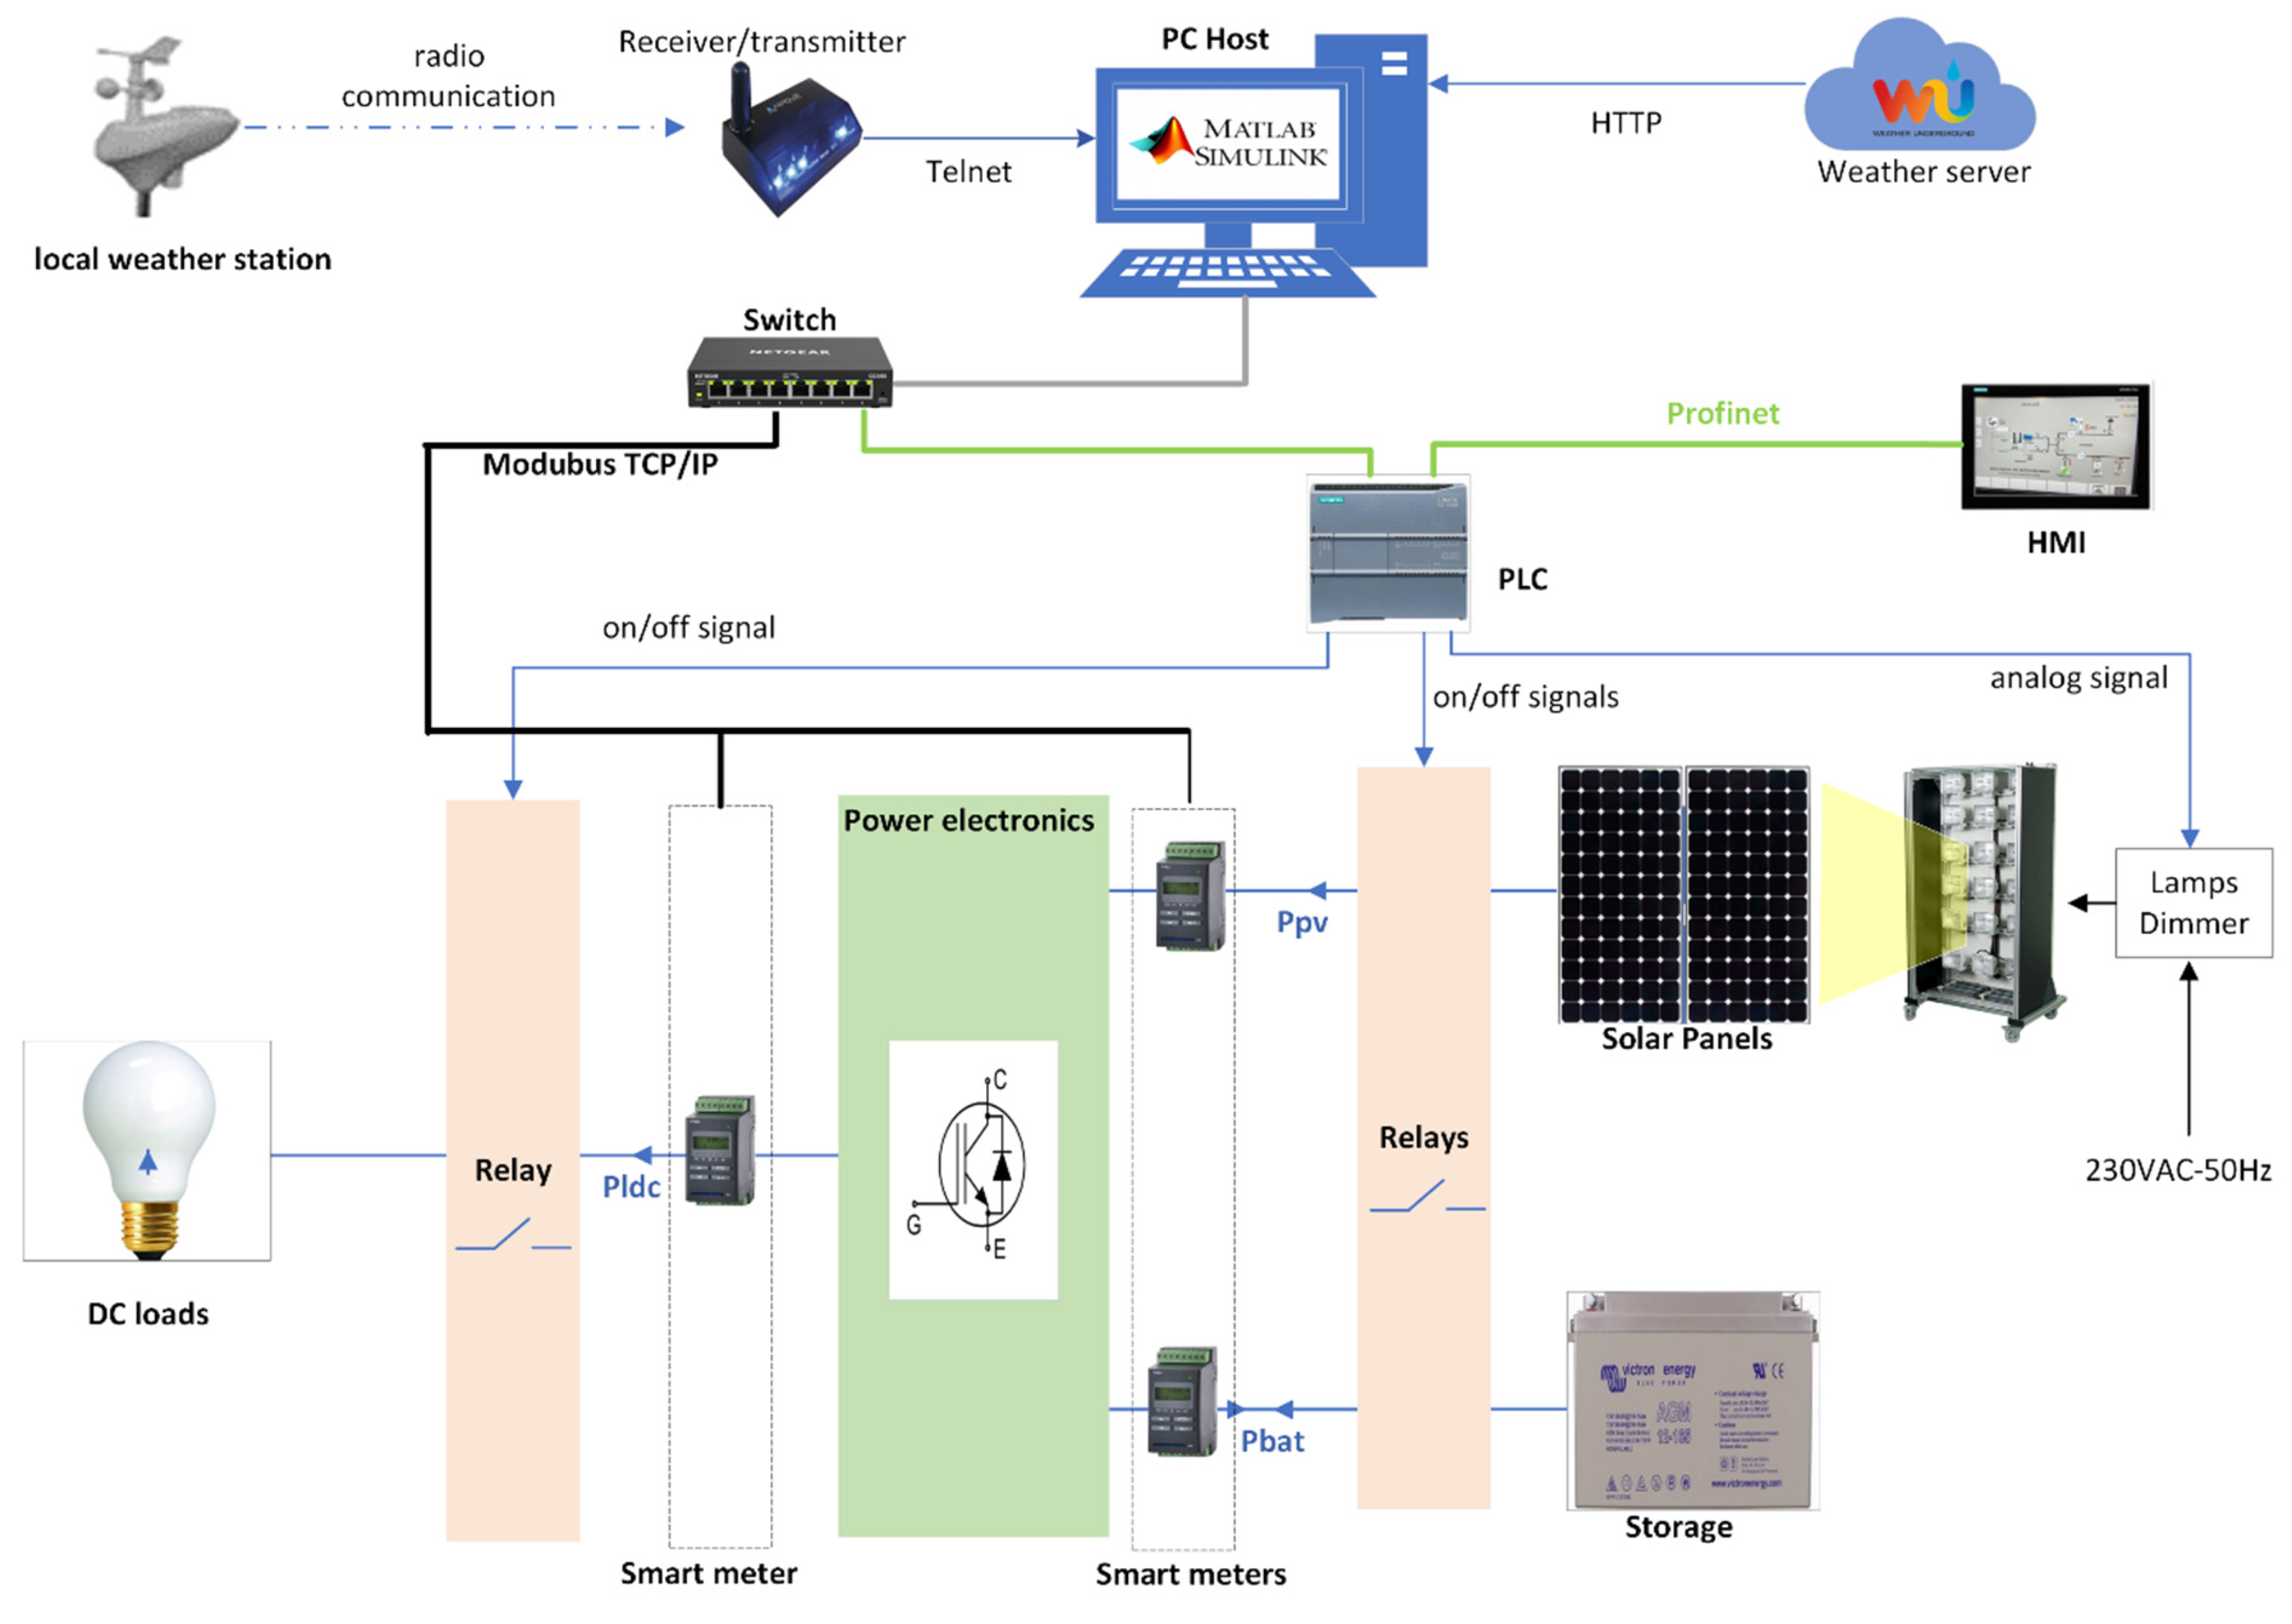
3.2. Sensors and Data Aquisition
- -
- Weather data (temperature, irradiance, wind speed…);
- -
- Real time electrical data (energy, currents, voltages, batteries’ state of charge…).
- -
- -
- MATLAB Simulink, as an integrated environment concentrating all the operational data of the system, constitutes the core of the digital twin.
3.3. Control System
4. PV System Modeling
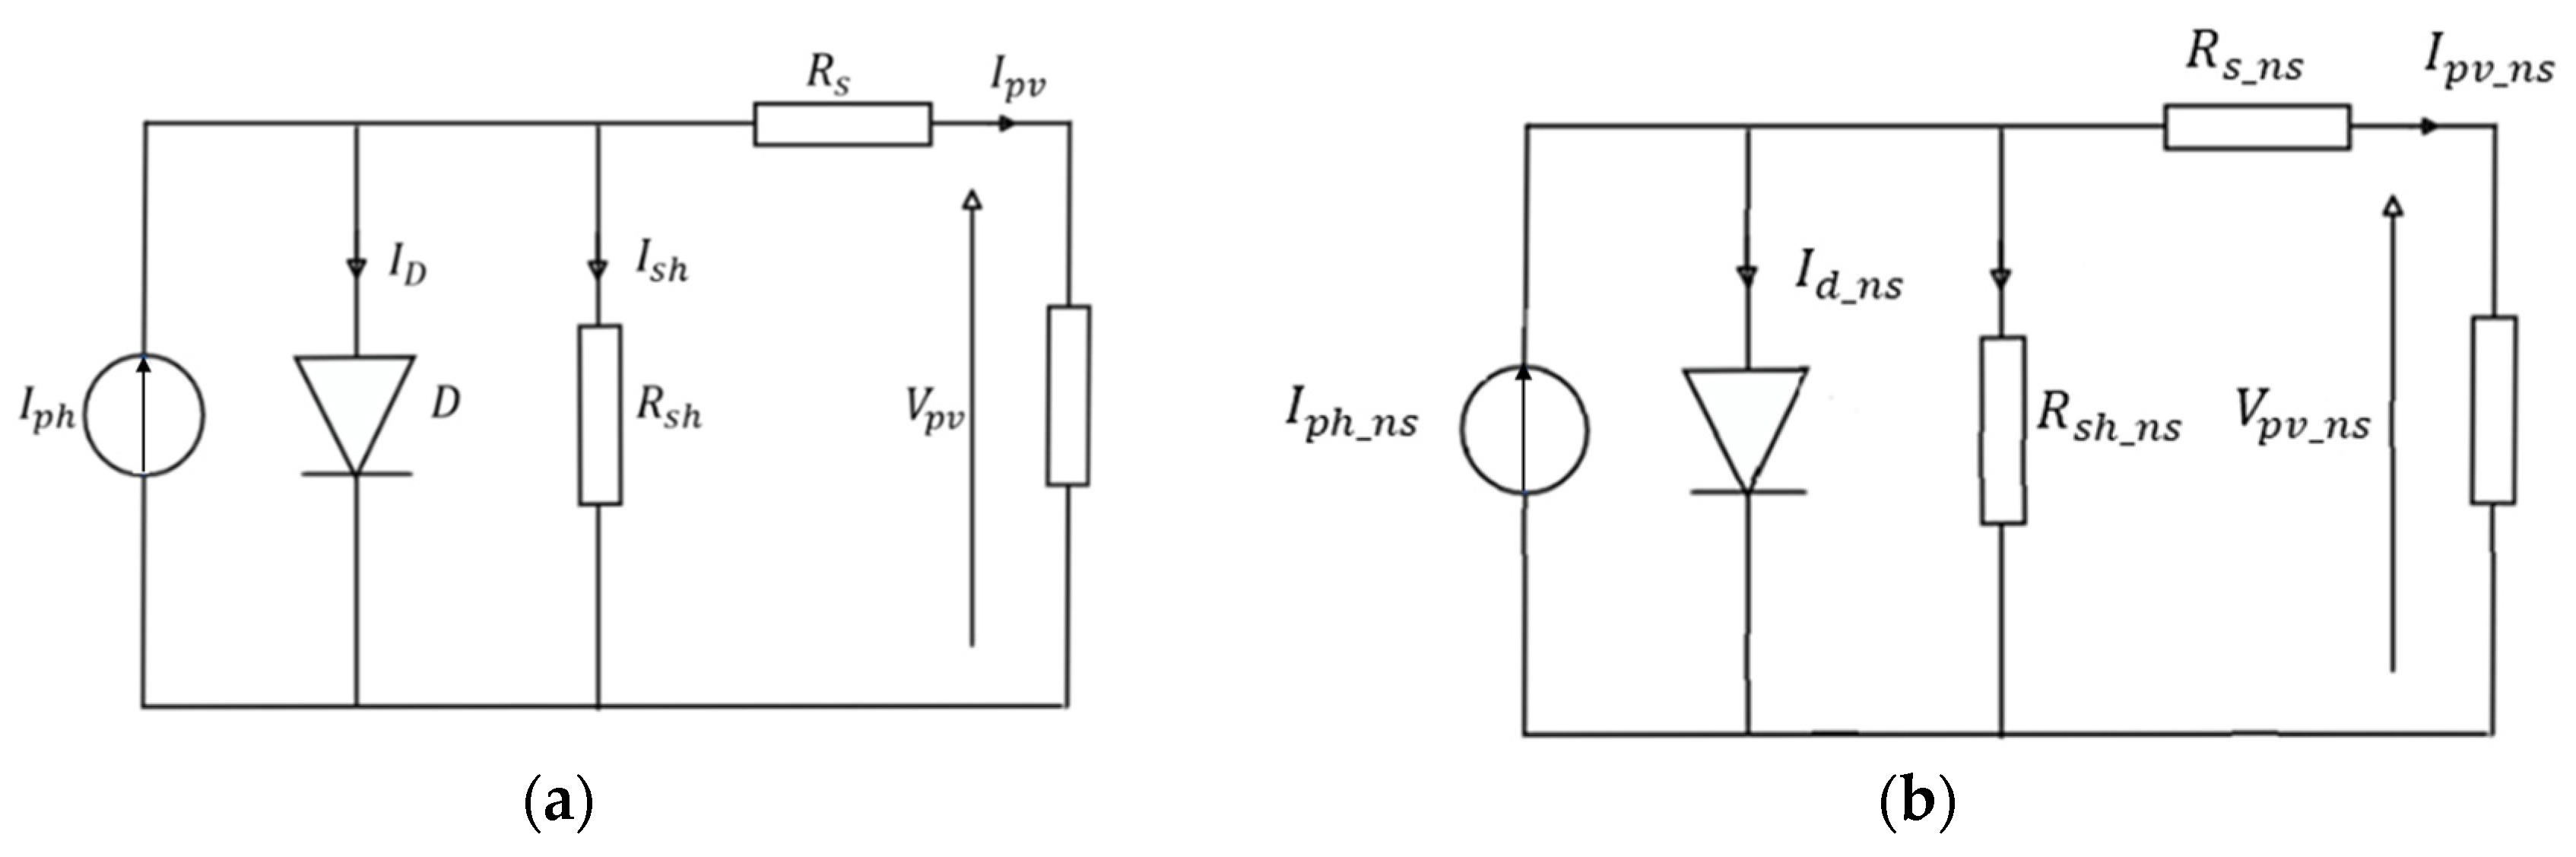
4.1. Solar Panels
- -
- is the current generated by solar panel;
- -
- is the photocurrent, which is linearly proportional to irradiance and depends on the temperature as shown in the following equation:
- ○
- where (), is the incident of irradiation on the solar panel, and (1000 W/m²) at standard conditions (STC);
- -
- is the diode current:
- ○
- where: is the PV cell reverse saturation current that mainly depends on the temperature, q is the electronic charge of an electron ( C), T is the temperature of the PV cell, k is Boltzmann’s constant ( J/K), and A is the diode ideality factor.
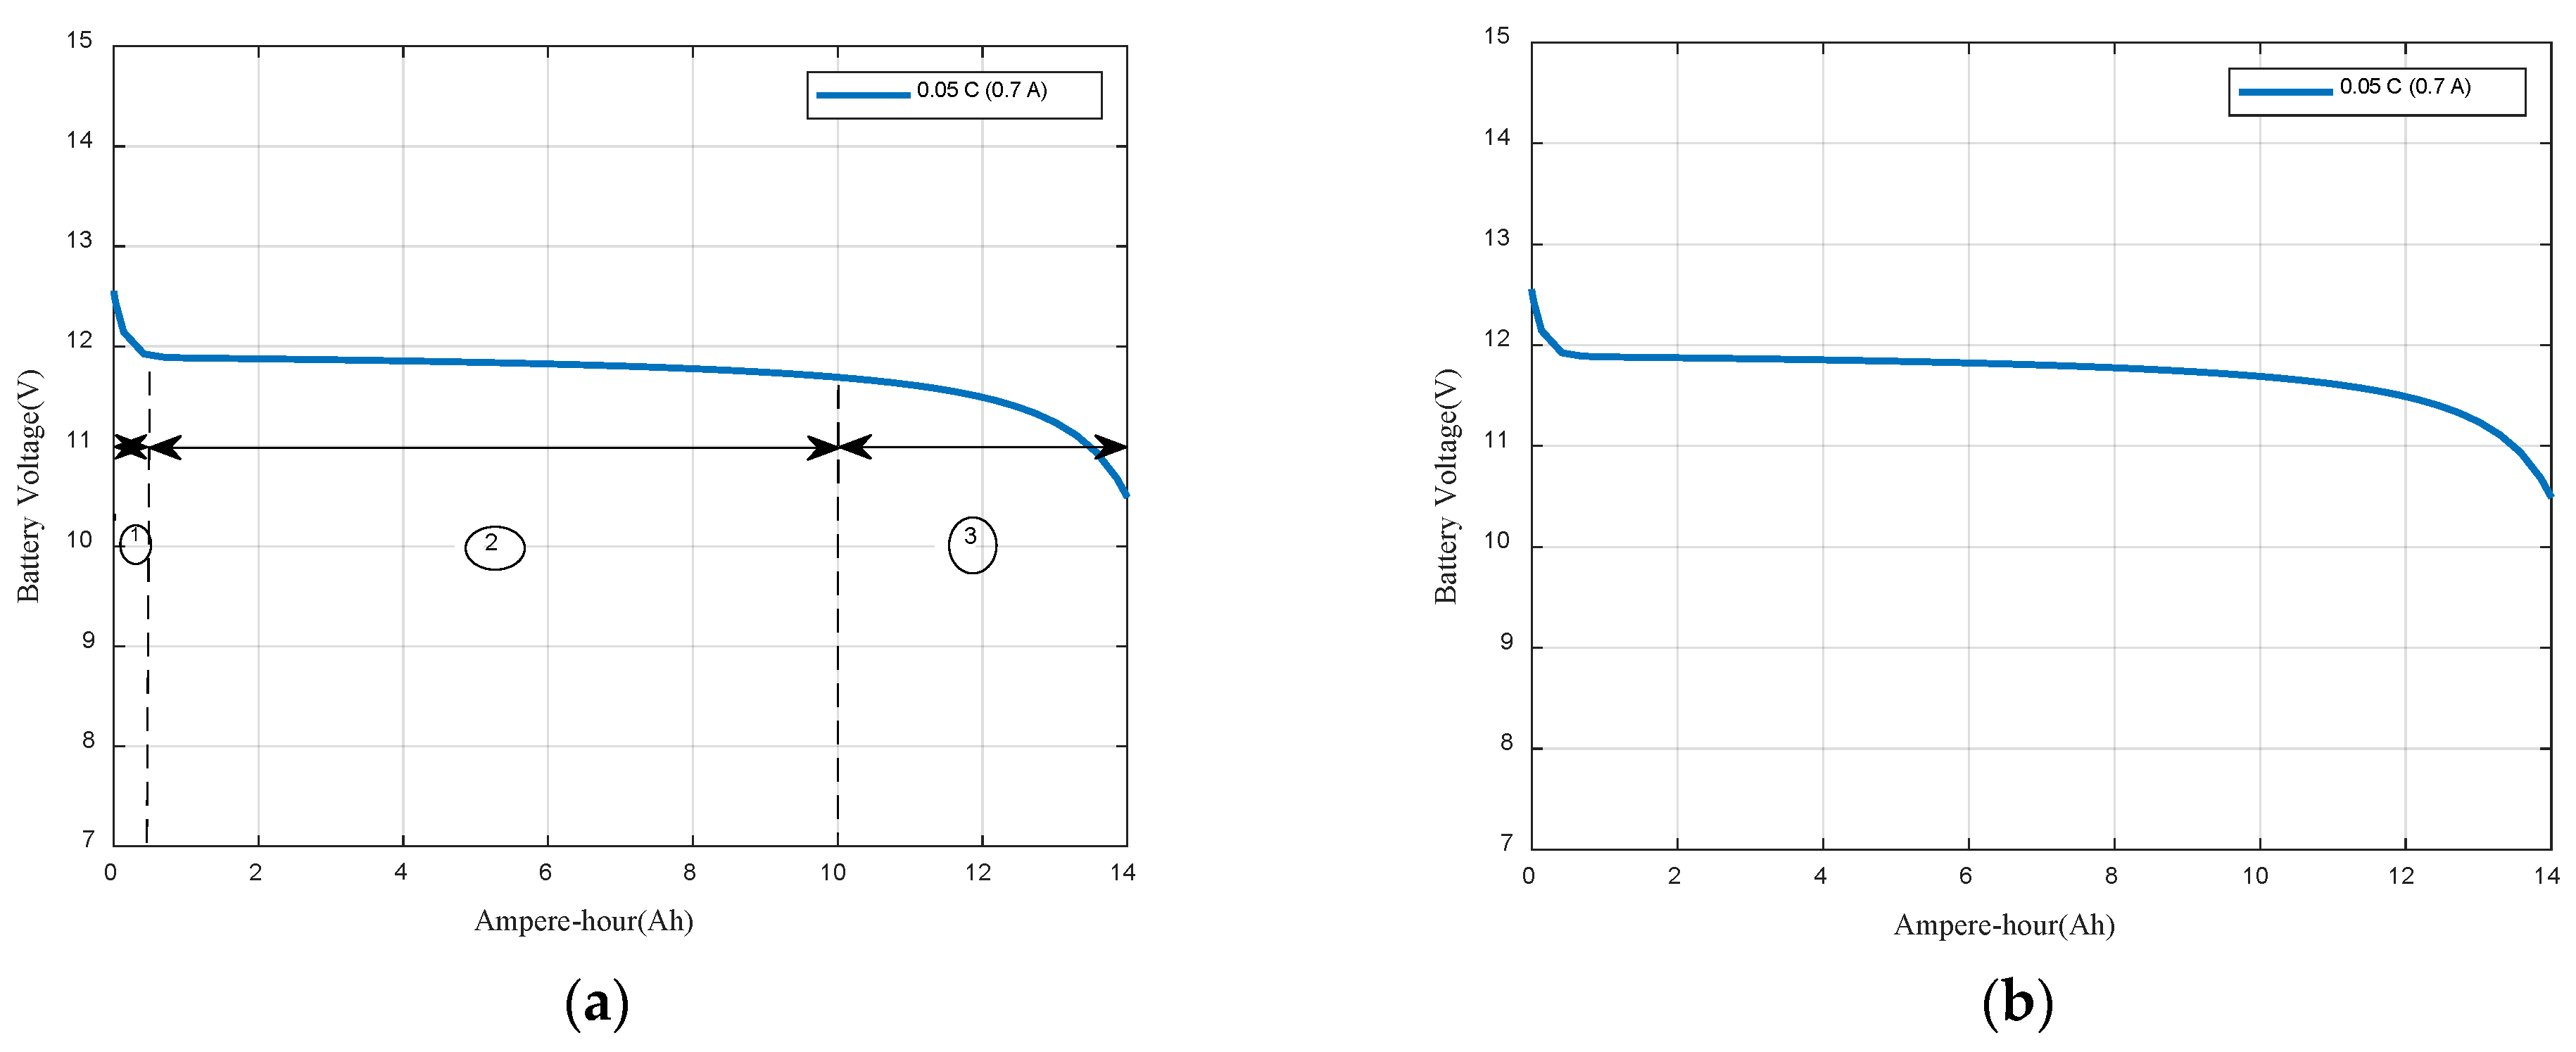
4.2. Batteries Bank
- : is the internal resistance;
- : is the battery current.
- Fully charged voltage;
- : polarization voltage (V);
- battery capacity (Ah);
- : exponential zone amplitude (V);
- : exponential zone time constant inverse (Ah).
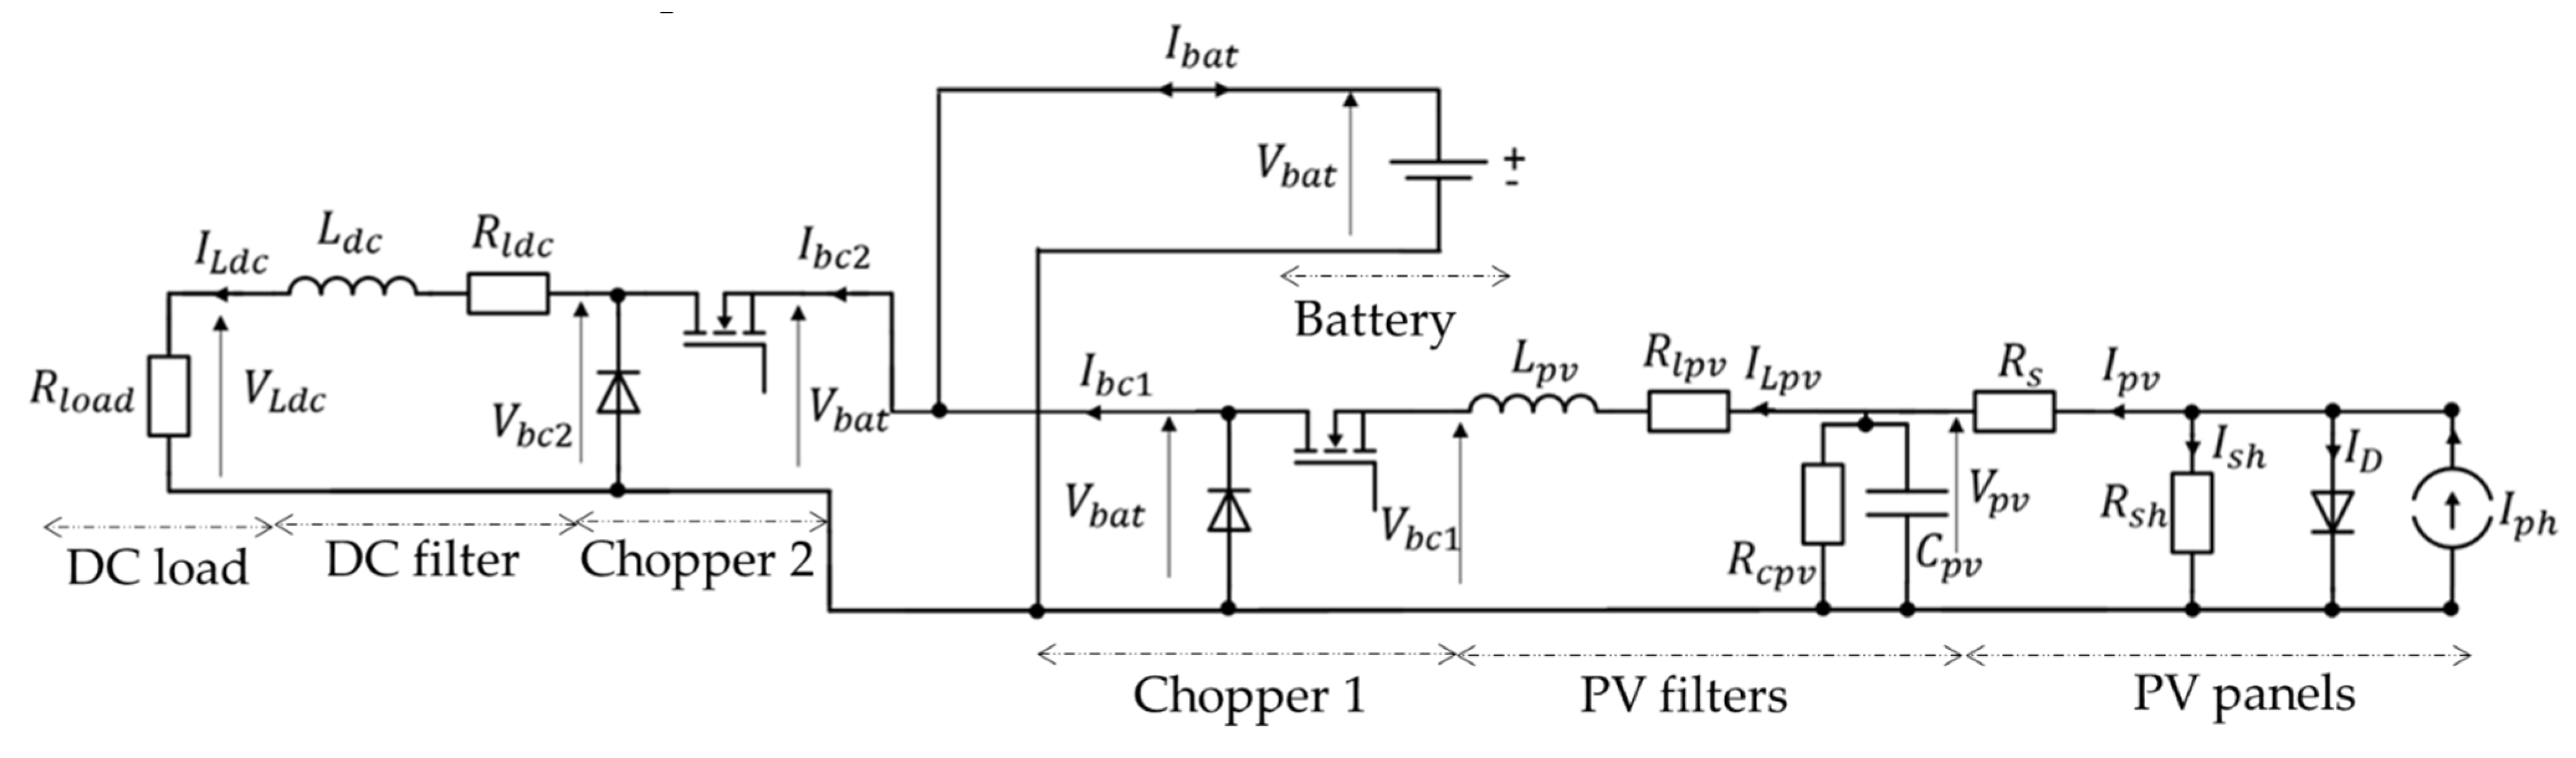
4.3. Power Electronics
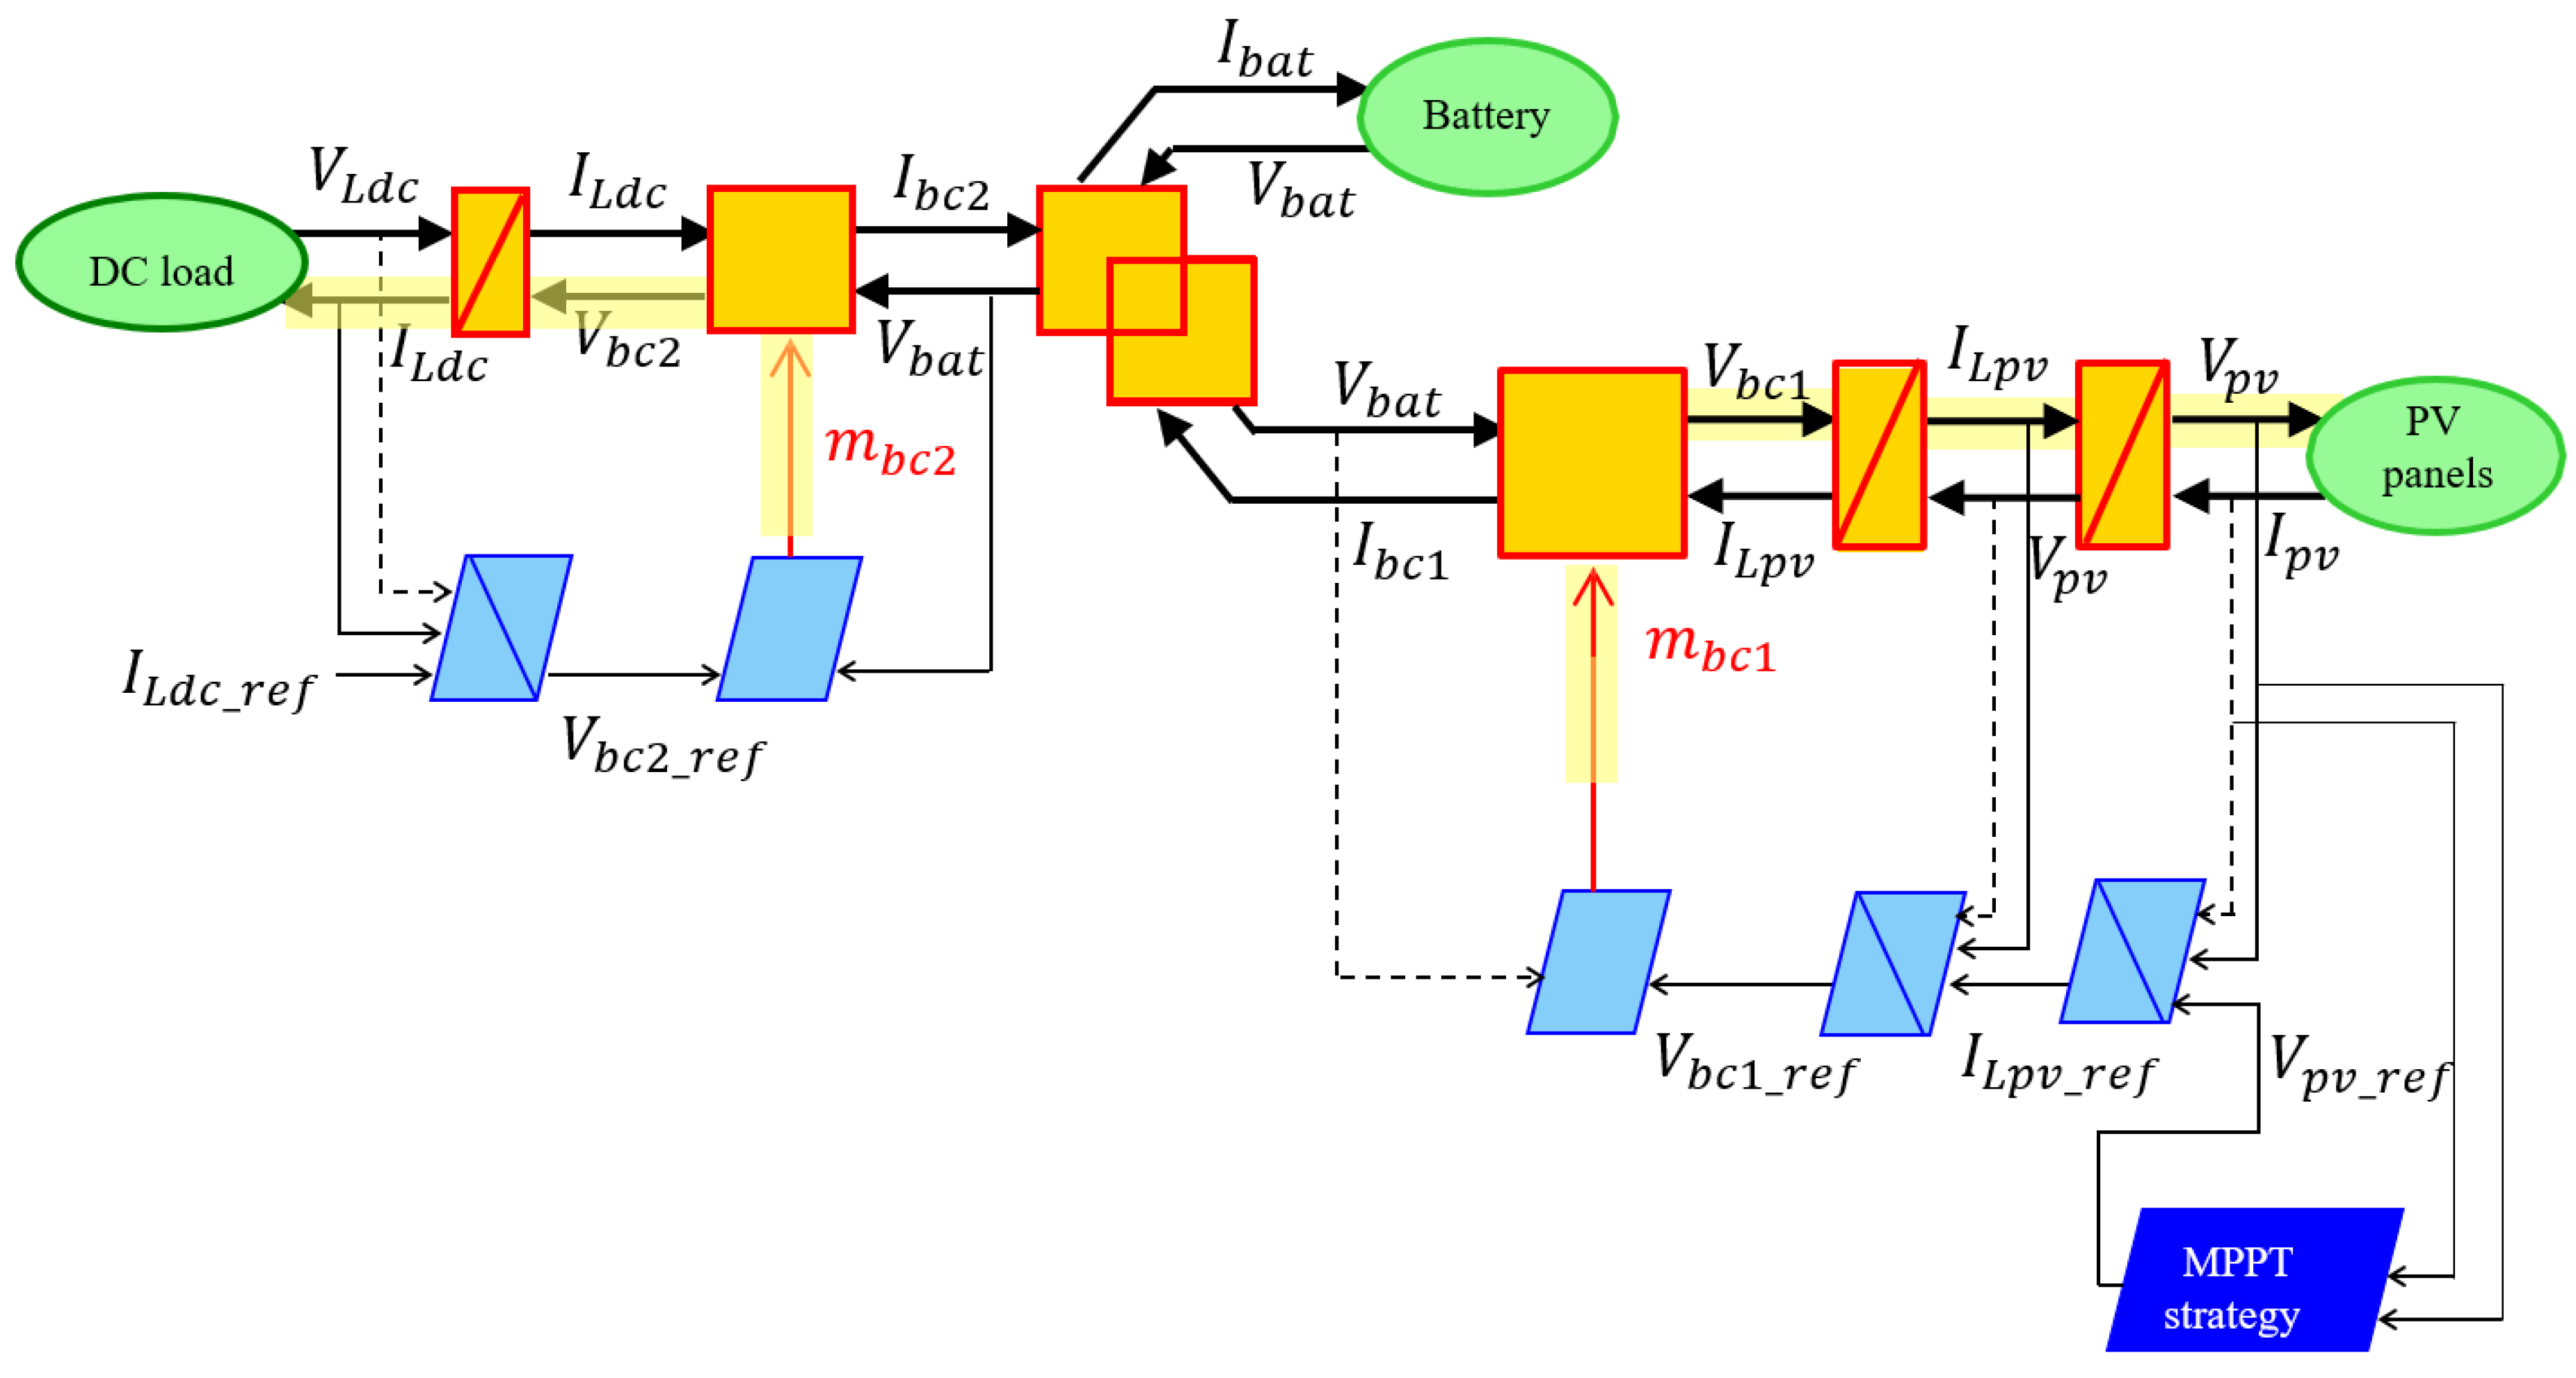
4.4. EMR Representation of the Digital Replica
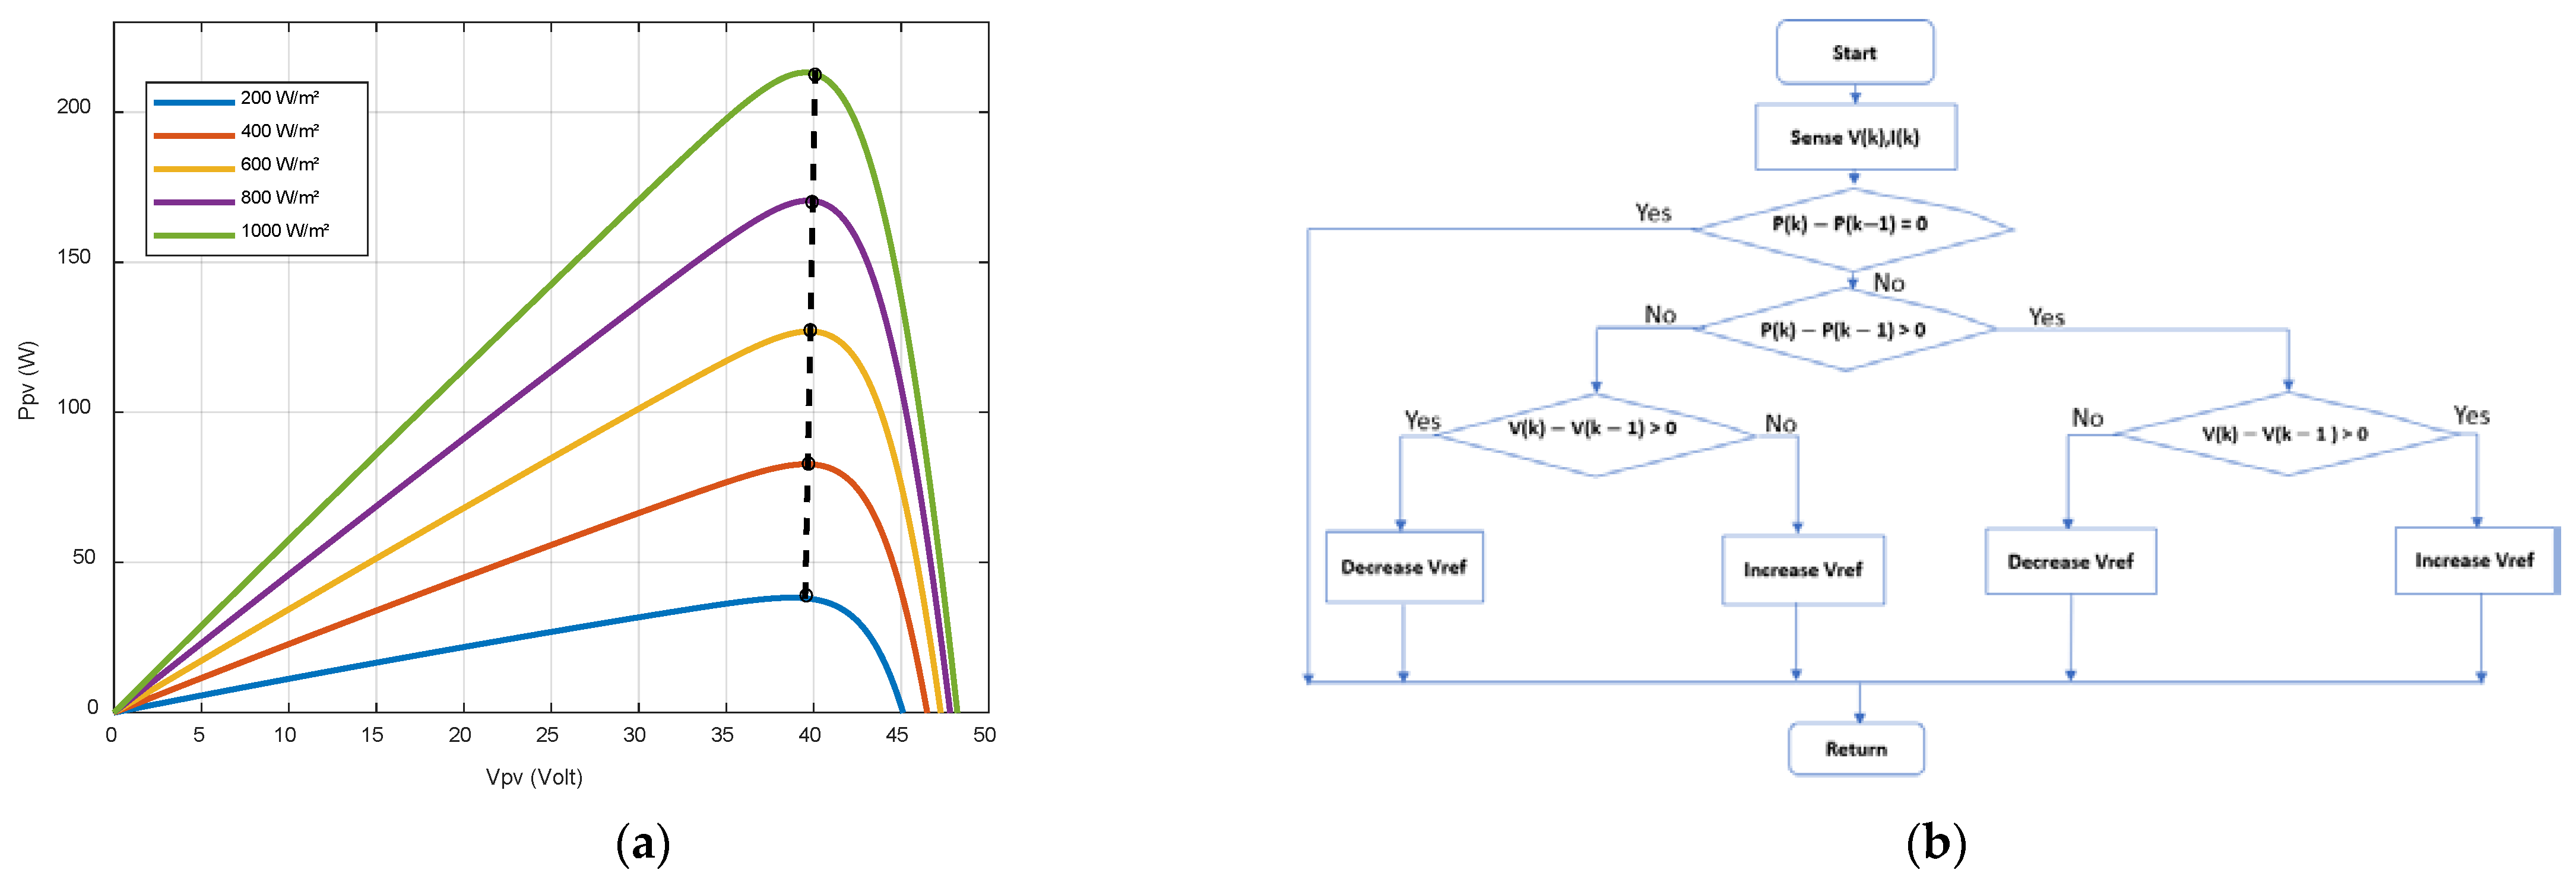
- Extract the maximum of the solar power by acting on chopper 1 to find the optimal solar panels voltage;
- Satisfy the DC load demand by acting on chopper 2.
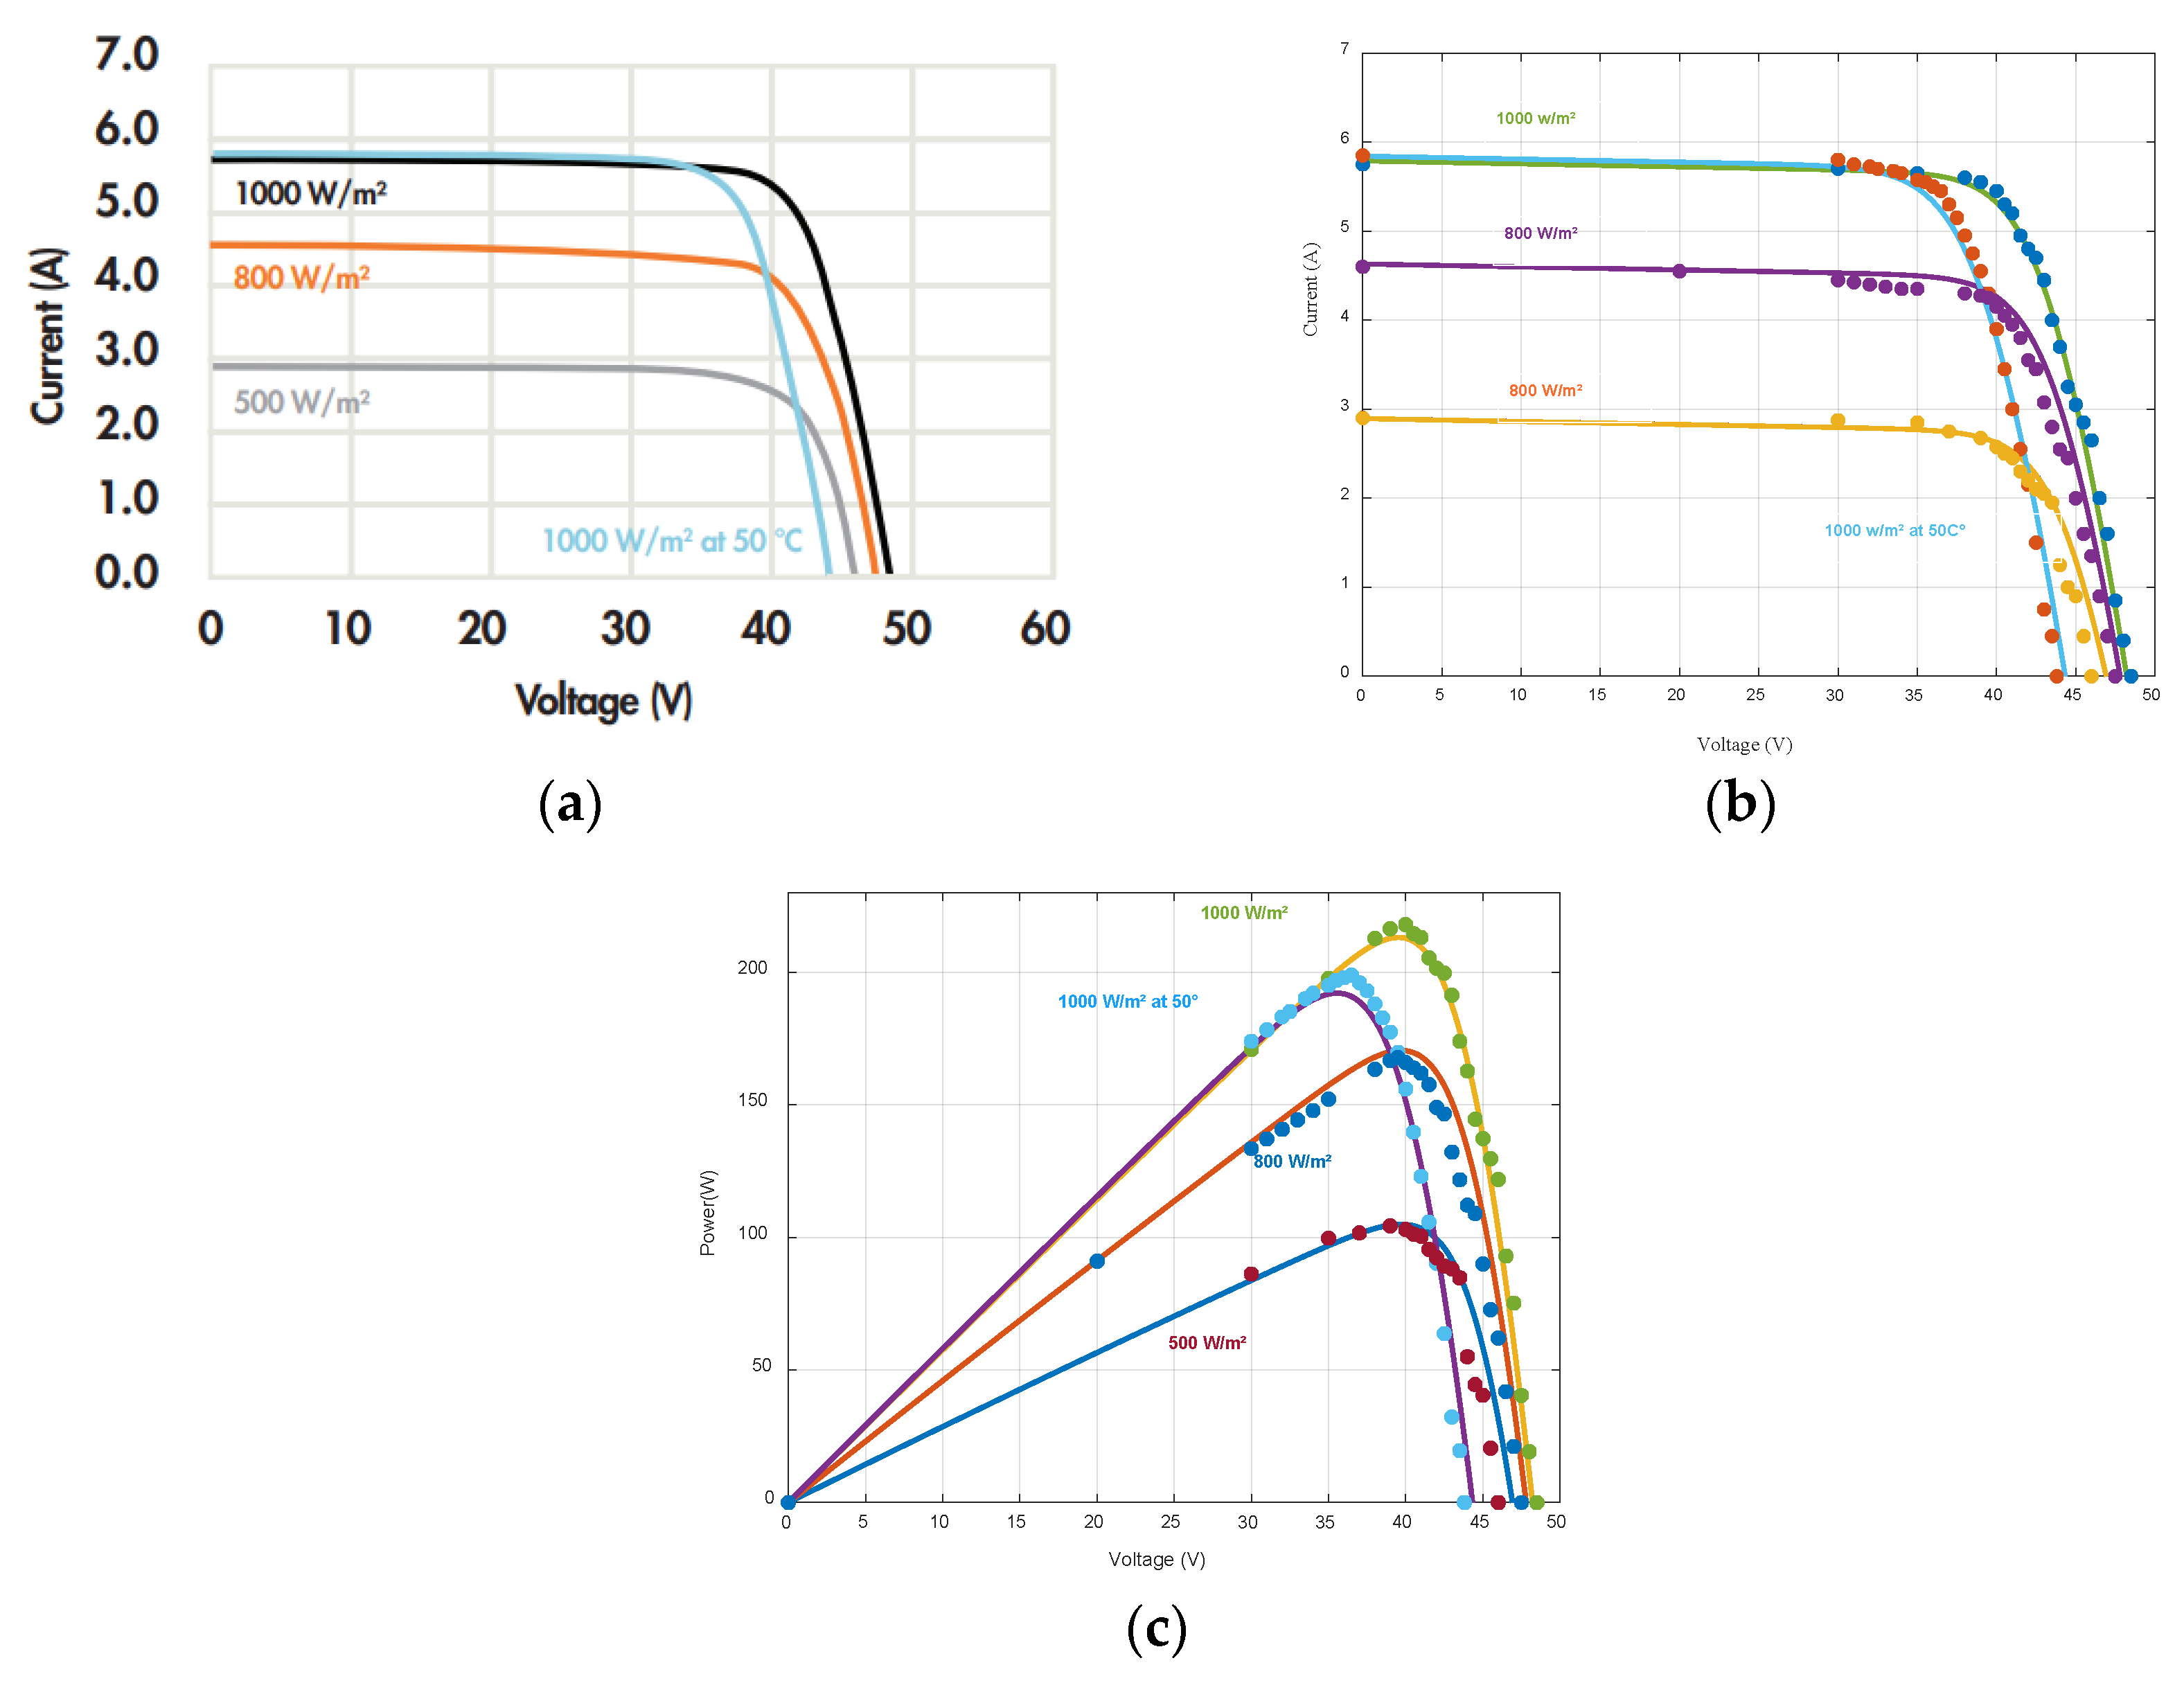
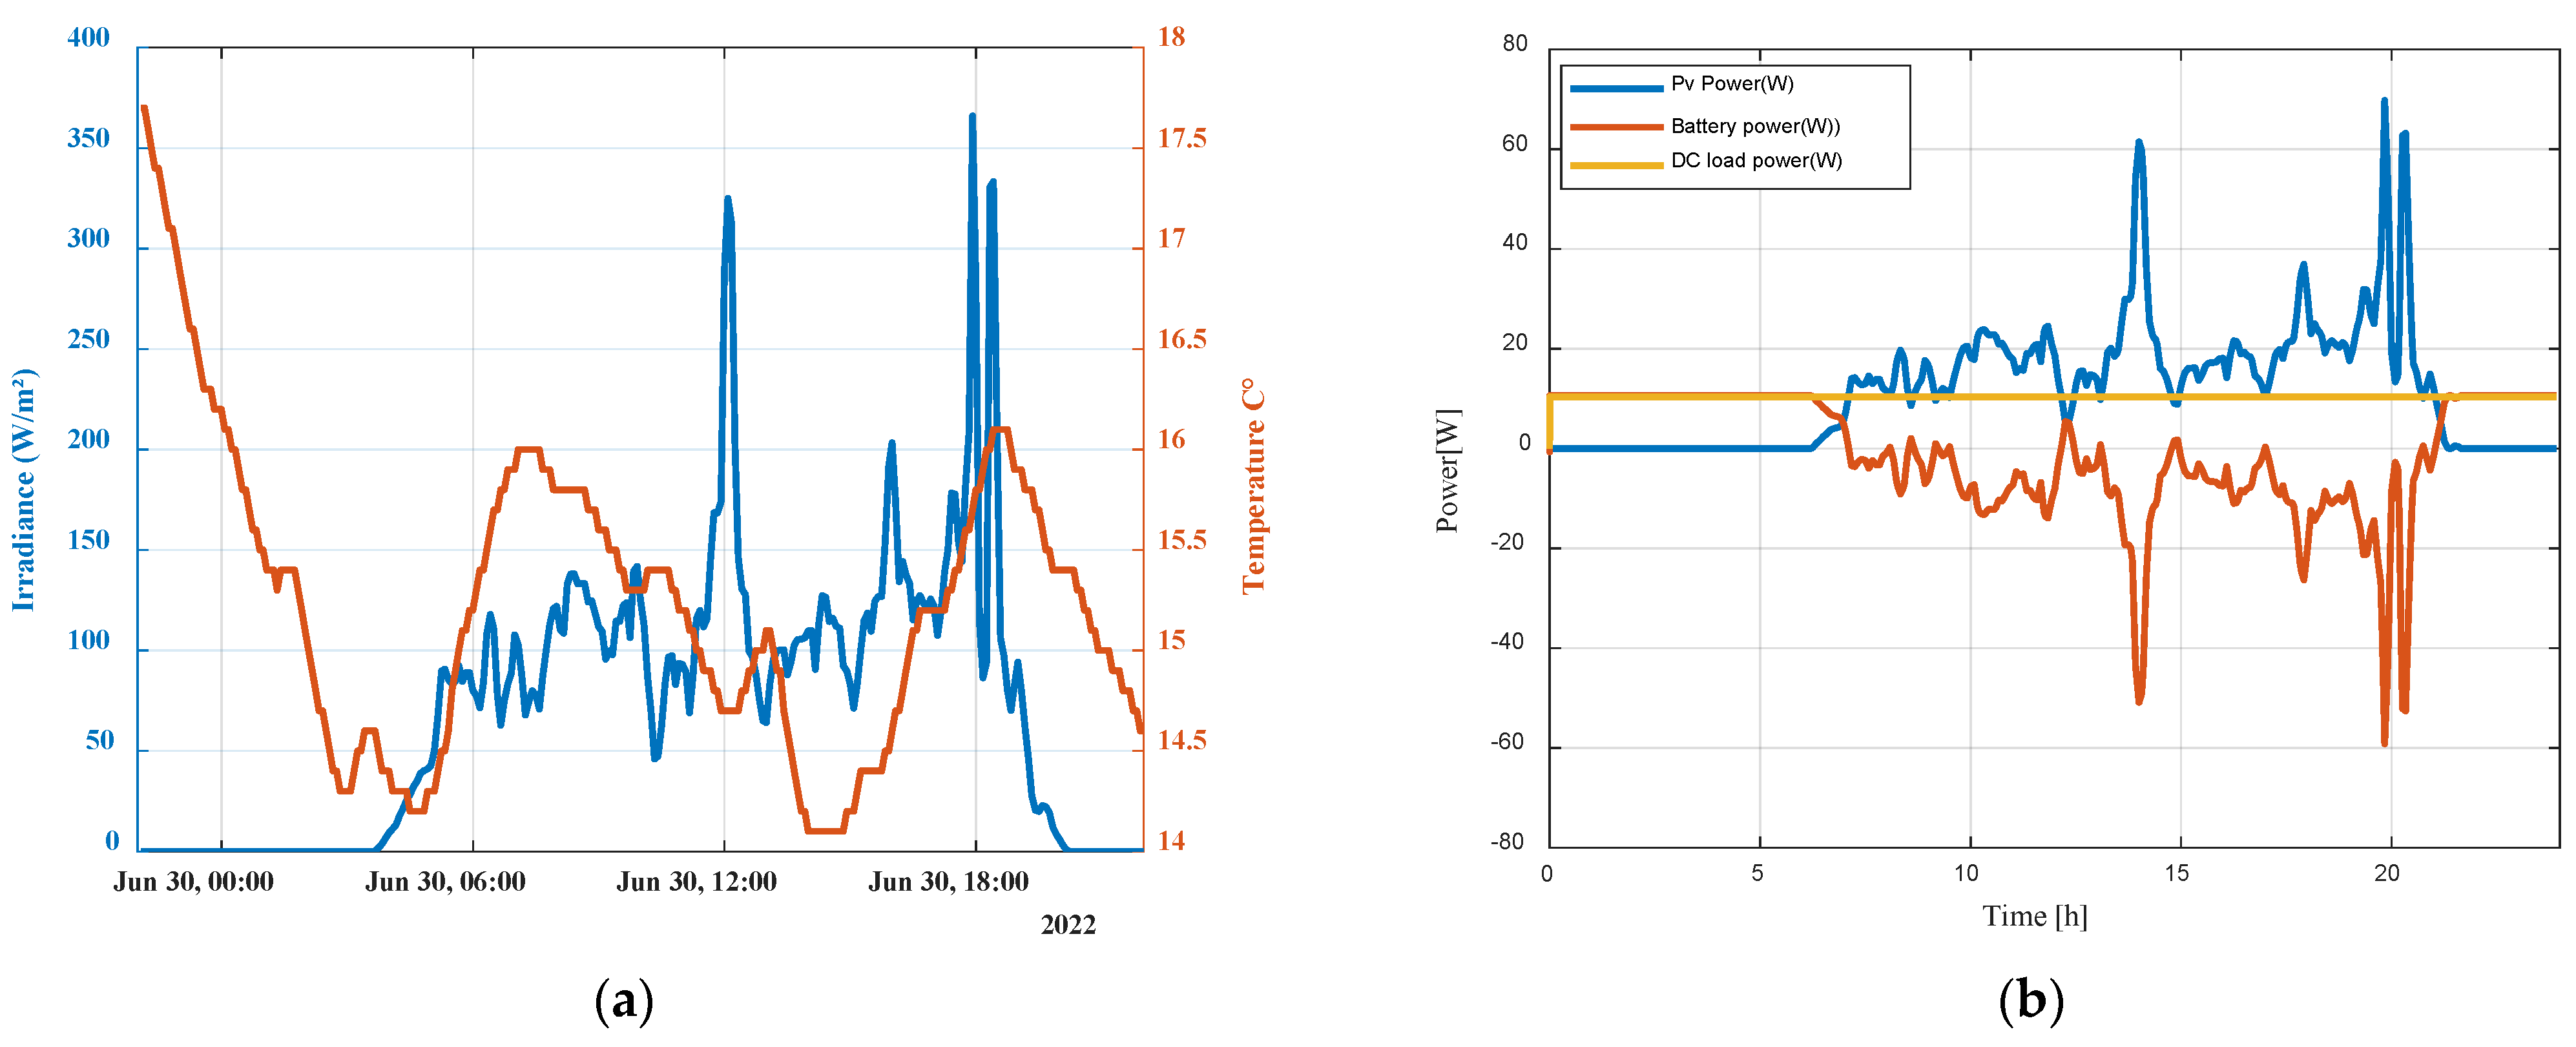
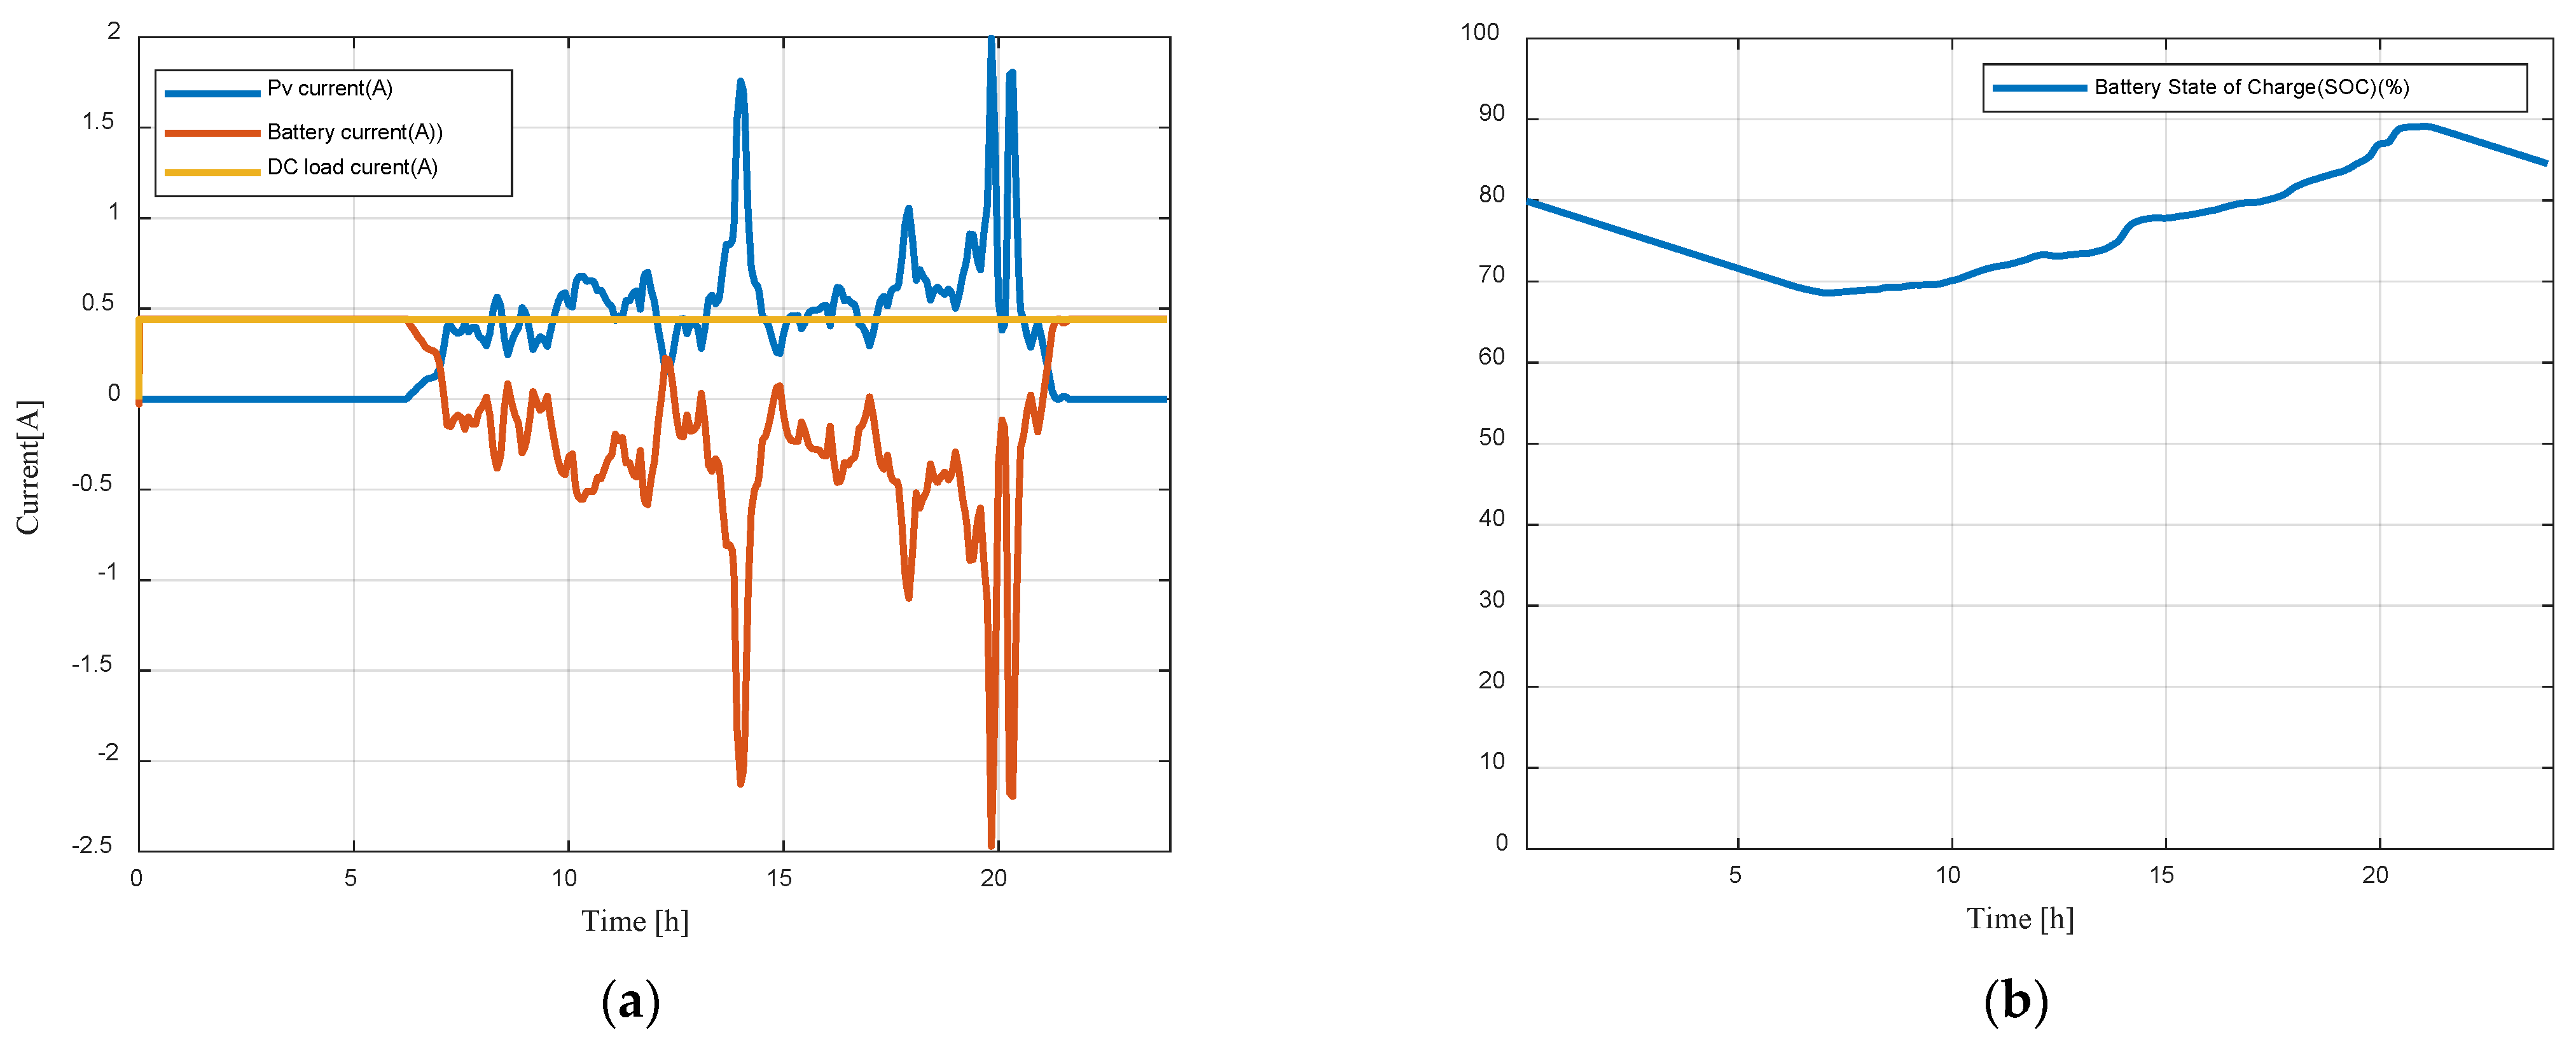
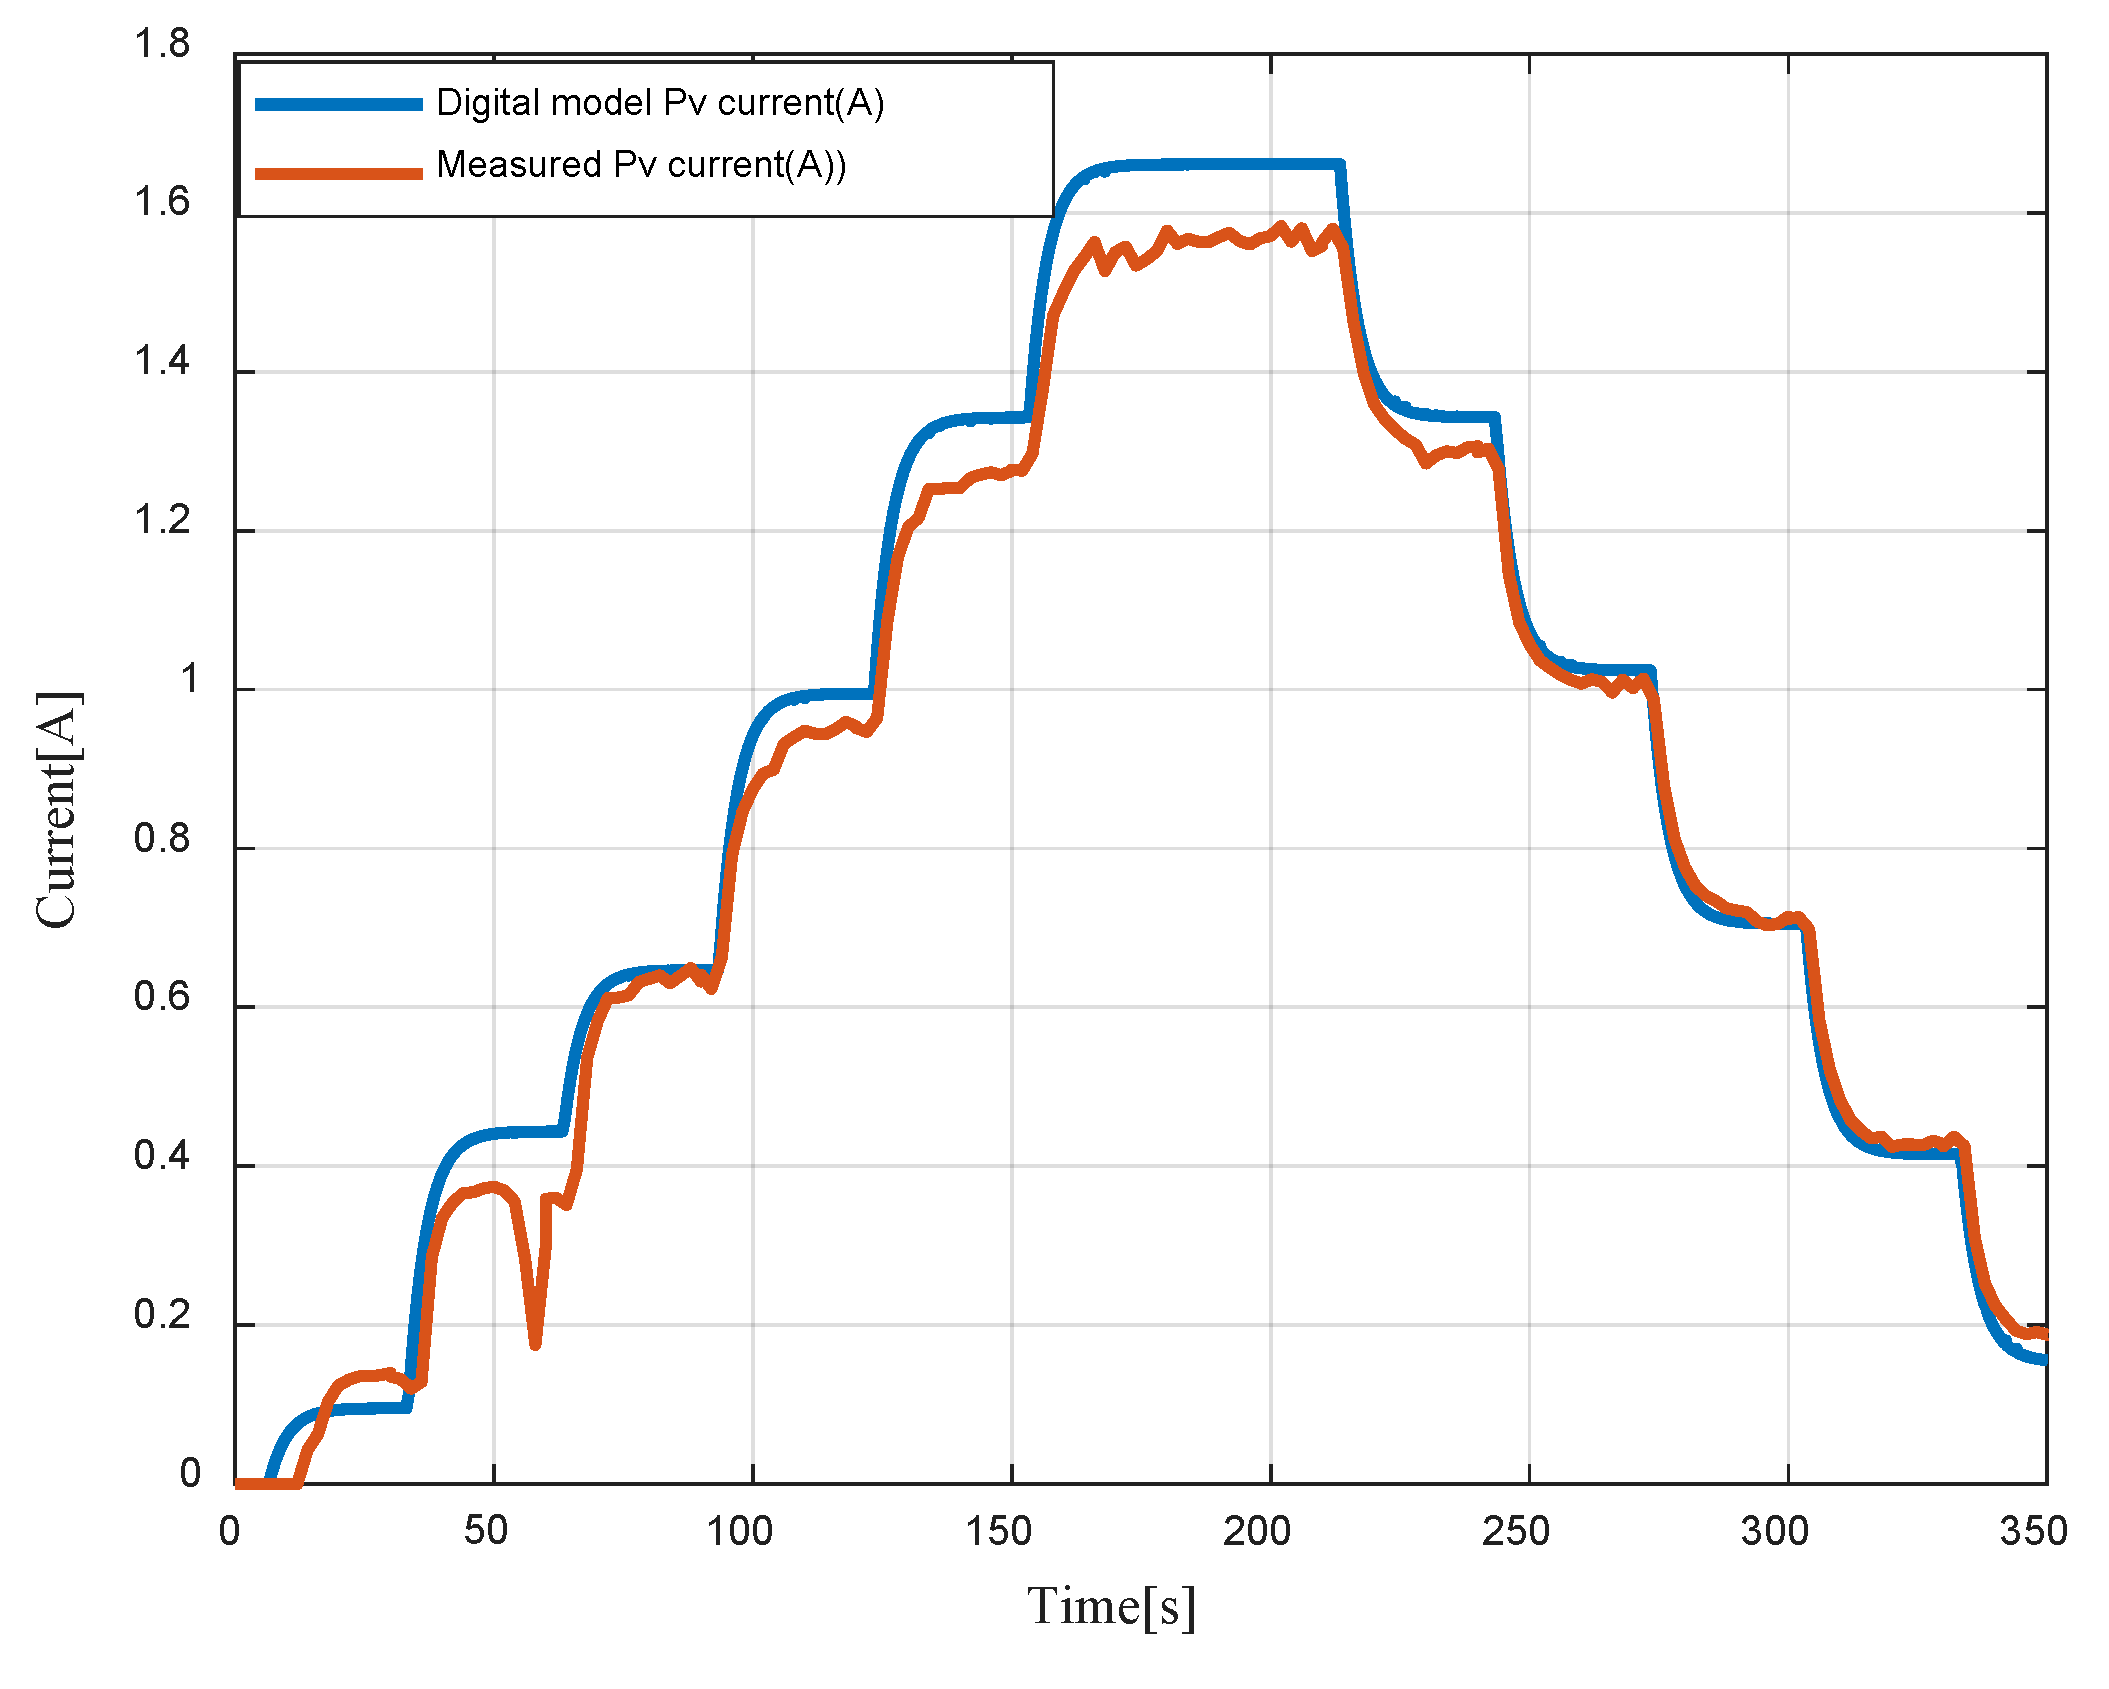
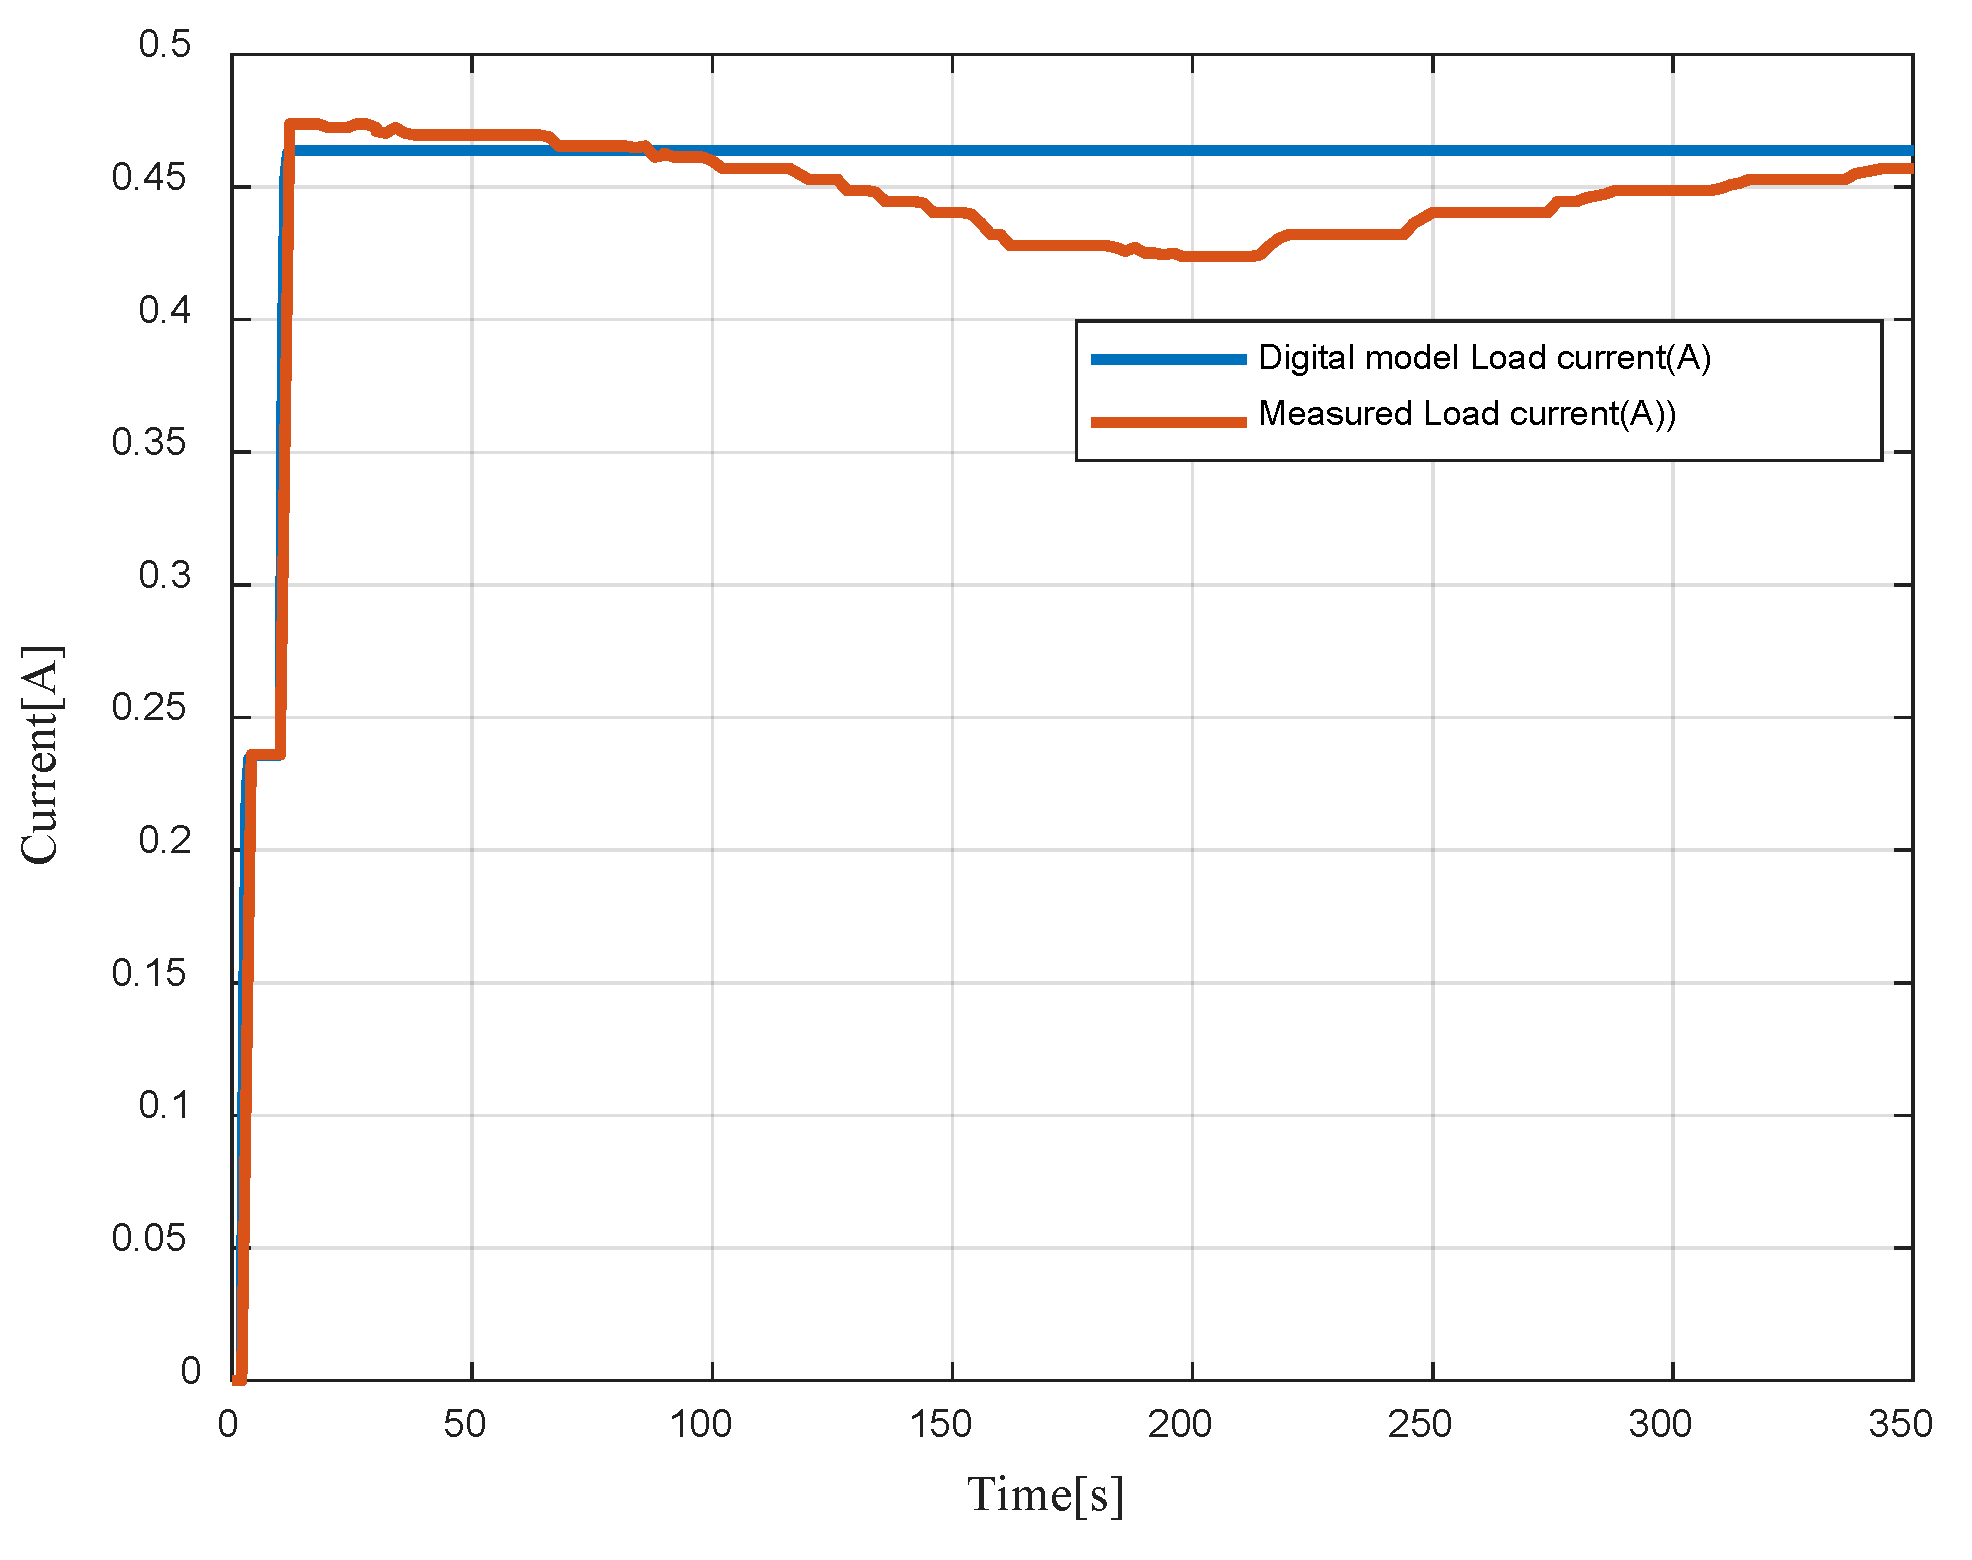
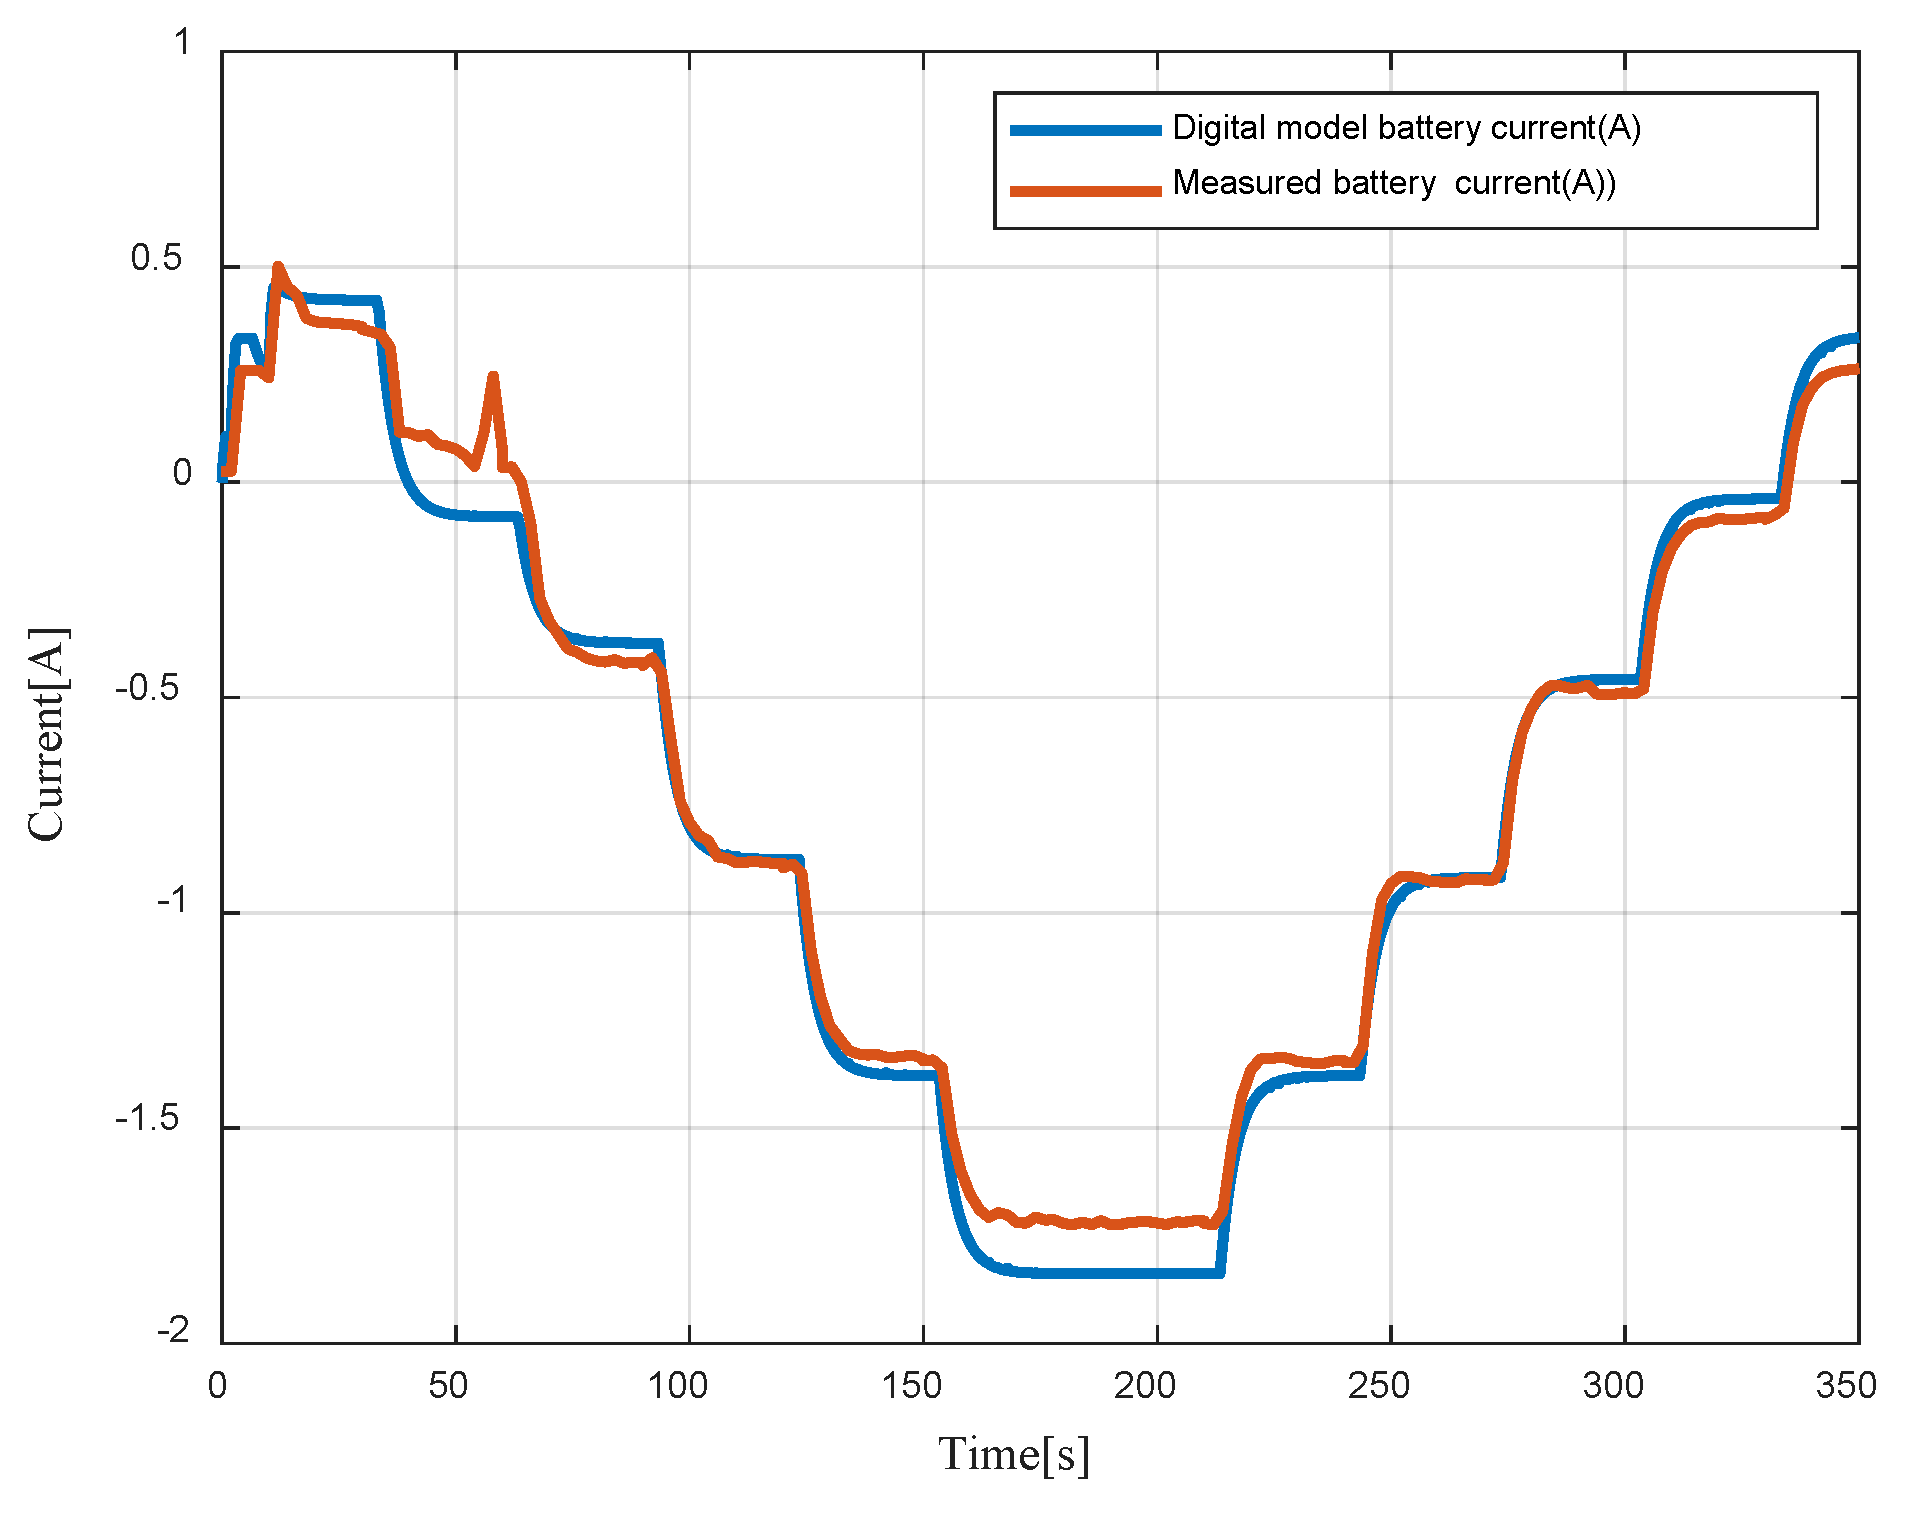
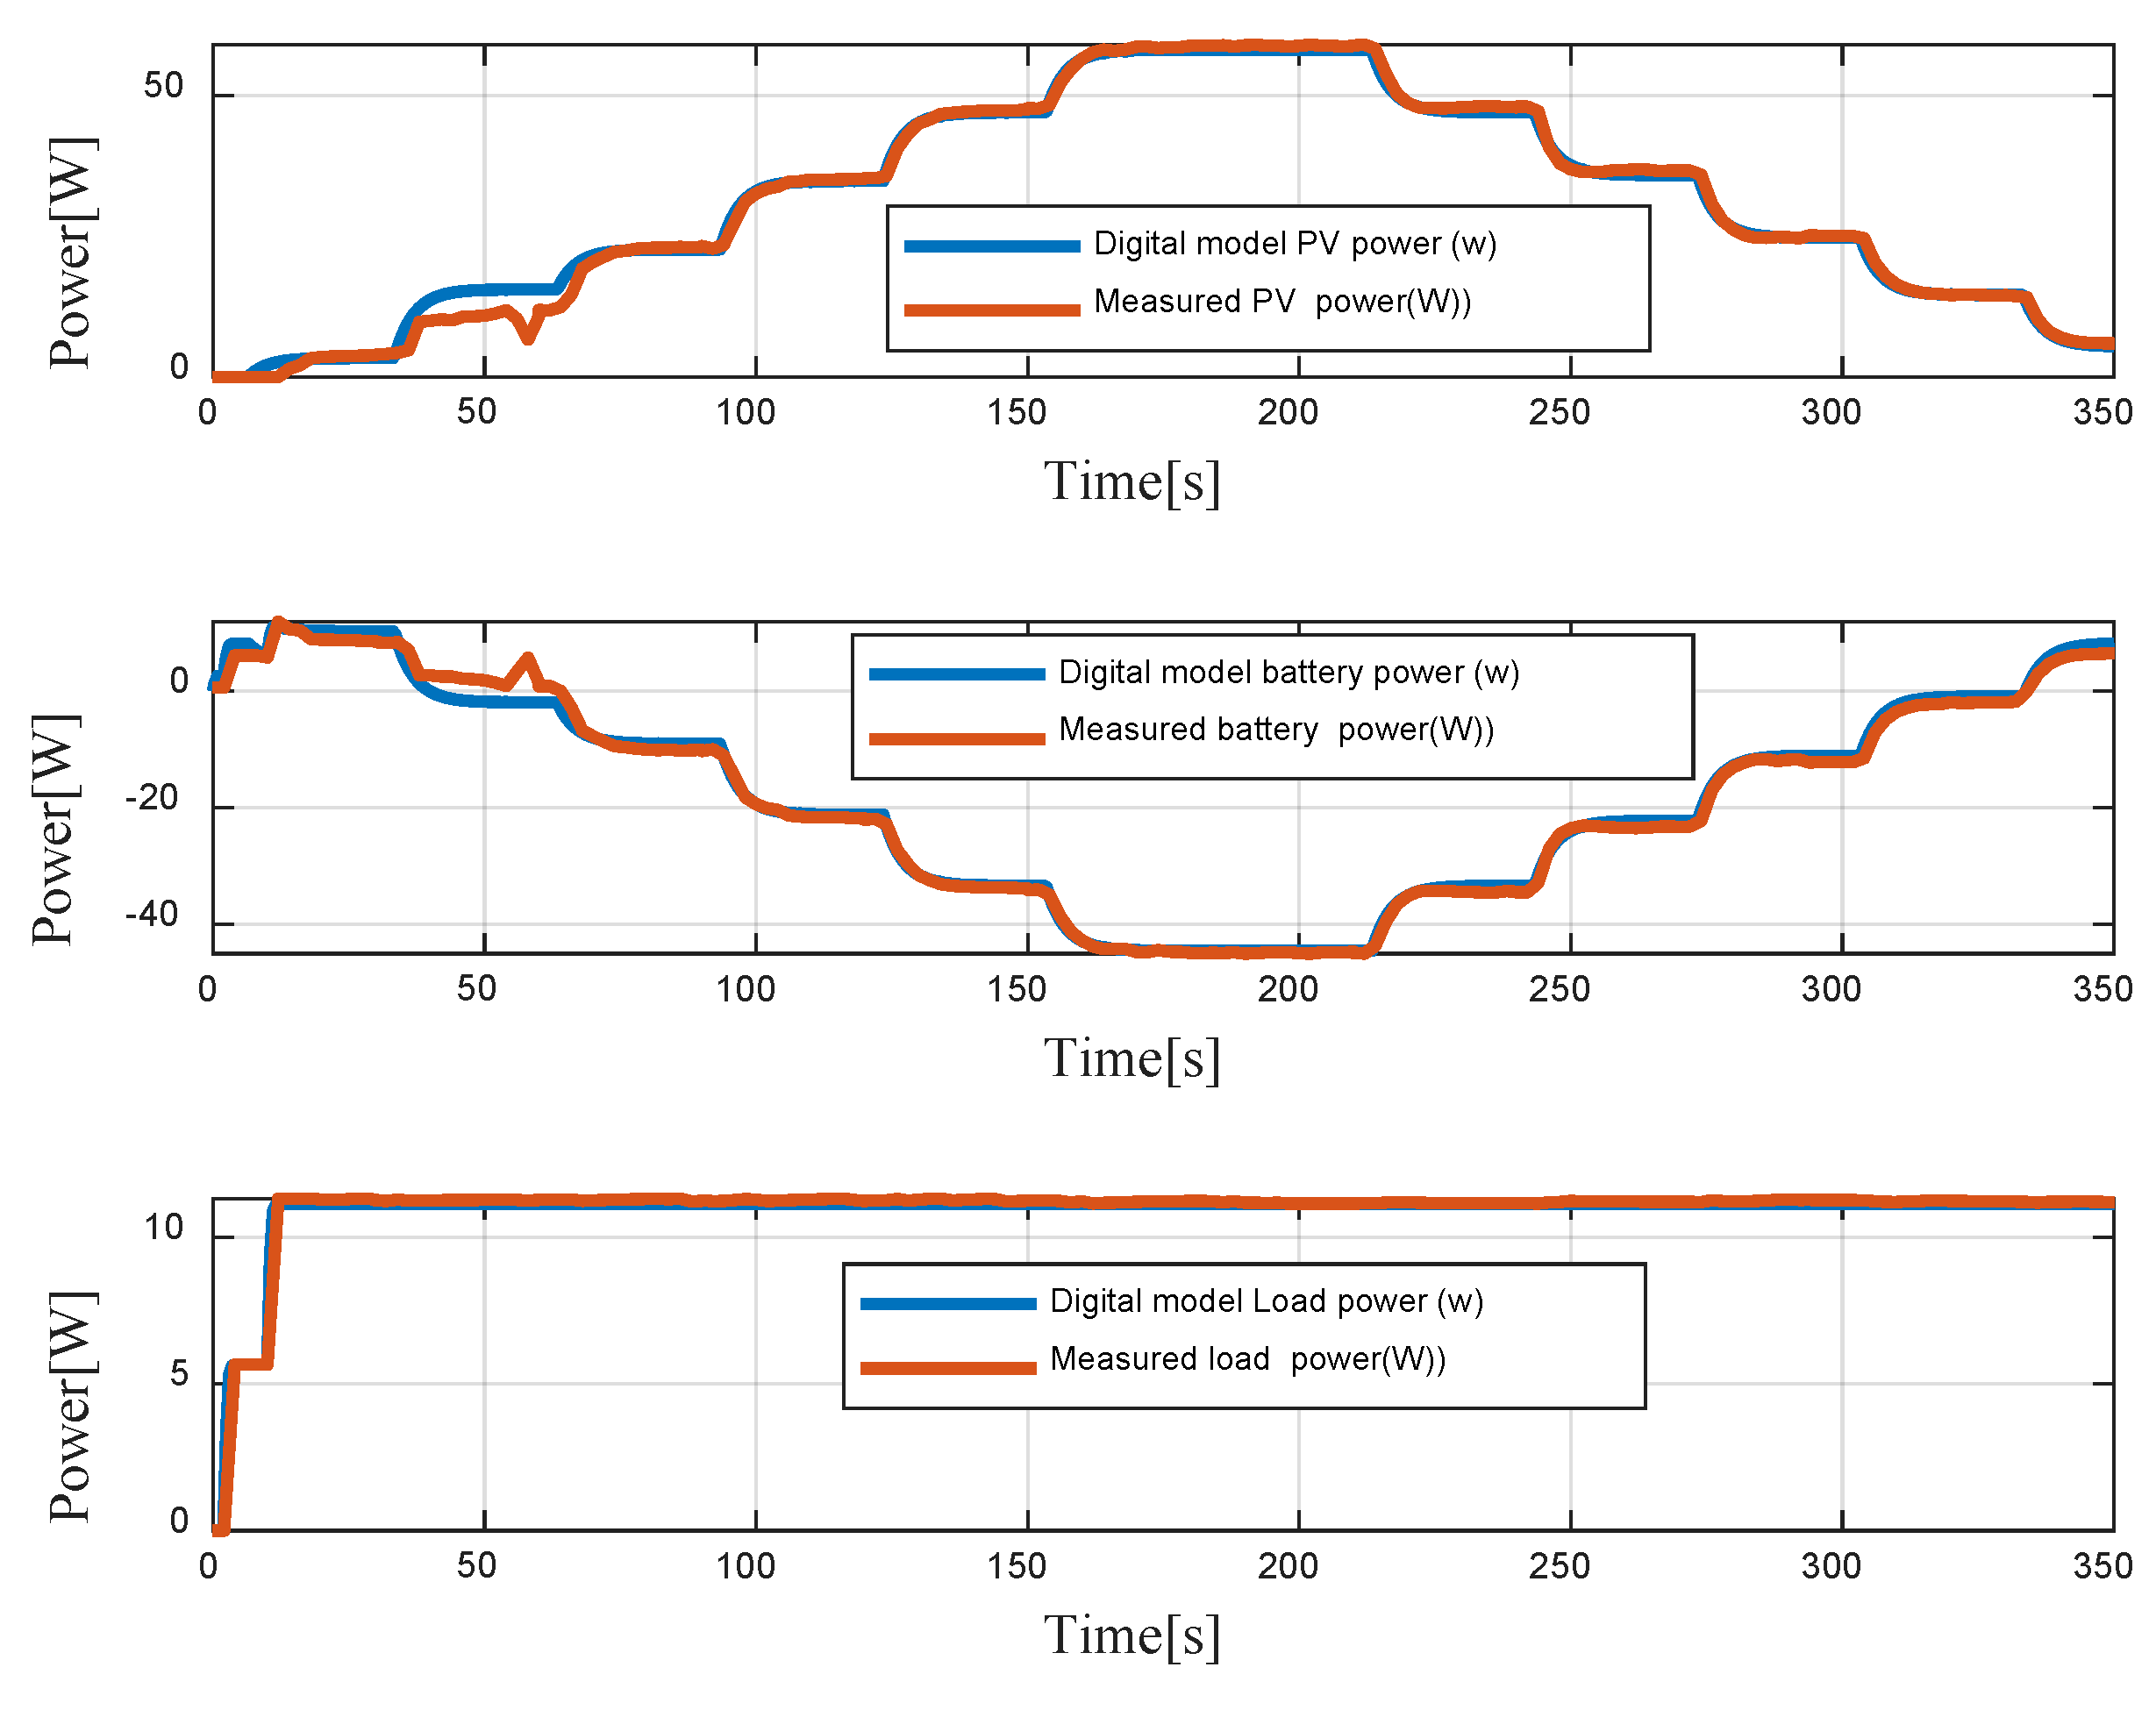
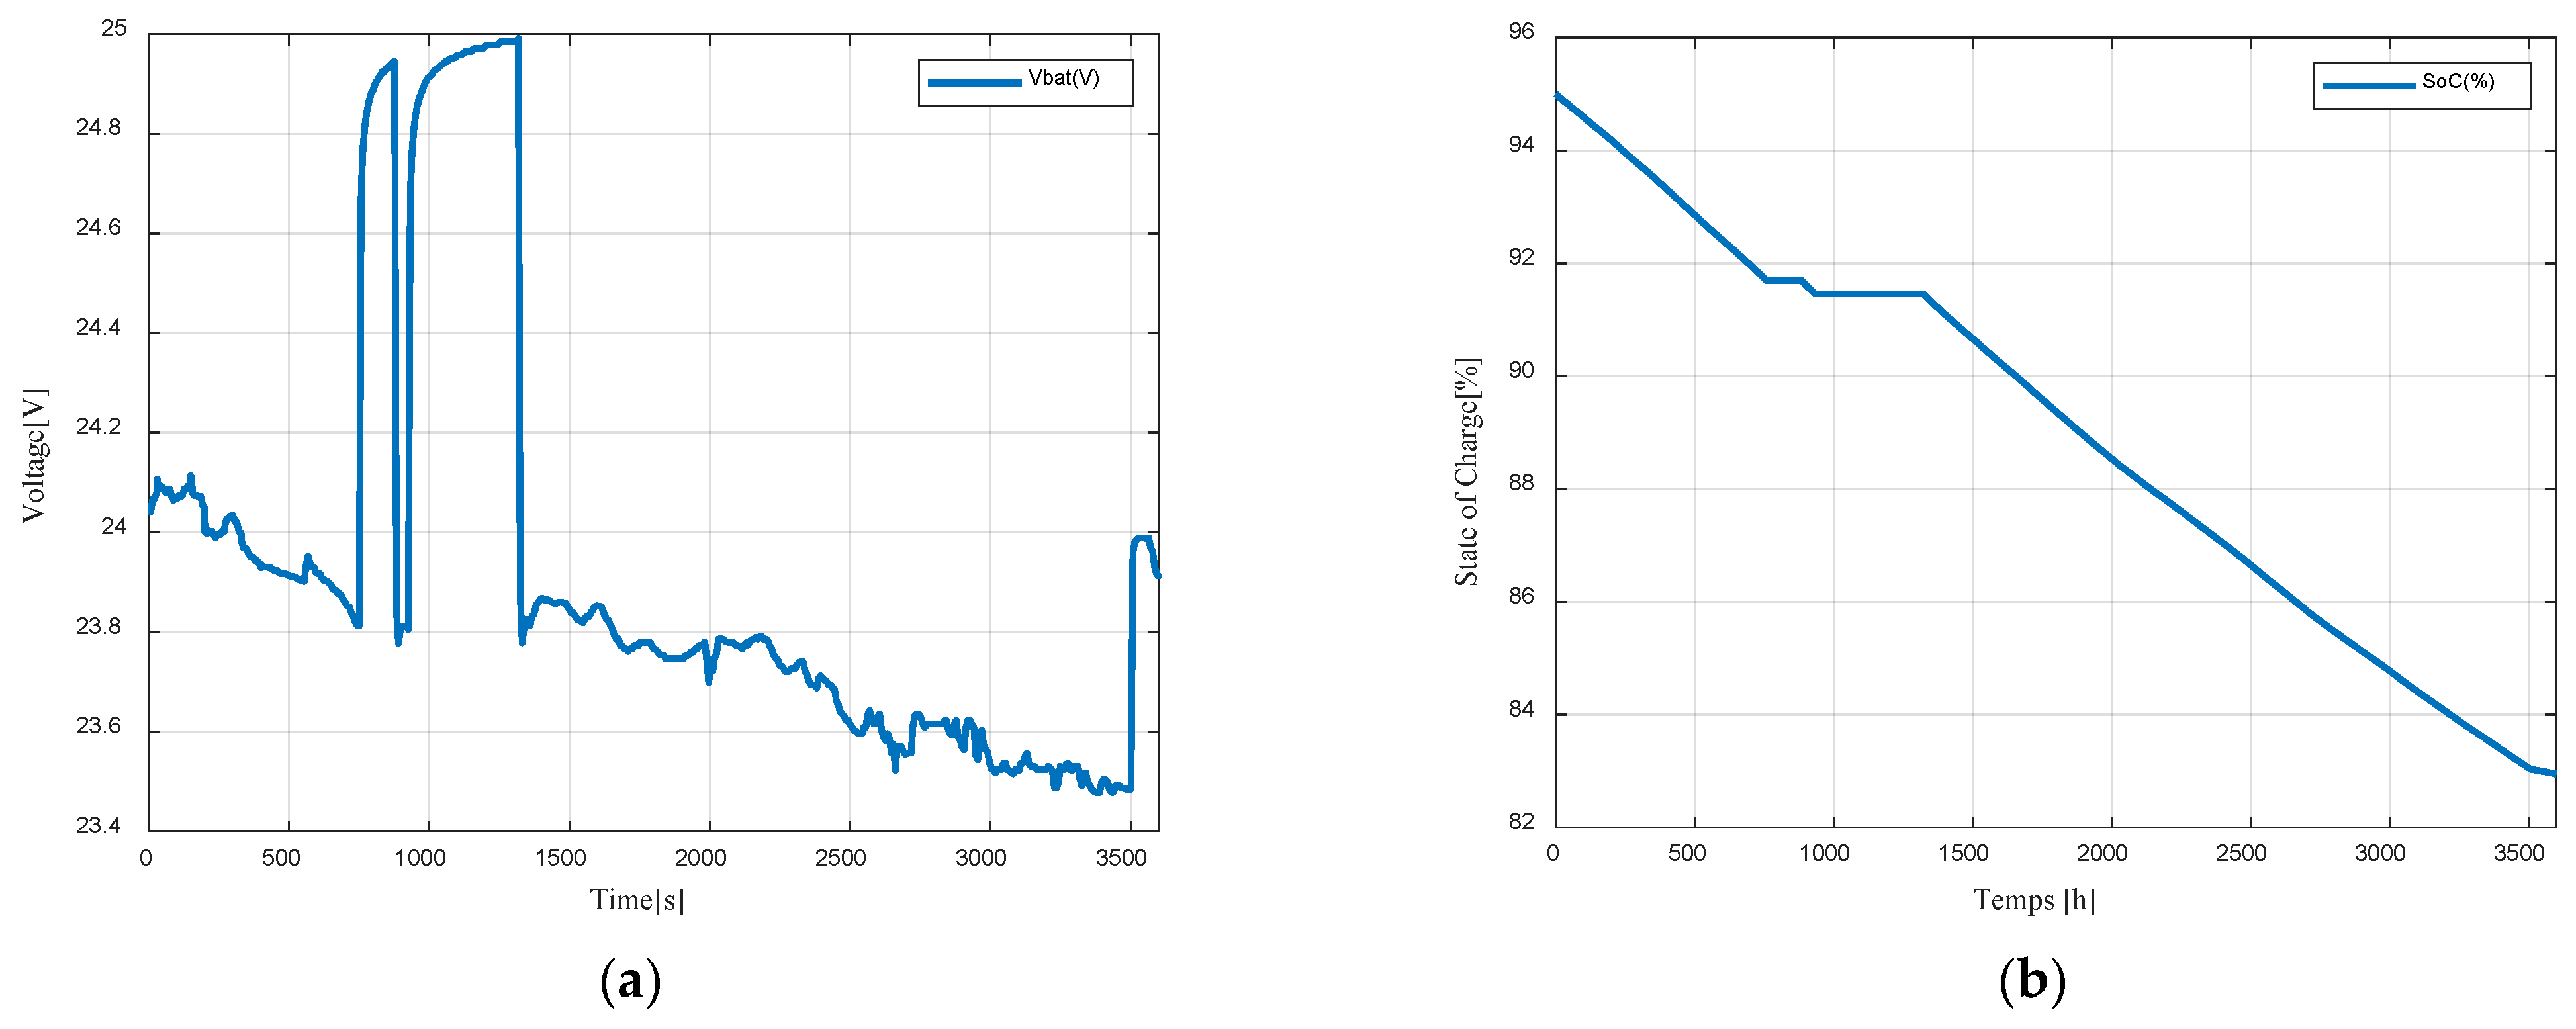
5. Experimental Results and Discussion
6. Conclusions
Author Contributions
Funding
Institutional Review Board Statement
Informed Consent Statement
Conflicts of Interest
References
- Madeti, S.R.; Singh, S. Monitoring system for photovoltaic plants: A review. Renew. Sustain. Energy Rev. 2017, 67, 1180–1207. [Google Scholar] [CrossRef]
- Motlagh, N.H.; Mohammadrezaei, M.; Hunt, J.; Zakeri, B. Internet of Things (IoT) and the Energy Sector. Energies 2020, 13, 494. [Google Scholar] [CrossRef] [Green Version]
- Shrouf, F.; Miragliotta, G. Energy management based on Internet of Things: Practices and framework for adoption in production management. J. Clean. Prod. 2015, 100, 235–246. [Google Scholar] [CrossRef]
- Adhya, S.; Saha, D.; Das, A.; Jana, J.; Saha, H. An IoT based smart solar photovoltaic remote monitoring and control unit. In Proceedings of the 2016 2nd International Conference on Control, Instrumentation, Energy & Communication (CIEC), Kolkata, India, 28–30 January 2016; pp. 432–436. [Google Scholar] [CrossRef]
- Baidya, S.; Potdar, V.; Ray, P.P.; Nandi, C. Reviewing the opportunities, challenges, and future directions for the digitalization of energy. Energy Res. Soc. Sci. 2021, 81, 102243. [Google Scholar] [CrossRef]
- Mukhopadhyay, S.C.; Suryadevara, N.K. Internet of Things: Challenges and Opportunities; Springer: Berlin/Heidelberg, Germany, 2014; Volume 9, pp. 1–17. [Google Scholar] [CrossRef]
- Yu, W.; Patros, P.; Young, B.; Klinac, E.; Walmsley, T.G. Energy digital twin technology for industrial energy management: Classification, challenges and future. Renew. Sustain. Energy Rev. 2022, 161, 112407. [Google Scholar] [CrossRef]
- Agostinelli, S.; Cumo, F.; Guidi, G.; Tomazzoli, C. Cyber-Physical Systems Improving Building Energy Management: Digital Twin and Artificial Intelligence. Energies 2021, 14, 2338. [Google Scholar] [CrossRef]
- Rachid, A.; Djedjig, A. IoT and MQTT based web monitoring of a solar living laboratory. In Proceedings of the 2022 2nd International Conference on Digital Futures and Transformative Technologies (IcoDT2), Awalpindi, Pakistan, 24–26 May 2022. [Google Scholar] [CrossRef]
- Voutsinas, S.; Karolidis, D.; Voyiatzis, I.; Samarakou, M. Development of an IoT power management system for photovoltaic power plants. In Proceedings of the 2022 11th International Conference on Modern Circuits and Systems Technologies (MOCAST), Bremen, Germany, 8–10 June 2022. [Google Scholar] [CrossRef]
- Dinculeană, D.; Cheng, X. Vulnerabilities and Limitations of MQTT Protocol Used between IoT Devices. Appl. Sci. 2019, 9, 848. [Google Scholar] [CrossRef] [Green Version]
- Martín-Lopo, M.M.; Boal, J.; Sánchez-Miralles, A. A literature review of IoT energy platforms aimed at end users. Comput. Netw. 2020, 171, 107101. [Google Scholar] [CrossRef]
- Han, J.; Choi, C.-S.; Park, W.-K.; Lee, I.; Kim, S.-H. PLC-based photovoltaic system management for smart home energy management system. IEEE Trans. Consum. Electron. 2014, 60, 184–189. [Google Scholar] [CrossRef]
- Miller, D.; Mirzaeva, G.; Townsend, C.D.; Goodwin, G.C. The Use of Power Line Communication in Standalone Microgrids. IEEE Trans. Ind. Appl. 2021, 57, 3029–3037. [Google Scholar] [CrossRef]
- Chouder, A.; Silvestre, S.; Taghezouit, B.; Karatepe, E. Monitoring, modelling and simulation of PV systems using LabVIEW. Sol. Energy 2013, 91, 337–349. [Google Scholar] [CrossRef]
- Dabou, R.; Bouraiou, A.; Ziane, A.; Necaibia, A.; Sahouane, N.; Blal, M.; Khelifi, S.; Rouabhia, A.; Slimani, A. Development of autonomous monitoring and performance evaluation system of grid-tied photovoltaic station. Int. J. Hydrogen Energy 2021, 46, 30267–30287. [Google Scholar] [CrossRef]
- Atia, D.M.; El-Madany, H.T.; Atia, Y.; Zahran, M.B. Real-Time Implementation of Energy Management for Photovoltaic/Battery/Diesel Hybrid System Based on LabVIEW. Int. J. Renew. Energy Res. 2022, 12, 1105–1116. [Google Scholar] [CrossRef]
- Vergura, S.; Natangelo, E. Labview-Matlab Integration for Analyzing Energy Data of PV Pants. Renew. Energy Power Qual. J. 2010, 1, 1248–1252. [Google Scholar] [CrossRef]
- Dhillon, J.; Unni, A.; Singh, N. Design and Simulation of a PV System with Battery Storage Using Bidirectional DC-DC Converter Using Matlab Simulink. In Proceedings of the 2022 1st International Conference on Sustainable Technology for Power and Energy Systems (STPES), Srinagar, India, 5–6 July 2022. [Google Scholar] [CrossRef]
- Manolakos, D.; Papadakis, G.; Papantonis, D.; Kyritsis, S. A stand-alone photovoltaic power system for remote villages using pumped water energy storage. Energy 2004, 29, 57–69. [Google Scholar] [CrossRef]
- Gouda, O.; Amer, G.; Elkhodary, T.; Awaad, M. Optimum Design and Implementation of Stand-alone Tracking Photovoltaic Power System based on PLC and Microcontroller. In Proceedings of the 14th International Middle East Power Systems Conference (MEPCON’10), Cairo, Egypt, 19–21 December 2010; pp. 119–124. [Google Scholar]
- Kowsalya, M.; Elakya, A.; Pradeep, R. Solar Operated PLC Based Automated Irrigation System with Fault Preventer. In Proceedings of the 7th International Conference on Advanced Computing and Communication Systems (ICACCS), Coimbatore, India, 19–20 March 2021. [Google Scholar] [CrossRef]
- Lee, J.; Lee, S.; Cho, H.; Ham, K.S.; Hong, J. Supervisory control and data acquisition for Standalone Hybrid Power Generation Systems. Sustain. Comput. Inform. Syst. 2018, 20, 141–154. [Google Scholar] [CrossRef]
- Mohammed, N.; Danapalasingam, K.A.; Majed, A. Design, Control and Monitoring of an Offline Mobile Battery Energy Storage System for a Typical Malaysian Household Load Using PLC. Int. J. Power Electron. Drive Syst. 2018, 9, 180–188. [Google Scholar] [CrossRef]
- Alphonsus, E.R.; Abdullah, M.O. A review on the applications of programmable logic controllers (PLCs). Renew. Sustain. Energy Rev. 2016, 60, 1185–1205. [Google Scholar] [CrossRef]
- Tao, F.; Zhang, H.; Liu, A.; Nee, A.Y.C. Digital Twin in Industry: State-of-the-Art. IEEE Trans. Ind. Inform. 2018, 15, 2405–2415. [Google Scholar] [CrossRef]
- Pan, H.; Dou, Z.; Cai, Y.; Li, W.; Lei, X.; Han, D. Digital twin and its application in power system. In Proceedings of the 2020 5th International Conference on Power and Renewable Energy (ICPRE), Shanghai, China, 12–14 September 2020; pp. 21–26. [Google Scholar]
- Fuller, A.; Fan, Z.; Day, C.; Barlow, C. Digital Twin: Enabling Technologies, Challenges and Open Research. IEEE Access 2020, 8, 108952–108971. [Google Scholar] [CrossRef]
- Fahim, M.; Sharma, V.; Cao, T.-V.; Canberk, B.; Duong, T.Q. Machine Learning-Based Digital Twin for Predictive Modeling in Wind Turbines. IEEE Access 2022, 10, 14184–14194. [Google Scholar] [CrossRef]
- Agostinelli, S.; Cumo, F.; Nezhad, M.M.; Orsini, G.; Piras, G. Renewable Energy System Controlled by Open-Source Tools and Digital Twin Model: Zero Energy Port Area in Italy. Energies 2022, 15, 1817. [Google Scholar] [CrossRef]
- Zaballos, A.; Briones, A.; Massa, A.; Centelles, P.; Caballero, V. A Smart Campus’ Digital Twin for Sustainable Comfort Monitoring. Sustainability 2020, 12, 9196. [Google Scholar] [CrossRef]
- Moi, T.; Cibicik, A.; Rølvåg, T. Digital twin based condition monitoring of a knuckle boom crane: An experimental study. Eng. Fail. Anal. 2020, 112, 104517. [Google Scholar] [CrossRef]
- Livera, A.; Paphitis, G.; Pikolos, L.; Papadopoulos, I.; Montes-Romero, J.; Lopez-Lorente, J.; Makrides, G.; Sutterlueti, J.; Georghiou, G.E. Intelligent Cloud-Based Monitoring and Control Digital Twin for Photovoltaic Power Plants. In Proceedings of the 2022 IEEE 49th Photovoltaics Specialists Conference (PVSC), Philadeplhia, PA, USA, 5–10 June 2022; pp. 0267–0274. [Google Scholar] [CrossRef]
- Al-Ali, A.; Zualkernan, I.A.; Rashid, M.; Gupta, R.; Alikarar, M. A smart home energy management system using IoT and big data analytics approach. IEEE Trans. Consum. Electron. 2017, 63, 426–434. [Google Scholar] [CrossRef]
- Jain, P.; Poon, J.; Singh, J.P.; Spanos, C.; Sanders, S.R.; Panda, S.K. A Digital Twin Approach for Fault Diagnosis in Distributed Photovoltaic Systems. IEEE Trans. Power Electron. 2019, 35, 940–956. [Google Scholar] [CrossRef]
- Cheddadi, Y.; Cheddadi, H.; Cheddadi, F.; Errahimi, F.; Es-Sbai, N. Design and implementation of an intelligent low-cost IoT solution for energy monitoring of photovoltaic stations. SN Appl. Sci. 2020, 2, 1–11. [Google Scholar] [CrossRef]
- de Arquer Fernández, P.; Fernández, M.A.F.; Candás, J.L.C.; Arboleya, A.P. An IoT open source platform for photovoltaic plants supervision. Int. J. Electr. Power Energy Syst. 2021, 125, 106540. [Google Scholar] [CrossRef]
- Pereira, R.I.; Dupont, I.M.; Carvalho, P.C.; Jucá, S.C. IoT embedded linux system based on Raspberry Pi applied to real-time cloud monitoring of a decentralized photovoltaic plant. Measurement 2018, 114, 286–297. [Google Scholar] [CrossRef]
- Abdallah, E.L.; Ouassaid, M.; Zidani, Y. Development of a Real-Time Framework between MATLAB and PLC through OPC-UA: A Case Study of a Microgrid Energy Management System. 2022, p. 13. Available online: https://www.researchsquare.com/article/rs-1265626/v1 (accessed on 22 March 2022).
- Qian, C.; Liu, X.; Ripley, C.; Qian, M.; Liang, F.; Yu, W. Digital Twin—Cyber Replica of Physical Things: Architecture, Applications and Future Research Directions. Future Internet 2022, 14, 64. [Google Scholar] [CrossRef]
- Transducer of, D.C. Circuit Parameters with Ethernet|Lumel. Available online: https://www.lumel.com.pl/en/catalogue/product/transducer-of-d-c-circuit-parameters-with-ethernet-p30h (accessed on 17 June 2022).
- Jaloudi, S. Communication Protocols of an Industrial Internet of Things Environment: A Comparative Study. Future Internet 2019, 11, 66. [Google Scholar] [CrossRef] [Green Version]
- Wang, Y.-J.; Hsu, P.-C. Analytical modelling of partial shading and different orientation of photovoltaic modules. IET Renew. Power Gener. 2010, 4, 272–282. [Google Scholar] [CrossRef]
- Guo, S. The Application of Genetic Algorithms to Parameter Estimation in Lead-Acid Battery Equivalent Circuit Models. Master’s Thesis, University of Birmingham, Birmingham, UK, 2010; p. 137. [Google Scholar]
- Tremblay, O.; Dessaint, L.-A.; Dekkiche, A.-I. A Generic Battery Model for the Dynamic Simulation of Hybrid Electric Vehicles. In Proceedings of the IEEE Vehicle Power and Propulsion Conference, Arlington, TX, USA, 9–12 September 2007; pp. 284–289. [Google Scholar]
- Jamshidpour, E.; Jovanović, S.; Poure, P. Equivalent Two Switches and Single Switch Buck/Buck-Boost Circuits for Solar Energy Harvesting Systems. Energies 2020, 13, 583. [Google Scholar] [CrossRef] [Green Version]
- Bouscayrol, A.; Guillaud, X.; Delarue, P.; Lemaire-Semail, B. Energetic Macroscopic Representation and Inversion-Based Control Illustrated on a Wind-Energy-Conversion System Using Hardware-in-the-Loop Simulation. IEEE Trans. Ind. Electron. 2009, 56, 4826–4835. [Google Scholar] [CrossRef]
- Mokhena, T.; Mochane, M.; Tshwafo, M.; Linganiso, L.; Thekisoe, O.; Songca, S. Powerful Multilevel Simulation Tool for HiL Analysis of Urban Electric vehicle’s Propulsion Systems Raul; Intech Open: London, UK, 2016; pp. 225–240. [Google Scholar]
- Lhomme, W.; Delarue, P.; Giraud, F.; Lemaire-Semail, B.; Bouscayrol, A. Simulation of a Photovoltaic Conversion System using Energetic Macroscopic Representation. In Proceedings of the 15th International Power Electronics and Motion Control Conference (EPE/PEMC), Novi Sad, Serbia, 4–6 September 2012. [Google Scholar] [CrossRef] [Green Version]
- Gomand, J. Analyse de Systèmes Multi-Actionneurs Parallèles par une Approche Graphique Causale—Application a un Processus Électromécanique de Positionnement Rapide. Ph.D. Thesis, Ecole Doctorale no. 432: Sciences des Métiers de l’Ingénieur, l’École Nationale Supérieure d’Arts et Métiers, Paris, France, 2009. [Google Scholar]
- Femia, N.; Petrone, G.; Spagnuolo, G.; Vitelli, M. Optimization of Perturb and Observe Maximum Power Point Tracking Method. IEEE Trans. Power Electron. 2005, 20, 963–973. [Google Scholar] [CrossRef]
- Mirzaei, A.; Forooghi, M.; Ghadimi, A.A.; Abolmasoumi, A.H.; Riahi, M.R. Design and construction of a charge controller for stand-alone PV/battery hybrid system by using a new control strategy and power management. Sol. Energy 2017, 149, 132–144. [Google Scholar] [CrossRef]


| Reference | IoT Capability | Multi-Protocols | Energy Management | Monitoring | Digital Model | Digital Shadow | Digital Twin |
|---|---|---|---|---|---|---|---|
| [34] | ✓ | ✓ | ✗ | ✓ | ✗ | ✗ | ✗ |
| [29] | ✓ | - | ✗ | ✓ | ✓ | ✓ | ✗ |
| [35] | ✗ | ✗ | ✗ | ✓ | ✓ | ✓ | ✗ |
| [9] | ✓ | ✓ | ✓ | ✓ | ✗ | ✗ | ✗ |
| [36] | ✓ | ✓ | ✗ | ✓ | ✗ | ✗ | ✗ |
| [37] | ✓ | ✓ | ✗ | ✓ | ✗ | ✗ | ✗ |
| [16] | ✗ | ✓ | ✗ | ✓ | ✗ | ✗ | ✗ |
| [30] | ✓ | - | ✗ | ✓ | ✓ | ✓ | ✗ |
| [38] | ✓ | ✓ | ✗ | ✓ | ✗ | ✗ | ✗ |
| [39] | ✗ | - | ✓ | ✓ | ✗ | ✗ | ✗ |
| [10] | ✓ | - | ✓ | ✓ | - | - | ✗ |
| Proposed | ✓ | Unified environment | ✓ | ✓ | ✓ | ✓ | ✓ |
| Parameter | Value |
|---|---|
| Maximum power | 215 Wp |
| Voltage at maximum power point | 39.8 V |
| Current at maximum power point | 5.40 A |
| Open circuit voltage | 48.3 V |
| Short Circuit Current | 5.80 A |
| Voltage temperature coefficient | −136.8 mV/°C |
| Current temperature coefficient | 3.5 mA/°C |
| Number of cells per module | 72 |
| Parameters | Values |
|---|---|
| 0.74816 |
| Capacity | Nominal Voltage | Internal Resistance | Weight |
|---|---|---|---|
| 14 Ah/0.7 A | 12 V | 14 mΩ | 4.05 kg |
| Pictrograms | Pictograms Significance |
|---|---|
 | Source of energy |
 | Element with energy accumulation |
 | Coupling devices for energy distribution |
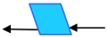 | Control bloc without energy accumulation |
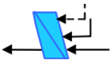 | Control block with controller |
 | Strategy block |
| System | Equations | Block Diagrams | EMR and Based Inversed Based Control | |
|---|---|---|---|---|
| Chopper1 | 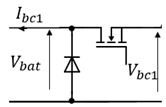 | 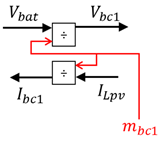 | 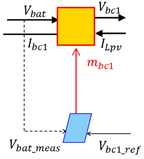 | |
| RL filter | 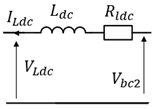 | 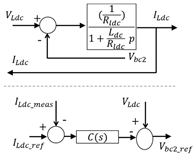 | 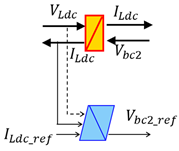 | |
| RC filter | 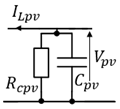 | 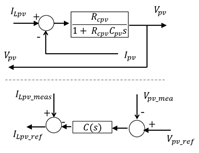 |  |
| Modes | Load | Chopper 1 | Chopper 2 | Battery |
|---|---|---|---|---|
| Mode I: When the battery SOC reaches 96%, which indicates a nearly full charge, the system is operating in float mode. At this point, the PV power output is greater than the load demand. Therefore, the battery should not continue to charge, and the Victron regulator automatically switches to a lower charge voltage mode called float mode to maintain the battery charge level and prevent overcharging. | ON | FLOAT | ON | Float |
| Mode II: This mode is activated when the battery’s SOC is within the normal range of 40 to 96 % and the power generated by the PV panels is lower than the load demand. In such a scenario, the PV panels alone are unable to meet the load requirement, and hence the battery is used to supplement the power supply. The battery operates in the discharge mode, while the PV converter operates in the MPPT mode, and the load remains connected. | ON | MPPT | ON | Discharge |
| Mode III: This mode is activated when the battery’s SOC is within the normal range of 40 to 90 percent and the power generated by the PV panels is higher than the load demand. In such a scenario, the load is powered solely by the PV panels, and any surplus power is utilized to charge the battery. The battery operates in the charging mode, while the PV converter remains in the MPPT mode. | ON | MPPT | ON | Charge |
| Mode VI: This mode is activated when the battery’s SOC drops below 40%, and the power generated by the PV panels is higher than the minimum power required, which is a fixed small value. In such a scenario, the load demand exceeds the PV power output, and the fully discharged battery cannot supplement the power supply. However, the PV panels can still generate power, which can be used to charge the battery after the load is disconnected. In this mode, the PV converter operates in the MPPT mode, and the battery is charging, while the load remains disconnected. | OFF | MPPT | OFF | Charge |
| Mode V: This mode occurs when irradiance is very low or non-existent. In this case, the system goes into complete off mode until solar radiation starts again. The battery charges during the day and is ready to supply the load in case of absence of solar radiation. | OFF | OFF | OFF | OFF |
Disclaimer/Publisher’s Note: The statements, opinions and data contained in all publications are solely those of the individual author(s) and contributor(s) and not of MDPI and/or the editor(s). MDPI and/or the editor(s) disclaim responsibility for any injury to people or property resulting from any ideas, methods, instructions or products referred to in the content. |
© 2023 by the authors. Licensee MDPI, Basel, Switzerland. This article is an open access article distributed under the terms and conditions of the Creative Commons Attribution (CC BY) license (https://creativecommons.org/licenses/by/4.0/).
Share and Cite
Chalal, L.; Saadane, A.; Rachid, A. Unified Environment for Real Time Control of Hybrid Energy System Using Digital Twin and IoT Approach. Sensors 2023, 23, 5646. https://doi.org/10.3390/s23125646
Chalal L, Saadane A, Rachid A. Unified Environment for Real Time Control of Hybrid Energy System Using Digital Twin and IoT Approach. Sensors. 2023; 23(12):5646. https://doi.org/10.3390/s23125646
Chicago/Turabian StyleChalal, Lamine, Allal Saadane, and Ahmed Rachid. 2023. "Unified Environment for Real Time Control of Hybrid Energy System Using Digital Twin and IoT Approach" Sensors 23, no. 12: 5646. https://doi.org/10.3390/s23125646