1. Introduction
The advancement of science and technology has led to a significant focus on intelligent transportation in transportation research. ITSs combine various technologies, including electronics, information technology, sensors, and system engineering, to monitor and manage traffic within the road infrastructure [
1]. Real-time intelligent monitoring of traffic flow and providing a basis for command decisions in traffic management are essential [
2]. For intelligent traffic management, accurate and efficient detection of traffic flow is crucial. The five primary categories that classify traffic detection technologies are radar [
3,
4], infrared [
5,
6], magnetic [
7,
8], video [
9,
10], and wireless sensor network detection technology [
11,
12]. However, conventional detection methods possess particular limitations. Distributed Acoustic Sensing technology was used in this study for traffic detection. The development of fiber optic sensing technology dates back to 1977, and it has progressed rapidly since then, paralleling the development of fiber optic communication technology. The degree of informatization of a country is often measured by its progress in this technology. DAS is an emerging fiber optic sensing technology that uses the entire fiber both as the sensing medium and transmission signal medium [
13]. Through the measurement of specific scattered light signals, DAS detects changes in its surrounding environment or the fiber itself. It is a fully distributed measurement technology that incorporates both sensing and transmission, making it capable of long-range measurement and monitoring [
14]. With a single measurement, it can acquire spatial parameters of the entire fiber distribution area and measure information up to tens or hundreds of kilometers away. Fiber optic sensing technology has been widely applied across various fields, including military, national defense, aerospace, industrial and mining enterprises, energy and environmental protection, industrial control, medicine and health, measurement and testing, construction, household appliances, and more. Its versatility has created a broad application market. Distributed acoustic sensing technology for traffic detection offers various advantages over traditional traffic detection technology. These advantages include affordability, compactness, corrosion resistance, tolerance to high temperatures and voltages, immunity to electromagnetic interference, sensitivity, and covertness [
15].
Several studies have shown that distributed acoustic sensing technology is suitable for real-time monitoring of traffic behavior. Wang and Zeng [
16] utilized DAS technology to record signals from urban traffic, seismic background noise, and artificial seismic sources successfully. Moreover, they accomplished near-surface structural imaging by implementing the technology in urban communication fiber optic cables. Revised sentence: Song and Zeng [
17] employed DAS technology, in combination with a highly reproducible air gun source, to construct a system for monitoring the high-resolution urban subsurface. The system provides frequent snapshots of near-surface in urban areas. Revised sentence: In addition, Zeng et al. [
18] demonstrated the feasibility of using DAS and 7.6 km of dark fiber in Tangshan, China, to detect seismic activity after the 12 July 2020, 5.1 magnitude earthquake. The experimental results indicated that post-earthquake monitoring using DAS and dark fiber reduces costs and time and helps mitigate disasters by capturing more aftershocks. Martin N. Lindsey, Shan et al. [
19] conducted a study on the sources of a waveform in Distributed Acoustic Sensing equipment deployed on a highway situated north of Fairbanks, Alaska. Their research revealed that cars driving on adjacent roads were the primary source of noise on the highway. Cai et al. [
20] proposed a DAS-based aircraft acoustic signal detection system and analyzed the acoustic characteristics of aircraft signals for continuous monitoring of aircraft off-airports. Experimental tests were conducted using an underground communication fiber that was 8.1 km long. Results showed that the seismic vibration signals, excited by the aircraft acoustics, had frequencies below 5 hertz and were primarily low-frequency signals. Liu et al. [
21,
22] proposed a vehicle detection and classification system that deployed DAS technology for detecting, classifying, and estimating vehicle speed. The cement mortar fixed the fiber optic at the mine in Nanshan and the campus of Beijing Jiaotong University. The validation data, collected using distributed fiber optic acoustic sensors, showed that the vehicle detection accuracy was more than 80%. The speed estimation error was below 5%, and the vehicle classification accuracy exceeded 70%. Cai et al. [
23] used Distributed Acoustic Sensing technology to detect campus security events by conducting field experiments. They monitored several aspects including emergency detection, vehicle localization, speeding alarms, and congestion alarms. The results showed that the detection accuracy of the system was high, thus indicating the practical significance of this approach. These experiments proved the potential of DAS for real-time monitoring of traffic behavior.
In the experimental setup of the aforementioned studies, optical fibers were utilized in various deployments. The coupling impact varies depending on the deployment, and the acquired data quality also varies. Optical fiber coupling can significantly improve the efficiency and accuracy of detection results. This is especially important in the field of transportation, where it can provide comprehensive solutions for urban traffic flow detection, structural health detection, traffic safety monitoring, early warning systems, and perimeter security detection, among others, with real-time accuracy. Enhancing our daily lives with superior convenience. Currently, acquiring high-quality vibration data is the main focus of research. The fiber structure and deployment method are two important factors that affect the performance of the DAS system. To acquire high-quality vibration data, it is crucial to improve the coupling quality between the fiber optic cable and the ground layer of the DAS system. Therefore, investigating methods for improving the coupling quality is essential [
24,
25,
26]. While research on different burial depths of optical fibers is available, there are limited studies on the deployment of traffic signals using different deployment methods of fiber optics. In November 2018, the Fiber Optic Sensing Association published Installation Considerations for Highways for Fiber Optics [
27], which compared the performance of various fiber deployment methods. However, it only provided a rough assessment without providing detailed data analysis of each method’s performance. Moreover, it did not consider comparing the underground communication fiber optic cable ducts. The purpose of this study is to compare vibration signal data obtained from three deployment methods with the use of DAS technology to overcome existing monitoring method limitations. The study found that the cement-bonded fixed fiber optic cable on the road shoulder provided the best vibration signal quality, which sheds light on DAS technology’s deployment in transportation.
The present paper is structured as follows:
Section 2 provides an introduction to distributed fiber optic sensors.
Section 3 presents the detecting algorithm, and
Section 4 details the experimental setup.
Section 5 analyzes the experimental results. Finally,
Section 6 concludes the paper and discusses limitations and future issues that require further attention.
2. Distributed Fiber Optic Sensors
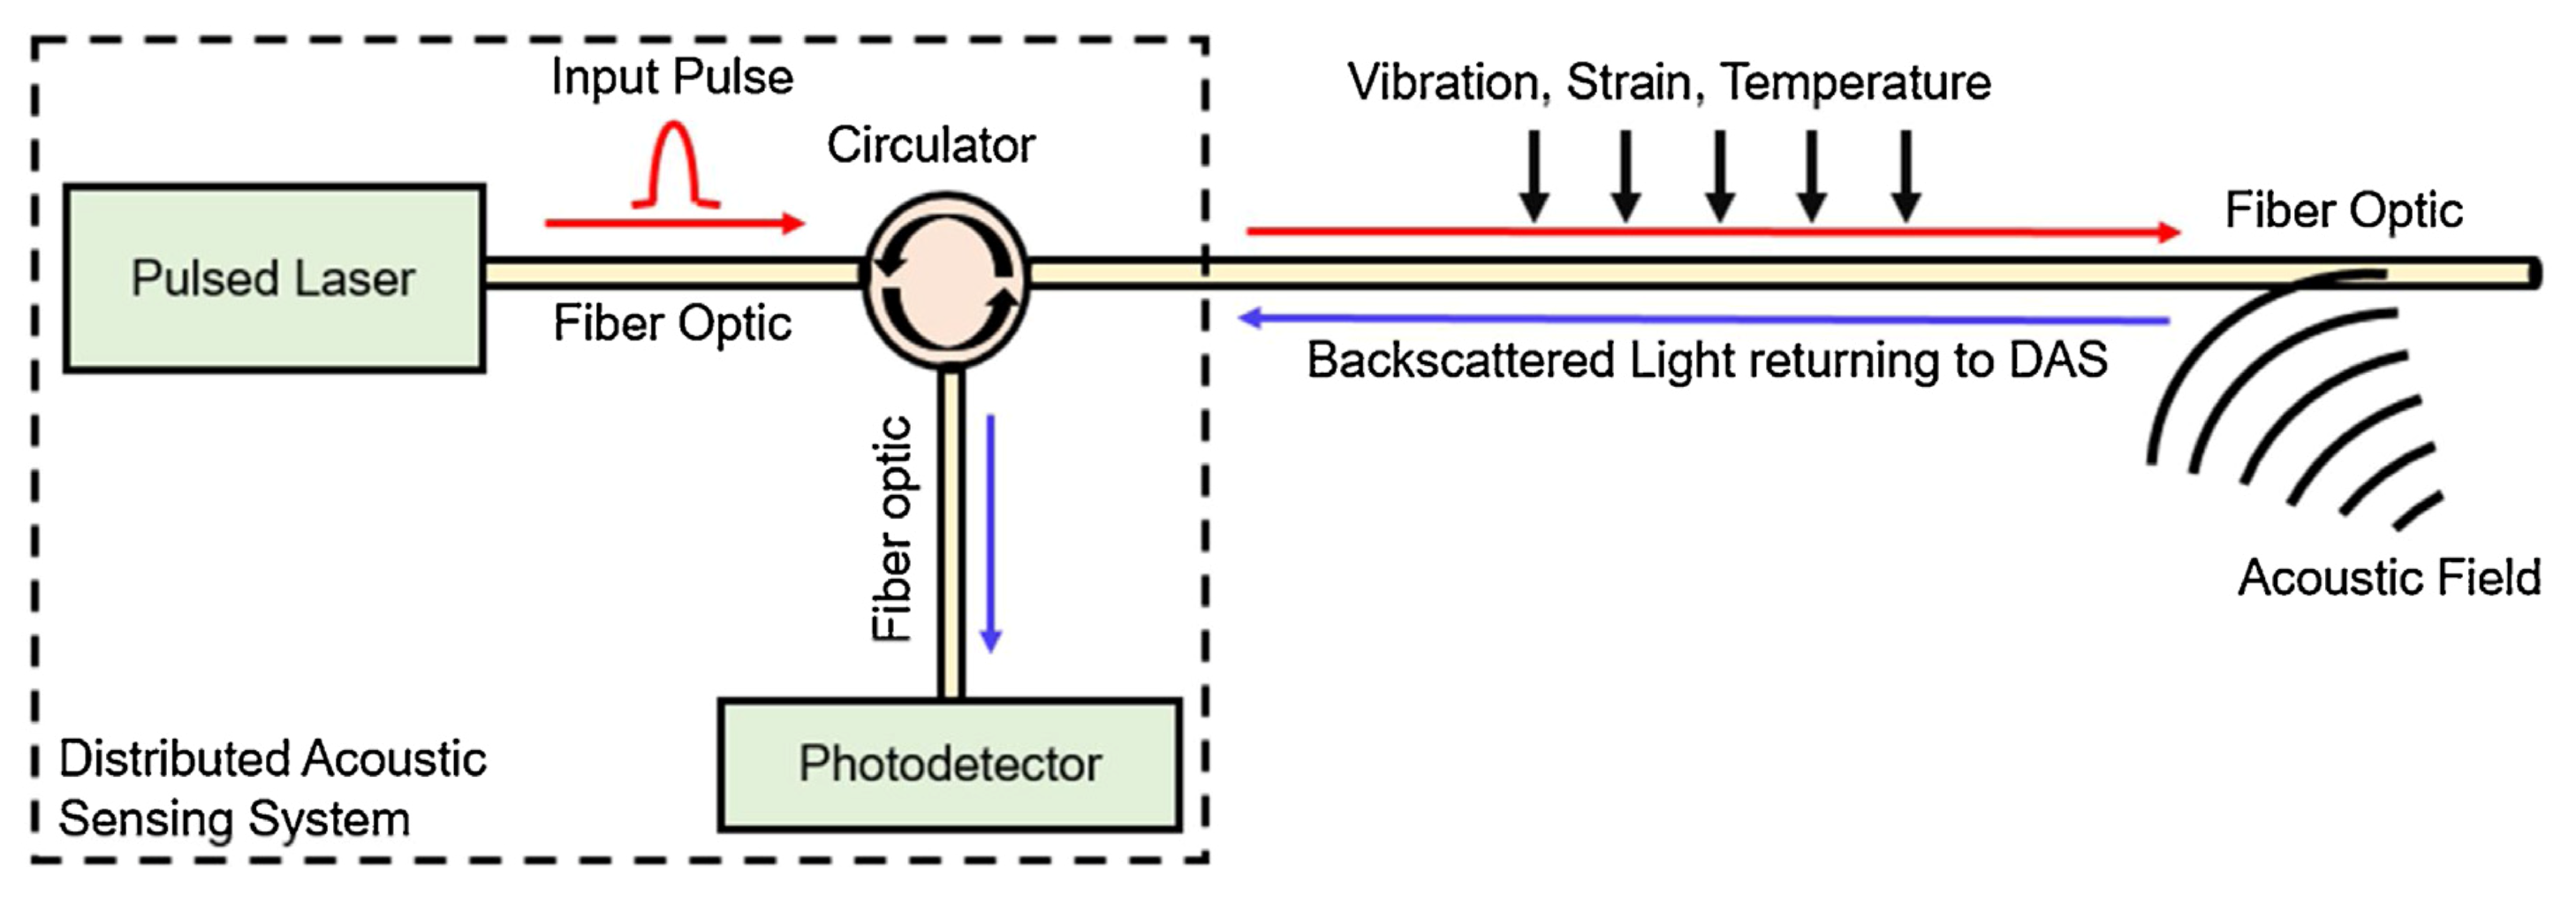
Distributed Optical Fiber Sensors (DOFS) rely on changes in the physical properties of light waves transmitted through optical fibers to detect external stimuli, including temperature, pressure, strain, and vibration. The schematic diagram of the Distributed Acoustic Sensing system is depicted in
Figure 1. DOFS can be classified into grating-based, backscattered light-based [
28], and interference-based sensing methods based on sensing principles. Currently, one of the more mature techniques is the Optical Time-Domain Reflectometer (OTDR) based on Rayleigh scattered light [
29]: it uses the entire optical fiber as the sensing medium and for transmitting signals. The Optical Time-Domain Reflectometer uses the properties of backscattered light, including light intensity, polarization state, phase change, and other related parameters, to change the sensing parameters. This, in turn, allows for measuring external physical quantities such as vibration signals [
30]. In 1993, H. F. Taylor et al. [
31], introduced the Rayleigh scattering-based phase-sensitive optical time-domain reflectometer (Φ-OTDR) technique and applied it to detecting vibration signals. The Φ-OTDR employs a narrow-band laser source that enables the analysis of the optical power of the backscattered light generated by interference along the time axis distribution profile [
32]. Subjected to external perturbations, an optical fiber’s position and refractive index are deformed, causing changes to the signal’s phase and amplitude. Analyzing changes in the Rayleigh scattering curve before and after a disturbance allows for detecting dynamic events, such as vibration signals present in structures. Distributed vibroacoustic sensing using Φ-OTDR technology offers benefits such as long sensing distance, high spatial resolution, high sensitivity, wide dynamic range, ability to work in adverse conditions, and respond quickly [
33]. In this study, utilizing a DAS system based on Φ-OTDR technology, we collect vibration signals from traffic and analyze the vibration signal quality of three different DAS optical cable couplings.
Figure 2 shows the system scheme of the distributed acoustic sensing system used in this paper, which is based on the phase-generated carrier algorithm and Φ-OTDR technology. The system comprises a laser source (Laser), an acousto-optic modulator (AOM), an Erbium-doped fiber amplifier (EDFA), a circulator (CIR), a fiber Bragg grating (FBG), a Michelson interferometer, a photodetector, and a data acquisition and signal processing module, as shown in
Figure 2. The narrow linewidth continuous-wave laser output is modulated by the AOM to generate pulse light (pulse width: 50 ns, repetition frequency: 10 kHz). The pulse light enters the EDFA via an isolator to complete the optical amplification process. The amplified pulse light is transmitted through the circulator into the FBG to eliminate the forward ASE and spontaneous emission noise from the EDFA. Subsequently, the light is transmitted into the sensing fiber through the three ports of the circulator, and the backward Rayleigh scattering from the sensing fiber is transmitted through the fourth port of the circulator into the Michelson interferometer. The Michelson interferometer comprises a coupler and two Faraday rotation mirrors (FRMs), which rotate the polarization state of the incident light by 45 degrees each. The FRMs in the Michelson interferometer produce a 90-degree polarization change, compensating for the polarization changes in both directions and addressing the polarization fading problem. The coherent Rayleigh scattering light output from the interferometer is detected by the photodetector and then converted into an electrical signal via a data acquisition card. The signal processing unit performs the phase demodulation along the fiber link through the phase-generated carrier (PGC) algorithm.
Figure 2 shows a pulse signal as 1 and a sinusoidal signal as 2, allowing us to distinguish between the two signals.
The PGC demodulation algorithm [
34] was utilized to recover the phase information of the sensing information propagating along the optical fiber. The interference signal was split and separately multiplied by both a fundamental carrier and a second-harmonic carrier of the PGC signal. The resulting signal was filtered using two identical low-pass filters (LPF) to remove undesirable high-frequency spectrum. The cut-off frequency of the two low-pass filters is crucial and should be less than half of the PGC signal frequency, generating the in-phase and quadrature components. Then, the arctangent operation was used to calculate the phase. Next, a filter was designed to filter out the low-frequency shift of the phase, improving the signal-to-noise ratio of the sensing information.
3. Detection Algorithm
This study employs an improved wavelet threshold algorithm for vehicle detection at traffic signals. Distributed acoustic sensing technology is utilized to acquire vehicle vibration data, which serves as the foundation for further analysis. The wavelet thresholding algorithm is then applied to denoise the data obtained by DAS. A comparative analysis of signal data acquired through three distinct optical fiber deployment methods is conducted to determine the optimal vehicle detection method. The flow chart of the detection process is depicted in
Figure 3.
3.1. Improved Wavelet Thresholding Algorithm
The selection of the threshold function is critical in constructing the continuity and accuracy of the signal and has a significant impact on the effectiveness of wavelet denoising. Currently, there are two primary methods for selecting the threshold, namely: the hard threshold and the soft threshold. The hard threshold method compares the absolute value of the signal with the threshold, sets the signal that is less than or equal to the threshold to zero and retains the signal that is greater than the threshold. However, the discontinuity of the hard threshold method results in obvious noise in the denoised signal. On the other hand, the hard threshold is capable of retaining the local information of the image edges and details while producing visual distortions such as the ringing effect. Unlike the hard threshold, the soft threshold method sets the signals whose absolute value is smaller or equal to the threshold to zero, and for the signals greater than the threshold, it sets them as their own difference with the threshold, thereby allowing the signals to shrink towards zero. Although the soft threshold has better continuity than the hard threshold, its derivative is discontinuous. Consequently, it is estimated that there is a constant deviation between the noisy and denoised wavelet coefficients. Additionally, the fixed value compression of coefficients greater than the threshold and the decrease in noise with increasing wavelet coefficients are inconsistent with the facts. As a result, while the soft threshold technique produces relatively smoother denoised signals, it may also lead to blurry edges and distortion. The mathematical expressions for these two threshold functions are presented in the table below.
The equation of the hard thresholding method is as follows.
where
is the estimated wavelet coefficient,
is the wavelet coefficient and
is the given threshold value.
The soft thresholding method is formulated as follows.
where
is a symbolic function.
While traditional hard and soft thresholding methods have demonstrated their effectiveness in real-world applications, these methods come with their own potential drawbacks. Specifically, obtained using the hard thresholding method is discontinuous at . Consequently, reconstructing the signal utilizing this discontinuous can lead to the Pseudo-Gibbs phenomenon, causing oscillations in the final signal at locations of discontinuity or rapid change. Similarly, though obtained via soft thresholding has good continuity and produces a relatively smooth denoised signal, and always exhibit a constant bias, which can cause the signal to be excessively smooth at certain peak points, thus losing some original signal features. Overall, using either hard or soft thresholding methods for denoising is suboptimal when it comes to noise reduction.
This study uses an improved wavelet thresholding function proposed by group member Liu [
21,
22] to address the limitations of conventional thresholding denoising. The function is defined by the following equation [
21]:
where
is an adjustment factor. The value of
adjusts the overall convergence of the function to the speed of the original wavelet coefficients. When
tends to 0, the improved wavelet threshold function becomes a hard threshold function; when
tends to infinity, the improved wavelet threshold function becomes a soft threshold function.
The improved wavelet threshold function overcomes the limitations of hard thresholding, which is limited by its discontinuity at the threshold. Additionally, the improved smoothness of the reconstructed signal mitigates the drawbacks of using a soft threshold. The denoising algorithm that employs the improved wavelet threshold function consists of three steps: specifically, decomposing the wavelet signal, thresholding its coefficients, and reconstructing the signal after thresholding. The effectiveness of the algorithm is demonstrated through numerous simulation experiments.
3.2. Simulation Experiments of the Improved Thresholding Denoising Algorithm
The original signal displayed in
Figure 4 was simulated. We added white noise to the original signal using MATLAB simulation software. Next, we subjected the resulting signal to three thresholding methods: hard, soft, and improved threshold. These methods were used to evaluate the effectiveness of the improved threshold function in the wavelet denoising algorithm. Three thresholding algorithms were implemented in MATLAB, including hard thresholding, soft thresholding, and improved wavelet thresholding. The computation times for the three methods for the same data set and on the same machine were recorded, with hard thresholding taking 0.17732 s, soft thresholding taking 0.17758 s, and improved wavelet thresholding taking 0.17798 s.
Figure 4 shows the results of the simulated denoising process using hard, soft, and improved thresholding methods. Specifically, the figures demonstrate that hard and soft thresholding led to different degrees of waveform distortion, while the improved thresholding algorithm achieved superior denoising outcomes.
Furthermore, to quantify the denoising outcomes, we assess the denoising algorithm using two metrics: signal-to-noise ratio (SNR) and root mean square error (RMSE). The formulas can be expressed as:
where
is the original signal,
is the estimated signal after wavelet threshold denoising, and
n is the sampling point.
Table 1 summarizes the experimental results of denoising signals using different thresholding methods. The results in
Table 1 indicate improvements in signal-to-noise ratio and reductions in root-mean-square error were observed with the improved thresholding method, compared to traditional thresholding methods. Therefore, the improved threshold denoising method achieved superior denoising outcomes.
Figure 4 and
Table 1 show that the improved wavelet threshold denoising signal successfully reconstructed the signal peak with smooth features. The combined use of the improved threshold denoising and the traditional wavelet threshold denoising exhibited several advantages, resulting in a superior filtering effect when compared to using traditional wavelet threshold denoising alone.
4. Experimental Setup
Experiments were conducted at Beijing Jiaotong University to validate the algorithm’s efficacy and compare the quality of detected signals in the distributed acoustic sensing system deployed under different methods. The DAS system’s laser pulse has a duration of 50 nanoseconds, and a pulse repetition rate of 10 kHz The data acquisition sensors were optical fibers. In the experiment, field-deployed common armored sensing optical fiber and communication optical cable laid in the underground cable trench on the campus of Beijing Jiaotong University were used. The DAS equipment used in the experiment was provided by the Optoelectronic System Laboratory of the Chinese Academy of Sciences Semiconductor Research Institute. The model of the DAS equipment used in this study is the SemiDAS-S001 model, manufactured by the Chinese Academy of Sciences Semiconductor Research Institute. The fibers were deployed using various methods in different locations such as the Information Center, Dormitory 19, Dormitory 8, and Jixiu Road. Three distinct methods were used to lay the optical fibers on the Beijing Jiaotong University campus. These methods included uncoupled fiber on the road, underground communication fiber optic cable ducts, and cement-bonded fixed fiber optic cable on the road shoulder. During the experiment, the recorded channels were numbered from 90 to 480, with every 30 s constituting a group of vehicle detection data and each channel covering 1.6 m. The illustration in
Figure 5 demonstrates three different fiber deployments. The fiber exposed in the air is the uncoupled fiber on the road with a distance of 3.75 m from the road’s center, and the fiber covered by the cement block is the underground communication fiber optic cable ducts with a distance of 4.01 m from the road’s center, and the fiber in the soil layer is the cement-bonded fixed fiber optic cable on the road shoulder with a distance of 3.52 m from the road’s center. A total of 480 fiber optic channels were laid out, out of which 390 channels were recorded. Among the recorded channels, the ones for the cement-bonded fixed fiber optic cable on the road shoulder ranged from 95 to 170. On the other hand, the uncoupled fiber on the road had channels numbered between 171 and 250, while the underground communication fiber optic cable ducts had channels numbered between 380 and 475.
Figure 6 provides a visual representation of the cable layout wherein the left figure illustrates the cement-bonded fixed fiber optic cable on the road shoulder, the middle figure depicts the uncoupled fiber on the road, and the right figure depicts the underground communication fiber optic cable ducts.
Figure 7 illustrates the DAS system’s hardware and software platform. The hardware system is located below, while the software system is situated above. The DAS equipment used in the experiment was provided by the Optoelectronic System Laboratory of the Chinese Academy of Sciences Semiconductor Research Institute. The model of the DAS equipment used in this study is the SemiDAS-S001 model, manufactured by the Chinese Academy of Sciences Semiconductor Research Institute. During the optical fiber installation, the fiber was connected to the DAS host at one end, while the other was bent. The DAS system employs a time interval of 0.2 ms to collect data at each acquisition point, resulting in 5000 data samples per second. The unit utilized by the DAS system is the phase difference. The DAS system’s laser pulse has a duration of 50 nanoseconds and a pulse repetition rate of 10 kHz. The study recorded the vibration signals of vehicles passing by. The detection area comprised 390 sampling points, and the interval between sampling points was 1.6 m, with a sampling frequency of 5000 Hz. The study analyzed data from 5 November to 8 November 2018, comprising 50 sets of signal data from five vehicles passing through the monitoring area. The experiments involved detecting vehicle passing and background noise. To ensure the authenticity and reliability of the data, video footage was used to capture the traffic conditions.
6. Conclusions
This paper presents the usage of an improved wavelet threshold algorithm to compare the signal quality of three different fiber optic placement methods. The effectiveness of the algorithm is validated through comparisons of signal-to-noise ratio (SNR) and root-mean-square (RMS) errors produced by different threshold denoising algorithms. The experiments were conducted using a DAS (distributed acoustic sensing) system on the campus of Beijing Jiaotong University, where vibration signals induced by vehicle motion were detected through the uncoupled fiber on the road, the underground communication fiber optic cable ducts, and the cement-bonded fixed fiber optic cable on the road shoulder.
The experiment results from the three different placement methods were then analyzed using the improved wavelet threshold algorithm. The comparison of SNR, energy, and noise analysis were conducted to compare the difference in vehicle signals picked up by each fiber optic placement method. The experimental results demonstrate that the improved wavelet threshold denoising algorithm yields superior denoising outcomes compared to the conventional wavelet algorithm. The signal-to-noise ratio (SNR) and energy levels obtained from the cement-bonded fixed fiber optic cable on the road shoulder are the highest. The obtained vehicle vibration signal’s quality from the cement-bonded fixed fiber optic cable on the road shoulder is the best. The ground layer filters a portion of the signal, leading to a lower amount of received vehicle signal and noise by the underground communication fiber optic cable ducts. Therefore, the signal-to-noise ratio (SNR) of the underground communication fiber optic cable ducts is higher than that of the uncoupled fiber on the road. However, the energy of the signal in the uncoupled fiber on the road is higher than that in the underground communication fiber optic cable ducts. As illustrated in
Figure 8, the underground communication fiber may result in a signal loss in certain channels due to weak coupling, causing the signals to be undetectable.
Therefore, the cement-bonded fixed fiber optic cable on the road shoulder is preferred for practical applications, followed by the uncoupled fiber on the road, with the underground communication fiber optic cable ducts as the last resort.
In future research, we will compare additional diverse fiber optic deployment methods and develop complete theoretical models to determine the optimal approach for using distributed acoustic sensing across different industries, with the goal of maximizing efficiency. However, this study identified the following limitations: (1) The study was limited to a university campus, and the environment, including the road surface material, may have affected the fiber optic coupling. (2) The fiber optic deployment distance was short, and the sample size was small. (3) The experimental conditions were limited to straight-line travel at a constant speed.

 ,
, 


