
Graphene-Based Strain Sensing of Cementitious Composites with Natural and Recycled Sands

 , and
, and 
Abstract
:1. Introduction
2. Materials and Methods
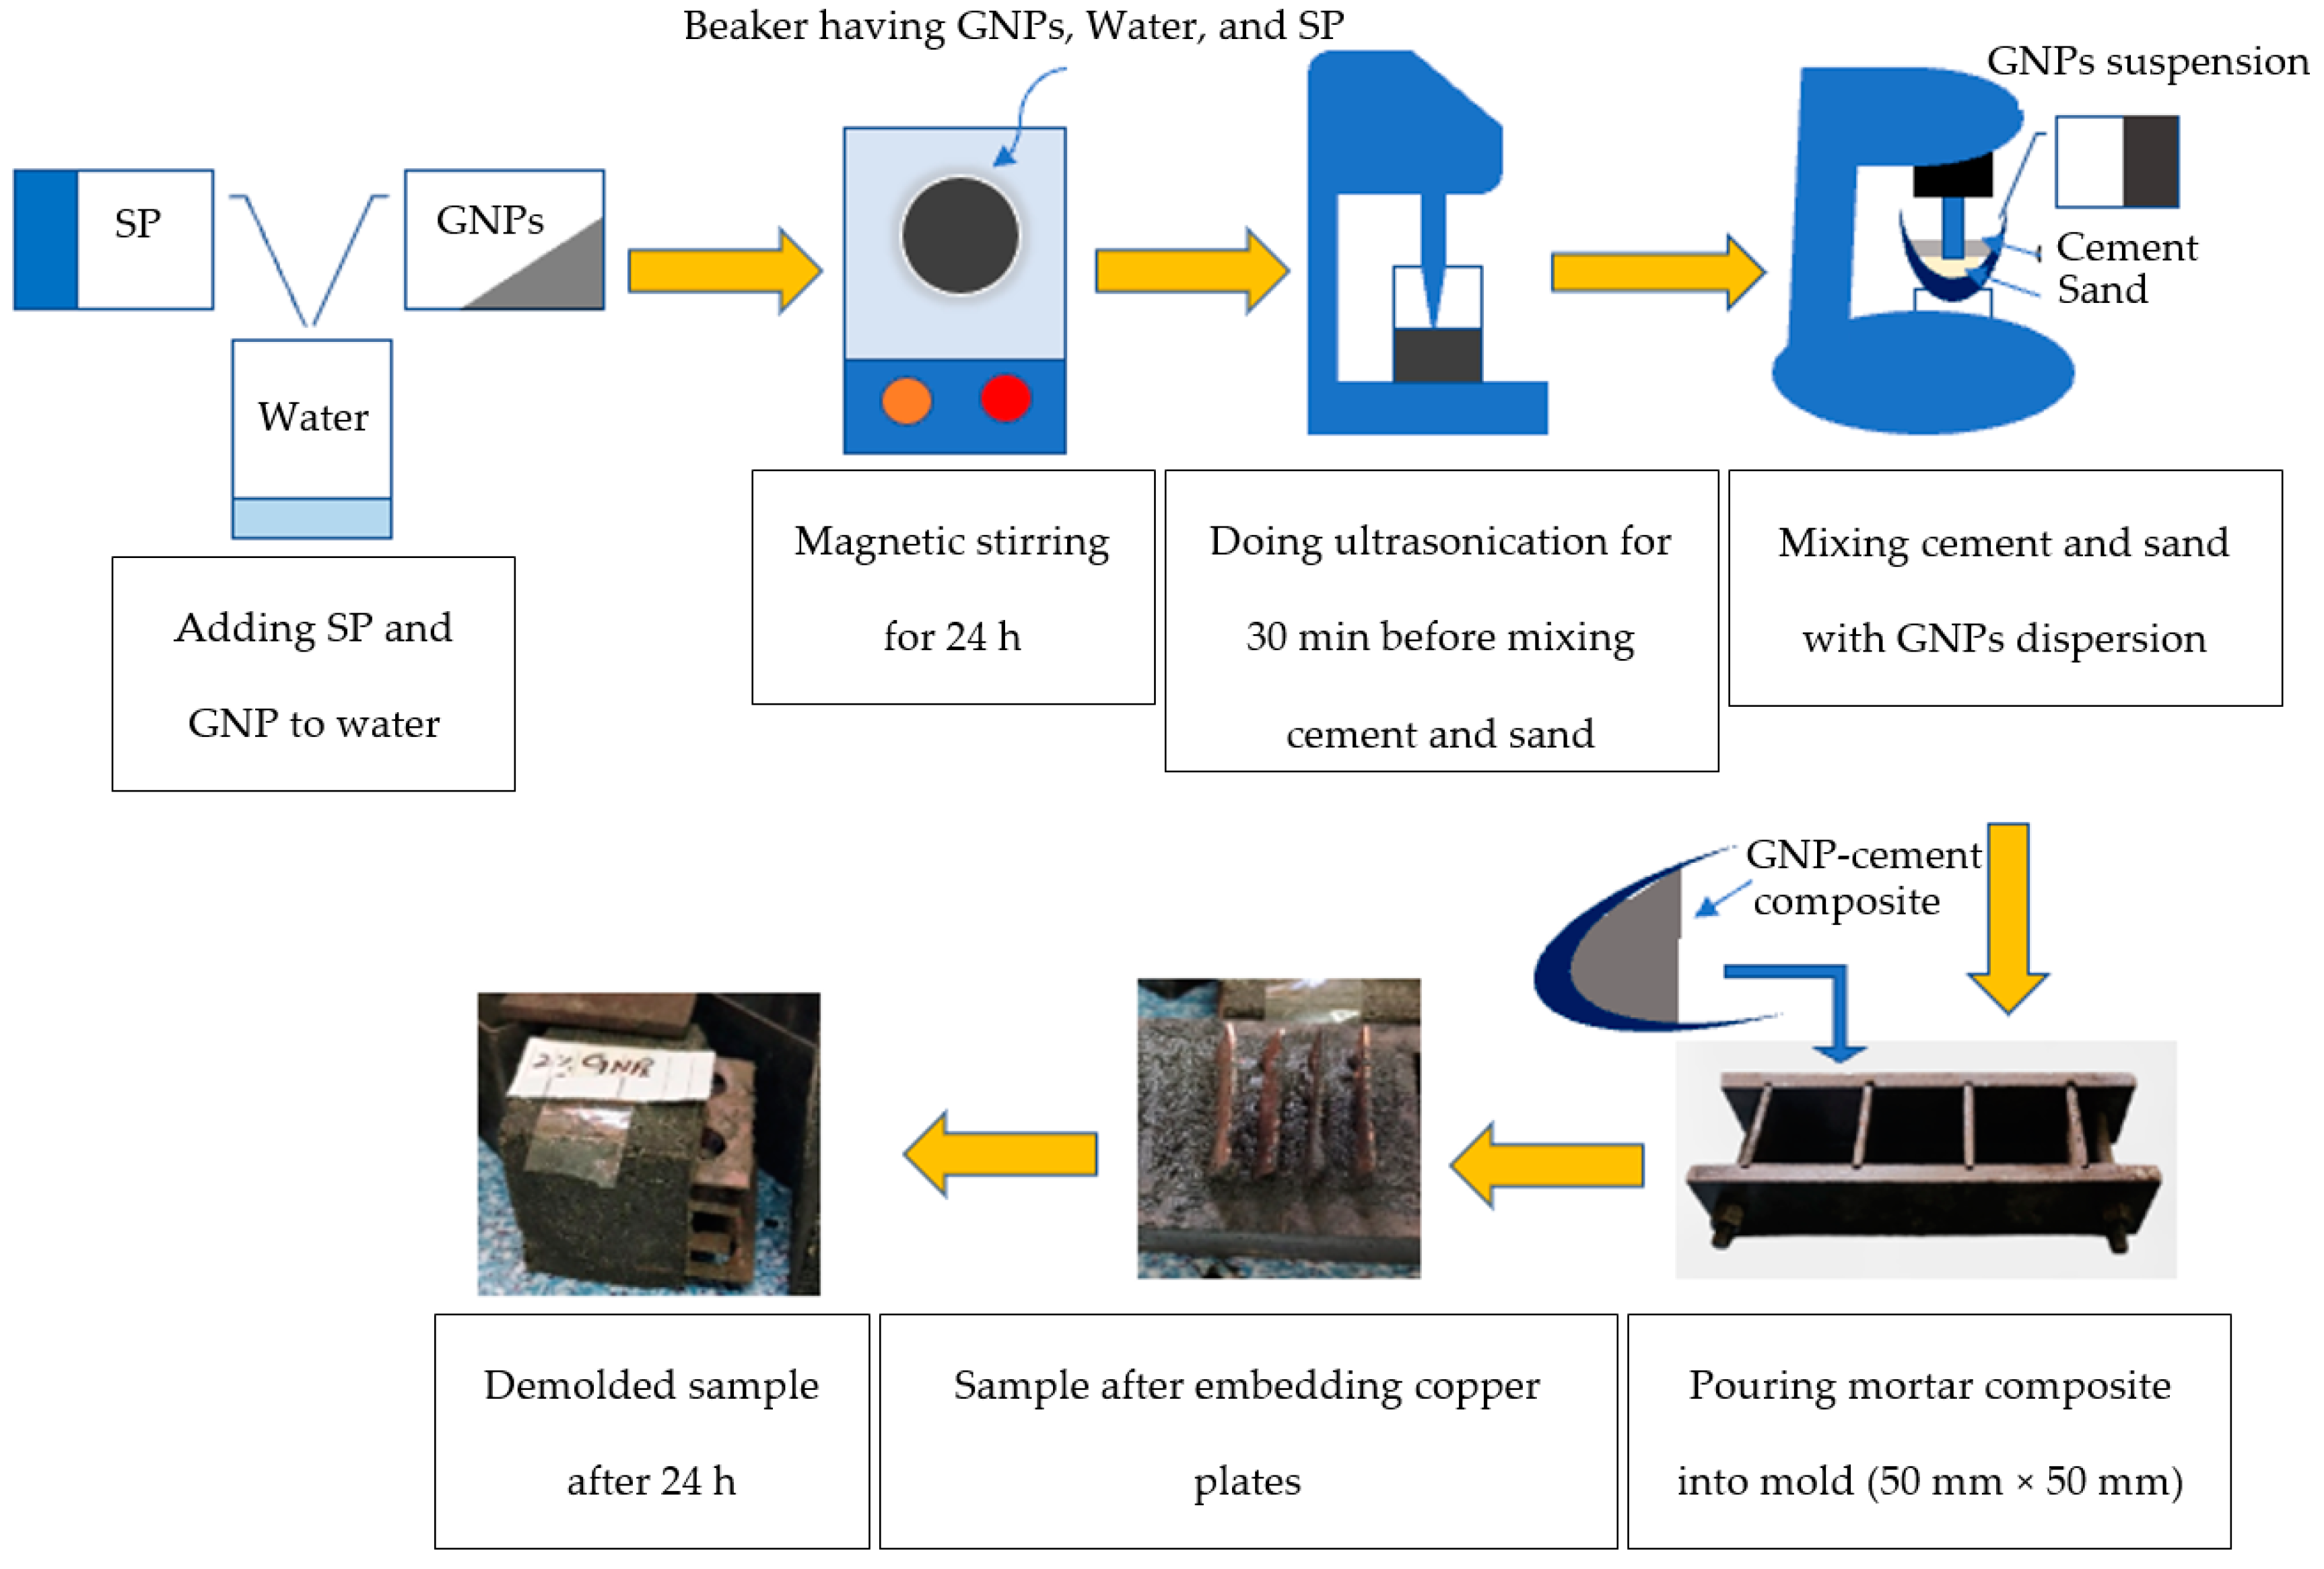
2.1. Preparation of Specimens
2.1.1. Dispersion of GNPs
2.1.2. Ultrasonication Process
2.2. Methodology
2.2.1. Compressive Strength Testing
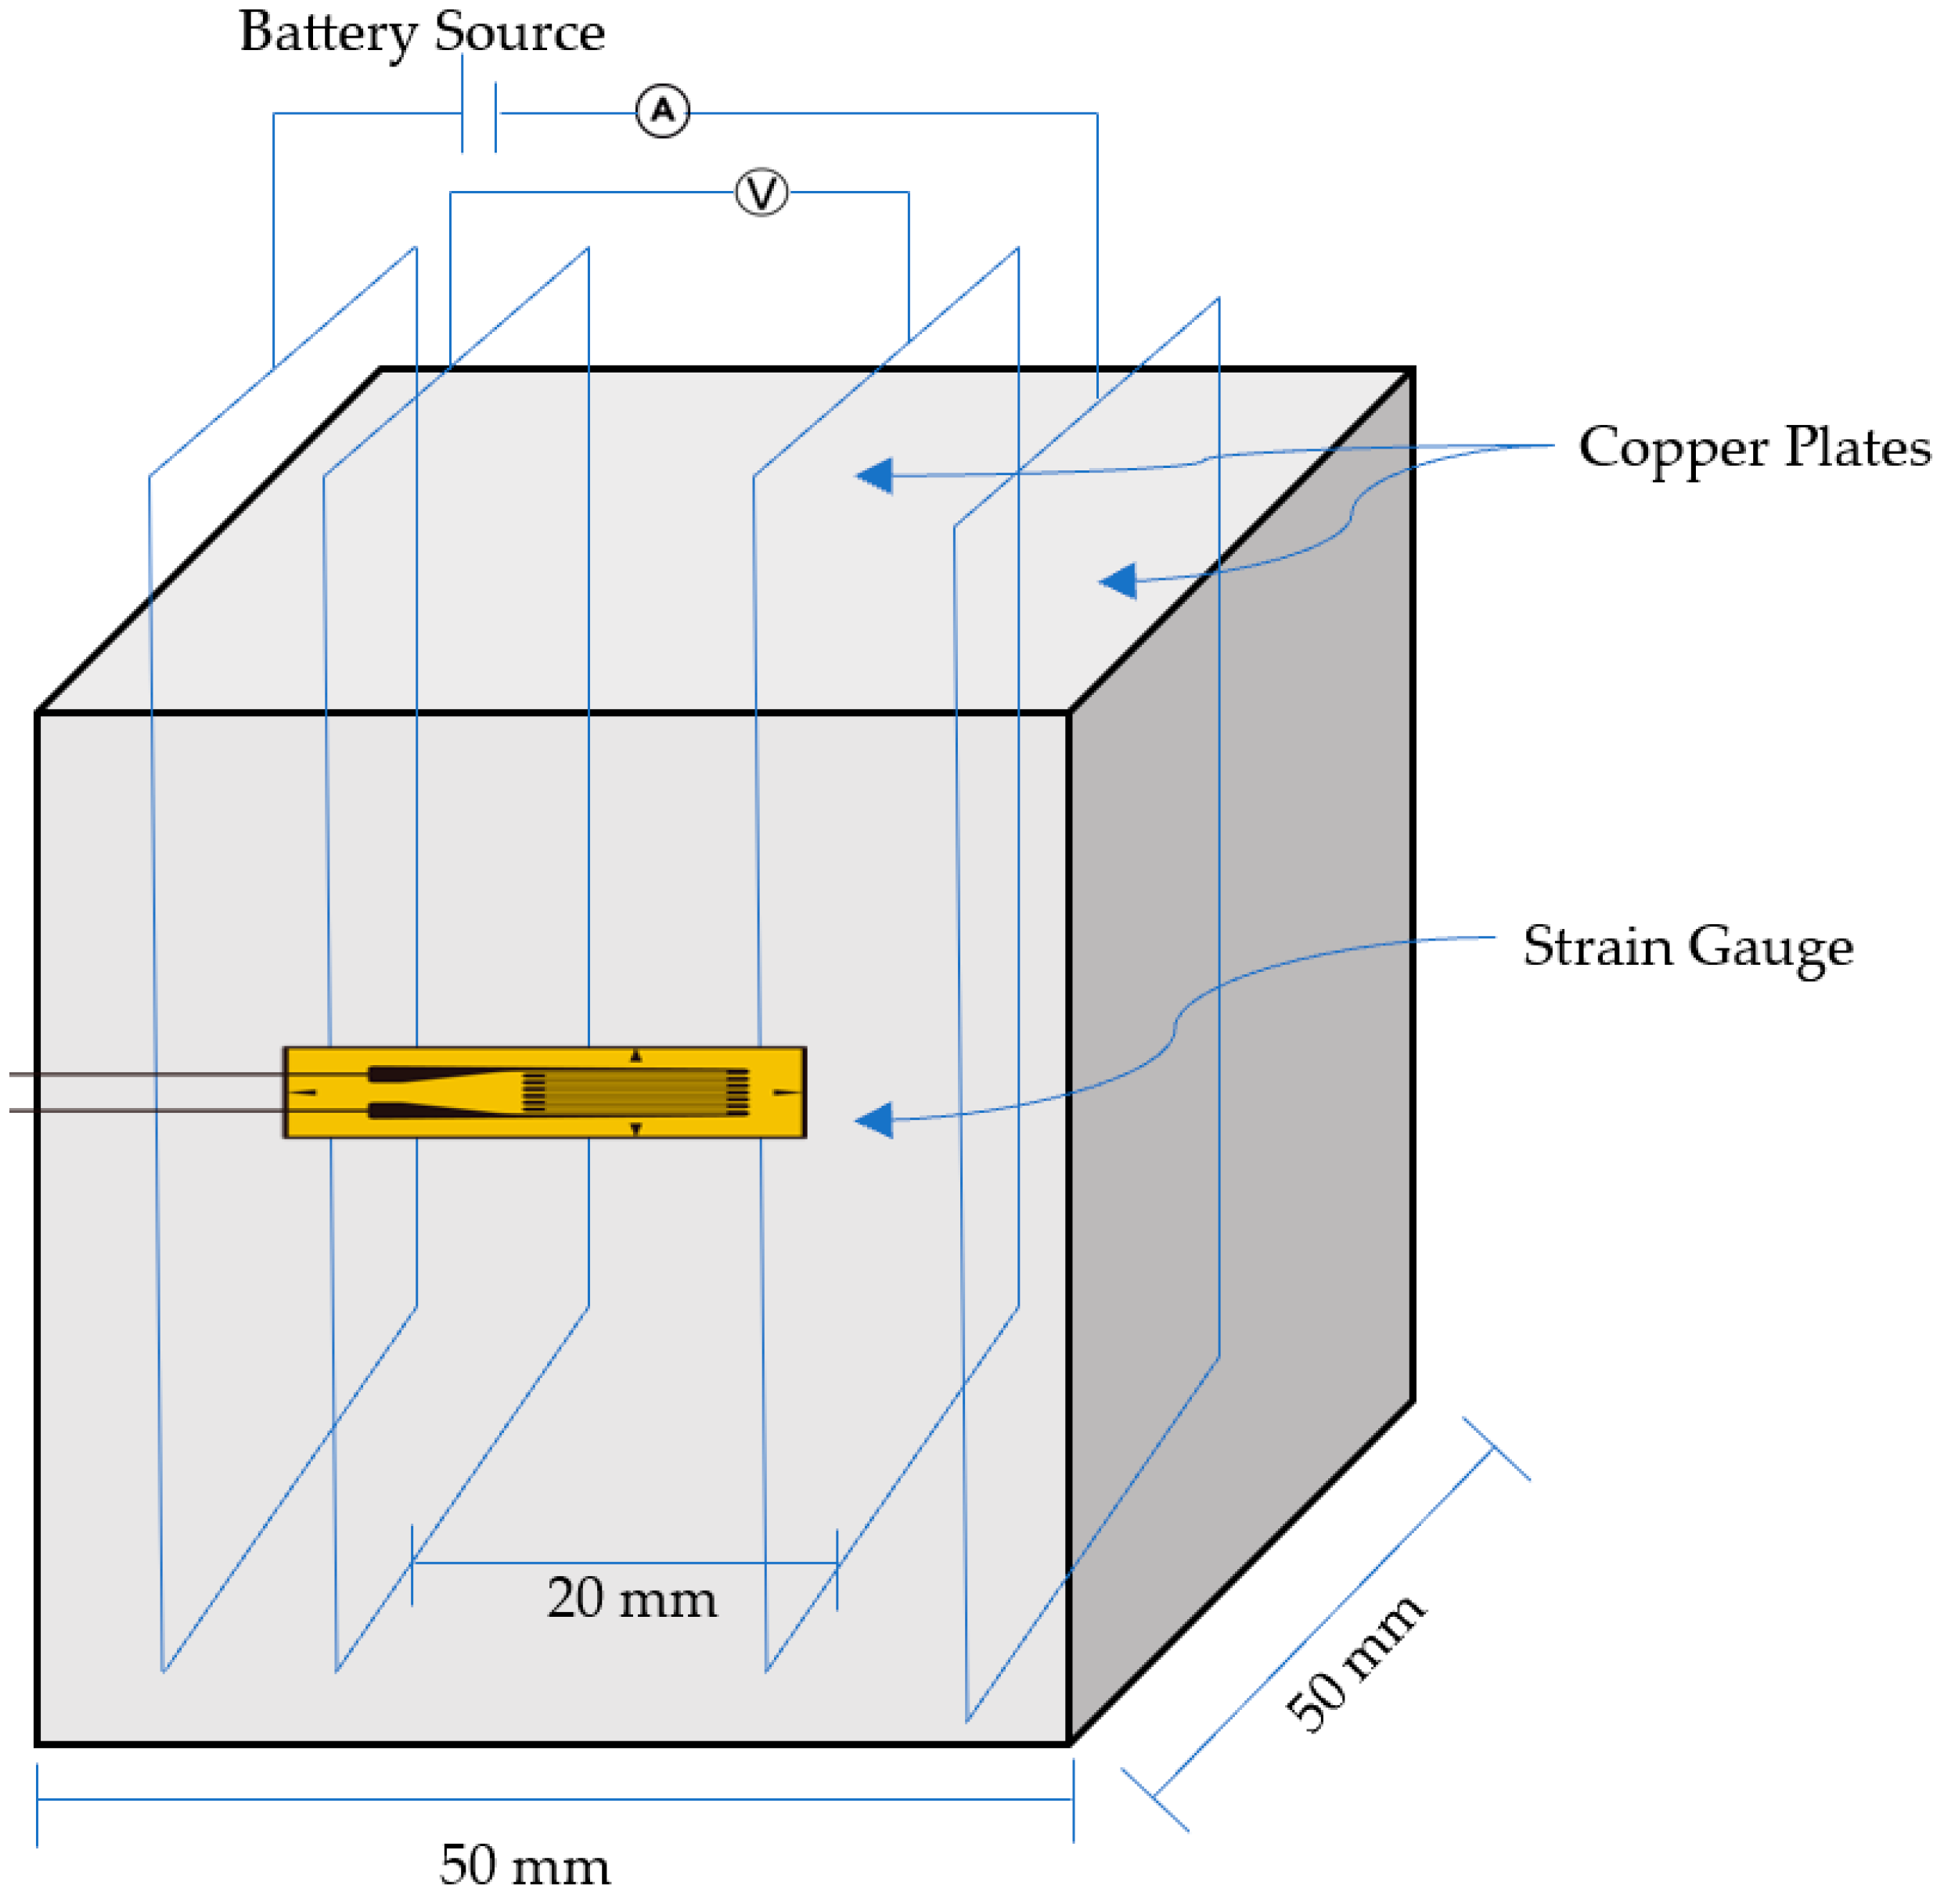
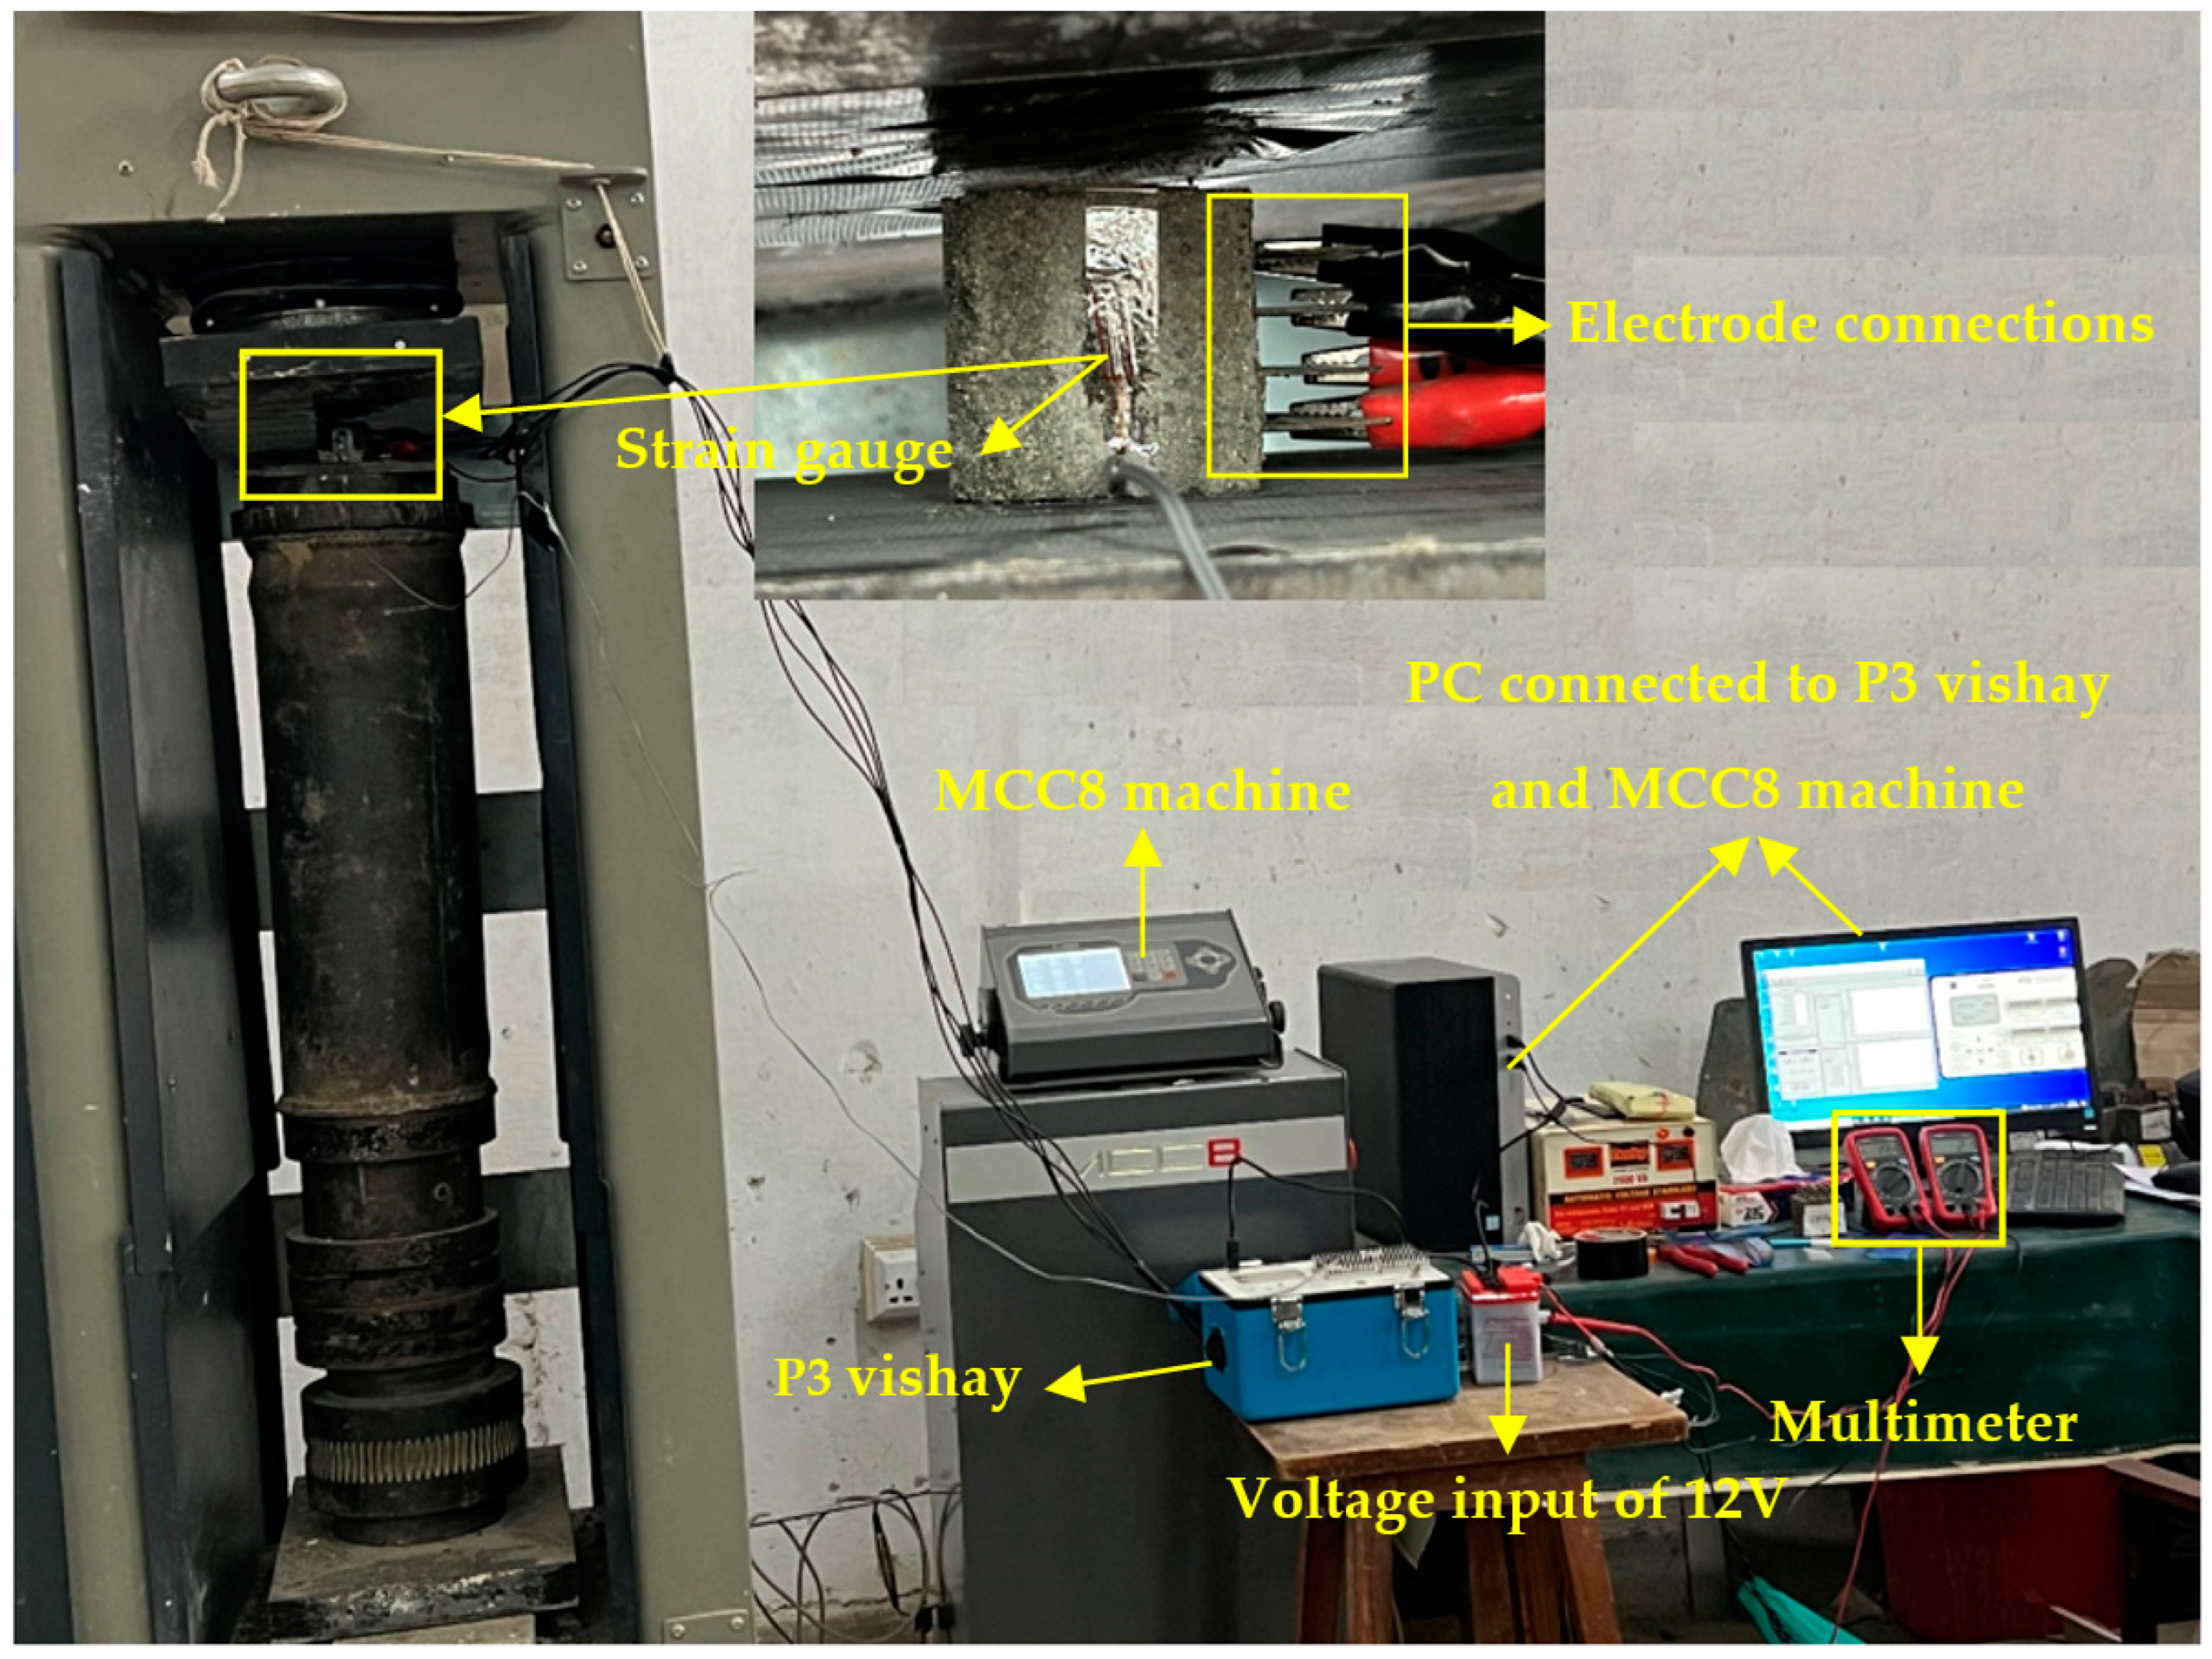
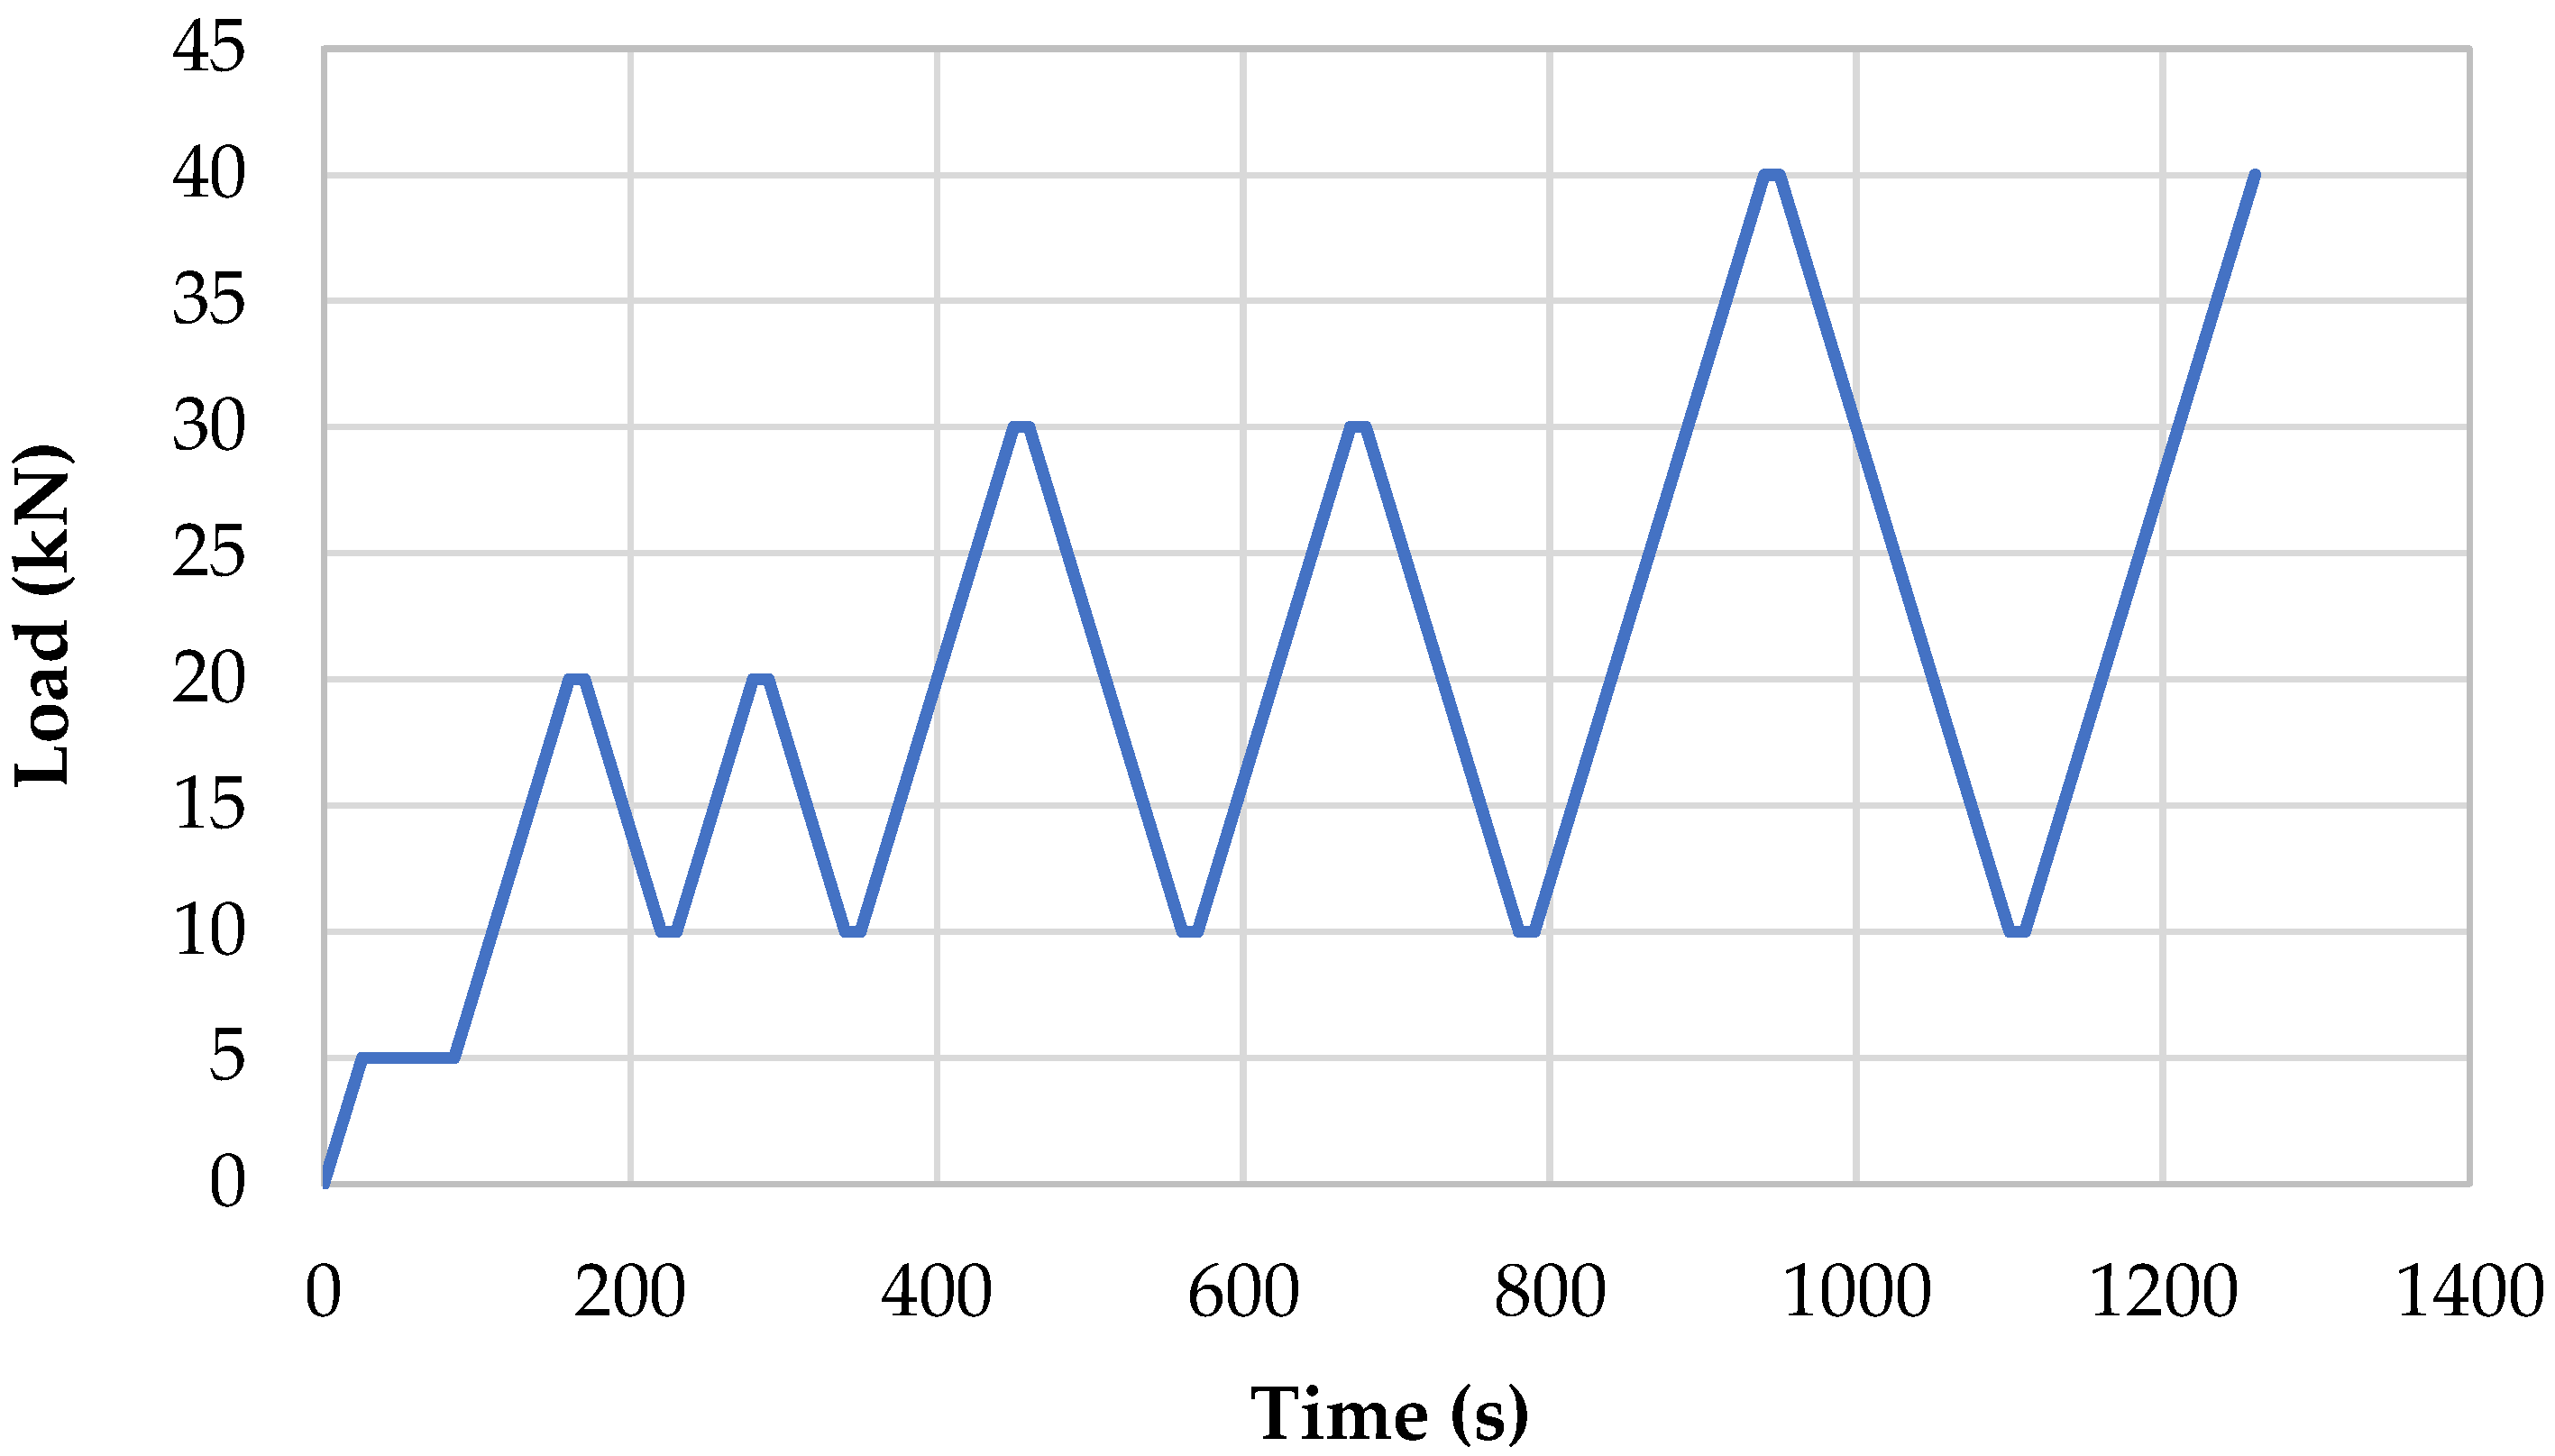
2.2.2. Piezoresistive Testing
- —resistivity;
- —resistance value;
- A—area (25 mm × 50 mm);
- L—length (25 mm).
- FCR—change in resistivity;
- — change in resistivity over time;
- —initial resistivity value.
3. Results and Discussion
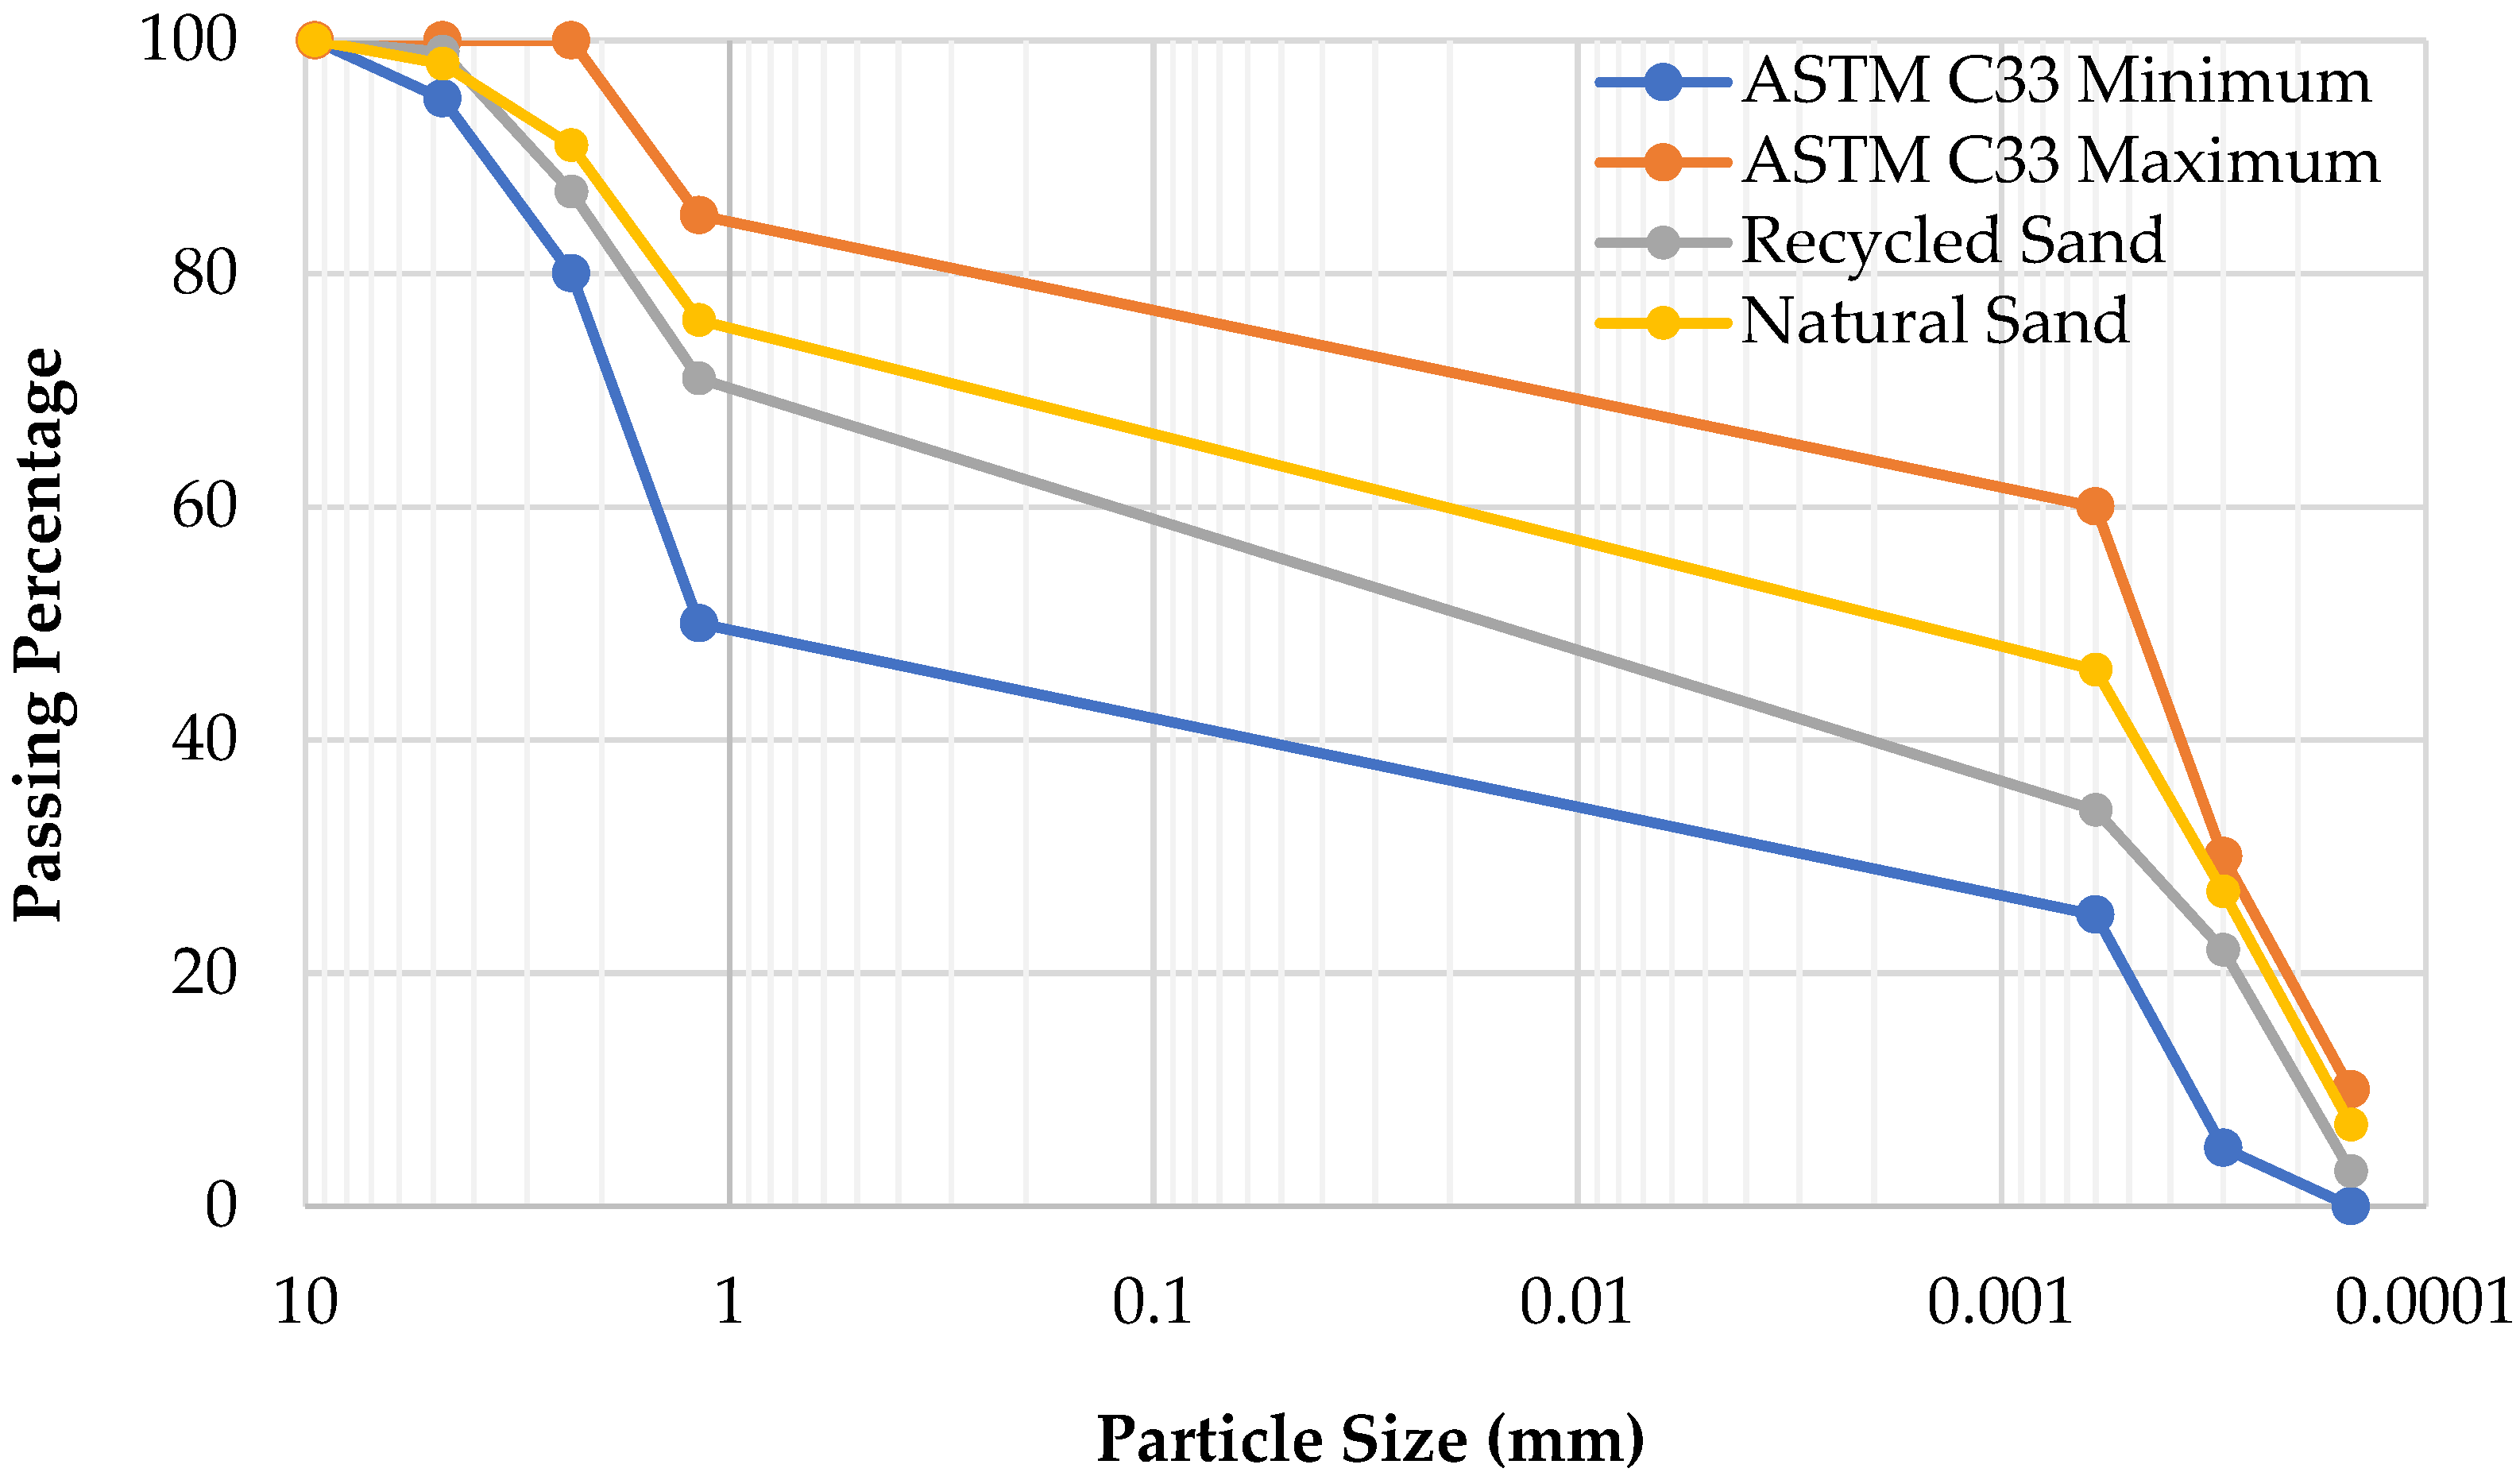
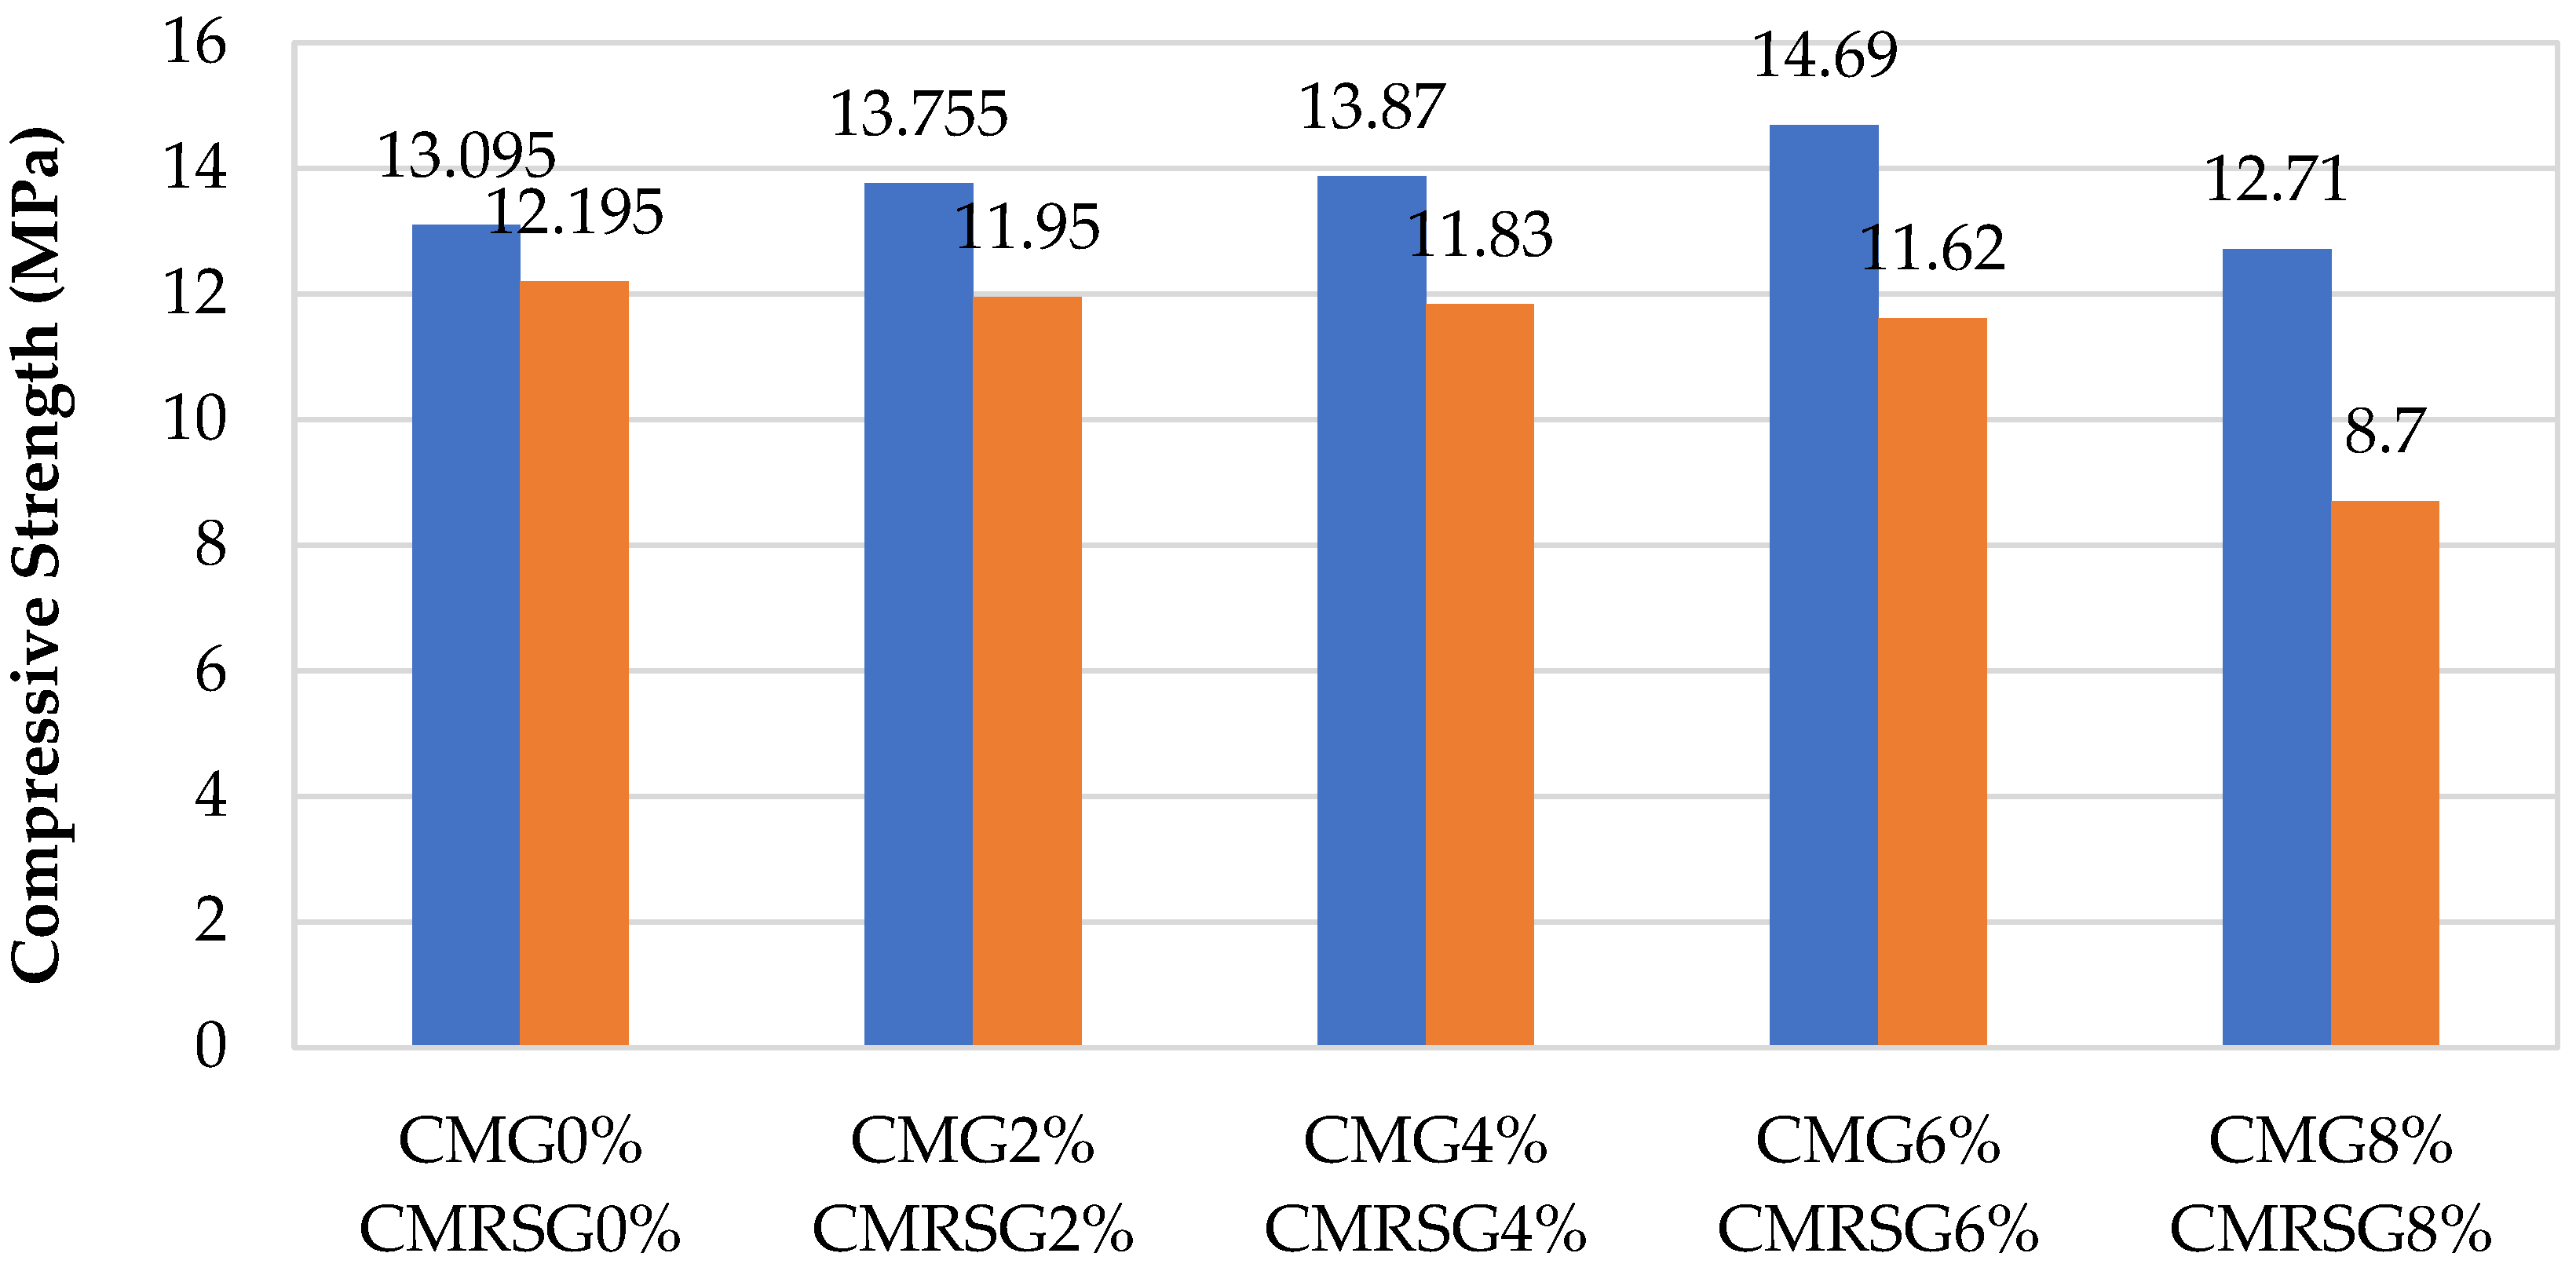
3.1. Compressive Strength of Specimens Having Natural Sand
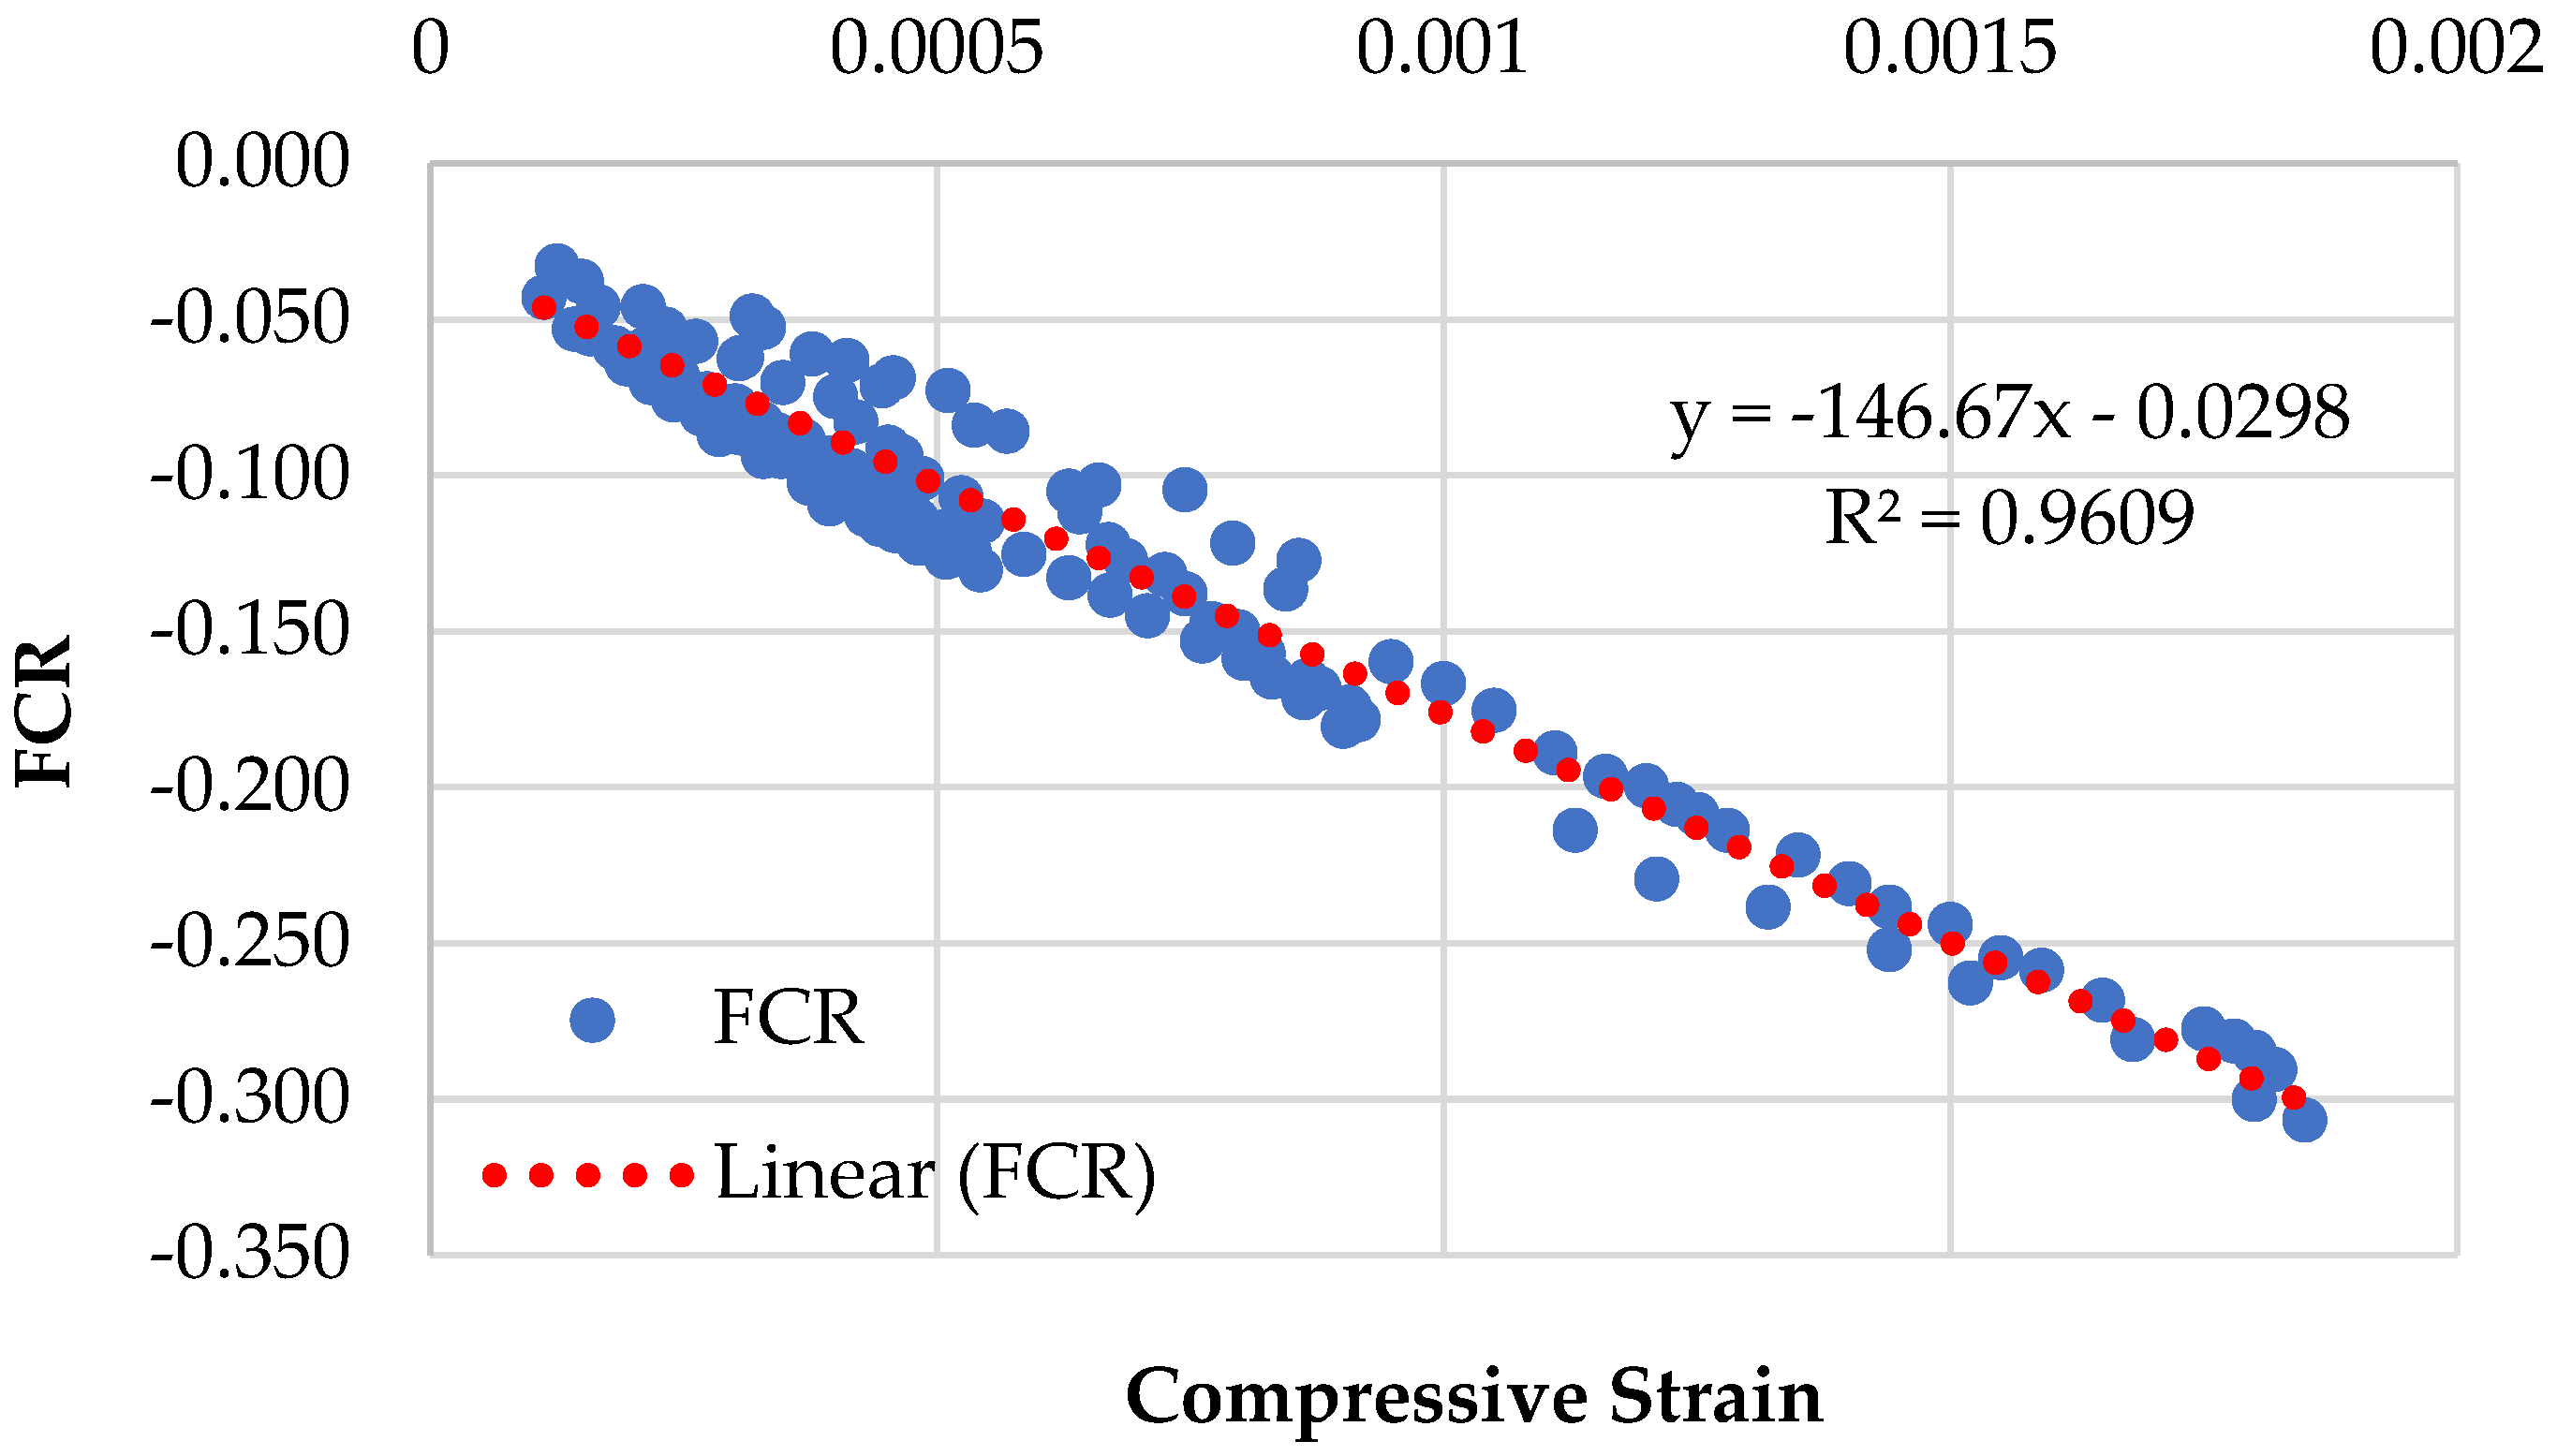
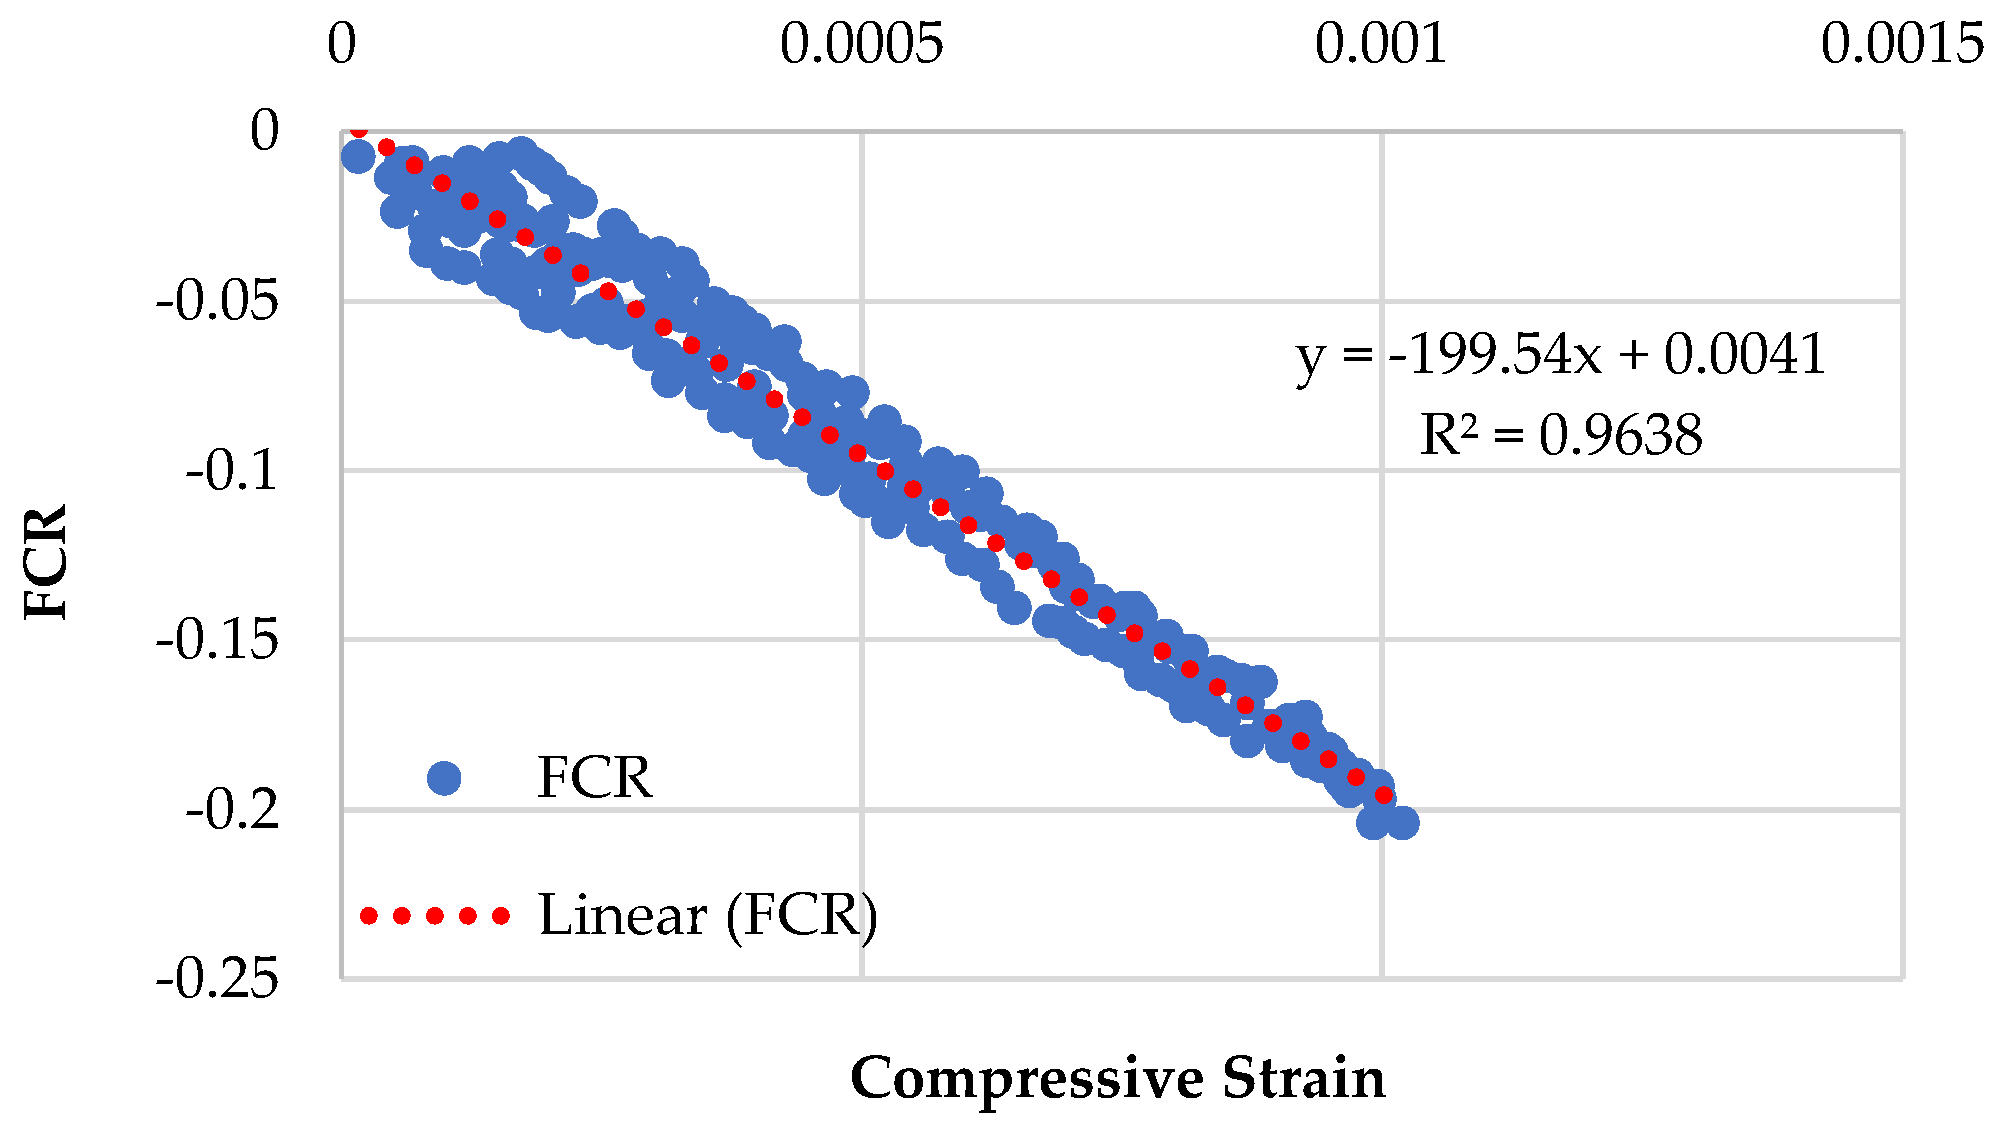
3.2. Piezoresistive Behavior of Specimens Having Natural Sand
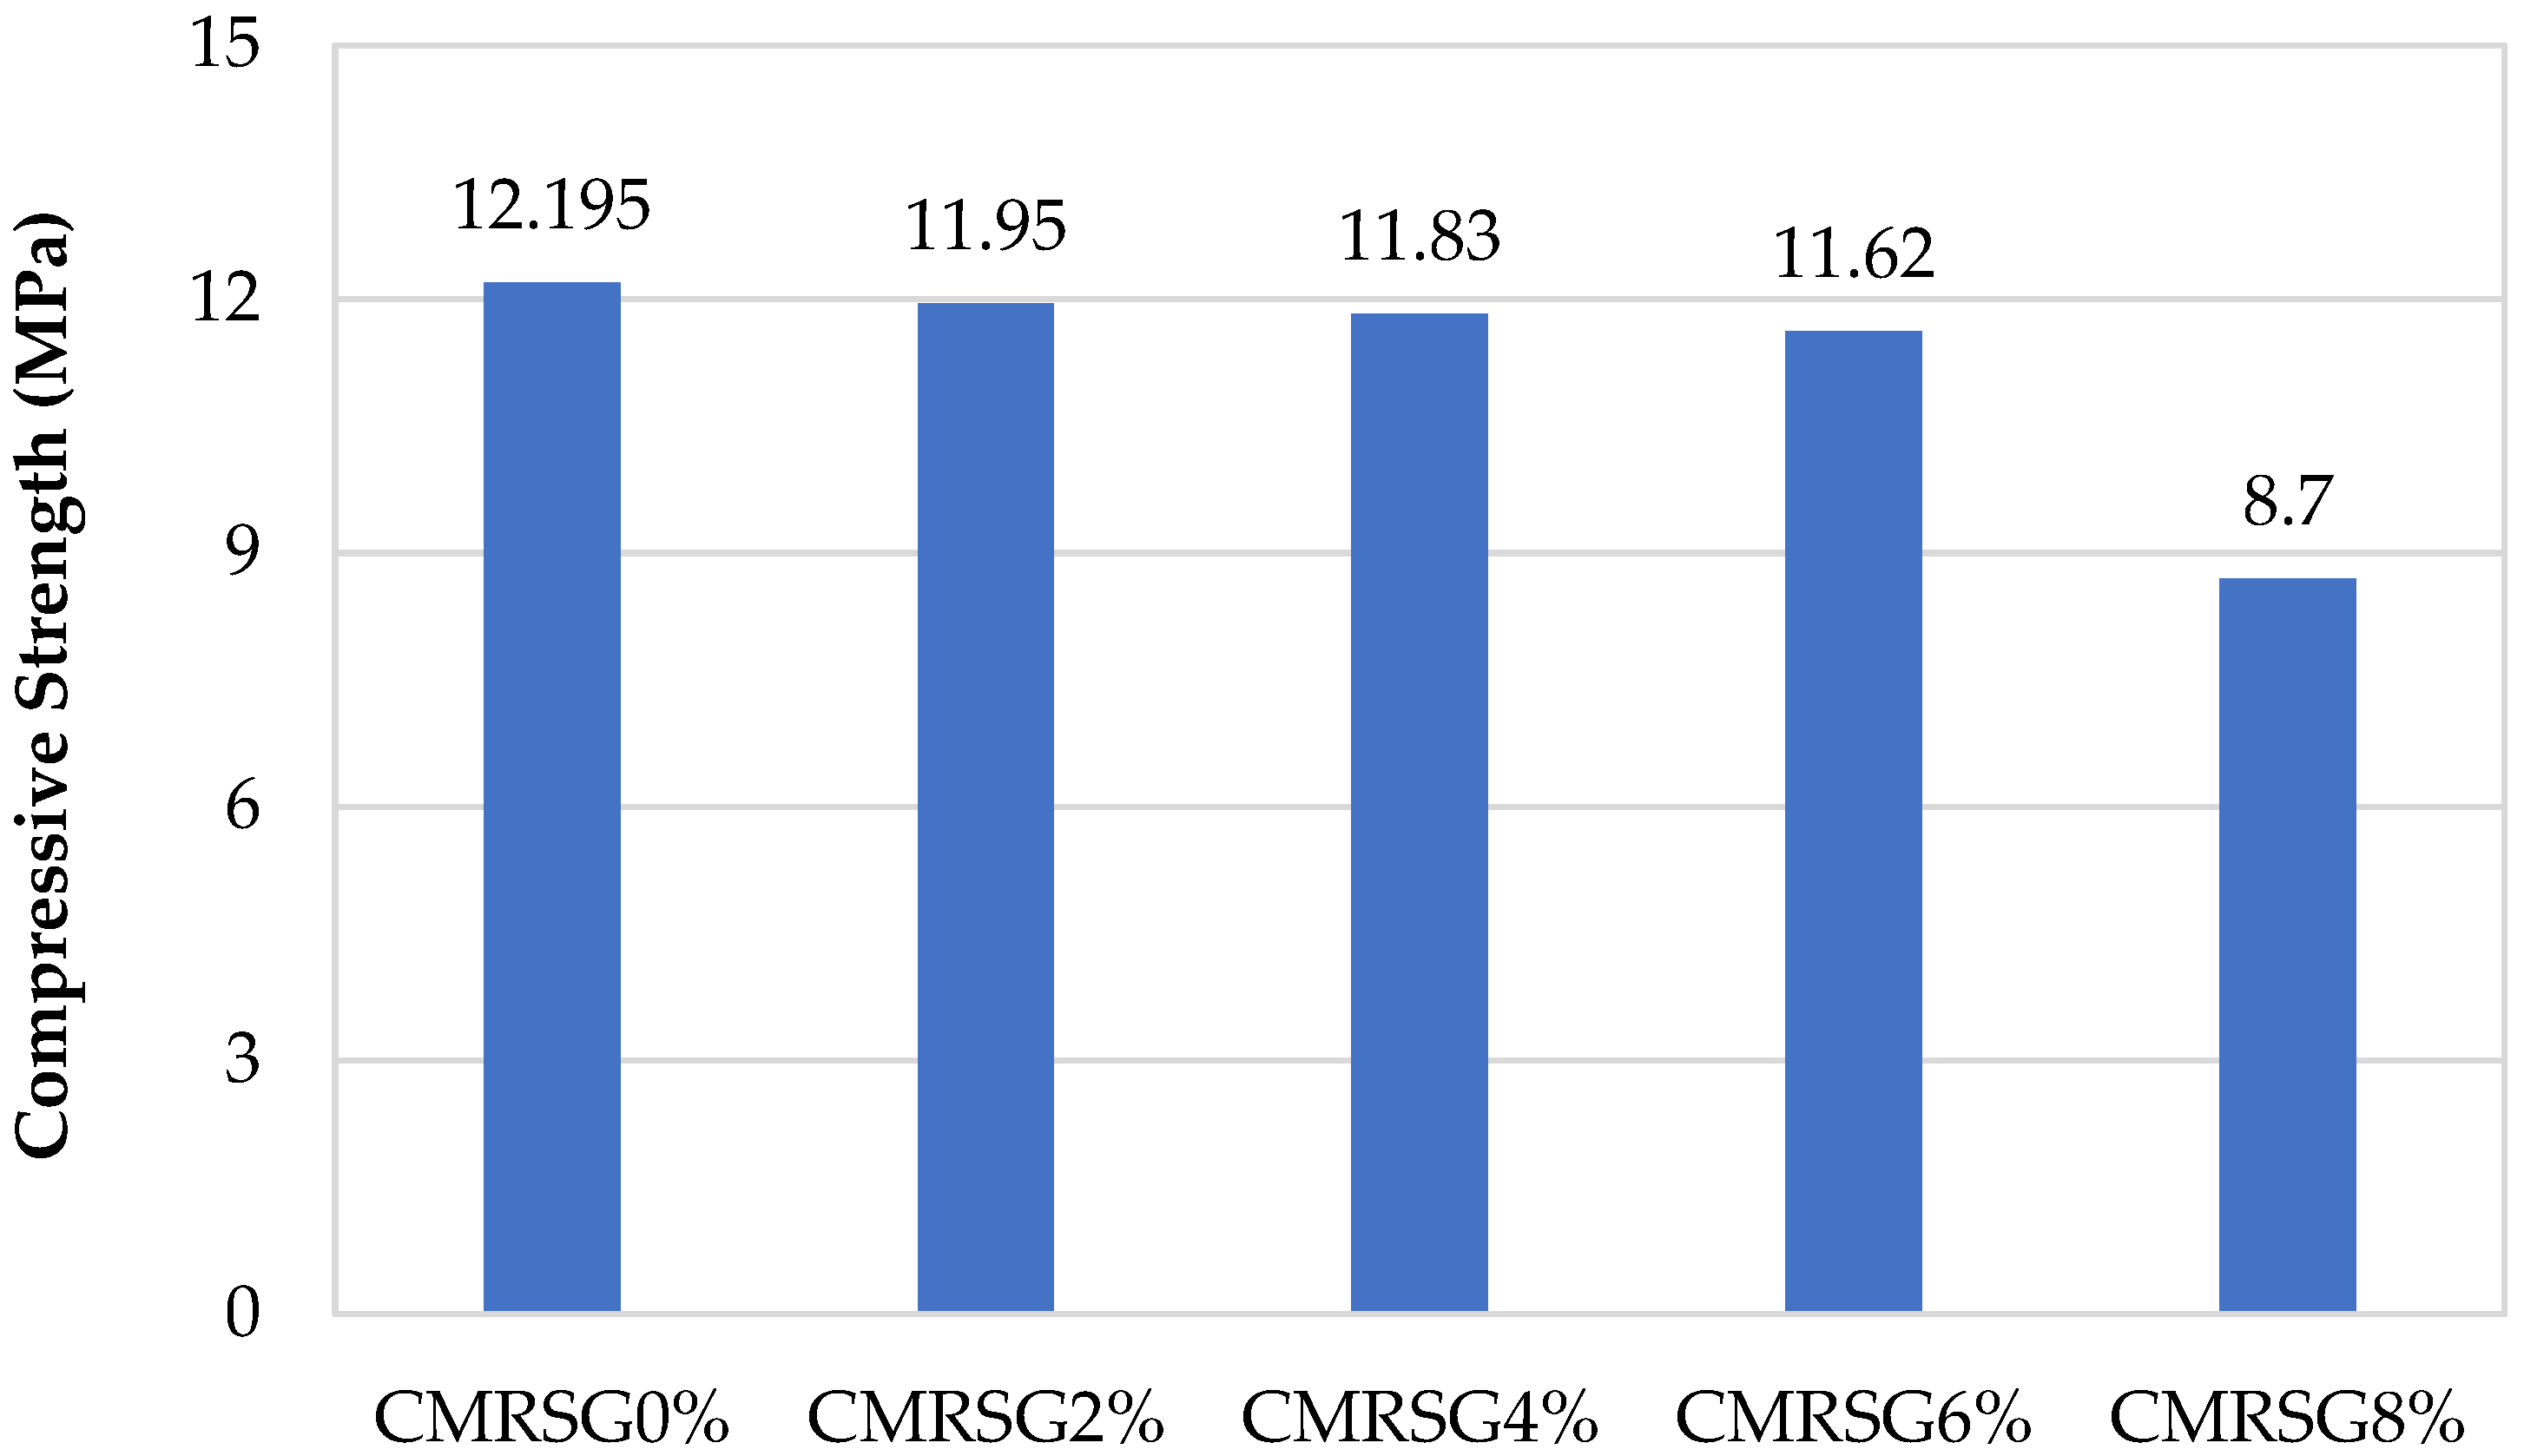
3.3. Compressive Strength of Specimens Having Recycled Sand
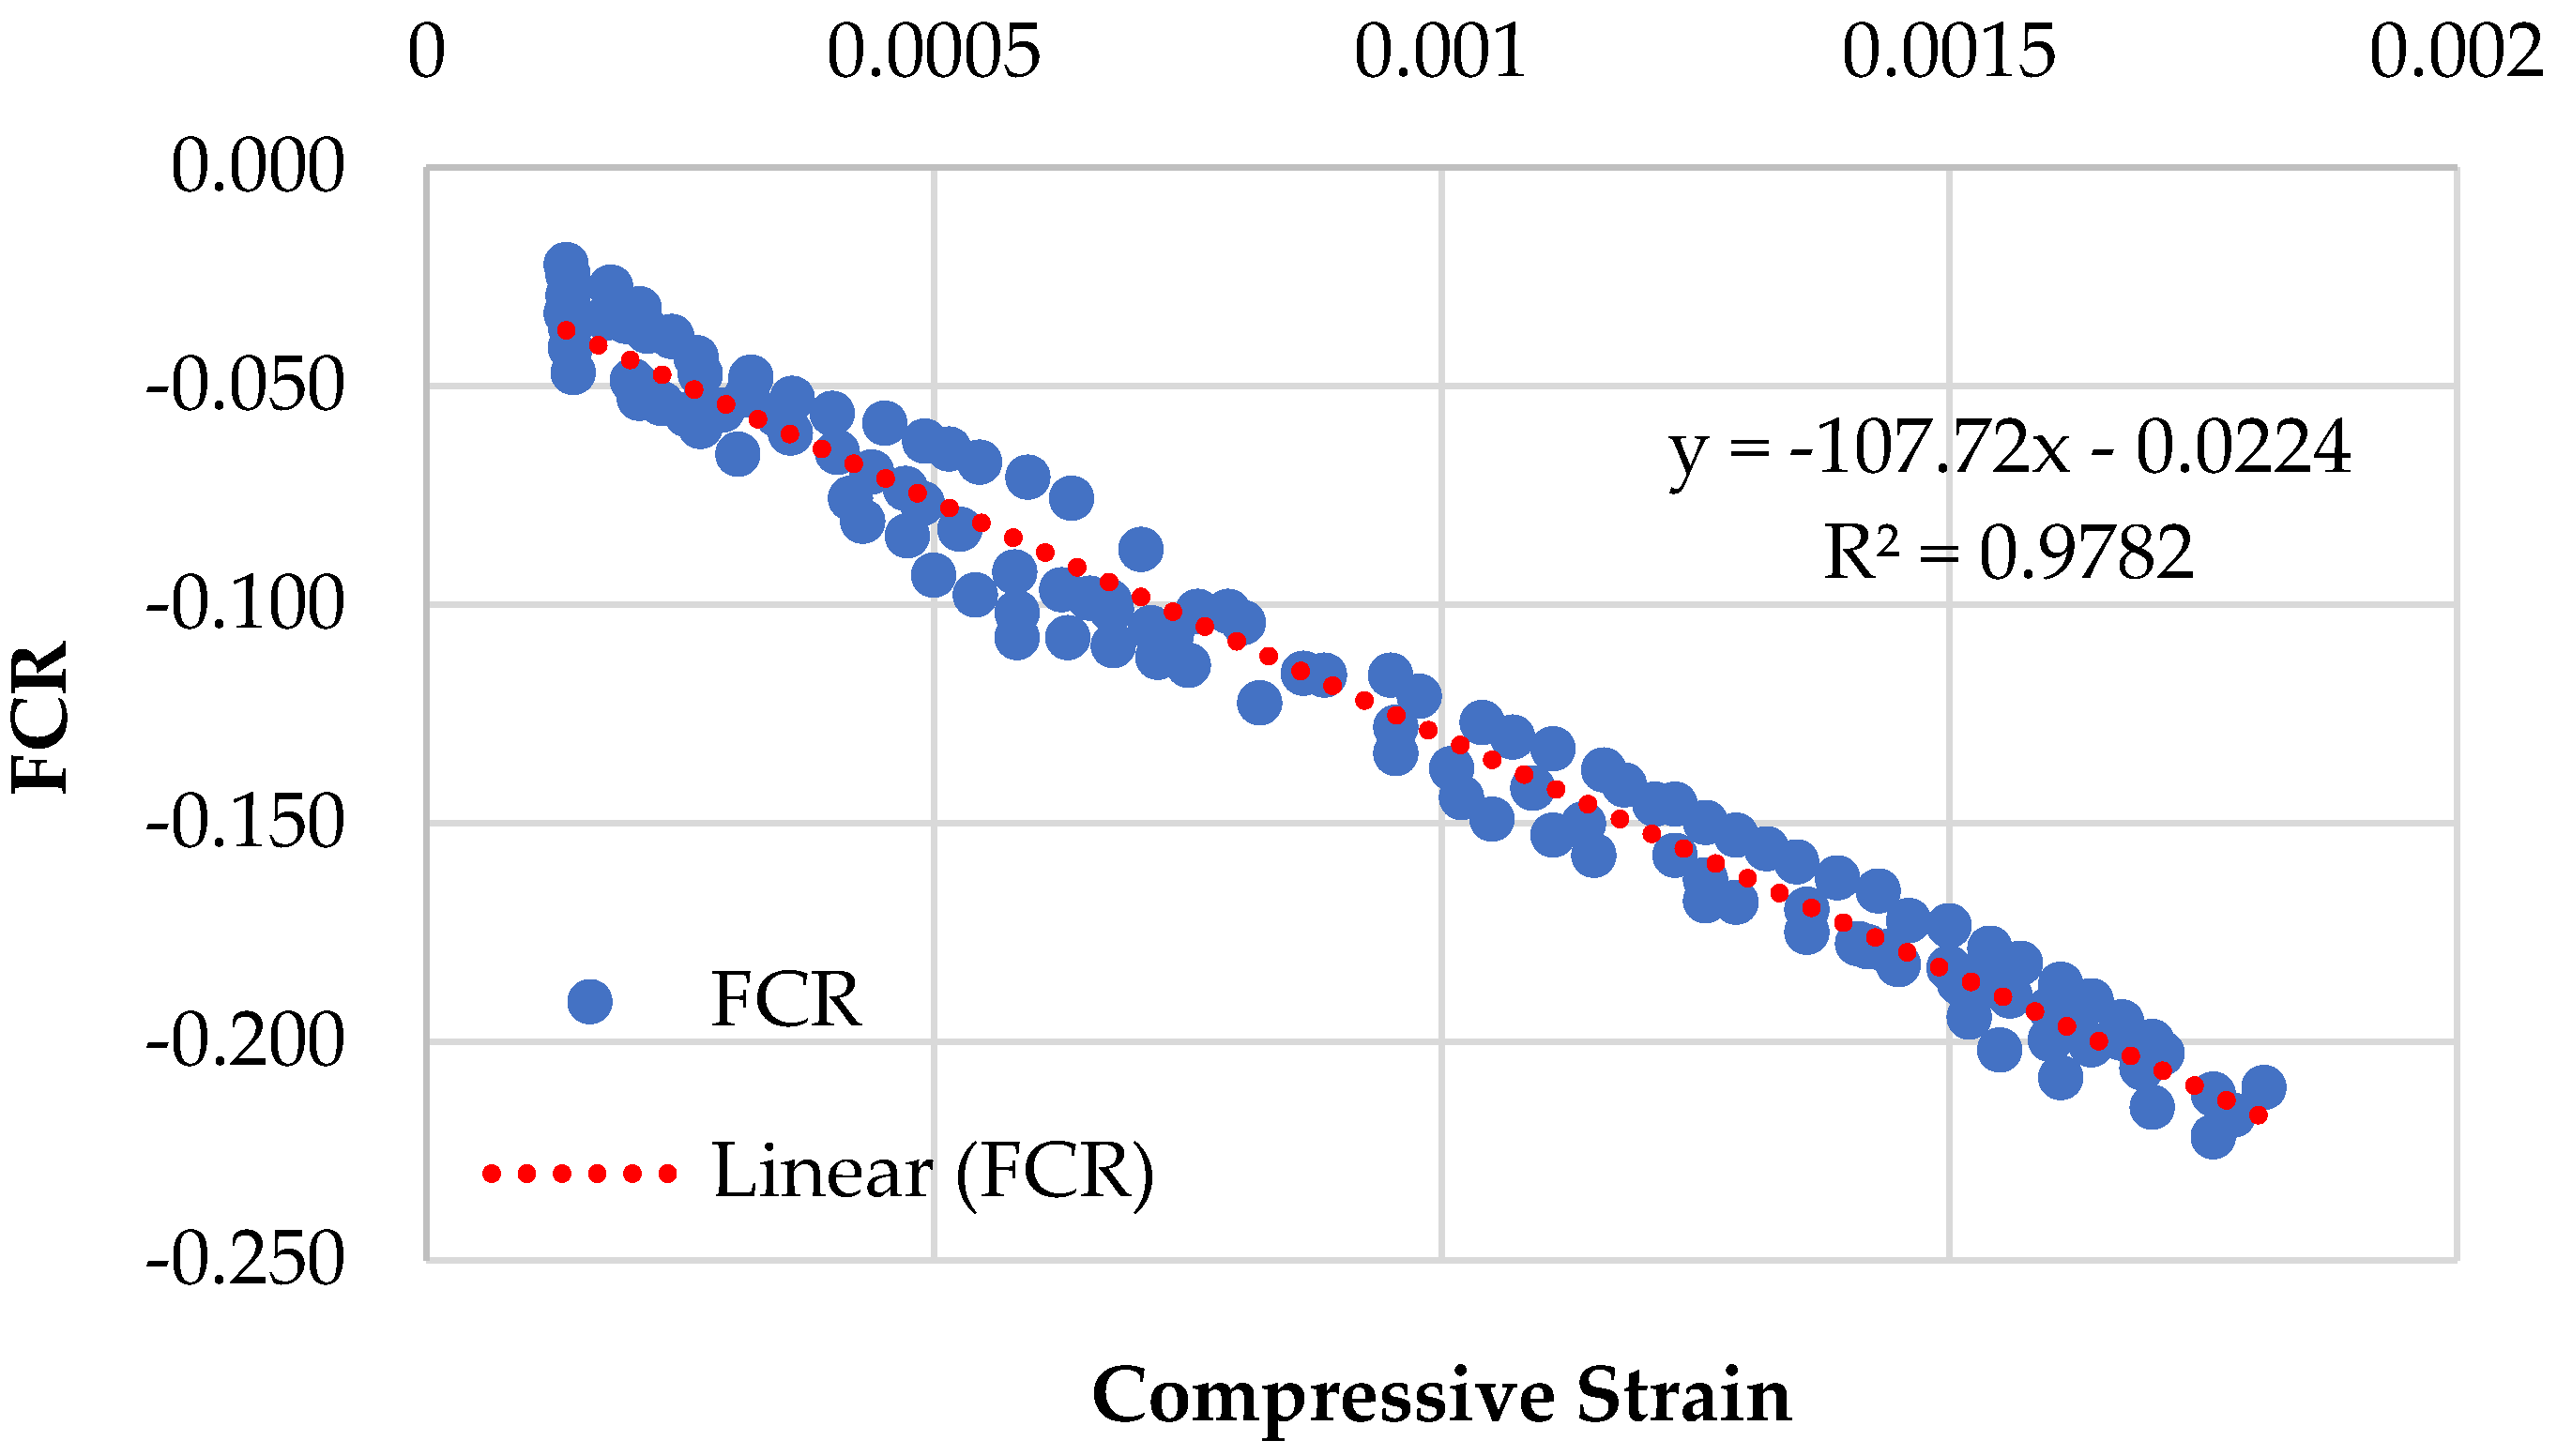
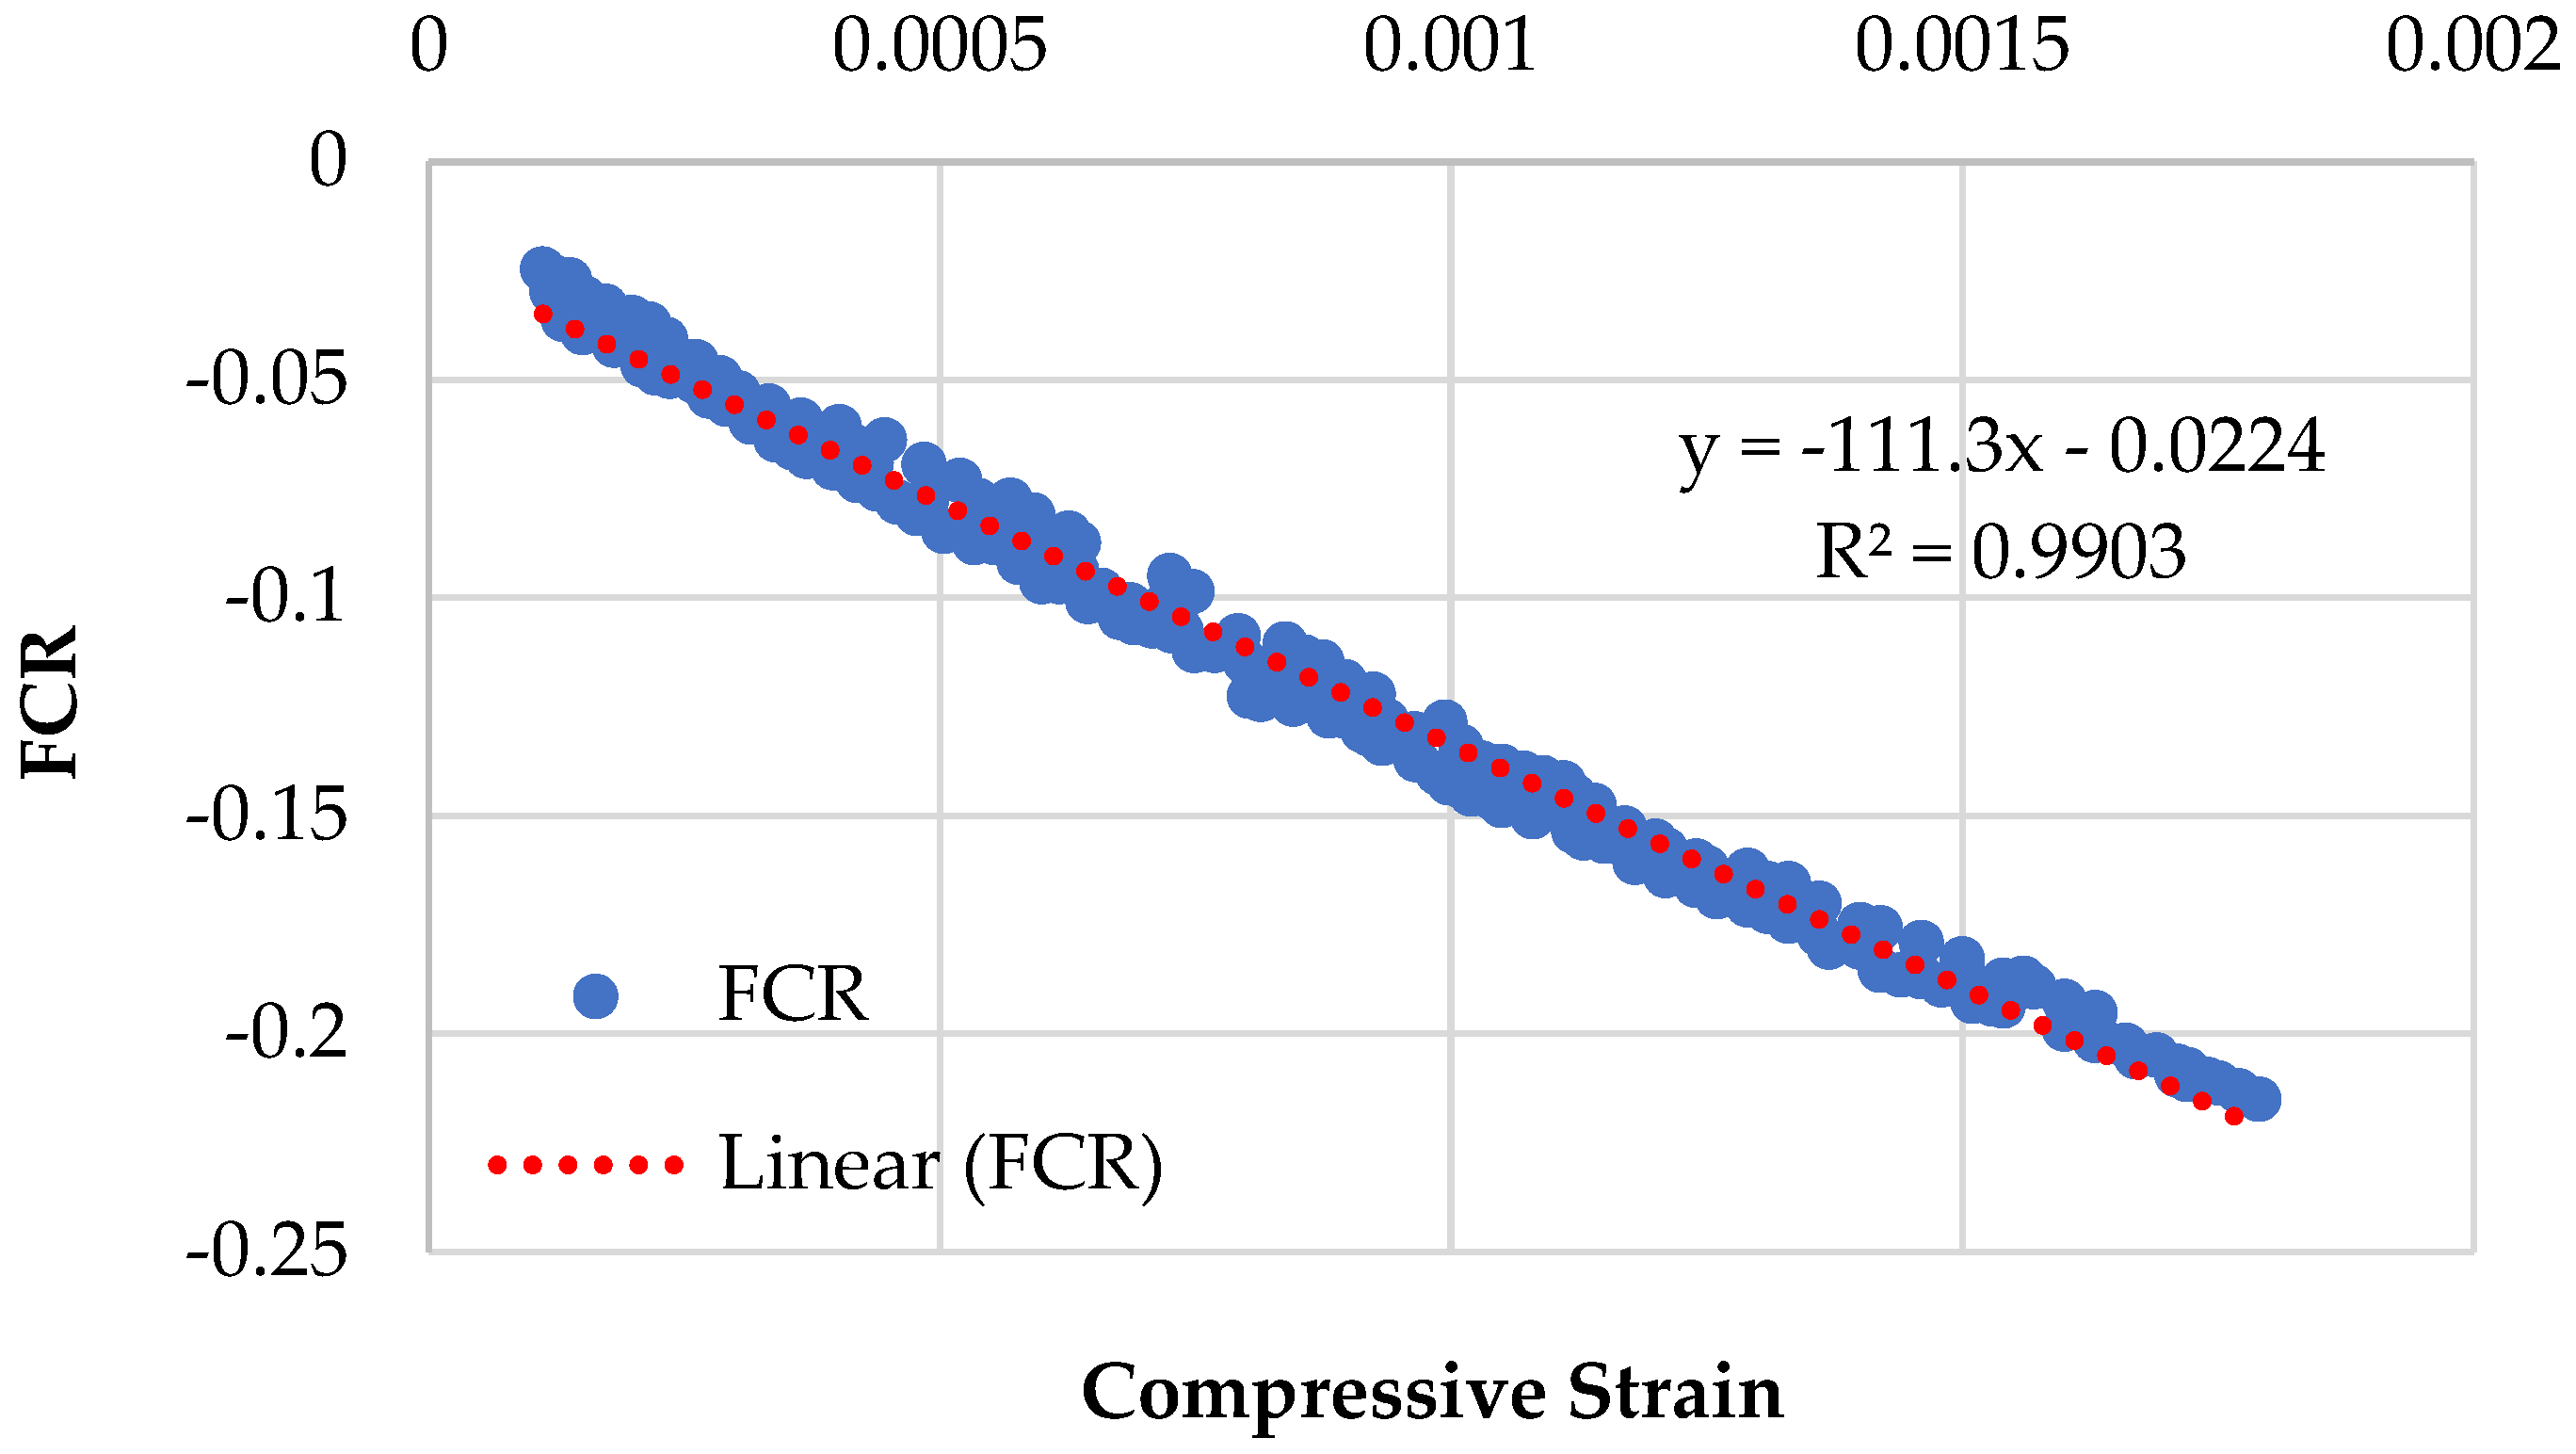
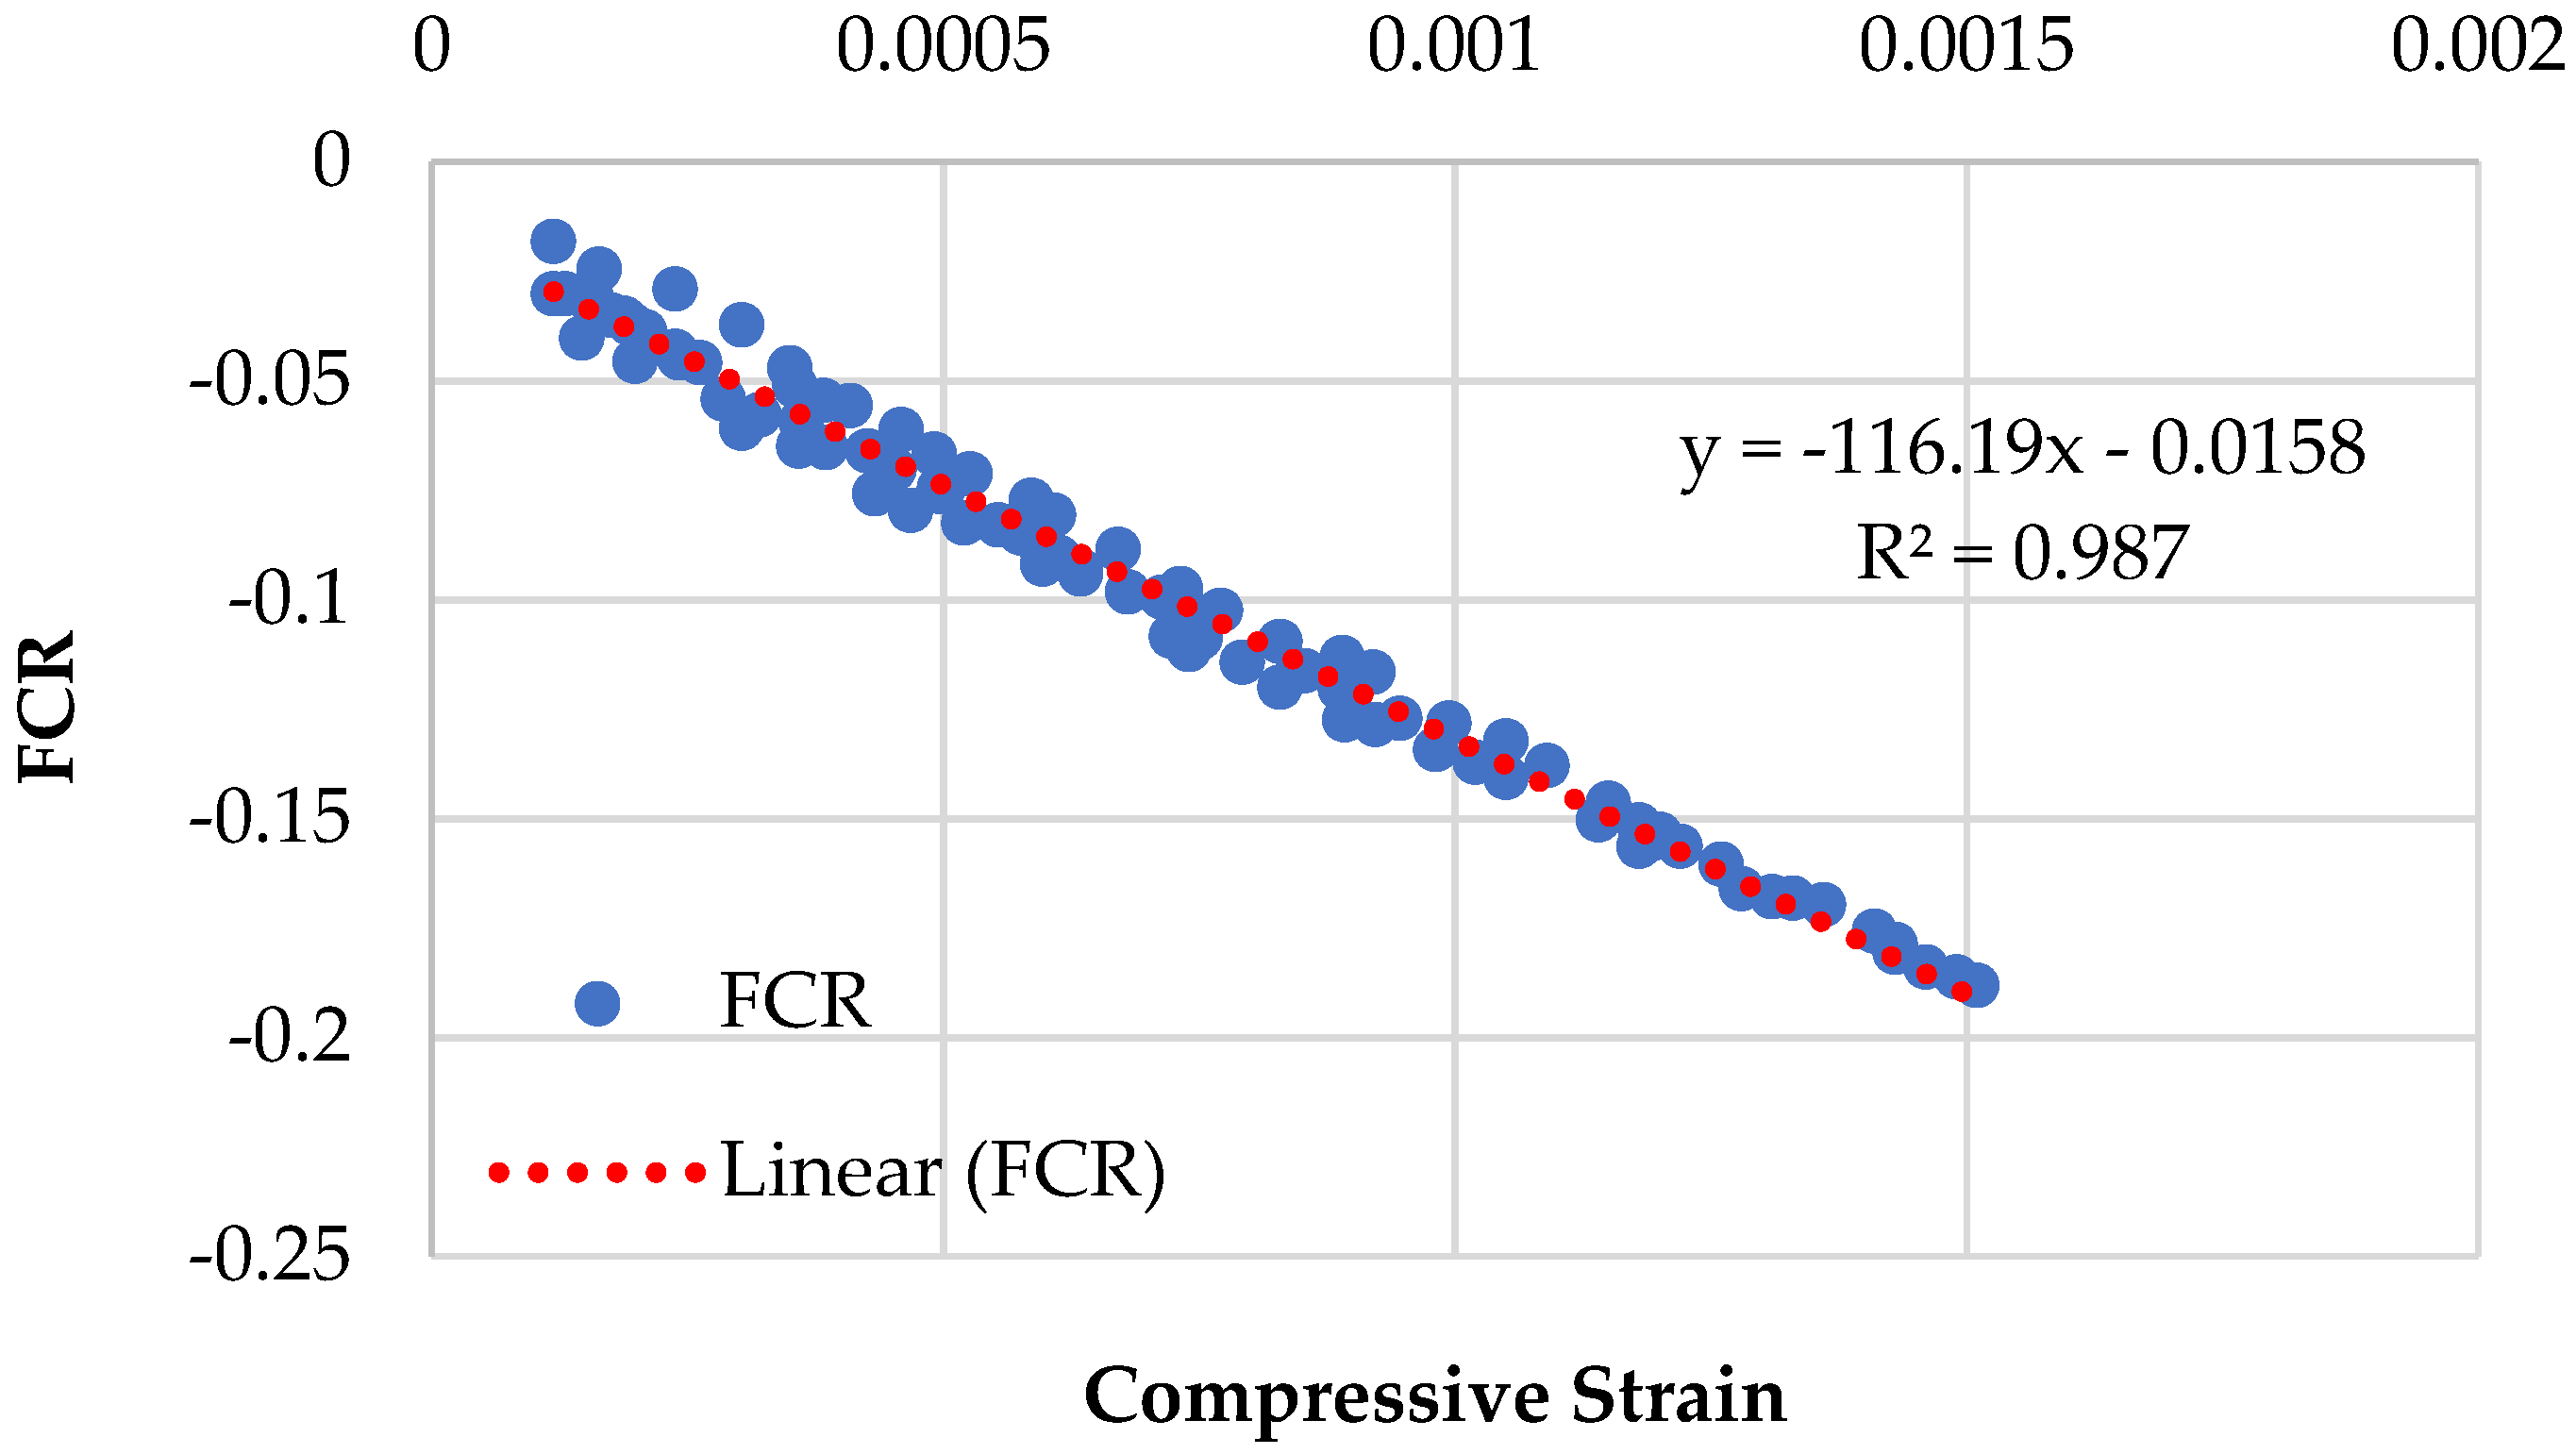
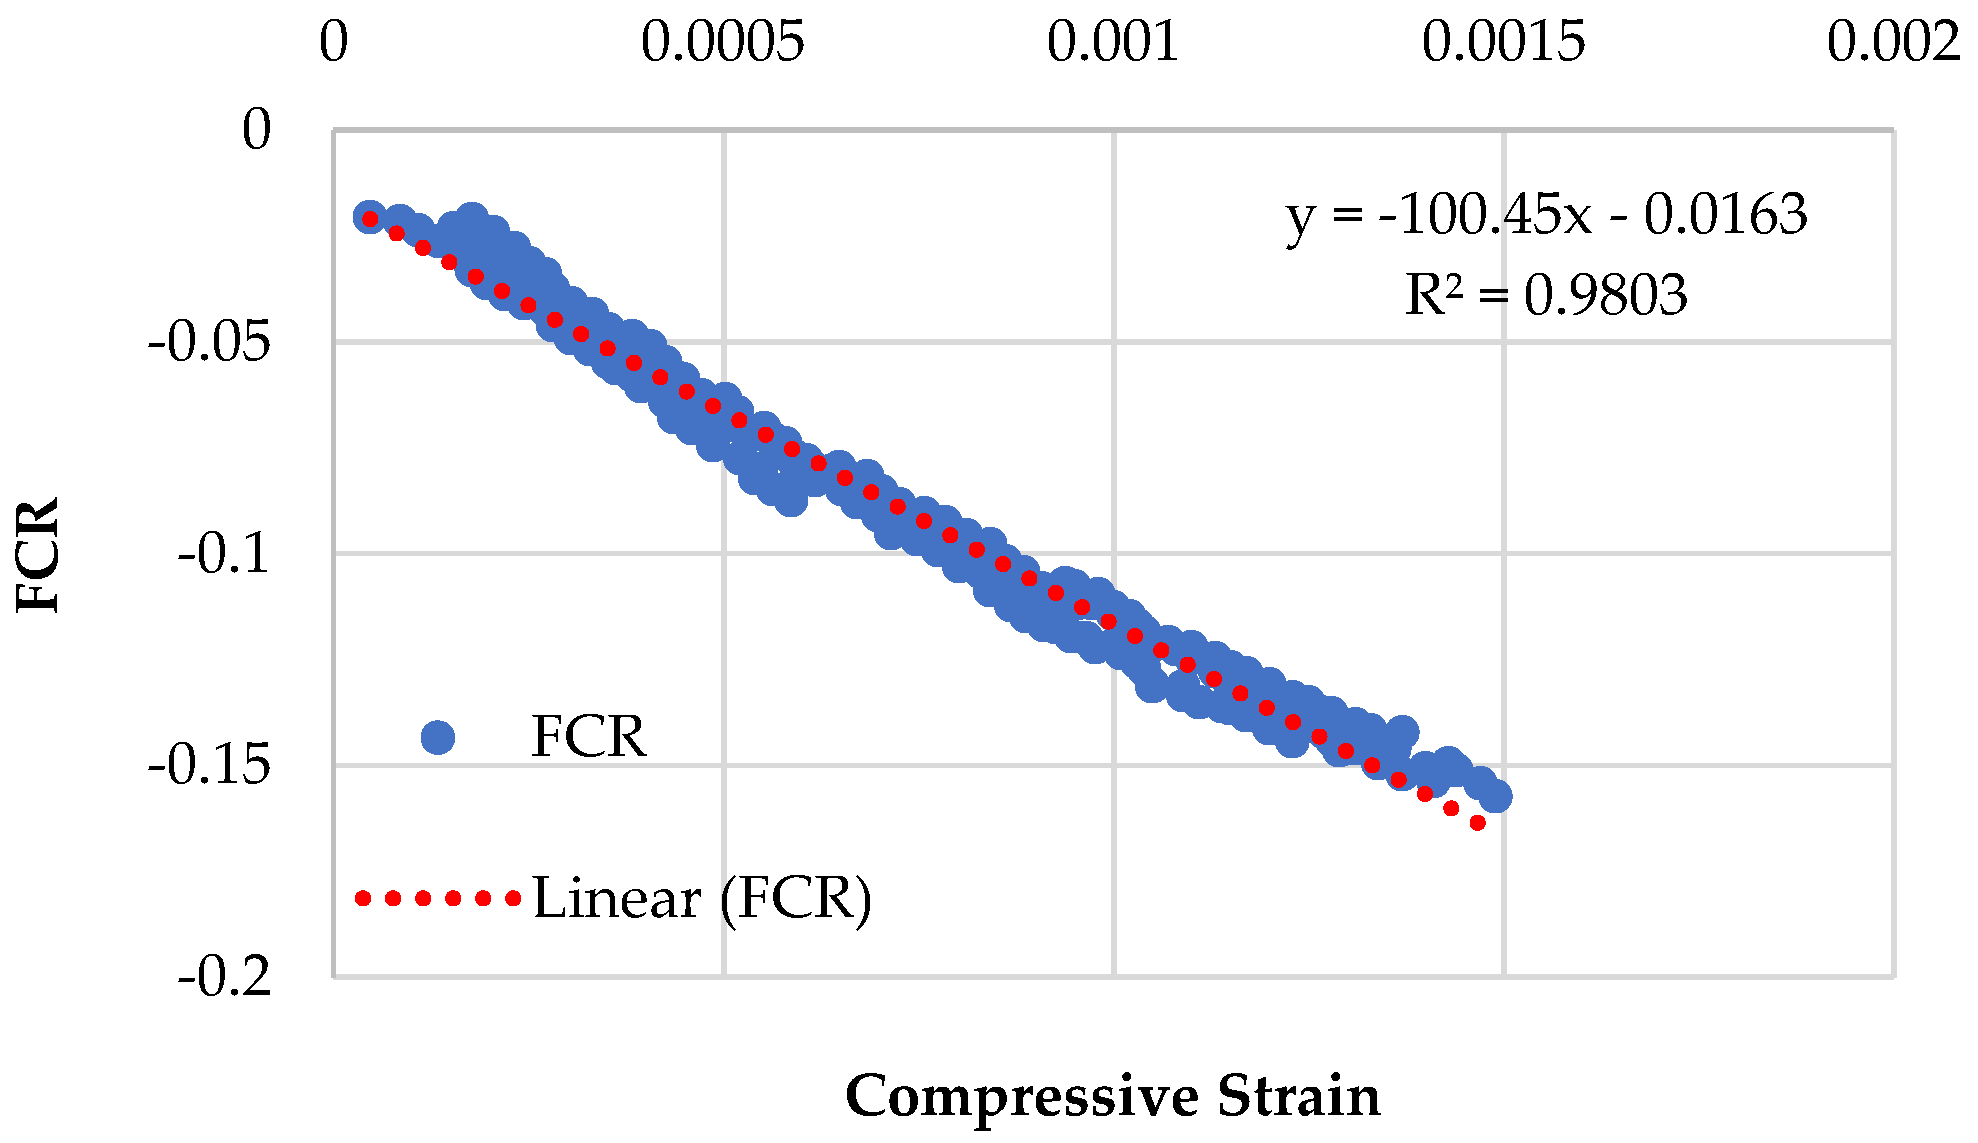
3.4. Piezoresistive Behavior of Specimens Having Recycled Sand
3.5. Comparative Analysis
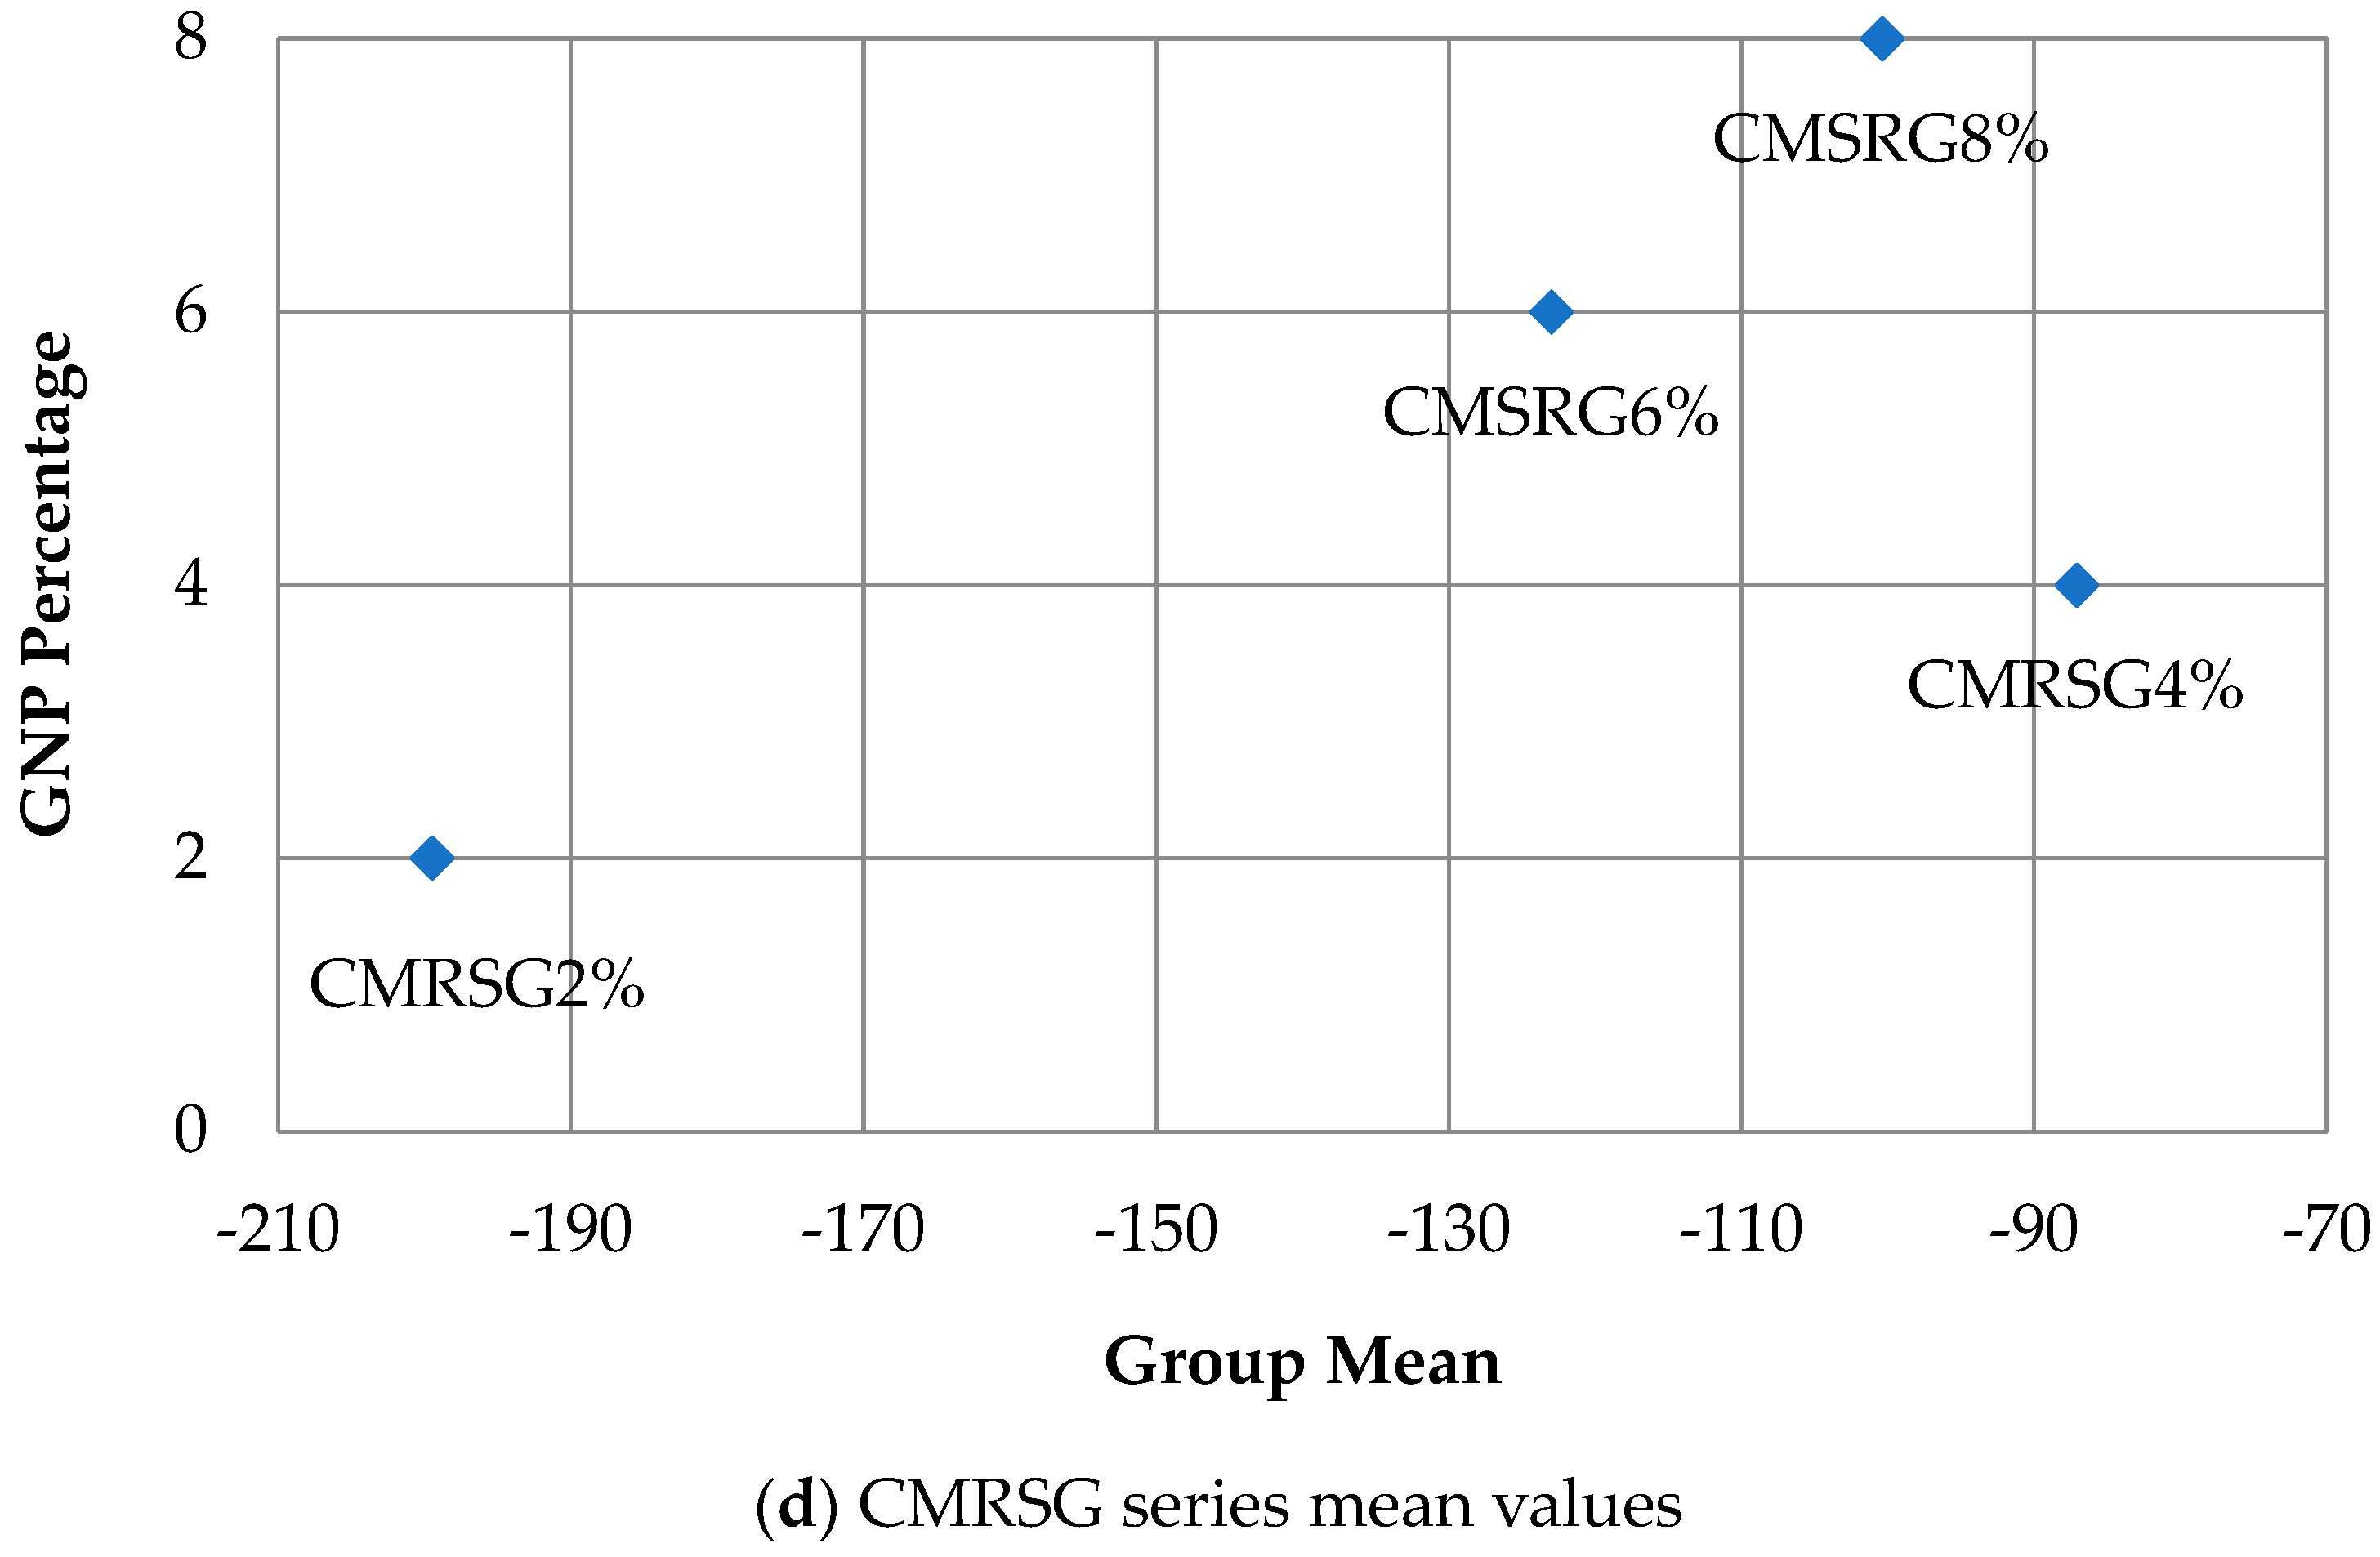
3.5.1. Analysis of Covariance of CMG and CMRSG Series
4. Conclusions
- GNP as a partial replacement for cement enhanced the compressive strength and self-sensing capabilities when compared to the control specimens.
- The compressive strength of mortar cubes with natural sand was increased with increasing the content of GNPs. However, after a certain ratio, the strength began to decline. The strength performance was examined based on the control specimens, and the results for the CMG series with 2%, 4%, 6%, and 8% GNPs showed increases of 5.04%, 5.92%, and 12.18%, and a decrease of 3.09% in the strength, respectively.
- On the other hand, the specimens with recycled sand demonstrated a continuous decrease in the compressive strength. The strength performance for the CMRSG series with 2%, 4%, 6%, and 8% GNPs indicated decreases of 2.01%, 2.99%, 4.72%, and 28.66% in the strength, respectively. The decrease in the strength could be attributed to the creation of gaps or voids.
- The piezoresistivity of the composite mortar experienced noticeable changes only up to a 4% addition of GNPs. Beyond this percentage, the regression analysis results for both CMGs and CMRSGs were seen to be very similar, which was supported by the findings of the covariance analysis of the regression equations. The addition of GNPs enhanced the ability to monitor structural health.
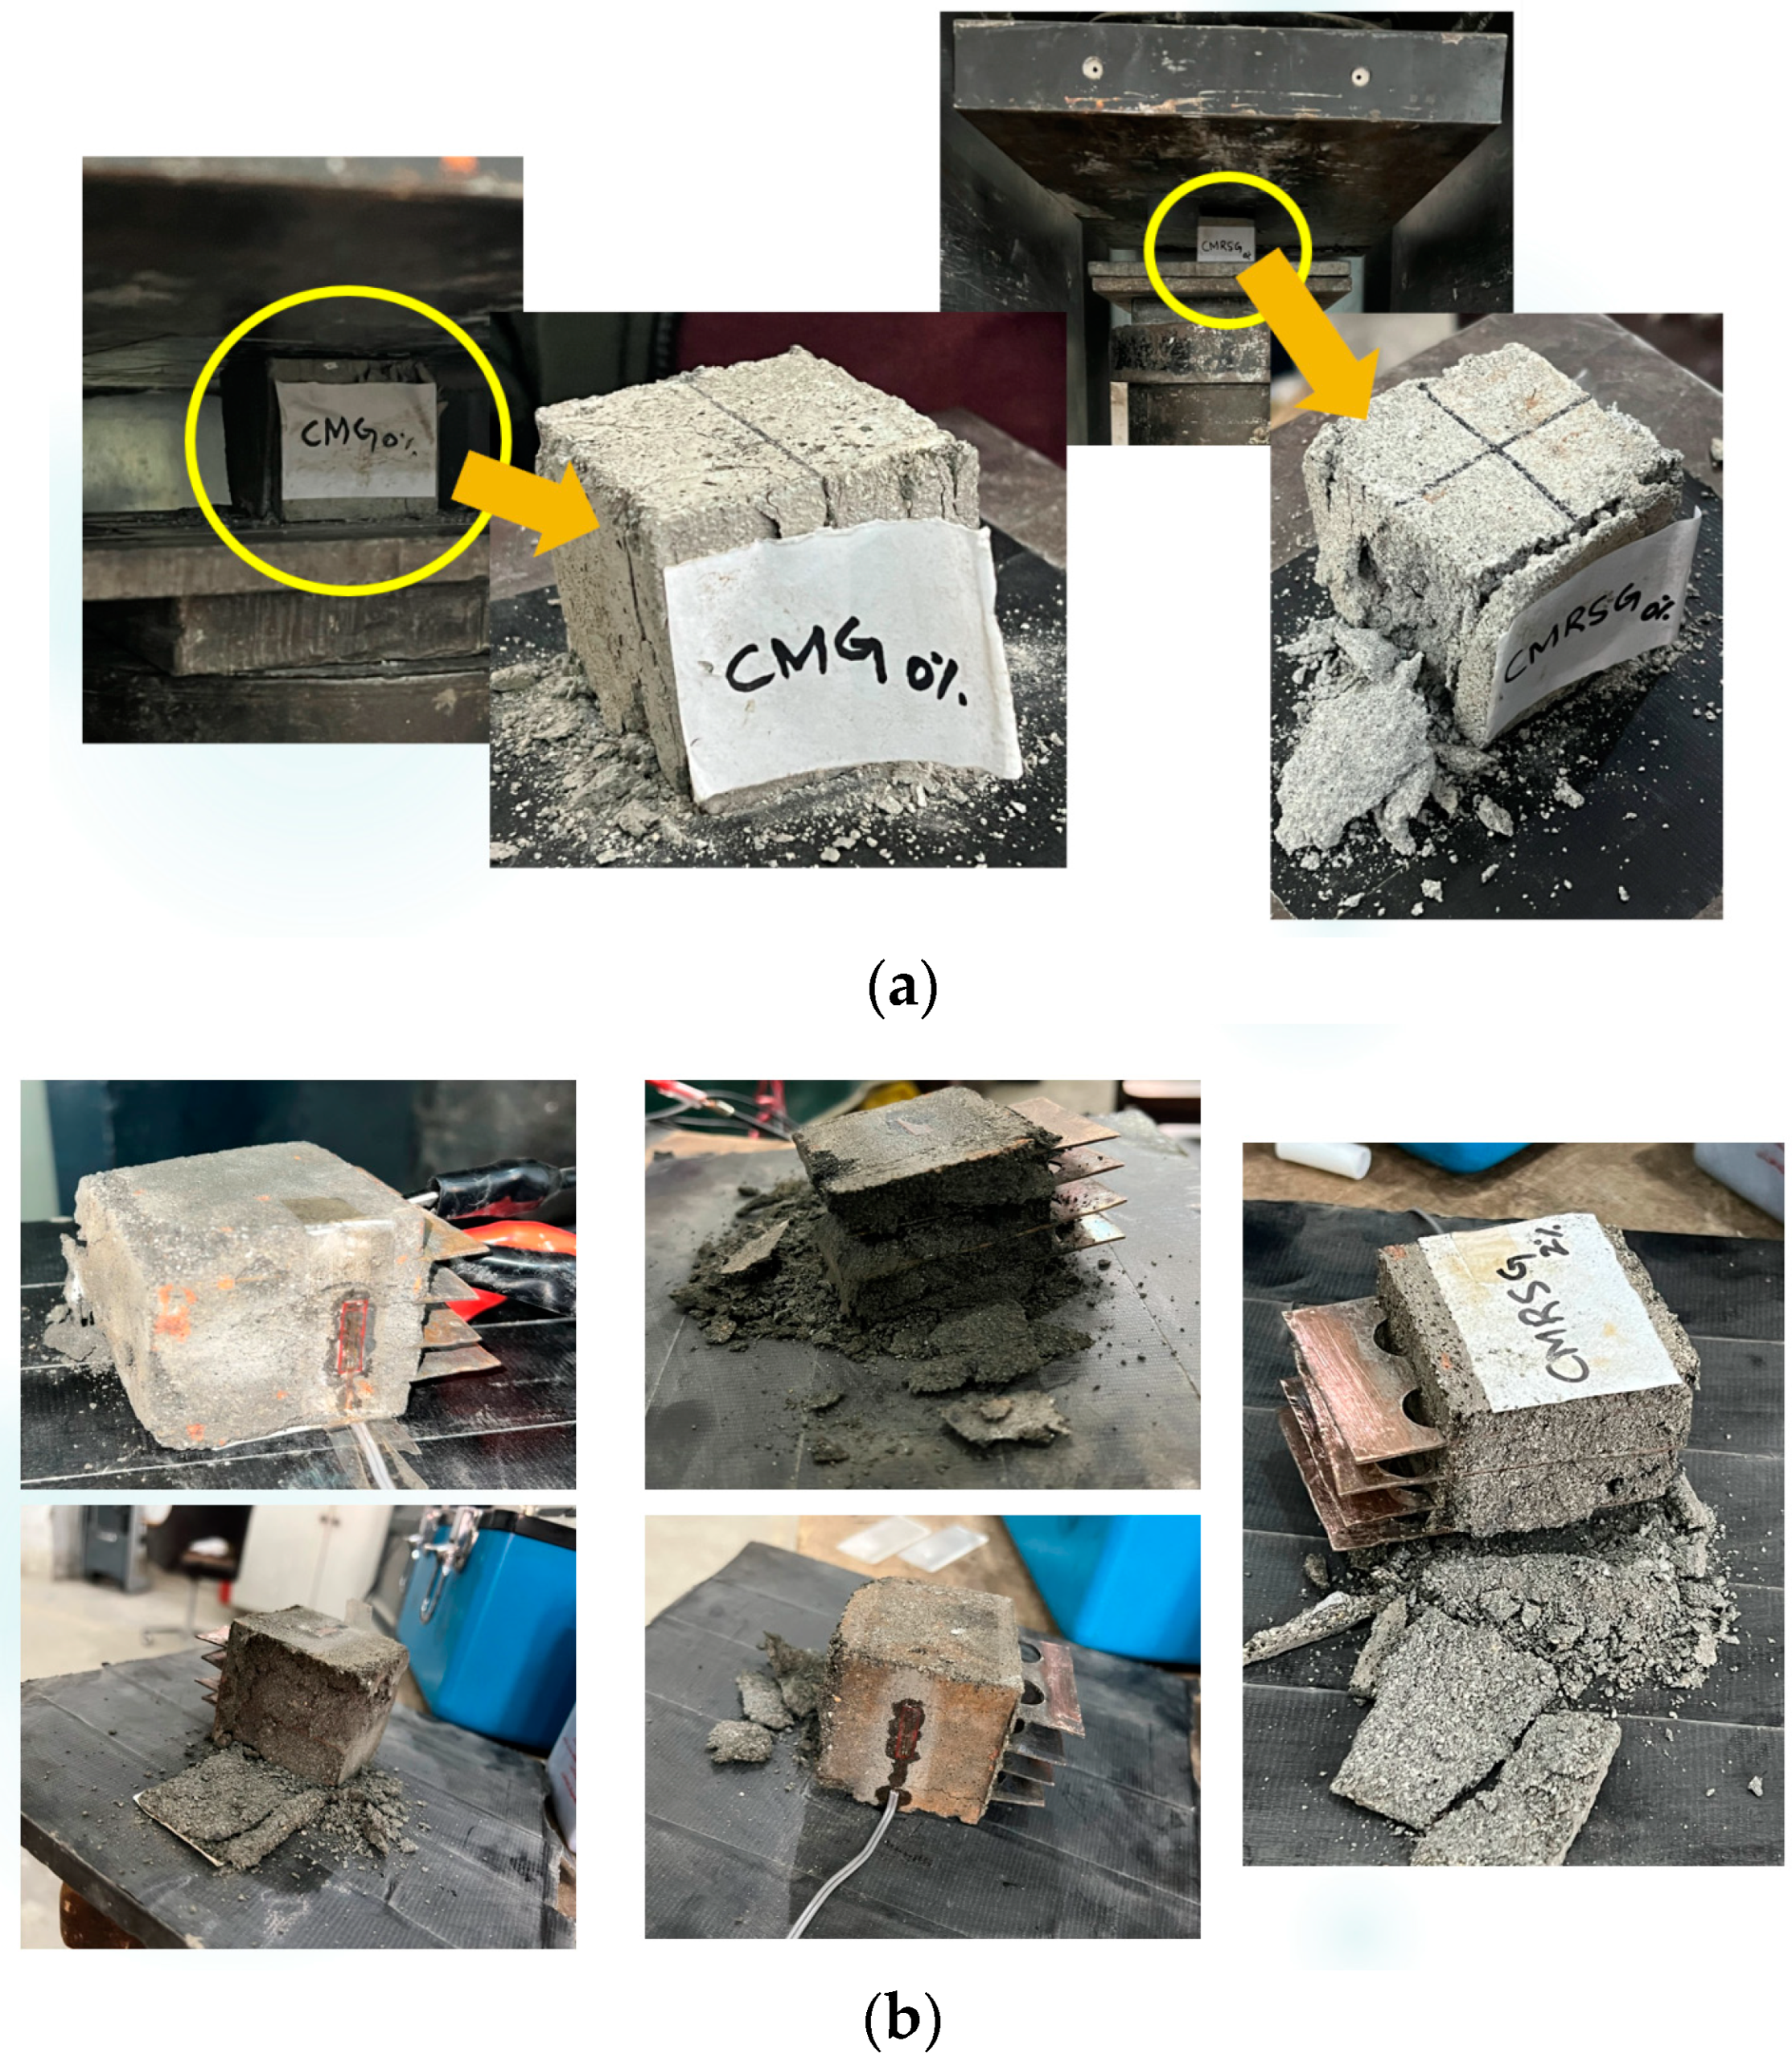
- The crack patterns displayed that more uniform cracks were obtained for the CMG series compared to the CMRSG series.
Author Contributions
Funding
Data Availability Statement
Conflicts of Interest
References
- Bontea, D.-M.; Chung, D.; Lee, G. Damage in carbon fiber-reinforced concrete, monitored by electrical resistance measurement. Cem. Concr. Res. 2000, 30, 651–659. [Google Scholar] [CrossRef]
- Li, G.Y.; Wang, P.M.; Zhao, X. Pressure-sensitive properties and microstructure of carbon nanotube reinforced cement composites. Cem. Concr. Compos. 2007, 29, 377–382. [Google Scholar] [CrossRef]
- Chung, D. Electrical conduction behavior of cement-matrix composites. J. Mater. Eng. Perform. 2002, 11, 194–204. [Google Scholar] [CrossRef]
- Chacko, R.M.; Banthia, N.; Mufti, A.A. Carbon-fiber-reinforced cement-based sensors. Can. J. Civ. Eng. 2007, 34, 284–290. [Google Scholar] [CrossRef]
- Han, B.; Ding, S.; Yu, X. Intrinsic self-sensing concrete and structures: A review. Measurement 2015, 59, 110–128. [Google Scholar] [CrossRef]
- Galao, O.; Baeza, F.J.; Zornoza, E.; Garcés, P. Strain and damage sensing properties on multifunctional cement composites with CNF admixture. Cem. Concr. Compos. 2014, 46, 90–98. [Google Scholar] [CrossRef]
- Imran, M.; Shabbir, F.; Pourfalah, S.; Ahmad, A. Out-of-plane response of engineered cementitious composite faced block masonry. In Proceedings of the 4th Conference on Sustainability in Civil Engineering (CSCE’22), Hanoi, Vietnam, 25–27 December 2022; Capital University of Science and Technology: Islamabad, Pakistan, 2022. [Google Scholar]
- Wen, S.; Chung, D. Carbon fiber-reinforced cement as a strain-sensing coating. Cem. Concr. Res. 2001, 31, 665–667. [Google Scholar] [CrossRef]
- Sánchez-Romate, X.F.; Jiménez-Suárez, A.; Campo, M.; Ureña, A.; Prolongo, S.G. Electrical properties and strain sensing mechanisms in hybrid graphene nanoplatelet/carbon nanotube nanocomposites. Sensors 2021, 21, 5530. [Google Scholar] [CrossRef] [PubMed]
- Saafi, M. Wireless and embedded carbon nanotube networks for damage detection in concrete structures. Nanotechnology 2009, 20, 395502. [Google Scholar] [CrossRef] [PubMed]
- Xiao, H.; Li, H.; Ou, J. Self-monitoring properties of concrete columns with embedded cement-based strain sensors. J. Intell. Mater. Syst. Struct. 2011, 22, 191–200. [Google Scholar] [CrossRef]
- Abu Al-Rub, R.K.; Tyson, B.M.; Yazdanbakhsh, A.; Grasley, Z. Mechanical properties of nanocomposite cement incorporating surface-treated and untreated carbon nanotubes and carbon nanofibers. J. Nanomechanics Micromechanics 2012, 2, 1–6. [Google Scholar] [CrossRef]
- Tao, J.; Wang, X.; Wang, Z.; Zeng, Q. Graphene nanoplatelets as an effective additive to tune the microstructures and piezoresistive properties of cement-based composites. Constr. Build. Mater. 2019, 209, 665–678. [Google Scholar] [CrossRef]
- Chamoin, L.; Farahbakhsh, S.; Poncelet, M. An educational review on distributed optic fiber sensing based on Rayleigh backscattering for damage tracking and structural health monitoring. Meas. Sci. Technol. 2022, 33, 124008. [Google Scholar] [CrossRef]
- Soliman, A.; Hafeez, G.; Erkmen, E.; Ganesan, R.; Ouf, M.; Hammad, A.; Eicker, U.; Moselhi, O. Innovative construction material technologies for sustainable and resilient civil infrastructure. Mater. Today: Proc. 2022, 60, 365–372. [Google Scholar] [CrossRef]
- Azhari, F.; Banthia, N. Cement-based sensors with carbon fibers and carbon nanotubes for piezoresistive sensing. Cem. Concr. Compos. 2012, 34, 866–873. [Google Scholar] [CrossRef]
- Gong, Y.; Cheng, X.; Wu, Z.; Liu, Y.; Yu, P.; Hu, X. A flexible tactile sensor array for dynamic triaxial force measurement based on aligned piezoresistive nanofibers. IEEE Sens. J. 2021, 21, 21989–21998. [Google Scholar] [CrossRef]
- Li, Z.; Zhang, D.; Wu, K. Cement matrix 2-2 piezoelectric composite—Part 1. Sensory effect. Mater. Struct. 2001, 34, 506–512. [Google Scholar]
- Ke, G.; Li, W.; Li, R.; Li, Y.; Wang, G. Mitigation effect of waste glass powders on alkali–silica reaction (ASR) expansion in cementitious composite. Int. J. Concr. Struct. Mater. 2018, 12, 67. [Google Scholar] [CrossRef]
- Dong, W.; Li, W.; Tao, Z.; Wang, K. Piezoresistive properties of cement-based sensors: Review and perspective. Constr. Build. Mater. 2019, 203, 146–163. [Google Scholar] [CrossRef]
- Hassani, S.; Dackermann, U. A systematic review of advanced sensor technologies for non-destructive testing and structural health monitoring. Sensors 2023, 23, 2204. [Google Scholar] [CrossRef]
- Rentier, E.; Cammeraat, L. The environmental impacts of river sand mining. Sci. Total Environ. 2022, 838, 155877. [Google Scholar] [CrossRef] [PubMed]
- Ding, S.; Wang, X.; Qiu, L.; Ni, Y.Q.; Dong, X.; Cui, Y.; Ashour, A.; Han, B.; Ou, J. Self-sensing cementitious composites with hierarchical carbon fiber-carbon nanotube composite fillers for crack development monitoring of a maglev girder. Small 2023, 19, 2206258. [Google Scholar] [CrossRef] [PubMed]
- Ta, Q.T.H.; Namgung, G.; Noh, J.-S. Synthesis of Ag@rGO/gC3N4 layered structures and their application to toxic gas sensors: Effect of Ag nanoparticles. Electron. Mater. Lett. 2019, 15, 750–759. [Google Scholar] [CrossRef]
- Li, W.; Qu, F.; Dong, W.; Mishra, G.; Shah, S.P. A comprehensive review on self-sensing graphene/cementitious composites: A pathway toward next-generation smart concrete. Constr. Build. Mater. 2022, 331, 127284. [Google Scholar] [CrossRef]
- Li, L.; Wei, H.; Hao, Y.; Li, Y.; Cheng, W.; Ismail, Y.A.; Liu, Z. Carbon nanotube (CNT) reinforced cementitious composites for structural self-sensing purpose: A review. Constr. Build. Mater. 2023, 392, 131384. [Google Scholar] [CrossRef]
- D’Alessandro, A.; Rallini, M.; Ubertini, F.; Materazzi, A.; Kenny, J.; Laflamme, S. A comparative study between carbon nanotubes and carbon nanofibers as nanoinclusions in self-sensing concrete. In Proceedings of the 2015 IEEE 15th International Conference on Nanotechnology (IEEE-NANO), Rome, Italy, 27–30 July 2015; pp. 698–701. [Google Scholar]
- Dusza, J.; Morgiel, J.; Duszová, A.; Kvetková, L.; Nosko, M.; Kun, P.; Balázsi, C. Microstructure and fracture toughness of Si3N4+ graphene platelet composites. J. Eur. Ceram. Soc. 2012, 32, 3389–3397. [Google Scholar] [CrossRef]
- Zhao, H.-Y.; Yu, M.-Y.; Liu, J.; Li, X.; Min, P.; Yu, Z.-Z. Efficient preconstruction of three-dimensional graphene networks for thermally conductive polymer composites. Nano-Micro Lett. 2022, 14, 129. [Google Scholar] [CrossRef]
- Wotring, E.; Mondal, P.; Marsh, C. Characterizing the dispersion of graphene nanoplatelets in water with water reducing admixture. In Nanotechnology in Construction: Proceedings of NICOM5; Springer: Berlin/Heidelberg, Germany, 2015; pp. 141–148. [Google Scholar]
- Le, J.-L.; Du, H.; Dai Pang, S. Use of 2D Graphene Nanoplatelets (GNP) in cement composites for structural health evaluation. Compos. Part B Eng. 2014, 67, 555–563. [Google Scholar] [CrossRef]
- Zohhadi, N.; Aich, N.; Matta, F.; Saleh, N.B.; Ziehl, P. Graphene nanoreinforcement for cement composites. In Nanotechnology in Construction: Proceedings of NICOM5; Springer: Berlin/Heidelberg, Germany, 2015; pp. 265–270. [Google Scholar]
- Liu, H.; Deshmukh, A.; Salowitz, N.; Zhao, J.; Sobolev, K. Resistivity signature of graphene-based fiber-reinforced composite subjected to mechanical loading. Front. Mater. 2022, 9, 818176. [Google Scholar] [CrossRef]
- Lu, D.; Shi, X.; Wong, H.S.; Jiang, Z.; Zhong, J. Graphene coated sand for smart cement composites. Constr. Build. Mater. 2022, 346, 128313. [Google Scholar] [CrossRef]
- Ramesh, M.; Janani, R.; Deepa, C.; Rajeshkumar, L. Nanotechnology-enabled biosensors: A review of fundamentals, design principles, materials, and applications. Biosensors 2022, 13, 40. [Google Scholar] [CrossRef] [PubMed]
- De Luca, A.; Chen, L.; Gharehbaghi, K. Sustainable utilization of recycled aggregates: Robust construction and demolition waste reduction strategies. Int. J. Build. Pathol. Adapt. 2020, 39, 666–682. [Google Scholar] [CrossRef]
- Ghaffar, S.H.; Burman, M.; Braimah, N. Pathways to circular construction: An integrated management of construction and demolition waste for resource recovery. J. Clean. Prod. 2020, 244, 118710. [Google Scholar] [CrossRef]
- Rajesh, P.; Subhashini, V. Sustainable packaging from waste material: A review on innovative solutions for cleaner environment. In Bioremediation and Green Technologies: Sustainable Approaches to Mitigate Environmental Impacts; Springer: Berlin/Heidelberg, Germany, 2021; pp. 259–270. [Google Scholar]
- Bhoopathy, V.; Subramanian, S.S. The way forward to sustain environmental quality through sustainable sand mining and the use of manufactured sand as an alternative to natural sand. Environ. Sci. Pollut. Res. 2022, 29, 30793–30801. [Google Scholar] [CrossRef]
- ACS Material. Graphene Nanoplatelets (2–10 nm). Available online: https://www.acsmaterial.com/graphene-nanoplatelets-2-10nm.html (accessed on 29 July 2023).
- Chemicals, U. Ultra Superplast 675 (High Performer Water Reducing and Plasticizing Admixture). Available online: https://ultra-chemicals.com/Ultra-Chemicals-LLC/concrete%20admixture/Ultra%20Super%20Plast%20675.pdf (accessed on 29 July 2023).
- Metaxa, Z.S.; Kourkoulis, S.K. Cement based nanocomposites with self-diagnostic characteristics. In Proceedings of the 21st International Conference on Composite Materials, Xi’an, China, 20–25 August 2015. [Google Scholar]
- Qasim, M.S.; Shabbir, F.; Khan, Q.u.Z.; Raza, A. Investigation on self-sensing capability of different grades of carbon black in cementitious composites. Iran. J. Sci. Technol. Trans. Civ. Eng. 2022, 47, 761–774. [Google Scholar] [CrossRef]
- Du, H.; Dai Pang, S. Enhancement of barrier properties of cement mortar with graphene nanoplatelet. Cem. Concr. Res. 2015, 76, 10–19. [Google Scholar] [CrossRef]
- Du, H.; Quek, S.T.; Dai Pang, S. Smart multifunctional cement mortar containing graphite nanoplatelet. In Sensors and Smart Structures Technologies for Civil, Mechanical, and Aerospace Systems 2013; SPIE: Bellingham, WA, USA, 2013; pp. 871–880. [Google Scholar]
- Jiang, Z.; Ozbulut, O.E.; Harris, D.K. Graphene nanoplatelets-based self-sensing cementitious composites. In Smart Materials, Adaptive Structures and Intelligent Systems; American Society of Mechanical Engineers: New York, NY, USA, 2016; p. V001T001A016. [Google Scholar]
- Liu, Q.; Xu, Q.; Yu, Q.; Gao, R.; Tong, T. Experimental investigation on mechanical and piezoresistive properties of cementitious materials containing graphene and graphene oxide nanoplatelets. Constr. Build. Mater. 2016, 127, 565–576. [Google Scholar] [CrossRef]
- Sun, S.; Han, B.; Jiang, S.; Yu, X.; Wang, Y.; Li, H.; Ou, J. Nano graphite platelets-enabled piezoresistive cementitious composites for structural health monitoring. Constr. Build. Mater. 2017, 136, 314–328. [Google Scholar] [CrossRef]


| Appearance | Black/Gray Powder |
|---|---|
| Diameter | 2–7 μm |
| Thickness | 2–10 nm |
| Specific surface area | 20–40 m2/g |
| Electrical conductivity | 800–1100 S/cm |
| Carbon content | >99% |
| Apparent density | 0.06–0.09 g/mL |
| Water content | <2 wt.% |
| Residual impurities | <1 wt.% |
| Particle size distribution | D10 = 13.56 μm |
| D50 = 48.93 μm | |
| D90 = 122.2 μm |
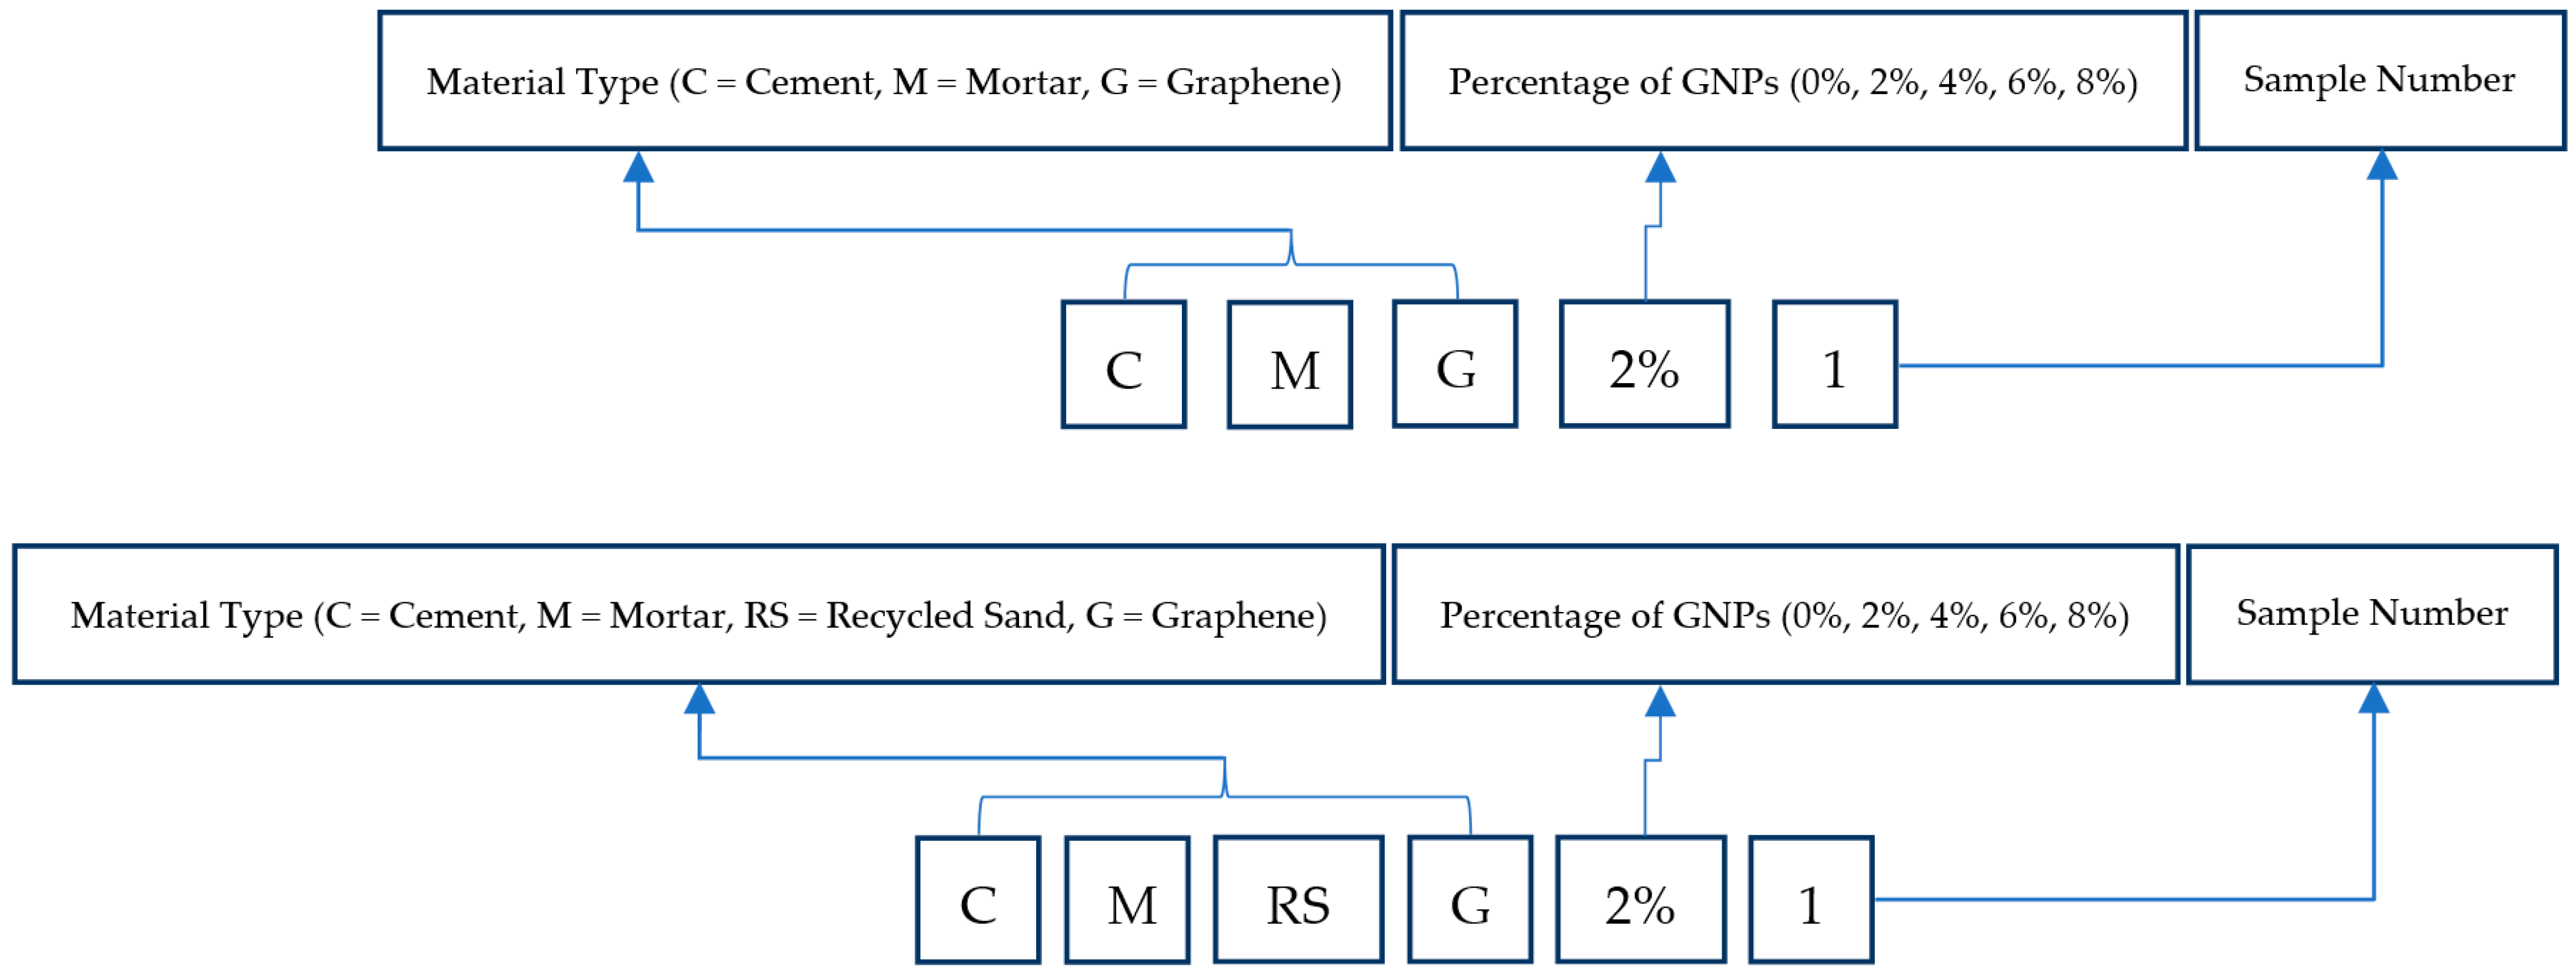
| No. | Specimen ID | Performed Test | Percentage of GNP | Filler Material |
|---|---|---|---|---|
| 1 | CMG0% | Compression | 0% | Natural Sand |
| 2 | CMG2% | Compression and Piezoresistive | 2% | Natural Sand |
| 3 | CMG4% | Compression and Piezoresistive | 4% | Natural Sand |
| 4 | CMG6% | Compression and Piezoresistive | 6% | Natural Sand |
| 5 | CMG8% | Compression and Piezoresistive | 8% | Natural Sand |
| 6 | CMRSG0% | Compression | 0% | Recycled Sand |
| 7 | CMRSG2% | Compression and Piezoresistive | 2% | Recycled Sand |
| 8 | CMRSG4% | Compression and Piezoresistive | 4% | Recycled Sand |
| 9 | CMRSG6% | Compression and Piezoresistive | 6% | Recycled Sand |
| 10 | CMRSG8% | Compression and Piezoresistive | 8% | Recycled Sand |
Disclaimer/Publisher’s Note: The statements, opinions and data contained in all publications are solely those of the individual author(s) and contributor(s) and not of MDPI and/or the editor(s). MDPI and/or the editor(s) disclaim responsibility for any injury to people or property resulting from any ideas, methods, instructions or products referred to in the content. |
© 2023 by the authors. Licensee MDPI, Basel, Switzerland. This article is an open access article distributed under the terms and conditions of the Creative Commons Attribution (CC BY) license (https://creativecommons.org/licenses/by/4.0/).
Share and Cite
Bibi, U.; Bahrami, A.; Shabbir, F.; Imran, M.; Nasir, M.A.; Ahmad, A. Graphene-Based Strain Sensing of Cementitious Composites with Natural and Recycled Sands. Sensors 2023, 23, 7175. https://doi.org/10.3390/s23167175
Bibi U, Bahrami A, Shabbir F, Imran M, Nasir MA, Ahmad A. Graphene-Based Strain Sensing of Cementitious Composites with Natural and Recycled Sands. Sensors. 2023; 23(16):7175. https://doi.org/10.3390/s23167175
Chicago/Turabian StyleBibi, Uzma, Alireza Bahrami, Faisal Shabbir, Muhammad Imran, Muhammad Ali Nasir, and Afaq Ahmad. 2023. "Graphene-Based Strain Sensing of Cementitious Composites with Natural and Recycled Sands" Sensors 23, no. 16: 7175. https://doi.org/10.3390/s23167175
APA StyleBibi, U., Bahrami, A., Shabbir, F., Imran, M., Nasir, M. A., & Ahmad, A. (2023). Graphene-Based Strain Sensing of Cementitious Composites with Natural and Recycled Sands. Sensors, 23(16), 7175. https://doi.org/10.3390/s23167175