
Concurrent Validity and Reliability of the Sprint Force–Velocity Profile Assessed with K-AI Wearable Tech


Abstract
:1. Introduction
2. Materials and Methods
2.1. Study Design
2.2. Participants
2.3. Procedure
2.4. Statistical Analysis
3. Results
4. Discussion
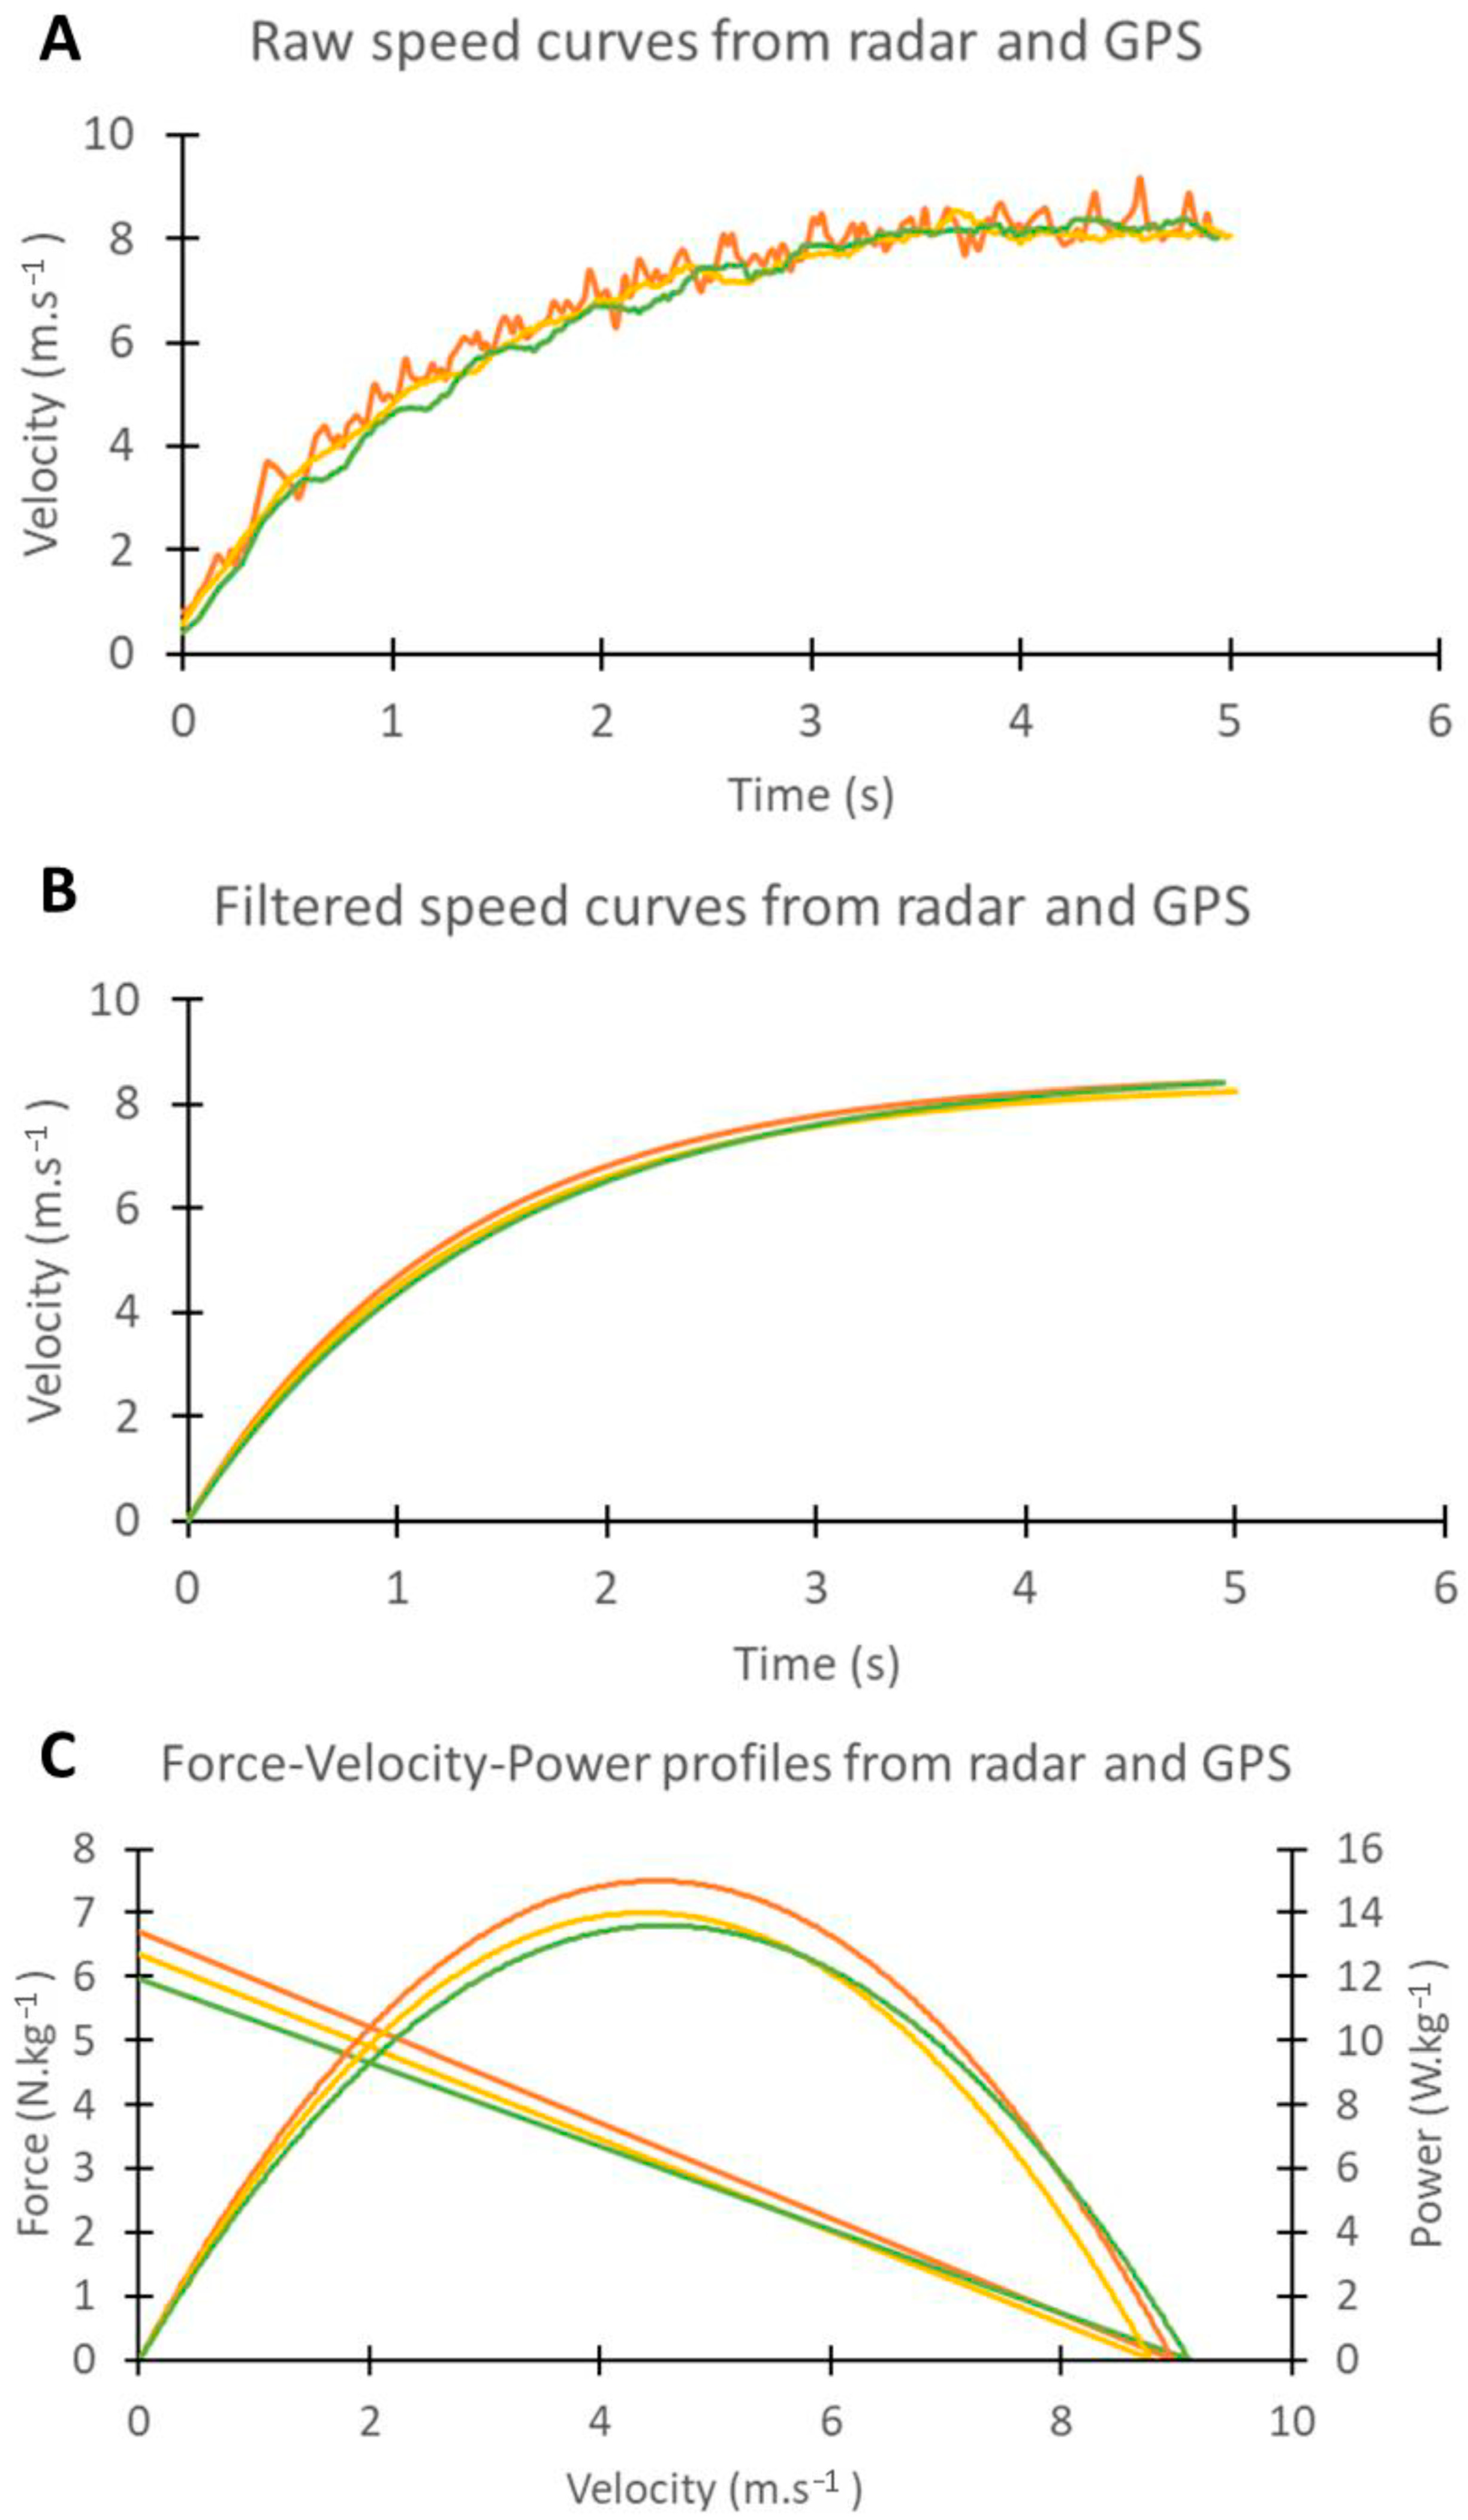
4.1. Signal Quality
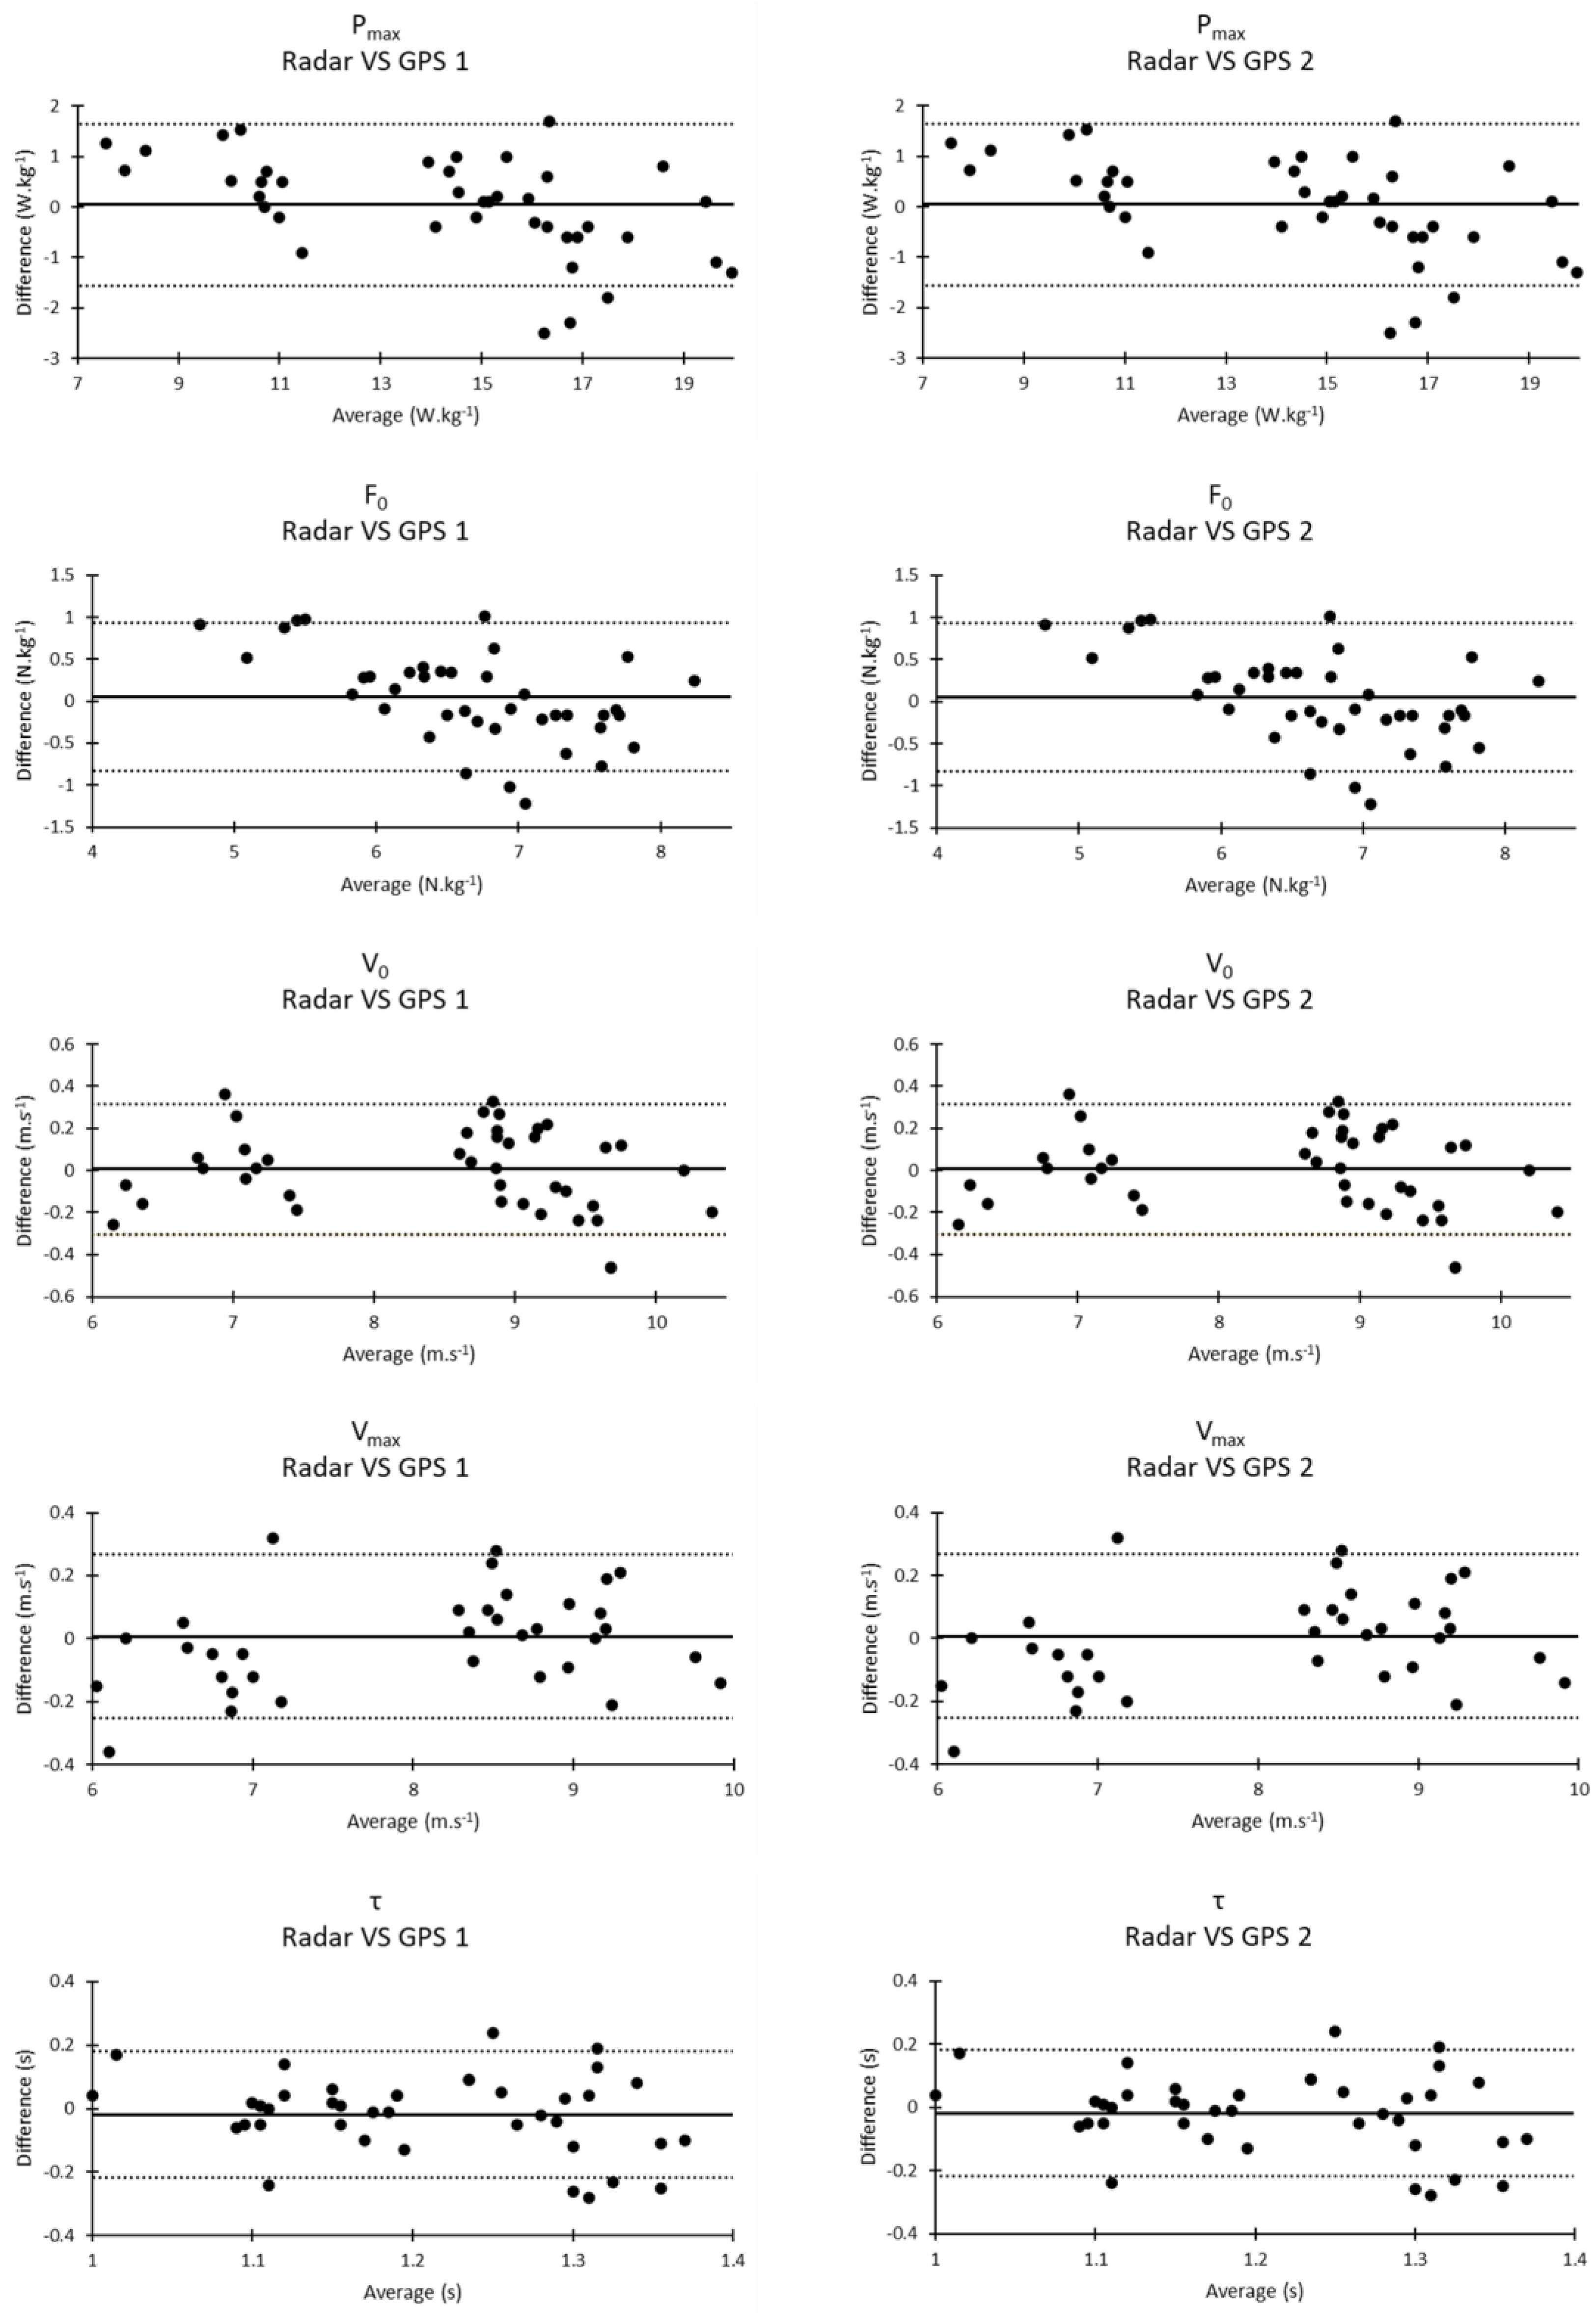
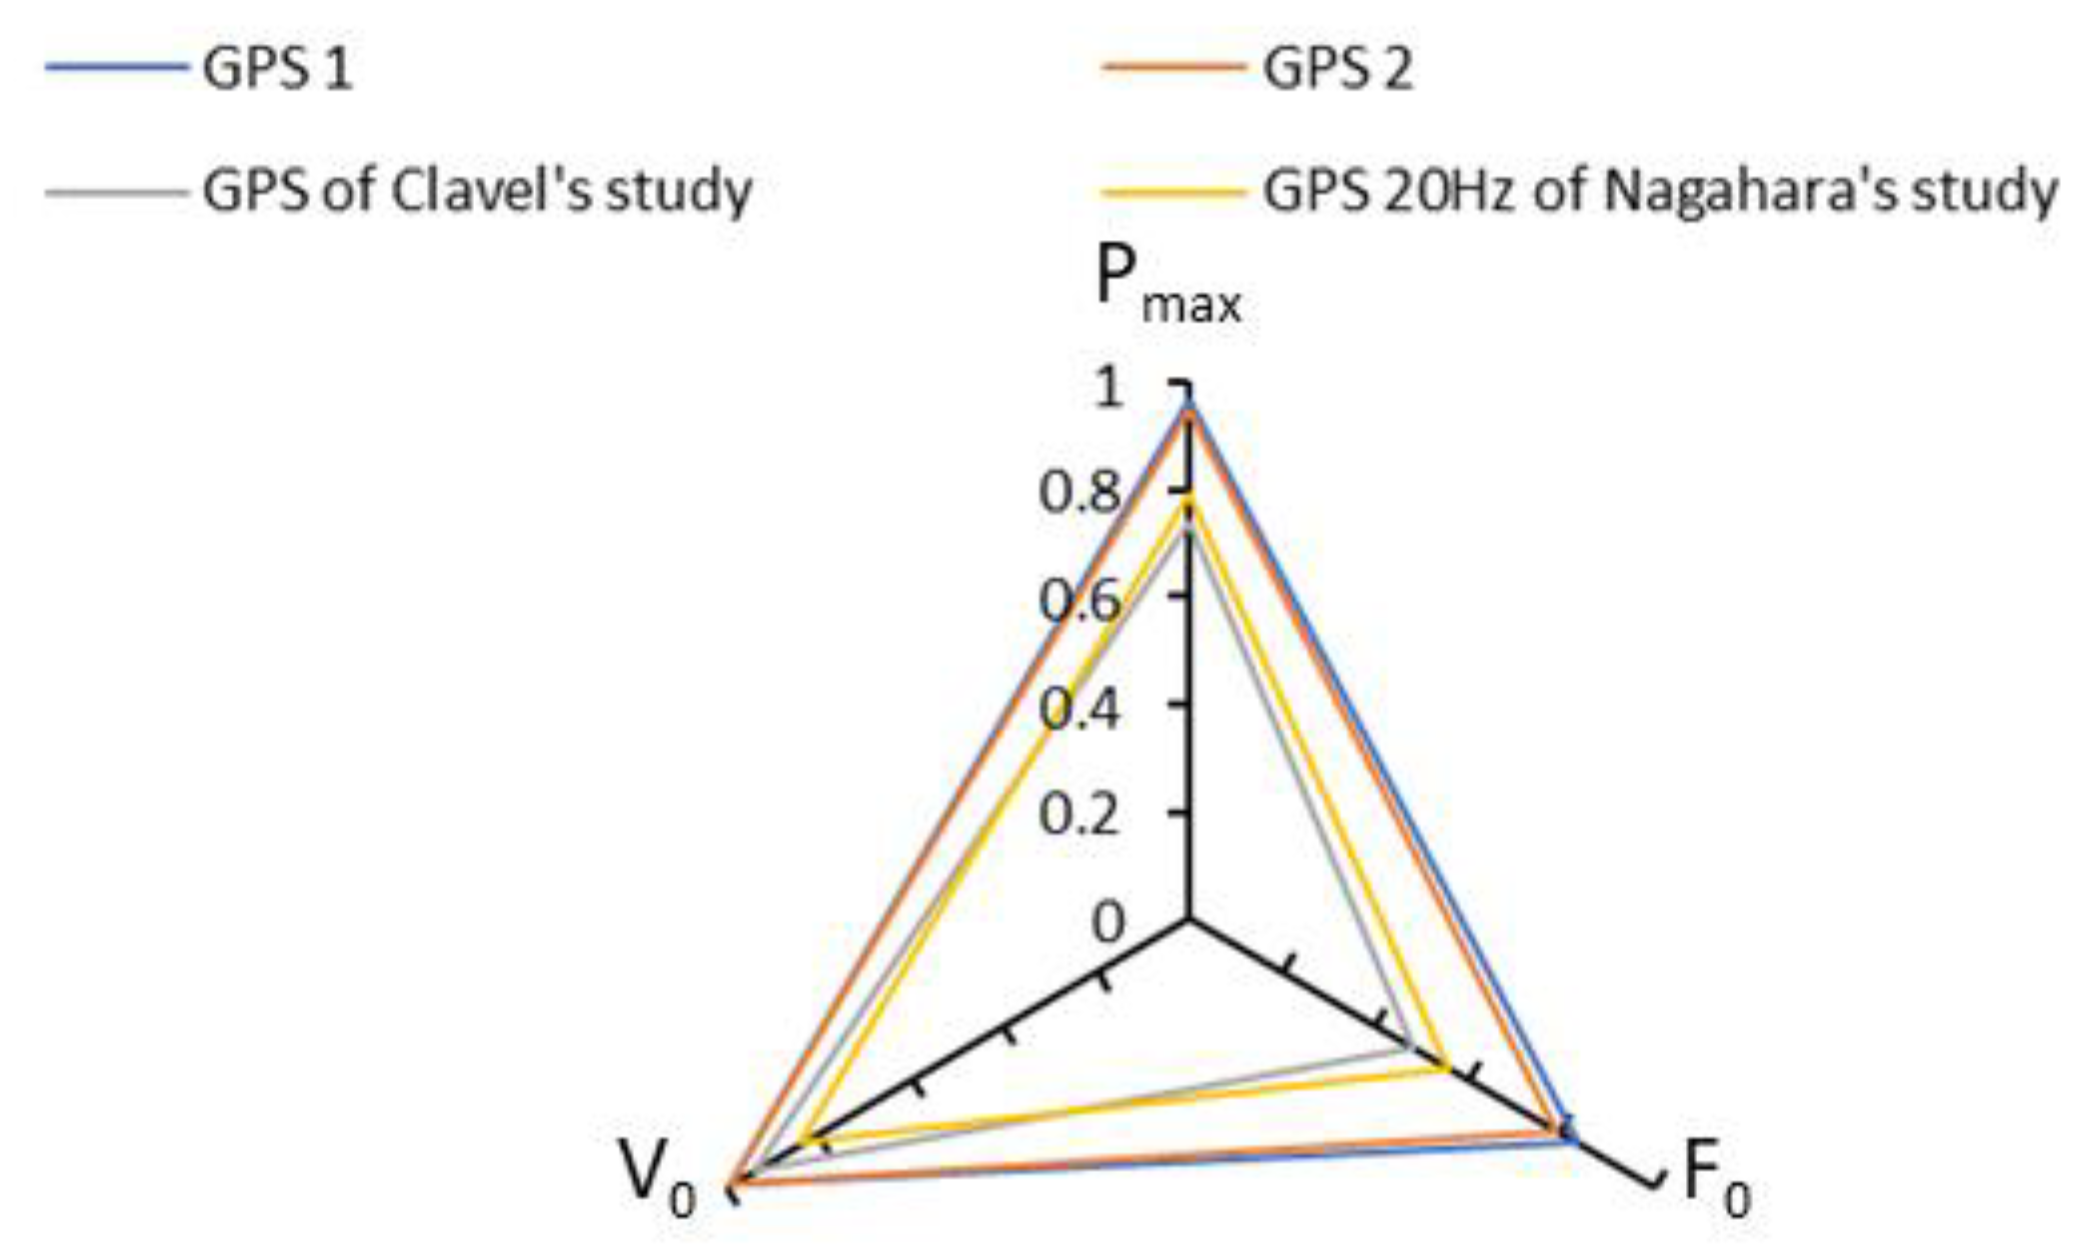
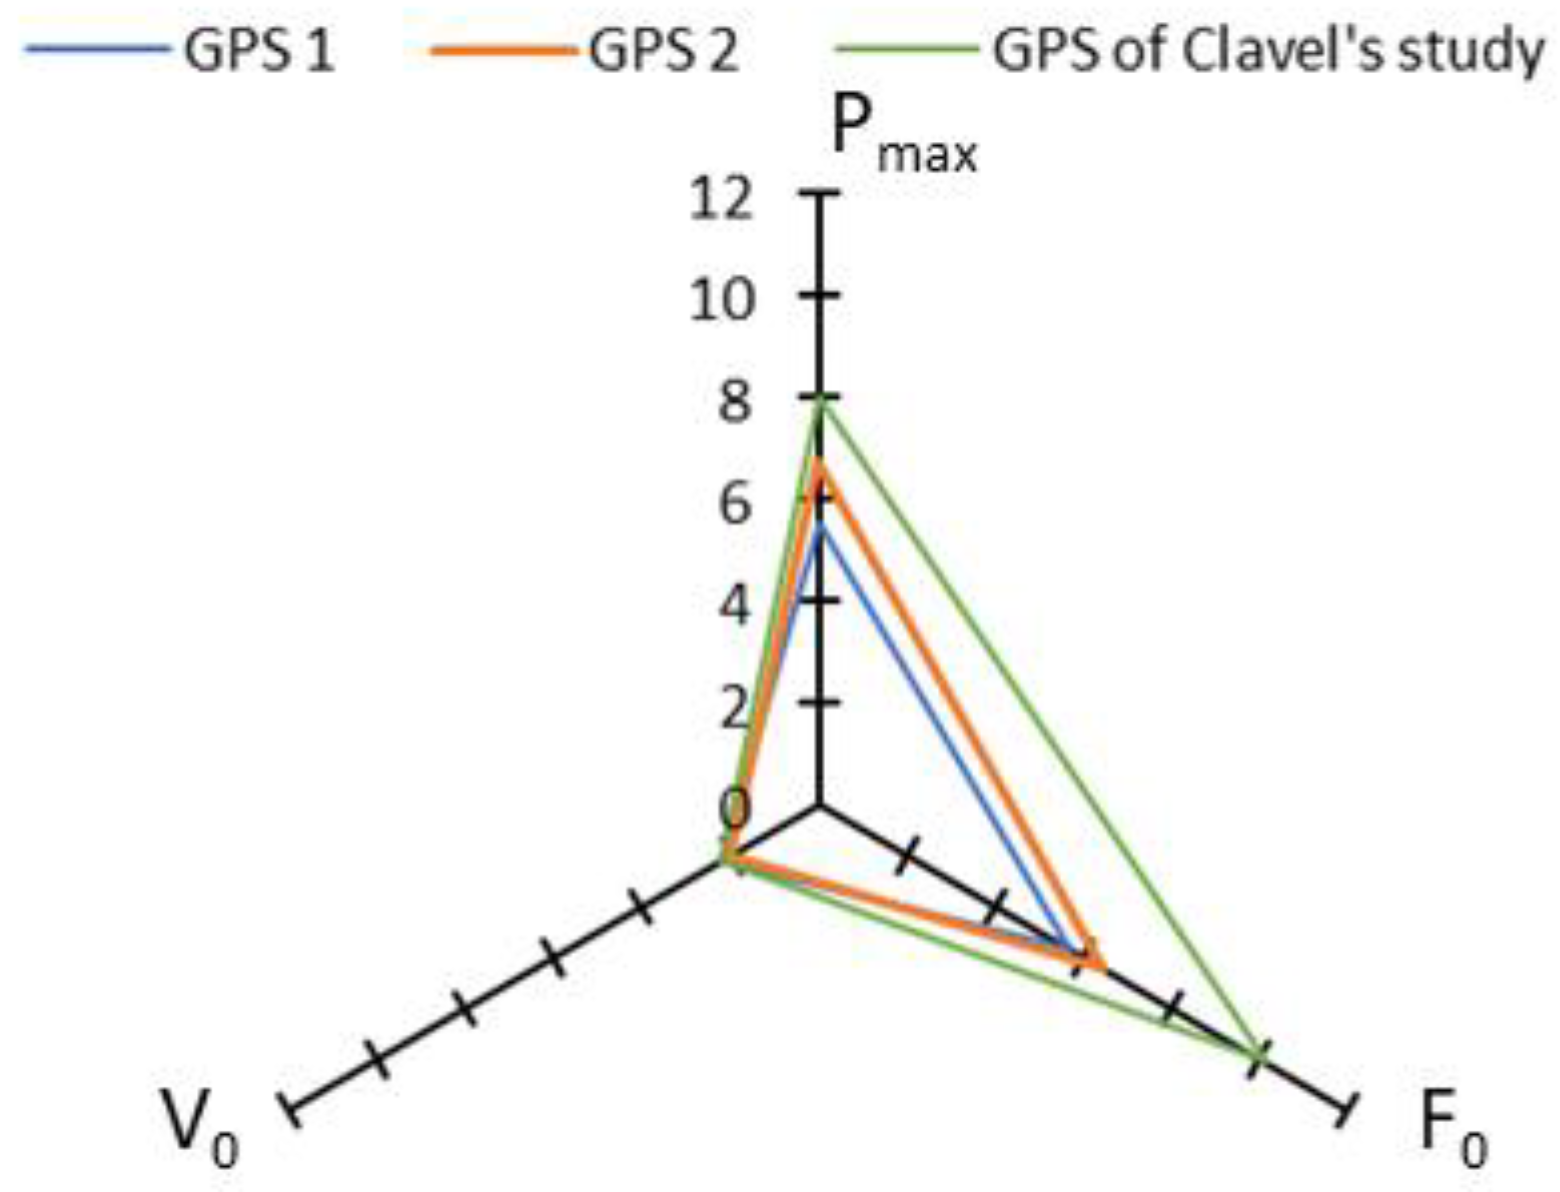
4.2. Output Variables Validity
4.3. Input Variables Concurrent Validity
4.4. Inter-Unit Reliability
4.5. Inter-Trial Reliability
4.6. Limitations
4.7. Practical Applications
- Users of the K-AI Wearable Tech (with 50 Hz sampling frequency) may consider this tool as a valid alternative to radar for evaluating a sprint acceleration force–velocity profile.
- The force–velocity profile variables obtained show a good inter-unit reliability, meaning that GPS devices can be used interchangeably to measure force–velocity profiles.
- The force–velocity profile variables obtained show a good inter-trial reliability for both radar and GPS, but it is important to consistently use the same measurement device, either radar or GPS, to ensure valid comparisons.
5. Conclusions and Perspectives
Author Contributions
Funding
Institutional Review Board Statement
Informed Consent Statement
Data Availability Statement
Acknowledgments
Conflicts of Interest
References
- Faude, O.; Koch, T.; Meyer, T. Straight sprinting is the most frequent action in goal situations in professional football. J. Sport. Sci. 2012, 30, 625–631. [Google Scholar] [CrossRef] [PubMed]
- Haugen, T.A.; Breitschädel, F.; Seiler, S. Sprint mechanical variables in elites athletes: Are force-velocity profiles sport specific or individual ? PLoS ONE 2019, 14, e0215551. [Google Scholar] [CrossRef] [PubMed]
- Colyer, S.L.; Nagahara, R.; Takai, Y.; Salo, A.I.T. How sprinters accelerate beyond the velocity plateau of soccer players: Waveform analysis of ground reaction forces. Scand. J. Med. Sci. Sport. 2018, 28, 2527–2535. [Google Scholar] [CrossRef] [PubMed]
- Rabita, G.; Dorel, S.; Slawinski, J.; de Villarreal, E.S.; Couturier, A.; Samozino, P.; Morin, J.B. Sprint mechanics in world-class athletes: A new insight into the limits of human locomotion. Scand. J. Med. Sci. Sport. 2015, 25, 583–594. [Google Scholar] [CrossRef]
- Morin, J.B.; Samozino, P.; Murata, M.; Cross, M.R.; Nagahara, R. A simple method for computing sprint acceleration kinetics from running velocity data: Replication study with improved design. J. Biomech. 2019, 94, 82–87. [Google Scholar] [CrossRef]
- Nagahara, R.; Botter, A.; Rejc, E.; Koidi, M.; Shimizu, T.; Samozino, P.; Morin, J.B. Concurrent validity of GPS for deriving mechanical properties of sprint acceleration. Int. J. Sport. Physiol. Perform. 2017, 12, 129–132. [Google Scholar] [CrossRef]
- Lacome, M.; Owen, C.; Peeters, A.; Piscione, J.; LeMeur, Y.; Leduc, C. Force velocity profiling with GPS: Is it reliable? Sport Perform. Sci. 2020, 115, 1–3. [Google Scholar]
- Clavel, P.; Leduc, C.; Morin, J.B.; Owen, C.; Samozino, P.; Peeters, A.; Buchheit, M.; Lacome, M. Concurrent validity and reliability of sprinting force-velocity profile assessed with GPS devices in elite athletes. Int. J. Sport. Physiol. Perform. 2022, 17, 1527–1531. [Google Scholar] [CrossRef]
- Ravé, G.; Granacher, U.; Boullosa, D.; Hackney, A.C.; Zouhal, H. How to use global positioning systems (GPS) data to monitor training load in the “real world” of elite soccer. Front. Physiol. 2020, 11, 944. [Google Scholar] [CrossRef]
- Aughey, R.J. Applications of GPS technologies to field sports. Int. J. Sport. Physiol. Perform. 2011, 6, 295–310. [Google Scholar] [CrossRef]
- Scott, M.T.; Scott, T.J.; Kelly, V.G. Validity and reliability of global positioning systems in team sport: A brief review. J. Strength Cond. Res. 2016, 30, 1470–1490. [Google Scholar] [CrossRef] [PubMed]
- Pons, E.; García-Calvo, T.; Cos, F.; Resta, R.; Blanco, H.; López Del Campo, R.; Díaz-García, J.; Pulido-González, J.J. Integrating video tracking and GPS to quantify accelerations and decelerations in elite soccer. Sci. Rep. 2021, 11, 18531. [Google Scholar] [CrossRef] [PubMed]
- Fornasier-Santos, C.; Arnould, A.; Jusseaume, J.; Millot, B.; Guilhem, G.; Couturier, A.; Samozino, P.; Slawinski, J.; Morin, J.B. Sprint acceleration mechanical outputs derived from position- or velocity-time data: A multi-system comparison study. Sensors 2022, 22, 8610. [Google Scholar] [CrossRef] [PubMed]
- Malone, J.J.; Lovell, R.; Varley, M.C.; Coutts, A.J. Unpacking the black box: Applications and considerations for using GPS devices in sport. Int. J. Sport. Physiol. Perform. 2017, 12, S18–S226. [Google Scholar] [CrossRef]
- Isik, O.K.; Hong, J.; Petrunin, I.; Tsourdos, A. Integrity Analysis for GPS-Based Navigation of UAVs in Urban Environment. Robotics 2020, 9, 66. [Google Scholar] [CrossRef]
- Trafimow, D.; Wang, T.; Wang, C.; Myüz, H.A. Does slight skewness matter? Int. J. Aviat. Res. 2019, 11, 11–24. [Google Scholar] [CrossRef]
- Weir, J.P. Quantifying test-retest reliability using the intraclass correlation coefficient and the SEM. J. Strength Cond. Res. 2005, 19, 231–240. [Google Scholar] [CrossRef]
- Hopkins, W.G. Measures of reliability in sports medicine and science. Sport. Med. 2000, 30, 1–15. [Google Scholar] [CrossRef]
- Giavarina, D. Understanding Bland Altman analysis. Biochem. Med. 2015, 25, 141–151. [Google Scholar] [CrossRef]
- Komino, P.; Le Mat, Y.; Zadro, I.; Osgnach, C.; Morin, J.B. Sprint acceleration mechanical outputs: Direct comparison between GPEXE Pro2 and 1080 sprint devices. Sport. Perform. Sci. 2022, 163, 1–5. [Google Scholar]
- Hoppe, M.W.; Baumgart, C.; Polglaze, T.; Freiwald, J. Validity and reliability of GPS and LPS for measuring distances covered and sprint mechanical properties in team sports. PLoS ONE 2018, 13, e0192708. [Google Scholar] [CrossRef] [PubMed]
- Samozino, P.; Rivière, J.R.; Jimenez-Reyes, P.; Cross, M.R.; Morin, J.B. Is the concept, method or measurement to blame for testing error? An illustration using the force-velocity-power profile. Int. J. Sport. Physiol. Perform. 2022, 17, 1760–1768. [Google Scholar] [CrossRef] [PubMed]
- Buchheit, M.; Al Haddad, H.; Simpson, B.M.; Palazzi, D.; Bourdon, P.C.; Di Salvo, V.; Mendez-Villanueva, A. Monitoring acceleration with GPS in football: Time to slow down? Int. J. Sport. Physiol. Perform. 2014, 9, 442–445. [Google Scholar] [CrossRef] [PubMed]
- Haugen, T.; Buchheit, M. Sprint running performance monitoring: Methodological and practical considerations. Sport. Med. 2016, 46, 641–656. [Google Scholar] [CrossRef] [PubMed]
- Cormier, P.; Tsai, M.C.; Meylan, C.; Klimstra, M. Comparison of acceleration-speed profiles from training and competition to individual maximal sprint efforts. J. Biomech. 2023, 157, 111724. [Google Scholar] [CrossRef]


| Pmax (W·kg−1) | F0 (N·kg−1) | V0 (m·s−1) | Vmax (m·s−1) | τ (s) | |
|---|---|---|---|---|---|
| GPS 1 Validity | |||||
| Radar | 14.3 ± 3.1 | 6.7 ± 0.69 | 8.5 ± 1.2 | 8.2 ± 1.1 | 1.2 ± 0.1 |
| GPS 1 | 14.3 ± 3.6 | 6.6 ± 0.97 | 8.5 ± 1.2 | 8.2 ± 1.1 | 1.2 ± 0.1 |
| Mean bias (%) | 1.3 | 1.4 | 0.08 | 0.11 | −1.3 |
| Standardized mean bias | 0.01 | 0.08 | 0.00 | 0.01 | −0.17 |
| TEE as CV (%) | 5.5 | 5.7 | 2.2 | 1.9 | 7.6 |
| Standardized TEE | 0.26 | 0.64 | 0.16 | 0.15 | 1.8 |
| GPS 2 Validity | |||||
| Radar | 14.3 ± 3.1 | 6.7 ± 0.69 | 8.5 ± 1.2 | 8.2 ± 1.1 | 1.2 ± 0.1 |
| GPS 2 | 14.4 ± 3.8 | 6.7 ± 0.97 | 8.5 ± 1.2 | 8.2 ± 1.1 | 1.2 ± 0.1 |
| Mean bias (%) | 0.77 | 1.3 | −0.54 | −0.49 | −1.8 |
| Standardized mean bias | −0.02 | 0.05 | −0.04 | −0.04 | −0.23 |
| TEE as CV (%) | 6.7 | 6.4 | 2 | 1.6 | 8 |
| Standardized TEE | 0.32 | 0.77 | 0.14 | 0.12 | 2.5 |
| Pmax (W·kg−1) | F0 (N·kg−1) | V0 (m·s−1) | Vmax (m·s−1) | τ (s) | |
|---|---|---|---|---|---|
| Reliability | |||||
| GPS 1 (mean ± SD) | 14.3 ± 3.6 | 6.6 ± 0.97 | 8.5 ± 1.2 | 8.2 ± 1.1 | 1.2 ± 0.1 |
| GPS 2 (mean ± SD) | 14.4 ± 3.8 | 6.7 ± 0.97 | 8.5 ± 1.2 | 8.2 ± 1.1 | 1.2 ± 0.1 |
| TE as CV (%) | 5.0 | 6.0 | 1.9 | 1.6 | 6.4 |
| Standardized TE | 0.20 | 0.43 | 0.14 | 0.12 | 0.75 |
| ICC (90% CI) | 0.96 (0.94–0.98) | 0.85 (0.76–0.91) | 0.98 (0.97–0.99) | 0.99 (0.98–0.99) | 0.65 (0.47–0.78) |
| ICC interpretation | Excellent | Good | Excellent | Excellent | Moderate |
| SWC (%) | 5.1 | 3.1 | 2.8 | 2.7 | 2.1 |
| Sensitivity | Good | Poor | Good | Good | Poor |
| CV Inter-Trial Mean ± SD (%) | Change in the Mean ± SEM | MDC (95% CI) | |||||||
|---|---|---|---|---|---|---|---|---|---|
| Radar | GPS 1 | GPS 2 | Radar | GPS 1 | GPS 2 | Radar | GPS 1 | GPS 2 | |
| Pmax (W.kg−1) | 3.1 ± 2.9 | 4.6 ± 4.5 | 4.2 ± 3.1 | 0.38 ± 0.94 | −0.29 ± 1.4 | 0.2 ± 1.2 | 2.61 | 3.88 | 3.33 |
| F0 (N.kg−1) | 3.3 ± 2.9 | 5.1 ± 5 | 4.7 ± 3.2 | 0.16 ± 0.42 | −0.19 ± 0.69 | 0 ± 0.58 | 1.16 | 1.91 | 1.61 |
| V0 (m.s−1) | 0.96 ± 0.7 | 1.4 ± 1.1 | 1.1 ± 0.8 | 0.01 ± 0.15 | 0.11 ± 0.22 | 0.07 ± 0.17 | 0.42 | 0.61 | 0.47 |
| Vmax (m.s−1) | 0.91 ± 0.64 | 1.2 ± 1 | 1 ± 0.69 | 0.01 ± 0.13 | 0.09 ± 0.18 | 0.07 ± 0.14 | 0.36 | 0.50 | 0.39 |
| τ (s) | 3.7 ± 3.2 | 5.6 ± 5.7 | 4.9 ± 3.7 | −0.02 ± 0.08 | 0.05 ± 0.13 | 0 ± 0.11 | 0.22 | 0.36 | 0.30 |
Disclaimer/Publisher’s Note: The statements, opinions and data contained in all publications are solely those of the individual author(s) and contributor(s) and not of MDPI and/or the editor(s). MDPI and/or the editor(s) disclaim responsibility for any injury to people or property resulting from any ideas, methods, instructions or products referred to in the content. |
© 2023 by the authors. Licensee MDPI, Basel, Switzerland. This article is an open access article distributed under the terms and conditions of the Creative Commons Attribution (CC BY) license (https://creativecommons.org/licenses/by/4.0/).
Share and Cite
Vantieghem-Nicolas, L.; Morin, J.-B.; Cotte, T.; Sangnier, S.; Rossi, J. Concurrent Validity and Reliability of the Sprint Force–Velocity Profile Assessed with K-AI Wearable Tech. Sensors 2023, 23, 8189. https://doi.org/10.3390/s23198189
Vantieghem-Nicolas L, Morin J-B, Cotte T, Sangnier S, Rossi J. Concurrent Validity and Reliability of the Sprint Force–Velocity Profile Assessed with K-AI Wearable Tech. Sensors. 2023; 23(19):8189. https://doi.org/10.3390/s23198189
Chicago/Turabian StyleVantieghem-Nicolas, Laurine, Jean-Benoit Morin, Thierry Cotte, Sébastien Sangnier, and Jeremy Rossi. 2023. "Concurrent Validity and Reliability of the Sprint Force–Velocity Profile Assessed with K-AI Wearable Tech" Sensors 23, no. 19: 8189. https://doi.org/10.3390/s23198189
APA StyleVantieghem-Nicolas, L., Morin, J.-B., Cotte, T., Sangnier, S., & Rossi, J. (2023). Concurrent Validity and Reliability of the Sprint Force–Velocity Profile Assessed with K-AI Wearable Tech. Sensors, 23(19), 8189. https://doi.org/10.3390/s23198189