
Cyber-Physical-Social Awareness Platform for Comprehensive Situation Awareness


Abstract
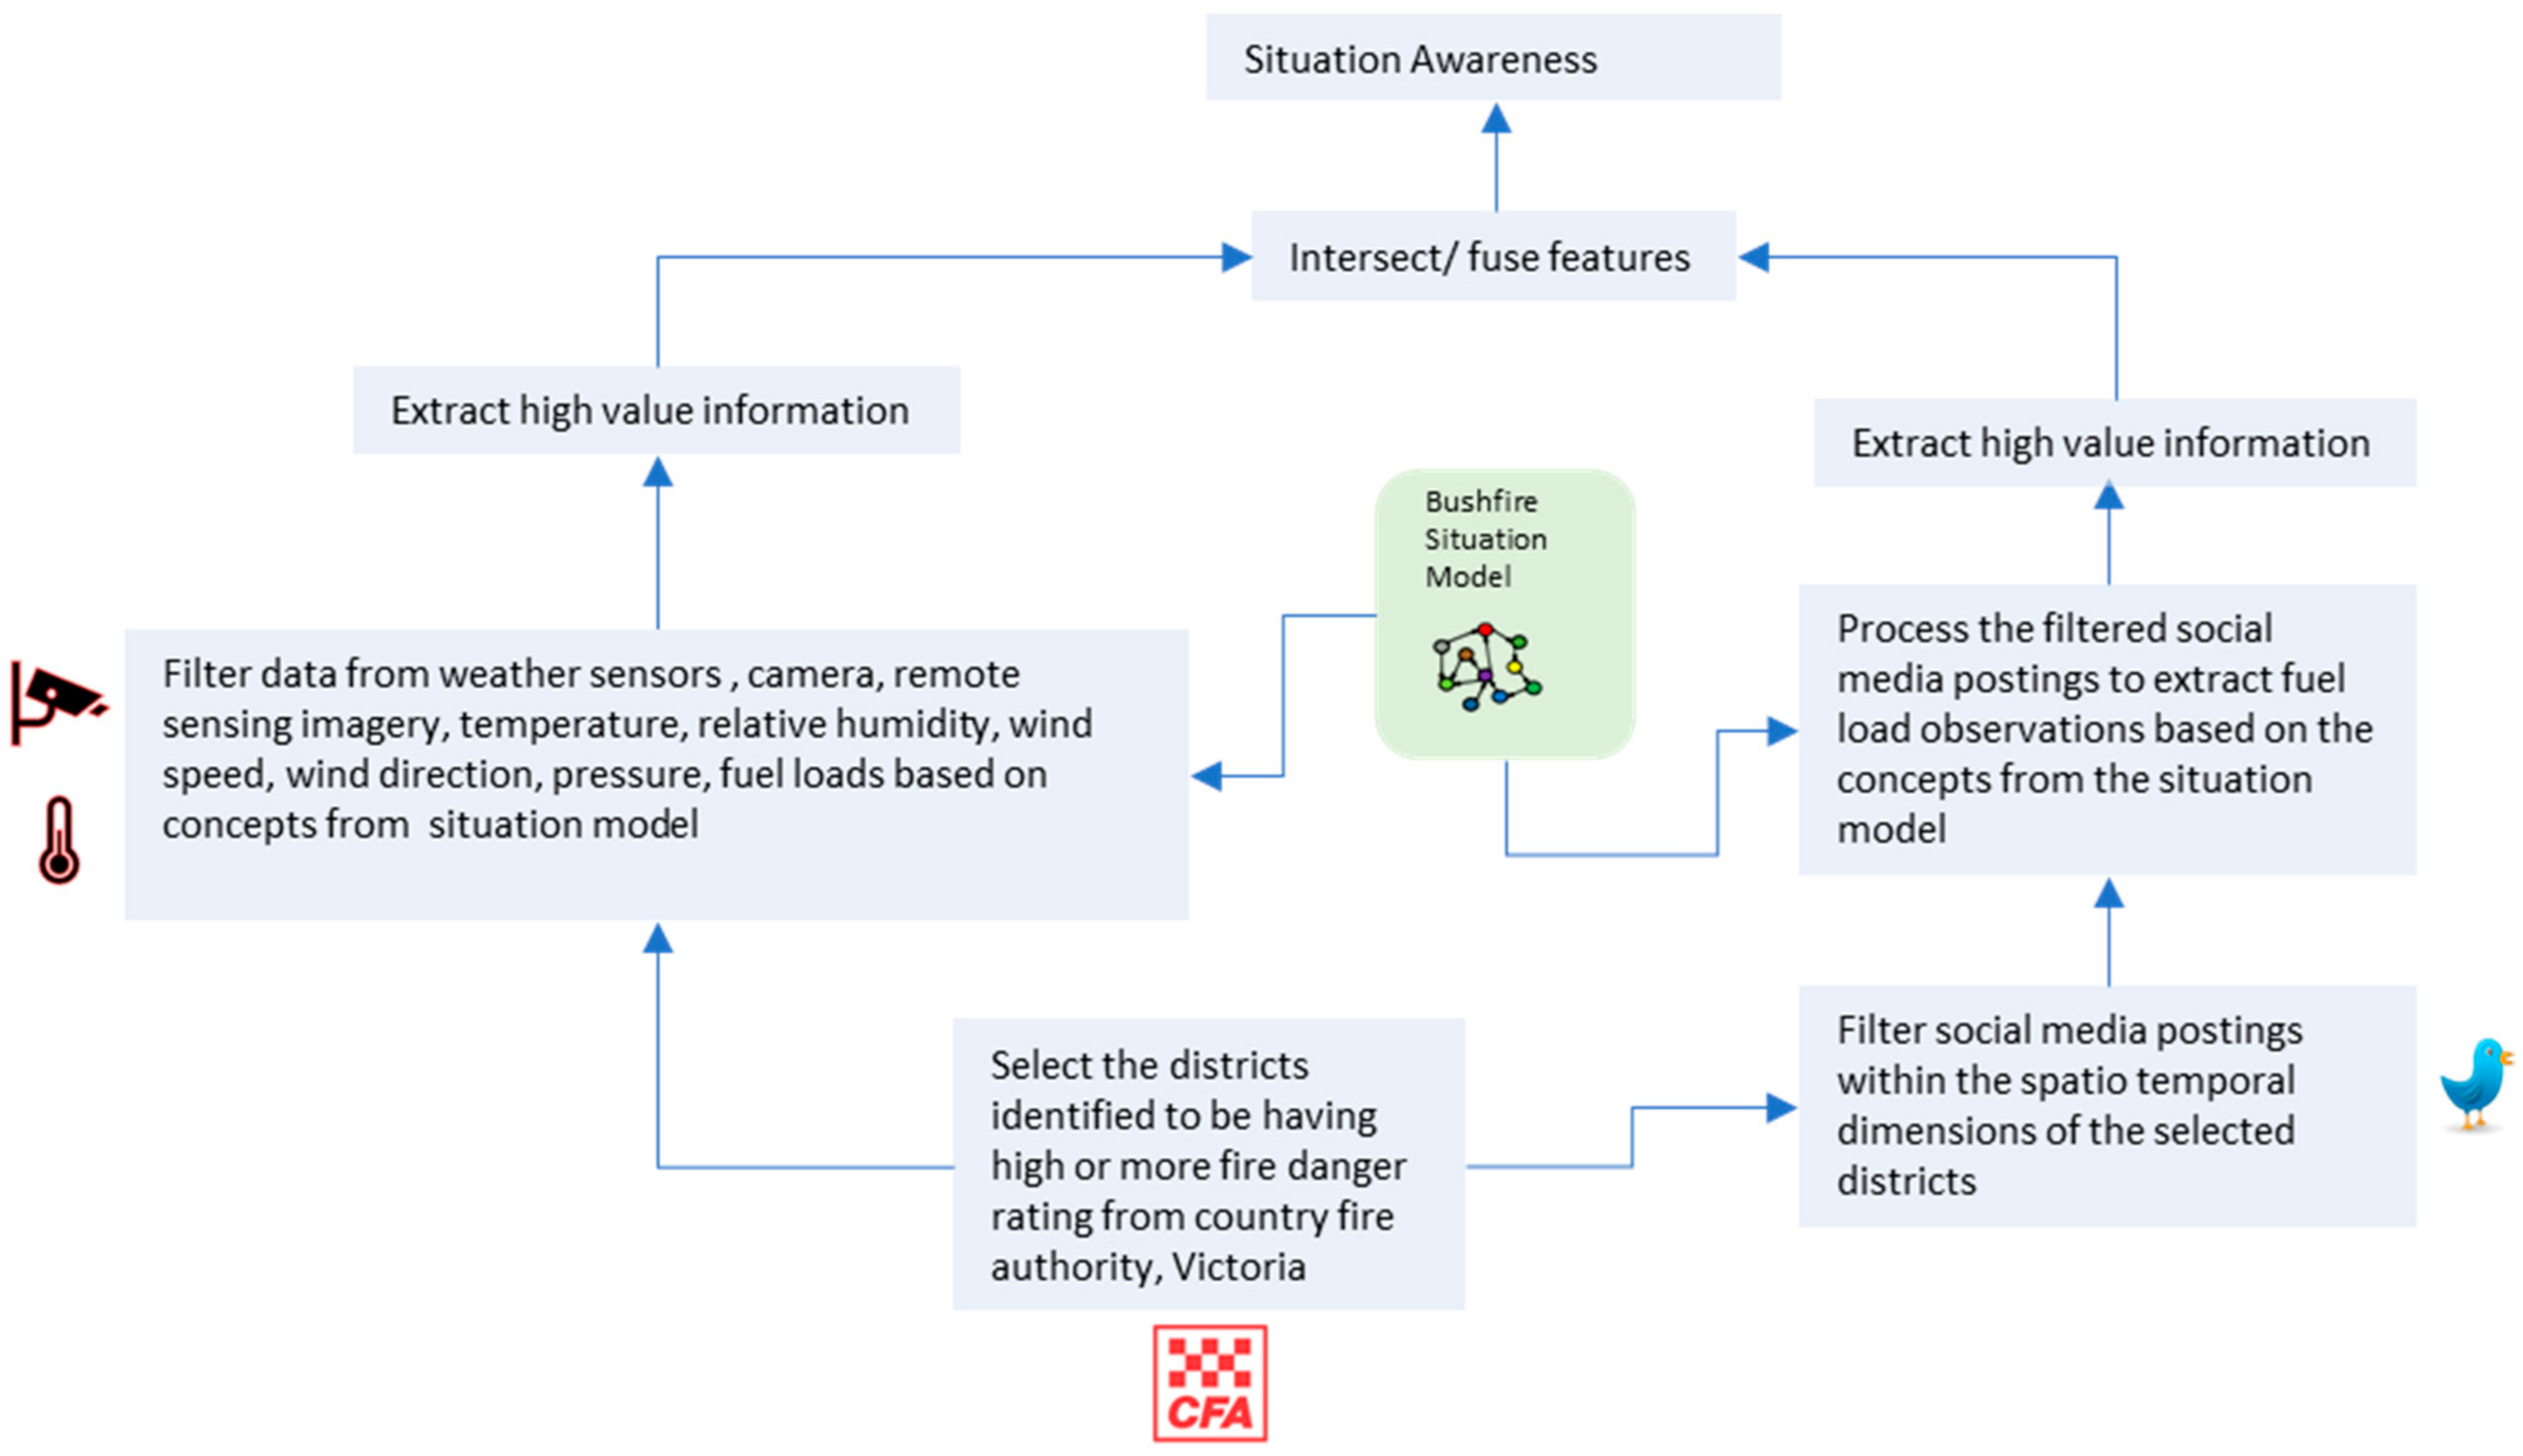
:1. Introduction
- A Semantic Framework for describing situations of interest.
- A CPSA platform that uses the situation models to integrate and intersect information from sensors and social media.
- A proof-of-concept implementation of CPSA platform including a cloud-based visualisation dashboard for monitoring the health and performance of the CPSA platform in real time.
- An experimental evaluation that shows the benefits of the CPSA platform for enriching situation awareness.
- A fault tolerance-related evaluation of the CPSA platform that shows the CPSA platform can reliably handle large volumes of social media and sensor data.
2. Related Work in Situation Awareness Systems and Cyber-Physical-Social Computing
3. Benefits from Intersecting and Fusing Sensor and Social Media Information Spaces
3.1. Motivating Example—Identifying Potential Bushfire Hotspots and Improving Bushfire Emergency Management
3.2. Semantic Integration
4. Architecture of Cyber-Physical-Social Awareness (CPSA) Platform
- The architecture of the CPSA platform should have the capability to connect to any potential data source in IoT sensors and social media platforms, from the cloud environment.
- The CPSA platform architecture should support the semantic description of situations and the intersection of high-value information from IoT sensor and social media information spaces.
- The CPSA platform should be able to provide data harvesting capabilities in a fault-tolerant manner when harvesting data from sensors and social media sources at the same time.
- The physical infrastructure of the CPSA platform should be scalable to handle different data processing and analytical workloads.
- The CPSA platform should be able to export the situation awareness results or cloud infrastructure health information via cloud APIs for end users.
5. CPSA Data Harvesting
6. CPSA Feature Extraction and Mapping
6.1. Situation Modelling
6.2. Sensor Feature Extraction and Mapping Engine
6.3. Social Media Feature Extraction and Mapping Engine
7. CPSA Sensor and Social Media Information Fusion
8. Implementation and Evaluation of CPSA Platform
8.1. Implementation of the Data-Harvesting Layer in the CPSA Platform
8.2. Health Management Implementation Model of Data-Harvesting Layer in the CPSA Platform
8.3. Implementation Model of Feature Extraction and Situation-Mapping Layer in CPSA Platform
8.4. Implementation Model of Sensor and Social Media Information Fusion Layer in CPSA Platform
8.5. Evaluation of the CPSA Platform
8.5.1. Semantic Integration in CPSA Platform
- {‘unit’: ‘http://qudt.org/1.1/vocab/unit#MeterPerSecond’, ‘unit_txt’: ‘degreeAngle’, ‘unit_symbol’: ‘m/s’, ‘cdt_type’: ‘ucum’}
- wind_gust
- <http://www.w3.org/ns/sosa/sensor/86338> a sosa:Weather_Station ;
- sosa:observedProperty <http://www.w3.org/ns/sosa/observableProperty/wind_gust> ;
- sosa:hasFeatureOfInterest <http://www.w3.org/ns/sosa/FeatureOfInterest/wind> ;
- sosa:madeBySensor <http://www.w3.org/ns/sosa/Sensor/windspeed_sensor> ;
- geo:lat “−37.8255”;
- geo:long “144.9816”;
- senso:hasCity “melbourne” ;
- senso:hasPlace “melbourne (olympic park)” ;
- sosa:resultTime “2021-11-29 19:20:00”^^xsd:dateTime ;
- sosa:hasSimpleResult “9 “^^cdt:.
 @ Nimmons Bridge https://t.co/K23JxdCBBU, accessed on 6 December 2022”. This posting was posted from Newtown in Australia. We implemented the transformation process described in [35] and the corresponding transformed record for the social media posting is shown below
- Tweet country: Australia
- Tweet place name: Newtown
- Closest weather station: BALLARAT
- Location mentioned: [48]
- Observable property: temperature
- Similarity score, 53.0
- Person count: 1
- <http://www.w3.org/ns/sosa/Sensor/1496441118602452997, accessed on 6 December 2022> a sosa:Sensor;
- rdfs:label “Social_Sensor_from_BALLARAT”;
- sosa:observes <http://www.w3.org/ns/sosa/observableProperty/temperature, accessed on 6 December 2022>;
- sosa:madeObservation <http://www.w3.org/ns/sosa/Observation/temperature_observation_from_BALLARAT, accessed on 6 December 2022>;
- sosa:resultTime “2022_02_23_11_05_39”^^xsd:dateTime;
- senso:isReportingOn “temperature”;
- senso:similarityStrength “53.0percent”;
- senso:hasPersonCount “1”;
- senso:hasCity “BALLARAT”.
8.5.2. Reliable Handling of Large Volumes of IoT Sensor and Social Media Data
9. Discussion of the CPSA Platform
10. Conclusions and Future Work
Author Contributions
Funding
Institutional Review Board Statement
Informed Consent Statement
Data Availability Statement
Acknowledgments
Conflicts of Interest
References
- Shah, S.A.; Seker, D.Z.; Rathore, M.M.; Hameed, S.; Yahia, S.B.; Draheim, D. Towards Disaster Resilient Smart Cities: Can Internet of Things and Big Data Analytics Be the Game Changers? IEEE Access 2019, 7, 91885–91903. [Google Scholar] [CrossRef]
- Bischke, B.; Borth, D.; Schulze, C.; Dengel, A. Contextual Enrichment of Remote-Sensed Events with Social Media Streams; ACM Press: New York, NY, USA, 2016. [Google Scholar]
- Dredze, M.; Broniatowski, D. The Twitter Social Mobility Index: Measuring Social Distancing Practices with Geolocated Tweets. J. Med. Internet Res. 2020, 22, e21499. [Google Scholar]
- Liu, F.; Xu, D. Social Roles and Consequences in Using Social Media in Disasters: A Structurational Perspective. Inf. Syst. Front. 2018, 20, 693–711. [Google Scholar] [CrossRef]
- Saha, K.; Choudhury, M. Modeling Stress with Social Media around Incidents of Gun Violence on College Campuses. Proc. ACM Hum.-Comput. Interact. 2017, 1, 92. [Google Scholar] [CrossRef]
- Fang, J.; Hu, J.; Shi, X.; Zhao, L. Assessing disaster impacts and response using social media data in China: A case study of 2016 Wuhan rainstorm. Int. J. Disaster Risk Reduct. 2019, 34, 275–282. [Google Scholar] [CrossRef]
- Chen, J.; Chen, H.; Wu, Z.; Hu, D.; Pan, J.Z. Forecasting smog-related health hazard based on social media and physical sensor. Inf. Syst. 2017, 64, 281–291. [Google Scholar] [CrossRef]
- Gui, X.; Kou, Y.; Pine, K.H.; Chen, Y. Managing uncertainty: Using social media for risk assessment during a public health crisis. In Proceedings of the 2017 CHI Conference on Human Factors in Computing Systems, Denver, CO, USA, 6–11 May 2017; pp. 4520–4533. [Google Scholar]
- Endsley, M.R. Toward a Theory of Situation Awareness in Dynamic Systems. Hum. Factors J. Hum. Factors Ergon. Soc. 1995, 37, 32–64. [Google Scholar] [CrossRef]
- Zhou, Y.; Yu, F.R.; Chen, J.; Kuo, Y. Cyber-Physical-Social Systems: A State-of-the-Art Survey, Challenges and Opportunities. IEEE Commun. Surv. Tutor. 2020, 22, 389–425. [Google Scholar] [CrossRef]
- Yilma, B.A.; Panetto, H.; Naudet, Y. Systemic formalisation of Cyber-Physical-Social System (CPSS): A systematic literature review. Comput. Ind. 2021, 129, 103458. [Google Scholar] [CrossRef]
- Pasandideh, S.; Pereira, P.; Gomes, L. Cyber-Physical-Social Systems: Taxonomy, Challenges, and Opportunities. IEEE Access 2022, 10, 42404–42419. [Google Scholar] [CrossRef]
- Reine, F.; Juwono, H.; Sim, Z.A.; Wong, W.K. Cyber-Physical-Social Systems: An Overview. In Smart Connected World: Technologies and Applications Shaping the Future; Jain, S., Murugesan, S., Eds.; Springer International Publishing: Cham, Switzerland, 2021; pp. 25–45. [Google Scholar]
- Zaslavsky, A.; Georgakopoulos, D. Internet of Things: Challenges and State-of-the-Art Solutions in Internet-Scale Sensor Information Management and Mobile Analytics. In Proceedings of the 2015 16th IEEE International Conference on Mobile Data Management, Pittsburgh, PA, USA, 15–18 June 2015. [Google Scholar]
- Perera, C.; Zaslavsky, A.; Compton, M.; Christen, P.; Georgakopoulos, D. Semantic-Driven Configuration of Internet of Things Middleware. In Proceedings of the 2013 Ninth International Conference on Semantics, Knowledge and Grids, Beijing, China, 3–4 October 2013. [Google Scholar]
- Cervone, G.; Schnebele, E.; Waters, N.; Moccaldi, M.; Sicignano, R. Using Social Media and Satellite Data for Damage Assessment in Urban Areas during Emergencies; Springer International Publishing: Cham, Switzerland, 2017; pp. 443–457. [Google Scholar]
- Rossi, C.; Acerbo, F.S.; Ylinen, K.; Juga, I.; Nurmi, P.; Bosca, A. Early detection and information extraction for weather-induced floods using social media streams. Int. J. Disaster Risk Reduct. 2018, 30, 145–157. [Google Scholar] [CrossRef]
- Moreira, J.; Pires, L.F.; Van Sinderen, M.; Wieringa, R.; Singh, P.; Costa, P.D. Improving the Semantic Interoperability of IoT Early Warning Systems: The Port of Valencia Use Case; Springer International Publishing: Cham, Switzerland, 2019; pp. 17–29. [Google Scholar]
- Meditskos, G.; Kompatsiaris, I. iKnow: Ontology-driven situational awareness for the recognition of activities of daily living. Pervasive Mob. Comput. 2017, 40, 17–41. [Google Scholar] [CrossRef]
- Maguerra, S.; Boulmakoul, A.; Karim, L.; Hassan, B. Scalable Solution for Profiling Potential Cyber-criminals in Twitter. In Proceedings of the ASD 2018: Big data & Applications 12th edition of the Conference on Advances of Decisional Systems, Marrakech, Morocco, 2–3 May 2018. [Google Scholar]
- Wu, D.; Cui, Y. Disaster early warning and damage assessment analysis using social media data and geo-location information. Decis. Support Syst. 2018, 111, 48–59. [Google Scholar] [CrossRef]
- Wang, H.; Skau, E.; Krim, H.; Cervone, G. Fusing Heterogeneous Data: A Case for Remote Sensing and Social Media. IEEE Trans. Geosci. Remote Sens. 2018, 56, 6956–6968. [Google Scholar] [CrossRef]
- Restrepo-Estrada, C.; de Andrade, S.C.; Abe, N.; Fava, M.C.; Mendiondo, E.M.; de Albuquerque, J.P. Geo-social media as a proxy for hydrometeorological data for streamflow estimation and to improve flood monitoring. Comput. Geosci. 2018, 111, 148–158. [Google Scholar] [CrossRef]
- Li, J.; He, Z.; Plaza, J.; Li, S.; Chen, J.; Wu, H. Social Media: New Perspectives to Improve Remote Sensing for Emergency Response. Proc. IEEE 2017, 105, 1900–1912. [Google Scholar] [CrossRef]
- Kibanov, M.; Stumme, G.; Amin, I.; Lee, J.G. Mining social media to inform peatland fire and haze disaster management. Soc. Netw. Anal. Min. 2017, 7, 30. [Google Scholar] [CrossRef] [Green Version]
- Joseph, S.L.; Xiao, J.; Zhang, X.; Chawda, B.; Narang, K.; Rajput, N. Being Aware of the World: Toward Using Social Media to Support the Blind with Navigation. IEEE Trans. Hum.-Mach. Syst. 2015, 45, 399–405. [Google Scholar] [CrossRef]
- Yavari, A.; Bagha, H.; Korala, H.; Mirza, I.; Dia, H.; Scifleet, P. ParcEMon: IoT Platform for Real-Time Parcel Level Last-Mile Delivery Greenhouse Gas Emissions Reporting and Management. Sensors 2022, 22, 7380. [Google Scholar] [CrossRef]
- Mirza, I.B. Critical Analysis of key safety, privacy, and security issues in overcoming barriers through Unmanned Aerial Vehicles (UAVs). In Proceedings of National Conference on Current Research Advances in Computer Science; Kakatiya University: Warangal, India, 2017; pp. 216–219. [Google Scholar]
- Su, X.; Li, P.; Riekki, J.; Liu, X.; Kiljander, J.; Soininen, J. Distribution of Semantic Reasoning on the Edge of Internet of Things. In Proceedings of the 2018 IEEE International Conference on Pervasive Computing and Communications (PerCom), Athens, Greece, 19–23 March 2018. [Google Scholar]
- Hussein, D.; Han, S.N.; Lee, G.M.; Crespi, N.; Bertin, E. Towards a dynamic discovery of smart services in the social internet of things. Comput. Electr. Eng. 2017, 58, 429–443. [Google Scholar] [CrossRef]
- Arnaldos, J.Á.; Paredes-Valverde, M.; Zarate, M.S.; Rodríguez-García, M.; Valencia-García, R.; Hernández, J.O. im4Things: An Ontology-Based Natural Language Interface for Controlling Devices in the Internet of Things; Springer: Berlin/Heidelberg, Germany, 2017; pp. 3–22. [Google Scholar]
- Xu, G.; Cao, Y.; Ren, Y.; Li, X.; Feng, Z. Network Security Situation Awareness Based on Semantic Ontology and User-Defined Rules for Internet of Things. IEEE Access 2017, 5, 21046–21056. [Google Scholar] [CrossRef]
- Sheth, A.; Jadhav, A.; Kapanipathi, P.; Chen, L.; Purohit, H.; Smith, G.; Wang, W. Twitris: A System for Collective Social Intelligence. In Encyclopedia of Social Network Analysis and Mining; Springer: New York, NY, USA, 2014; pp. 2240–2253. [Google Scholar]
- Yavari, A.; Jayaraman, P.P.; Georgakopoulos, D.; Nepal, S. ConTaaS: An Approach to Internet-Scale Contextualisation for Developing Efficient Internet of Things Applications. In Proceedings of the 50th Hawaii International Conference on System Sciences (HICSS-50), Hilton Waikoloa Village, Big Island, HI, USA, 4–7 January 2017; pp. 5932–5940. [Google Scholar]
- Mirza, I.B.; Georgakopoulos, D.; Yavari, A. Improving Situation Awareness via a Situation Model-Based Intersection of IoT Sensor and Social Media Information Spaces. Sensors 2022, 22, 7823. [Google Scholar] [CrossRef] [PubMed]
- Torres-Huitzil, C.; Girau, B. Fault and error tolerance in neural networks: A review. IEEE Access 2017, 5, 17322–17341. [Google Scholar] [CrossRef]
- Nabi, M.; Toeroe, M.; Khendek, F. Availability in the cloud: State of the art. J. Netw. Comput. Appl. 2016, 60, 54–67. [Google Scholar] [CrossRef]
- Saadoon, M.; Hamid, S.H.A.; Sofian, H.; Altarturi, H.H.M.; Azizul, Z.H.; Nasuha, N. Fault tolerance in big data storage and processing systems: A review on challenges and solutions. Ain Shams Eng. J. 2022, 13, 101538. [Google Scholar] [CrossRef]
- Zachlod, C.; Samuel, O.; Ochsner, A.; Werthmüller, S. Analytics of social media data—State of characteristics and application. J. Bus. Res. 2022, 144, 1064–1076. [Google Scholar] [CrossRef]
- Smirnov, A.; Kashevnik, A.; Ponomarev, A. Multi-level Self-organization in Cyber-Physical-Social Systems: Smart Home Cleaning Scenario. Procedia CIRP 2015, 30, 329–334. [Google Scholar] [CrossRef] [Green Version]
- Imran, M.; Castillo, C.; Lucas, J.; Meier, P.; Vieweg, S. AIDR: Artificial Intelligence for Disaster Response. In Proceedings of the 23rd International Conference on World Wide Web; Association for Computing Machinery: Seoul, Republic of Korea, 2014. [Google Scholar] [CrossRef]
- Ashktorab, Z.; Brown, C.; Nandi, M.; Culotta, A. Tweedr: Mining twitter to inform disaster response. In International Conference on Information Systems for Crisis Response and Management; The Pennsylvania State University: State College, PA, USA, 2014; ISBN 978-0-692-21194-6. [Google Scholar]
- Anderson, K.M.; Aydin, A.A.; Barrenechea, M.; Cardenas, A.; Hakeem, M.; Jambi, S. Design Challenges/Solutions for Environments Supporting the Analysis of Social Media Data in Crisis Informatics Research. In Proceedings of the 2015 48th Hawaii International Conference on System Sciences, Kauai, HI, USA, 5–8 January 2015. [Google Scholar]
- Robinson, B.; Power, R.; Cameron, M. A sensitive Twitter earthquake detector. In Proceedings of the 22nd International Conference on World Wide Web; Association for Computing Machinery: Rio de Janeiro, Brazil, 2013; pp. 999–1002. [Google Scholar]
- Avvenuti, M.; Del Vigna, F.; Cresci, S.; Marchetti, A.; Tesconi, M. Pulling Information from social media in the aftermath of unpredictable disasters. In Proceedings of the 2015 2nd International Conference on Information and Communication Technologies for Disaster Management (ICT-DM), Rennes, France, 30 November–2 December 2015. [Google Scholar]
- Șerban, O.; Thapen, N.; Maginnis, B.; Hankin, C.; Foot, V. Real-time processing of social media with SENTINEL: A syndromic surveillance system incorporating deep learning for health classification. Inf. Process. Manag. 2019, 56, 1166–1184. [Google Scholar] [CrossRef]
- Onal, A.C.; Sezer, O.B.; Ozbayoglu, A.M.; Dogdu, E. Weather data analysis and sensor fault detection using an extended IoT framework with semantics, big data, and machine learning. In Proceedings of the 2017 IEEE International Conference on Big Data (Big Data), Boston, MA, USA, 11–14 December 2017; pp. 2037–2046. [Google Scholar]
- Gruber, T.R. Toward principles for the design of ontologies used for knowledge sharing? Int. J. Hum.-Comput. Stud. 1995, 43, 907–928. [Google Scholar] [CrossRef]
- Almeida, R.B.; Junes, V.R.C.; Machado, R.S.; Rosa, D.Y.L.; Donato, L.M.; Yamin, A.C. A distributed event-driven architectural model based on situational awareness applied on internet of things. Inf. Softw. Technol. 2019, 111, 144–158. [Google Scholar] [CrossRef]
- Abowd, G.D.; Dey, A.K.; Brown, P.J.; Davies, N.; Smith, M.; Steggles, P. Towards a Better Understanding of Context and Context-Awareness. In Handheld and Ubiquitous Computing; Springer: Berlin/Heidelberg, Germany, 1999. [Google Scholar]
- Yavari, A. Internet of Things Data Contextualisation for Scalable Information Processing, Security, and Privacy. In College of Science, Engineering and Health; RMIT: Singapore, 2019. [Google Scholar]
- Redmon, J.; Farhadi, A. YOLOv3: An Incremental Improvement. arXiv 2018, arXiv:1804.02767. [Google Scholar]
- Liu, W.; Anguelov, D.; Erhan, D.; Szegedy, C.; Reed, S.E.; Fu, C.; Berg, A. SSD: Single Shot MultiBox Detector. In Computer Vision—ECCV 2016. ECCV 2016. Lecture Notes in Computer Science; Leibe, B., Matas, J., Sebe, N., Welling, M., Eds.; Springer: Cham, Switzerland, 2016; Volume 9905. [Google Scholar] [CrossRef] [Green Version]
- Satapathy, R.; Guerreiro, C.; Chaturvedi, I.; Cambria, E. Phonetic-Based Microtext Normalization for Twitter Sentiment Analysis. In Proceedings of the 2017 IEEE International Conference on Data Mining Workshops (ICDMW), New Orleans, LA, USA, 18–21 November 2017. [Google Scholar]
- Rai, A.; Borah, S. Study of Various Methods for Tokenization. In Applications of Internet of Things; Springer: Singapore, 2021. [Google Scholar]
- Rexiline Ragini, J.; Anand, P.R.; Bhaskar, V. Mining crisis information: A strategic approach for detection of people at risk through social media analysis. Int. J. Disaster Risk Reduct. 2018, 27, 556–566. [Google Scholar] [CrossRef]
- Pohl, D.; Bouchachia, A.; Hellwagner, H. Social media for crisis management: Clustering approaches for sub-event detection. Multimed. Tools Appl. 2015, 74, 3901–3932. [Google Scholar] [CrossRef] [Green Version]
- Cresci, S.; Tesconi, M.; Cimino, A.; Dell’Orletta, F. A Linguistically-driven Approach to Cross-Event Damage Assessment of Natural Disasters from Social Media Messages. In WWW ’15 Companion: Proceedings of the 24th International Conference on World Wide Web; ACM Press: Florence, Italy, 2015. [Google Scholar]
- Cresci, S.; Cimino, A.; Dell’Orletta, F.; Tesconi, M. Crisis Mapping during Natural Disasters via Text Analysis of Social Media Messages; Springer International Publishing: Cham, Switzerland, 2015; pp. 250–258. [Google Scholar]
- Alkhatib; El Barachi, M.; Shaalan, K. An Arabic social media based framework for incidents and events monitoring in smart cities. J. Clean. Prod. 2019, 220, 771–785. [Google Scholar] [CrossRef]
- Pohl, D.; Bouchachia, A.; Hellwagner, H. Online indexing and clustering of social media data for emergency management. Neurocomputing 2016, 172, 168–179. [Google Scholar] [CrossRef] [Green Version]
- Toasa, R.; Aldas, C.; Recalde, P.; Coral, R. Performance Evaluation of Apache Zookeeper Services in Distributed Systems; Springer International Publishing: Cham, Switzerland, 2019; pp. 356–364. [Google Scholar]
- Nair, L.R.; Shetty, S.; Shetty, S. Applying spark based machine learning model on streaming big data for health status prediction. Comput. Electr. Eng. 2018, 65, 393–399. [Google Scholar] [CrossRef]
- Khan, M.A.; Karim, M.; Kim, Y. A Two-Stage Big Data Analytics Framework with Real World Applications Using Spark Machine Learning and Long Short-Term Memory Network. Symmetry 2018, 10, 485. [Google Scholar] [CrossRef]
- Spark, A. Cluster Mode Overview. 2022. Available online: https://spark.apache.org/docs/latest/cluster-overview.html (accessed on 1 September 2022).
- Jena, A. Apache Jena Framework. 2022. Available online: https://jena.apache.org/index.html (accessed on 14 November 2022).
- Mirza, I.B.; Huang, W.; Georgakopoulos, D.; Liu, H. Computational and Human Evaluations of Orthogonal Graph Drawings. In Proceedings of the 2019 23rd International Conference in Information Visualization—Part II, Adelaide, SA, Australia, 16–19 July 2019. [Google Scholar]
- Confluent. Producer Configurations. 2022. Available online: https://docs.confluent.io/platform/current/installation/configuration/producer-configs.html (accessed on 14 November 2022).


| Author | Situation-Awareness Application | Sensor Data | Social Media Data | Both Sensor and Social Media Data | Semantics |
|---|---|---|---|---|---|
| [1] | Smart City | ✓ | ✓ | ✓ | X |
| [6] | Floods | ✓ | ✓ | ✓ | X |
| [7] | Smog | ✓ | ✓ | ✓ | X |
| [16] | Floods | ✓ | ✓ | ✓ | X |
| [18] | Smart Transportation | ✓ | X | X | ✓ |
| [20] | Cyber Crime | X | ✓ | X | ✓ |
| [22] | Natural Hazards | ✓ | ✓ | ✓ | X |
| [23] | Floods | ✓ | ✓ | ✓ | X |
| [29] | Smart Transportation | ✓ | X | X | ✓ |
| [30] | Smart spaces | ✓ | X | X | ✓ |
| [31] | Smart Homes | ✓ | X | X | ✓ |
| [32] | Network Security | ✓ | X | X | ✓ |
| [33] | Disasters | X | ✓ | X | X |
| [34] | Smart Parking | ✓ | X | X | ✓ |
| [35] | Weather | ✓ | ✓ | ✓ | ✓ |
| Attribute | Value |
|---|---|
| place_name | melbourne |
| station_name | melbourne (olympic park) |
| temperature | 23.2 |
| humidity | 56 |
| wind_direction | SSW |
| wind_speed | 6 |
| wind_gust | 9 |
| pressure | 1014.3 |
| time_reported | 29/11/2021 19:20 |
| lat | −37.8255 |
| long | 144.9816 |
| station_id | 86338 |
| Brokers in Cluster | Brokers Online | Brokers Offline | Active Controller | Active Controller Count | Followers | Under Replicated Partitions | Offline Partitions |
|---|---|---|---|---|---|---|---|
| 136.186.108.98 136.186.108.230 136.186.108.103 | 136.186.108.98 | 136.186.108.230 136.186.108.103 | 136.186.108.98 | 1 | - | 295 | 7 |
| Brokers in Cluster | Brokers Online | Brokers Offline | Active Controller | Active Controller Count | Followers | Under Replicated Partitions | Offline Partitions |
|---|---|---|---|---|---|---|---|
| 136.186.108.98 136.186.108.230 136.186.108.103 | 136.186.108.98 136.186.108.230 136.186.108.103 | - | 136.186.108.98 | 1 | 136.186.108.230 136.186.108.103 | 0 | 0 |
Disclaimer/Publisher’s Note: The statements, opinions and data contained in all publications are solely those of the individual author(s) and contributor(s) and not of MDPI and/or the editor(s). MDPI and/or the editor(s) disclaim responsibility for any injury to people or property resulting from any ideas, methods, instructions or products referred to in the content. |
© 2023 by the authors. Licensee MDPI, Basel, Switzerland. This article is an open access article distributed under the terms and conditions of the Creative Commons Attribution (CC BY) license (https://creativecommons.org/licenses/by/4.0/).
Share and Cite
Mirza, I.B.; Georgakopoulos, D.; Yavari, A. Cyber-Physical-Social Awareness Platform for Comprehensive Situation Awareness. Sensors 2023, 23, 822. https://doi.org/10.3390/s23020822
Mirza IB, Georgakopoulos D, Yavari A. Cyber-Physical-Social Awareness Platform for Comprehensive Situation Awareness. Sensors. 2023; 23(2):822. https://doi.org/10.3390/s23020822
Chicago/Turabian StyleMirza, Irfan Baig, Dimitrios Georgakopoulos, and Ali Yavari. 2023. "Cyber-Physical-Social Awareness Platform for Comprehensive Situation Awareness" Sensors 23, no. 2: 822. https://doi.org/10.3390/s23020822