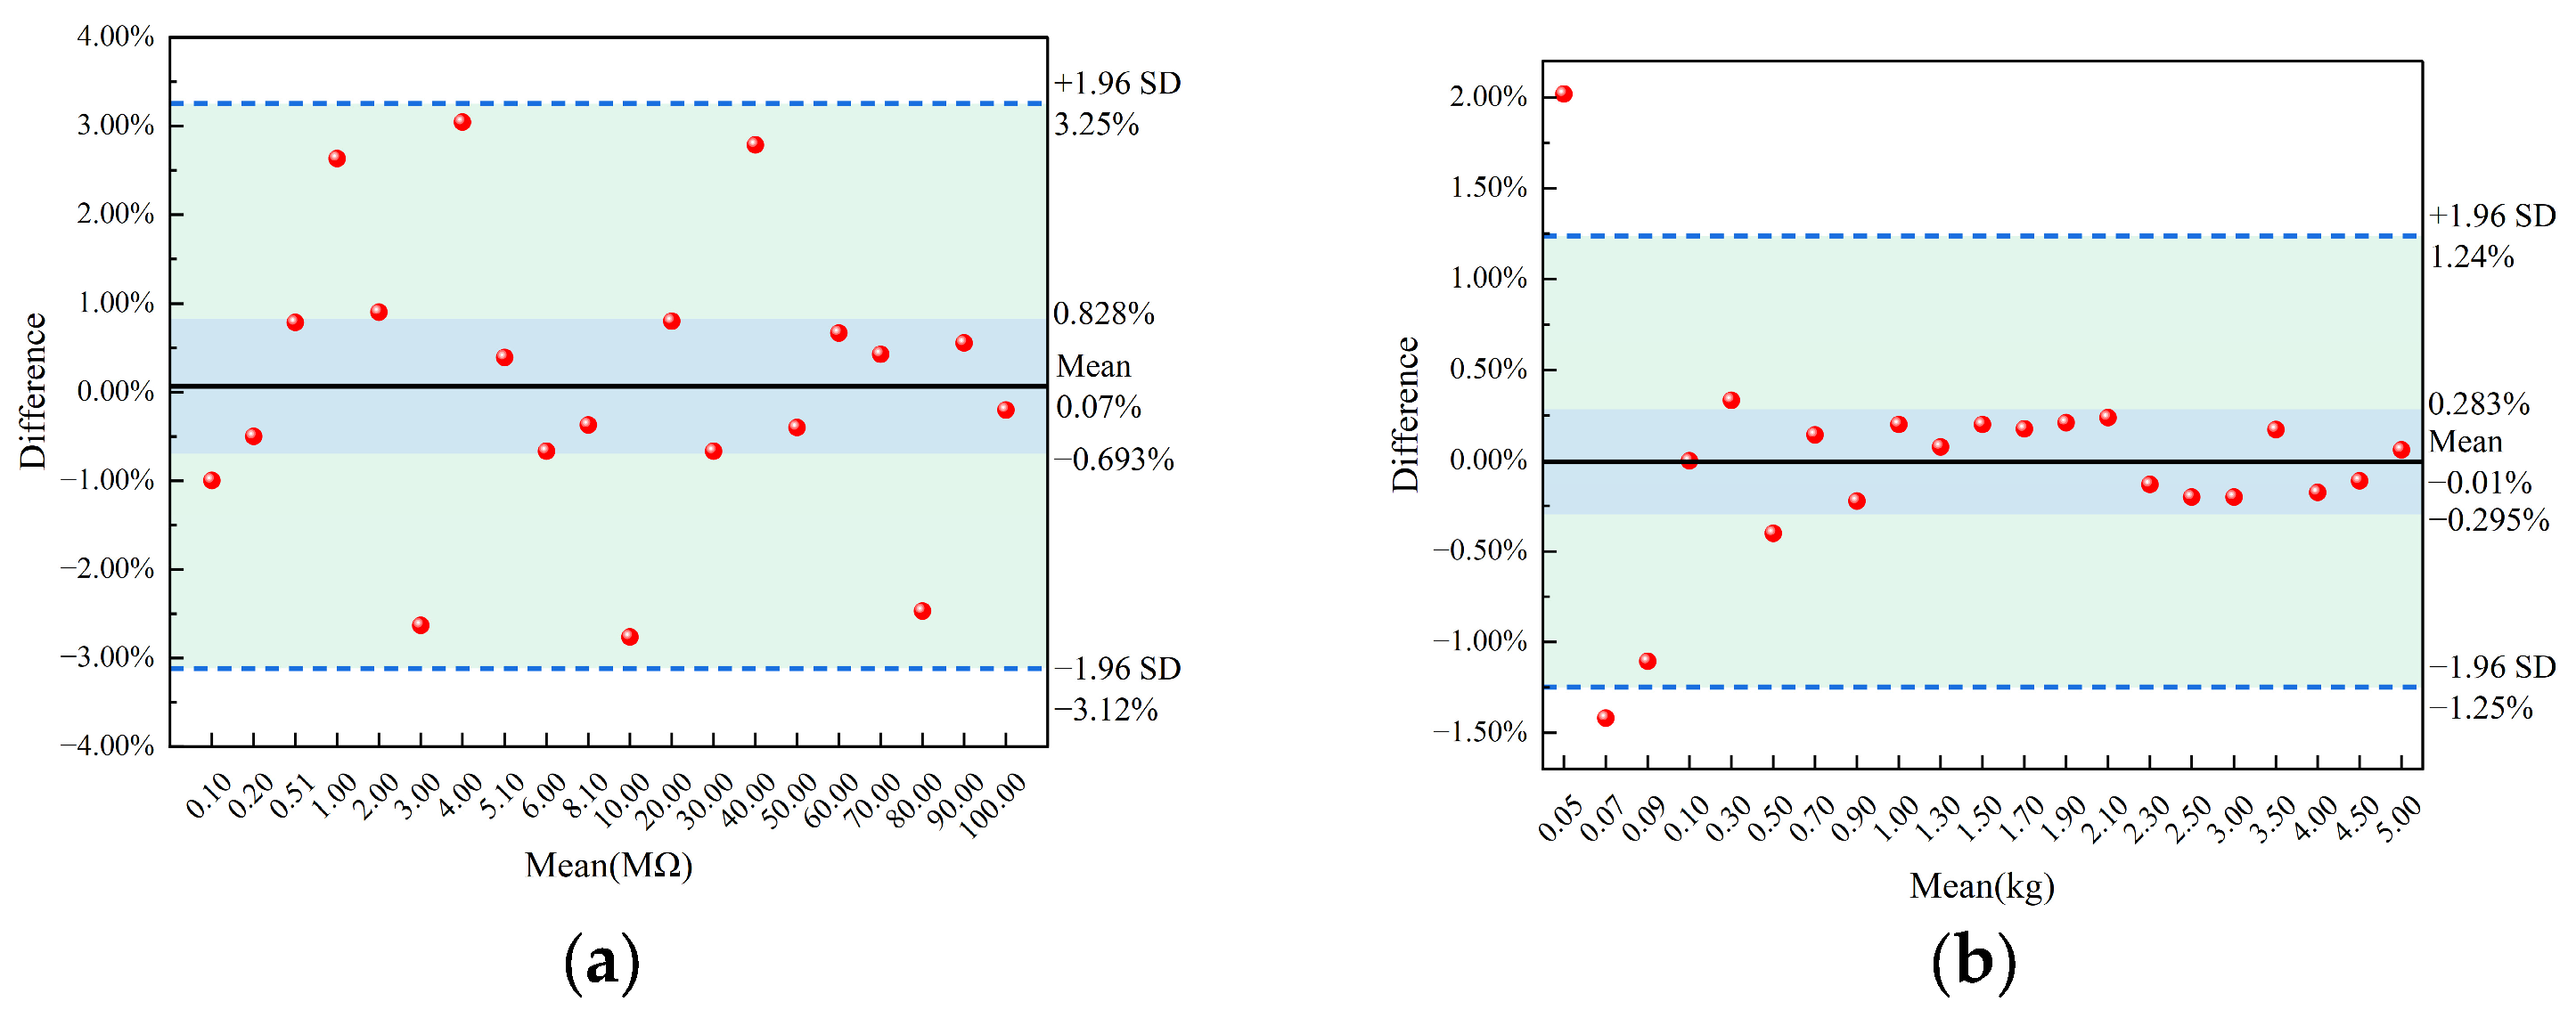
3.1. Equipment Calibration
To ensure the reliability of the experiment results, this study employed standard resistors and weights to calibrate the LCR bridge tester and pressure sensor, respectively. The Bland–Altman plot was used to analyze the measurement errors (differences between the measurement values and the standard values). To eliminate the influence of different orders of magnitude and provide an intuitive representation of the error magnitude and direction, the error results were presented in the form of difference (%) (
Figure 4).
When calibrating using twenty standard resistors with different resistance, the measurement results were all within the 95% confidence interval. Additionally, most of the samples showed small errors, and measured values were close to the mean value (
Figure 4a). When calibrating using twenty-one weights with different weights, the measurement results were mostly within the 95% confidence interval. Similarly, the errors were small, and measured values were close to the mean value (
Figure 4b). However, when calibrating using small weights, there was a noticeable deviation. This deviation was caused by the measurement accuracy and range of the pressure sensor.
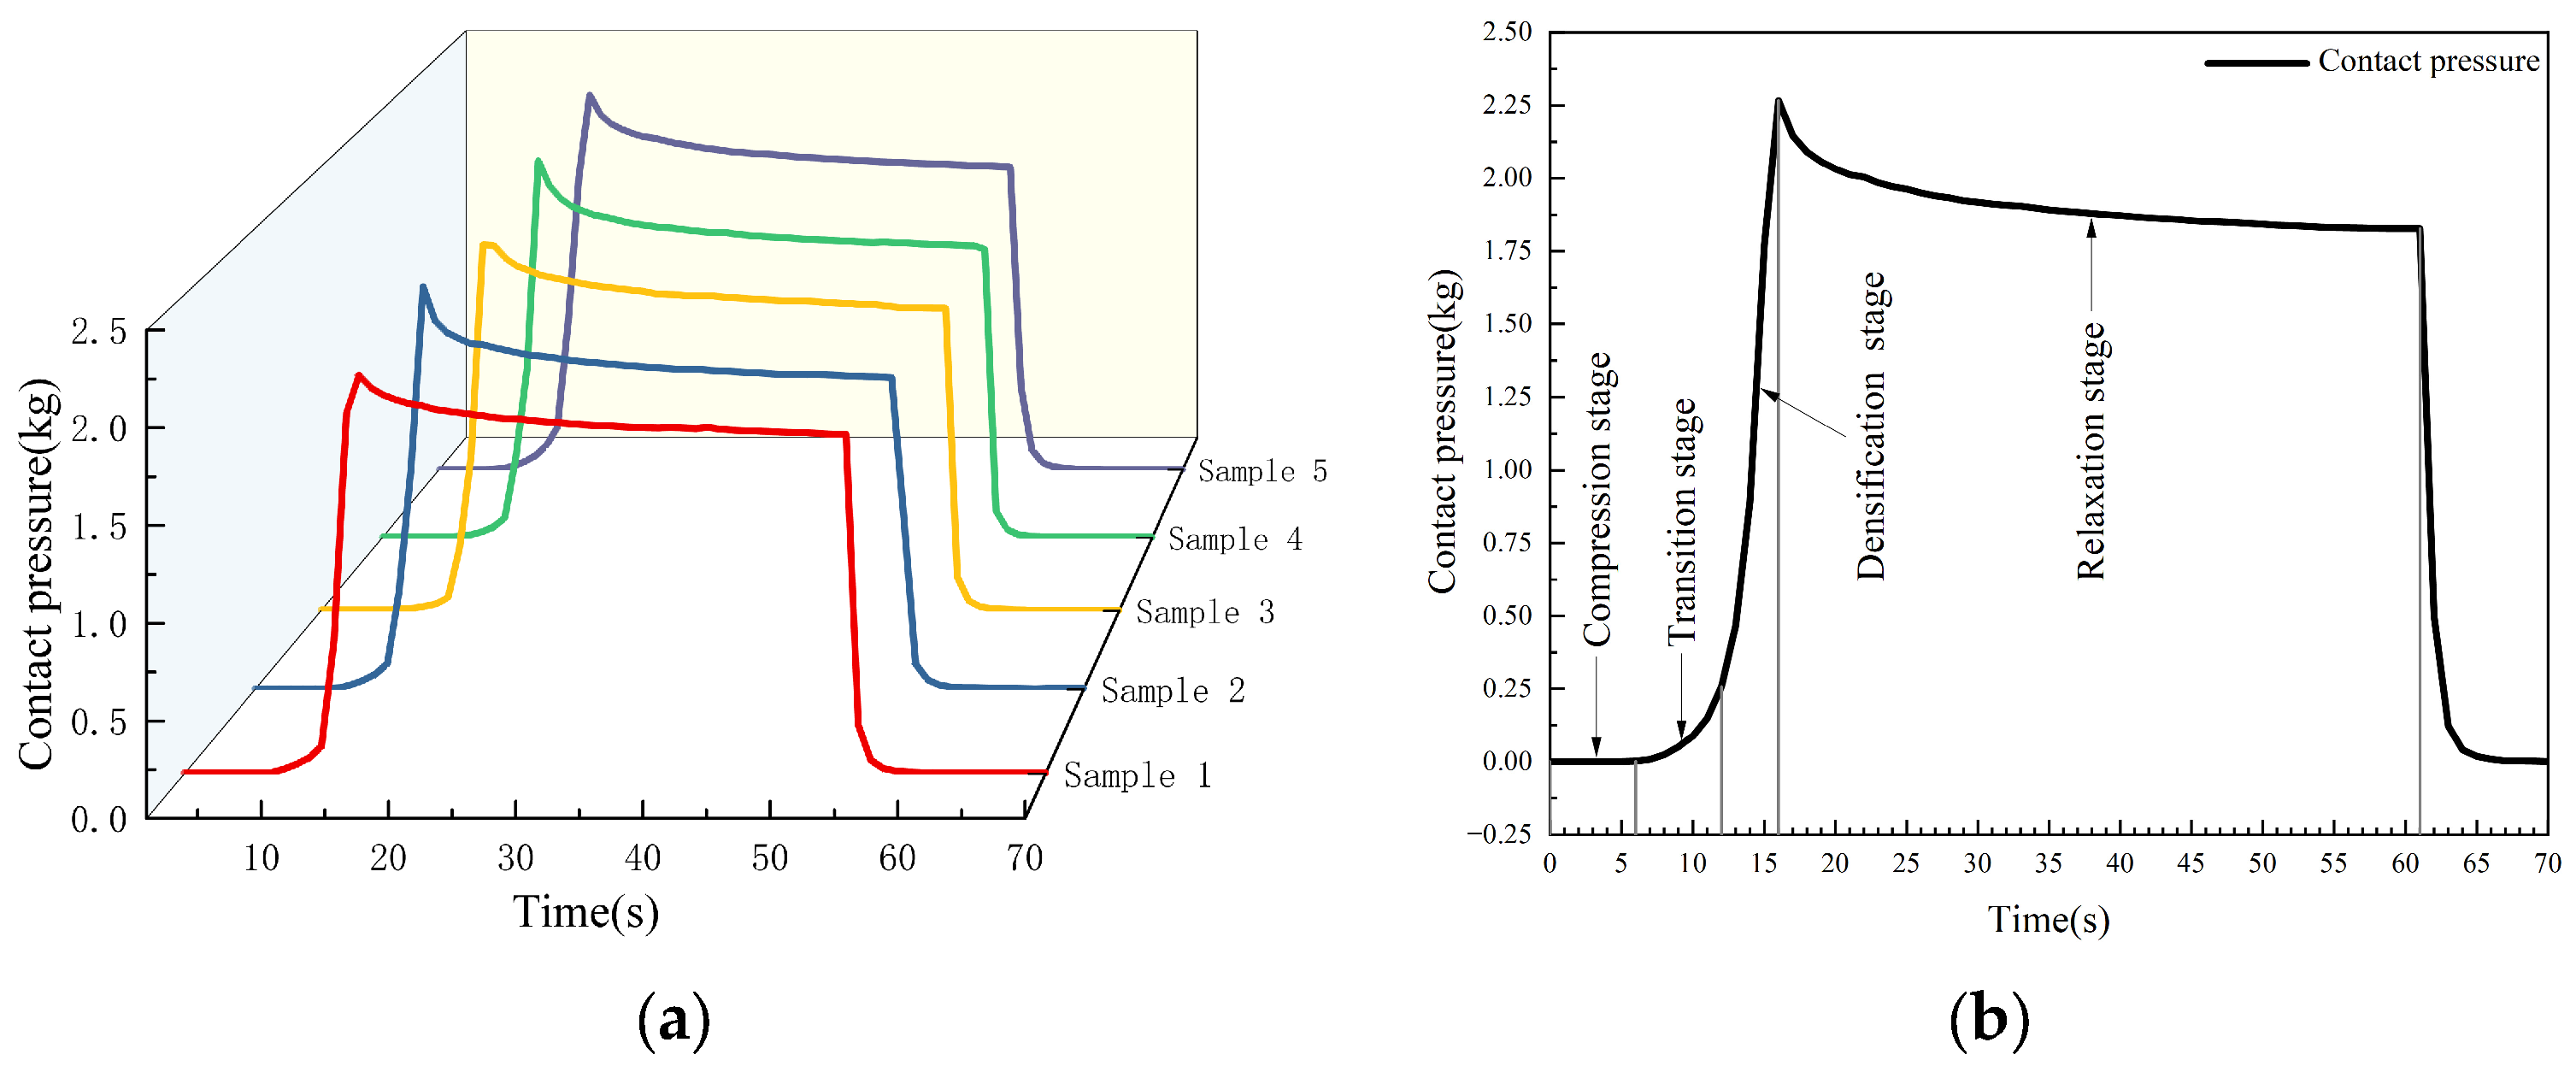
3.2. Mechanical Analysis of Seed Cotton Compression
Compared to other agricultural materials, seed cotton exhibited more complex mechanical changes during the compression process due to the entanglement of cotton fibers on the cottonseeds. Five seed cotton samples were compressed at a speed of 10 mm·s
−1. It was found that the pressure–time curves obtained exhibit similar characteristics with small difference (
Figure 5a).
During 0~6 s, the seed cotton was compressed from its natural state (
Figure 5b). The spaces between cotton fibers rapidly decreased, and there was a significant buffer space within the cotton fiber aggregate. At this stage, the contact pressure was relatively low, with a small variation, exhibiting an approximate linear relationship with strain. This stage was defined as the compression stage. During 6~12 s, the buffer space within the cotton fiber aggregate decreased. Due to the random arrangement of the cottonseeds, some slippage occurred during the compression. As strain increased, the increase in contact pressure became gentle. This stage was defined as the transition stage. During 12~16 s, the cotton fiber aggregate had a minimal buffer space and a tightly packed internal arrangement. The seed cotton underwent elastic deformation. At this time, small strains resulted in a rapid increase in contact pressure, leading to significant changes. The relationship between contact pressure and strain was approximately linear in this stage. This stage was defined as the densification stage. Under alternating stress, due to the strain lagging behind stress, when loading was stopped (16~61 s), the internal strain within the cotton fiber aggregate gradually decreased. Consequently, the contact pressure decreased nonlinearly, initially at a faster rate and then gradually stabilizing. This stage was defined as the relaxation stage.
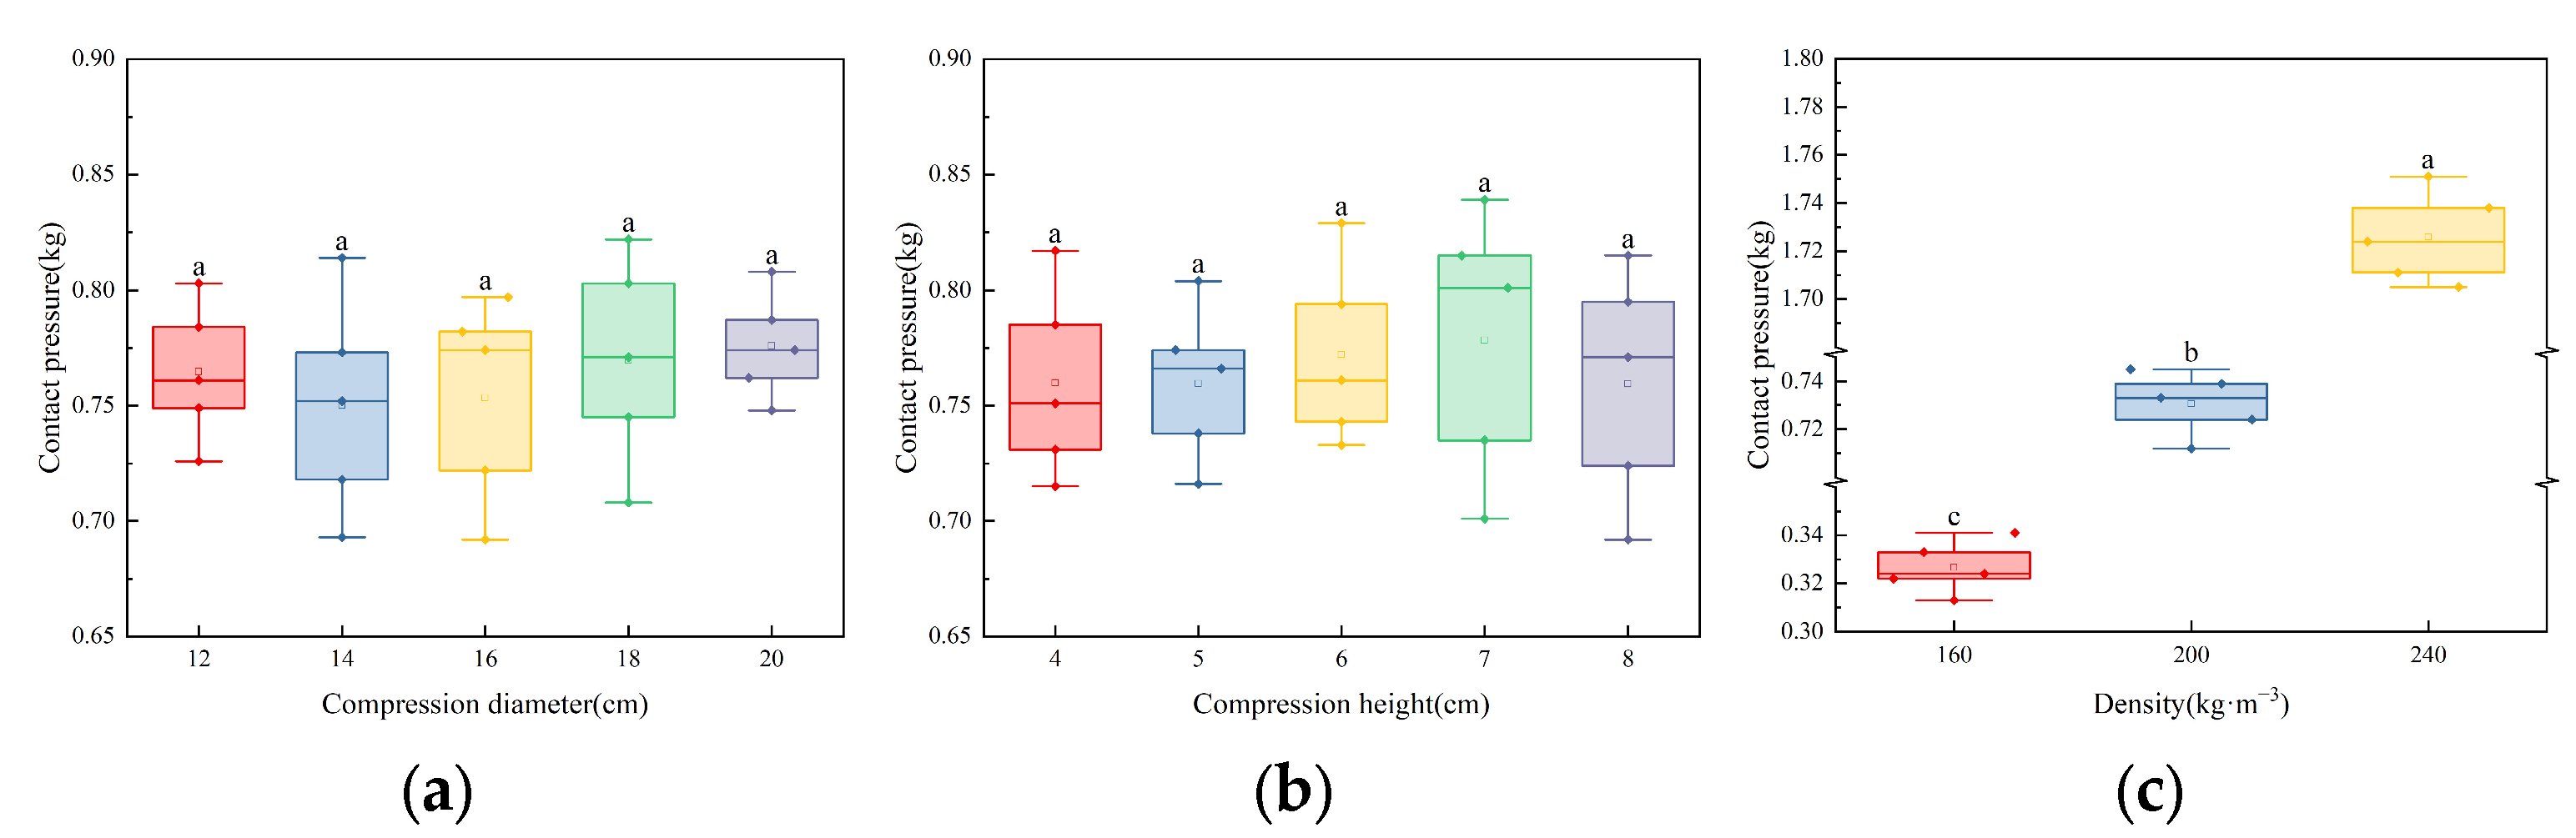
3.3. Analysis of Influencing Factors of Contact Pressure
This experiment investigated the factors influencing contact pressure by manipulating the compression diameter, compression height, and compression density to simulate the changes in cotton bale parameters during the densification.
According to
Figure 6a, when the compression height and density were constant, the contact pressure remained within a stable range, with insignificant variations. This indicates that the compression diameter does not significantly affect the statistical analysis conclusions of the dataset. Similarly, according to
Figure 6b, when the compression height and density were constant, the contact pressure of the seed cotton also remained within a stable range, with insignificant variations. This indicates that the compression height does not impact the statistical analysis conclusions of the dataset. However, according to
Figure 6c, when the compression height and density were constant, the contact pressure increased significantly with the increase in density. Moreover, as the density increased, the dispersion of the base pressure also increased. This implies that the compression density has a significant impact on the statistical analysis conclusions of the dataset. Therefore, based on
Figure 6, it can be deduced that during the packaging process of seed cotton, there is a weak correlation between contact pressure and compression volume, while there is a strong correlation between contact pressure and compression density. The cotton bale density can be indirectly manifested through the contact pressure.
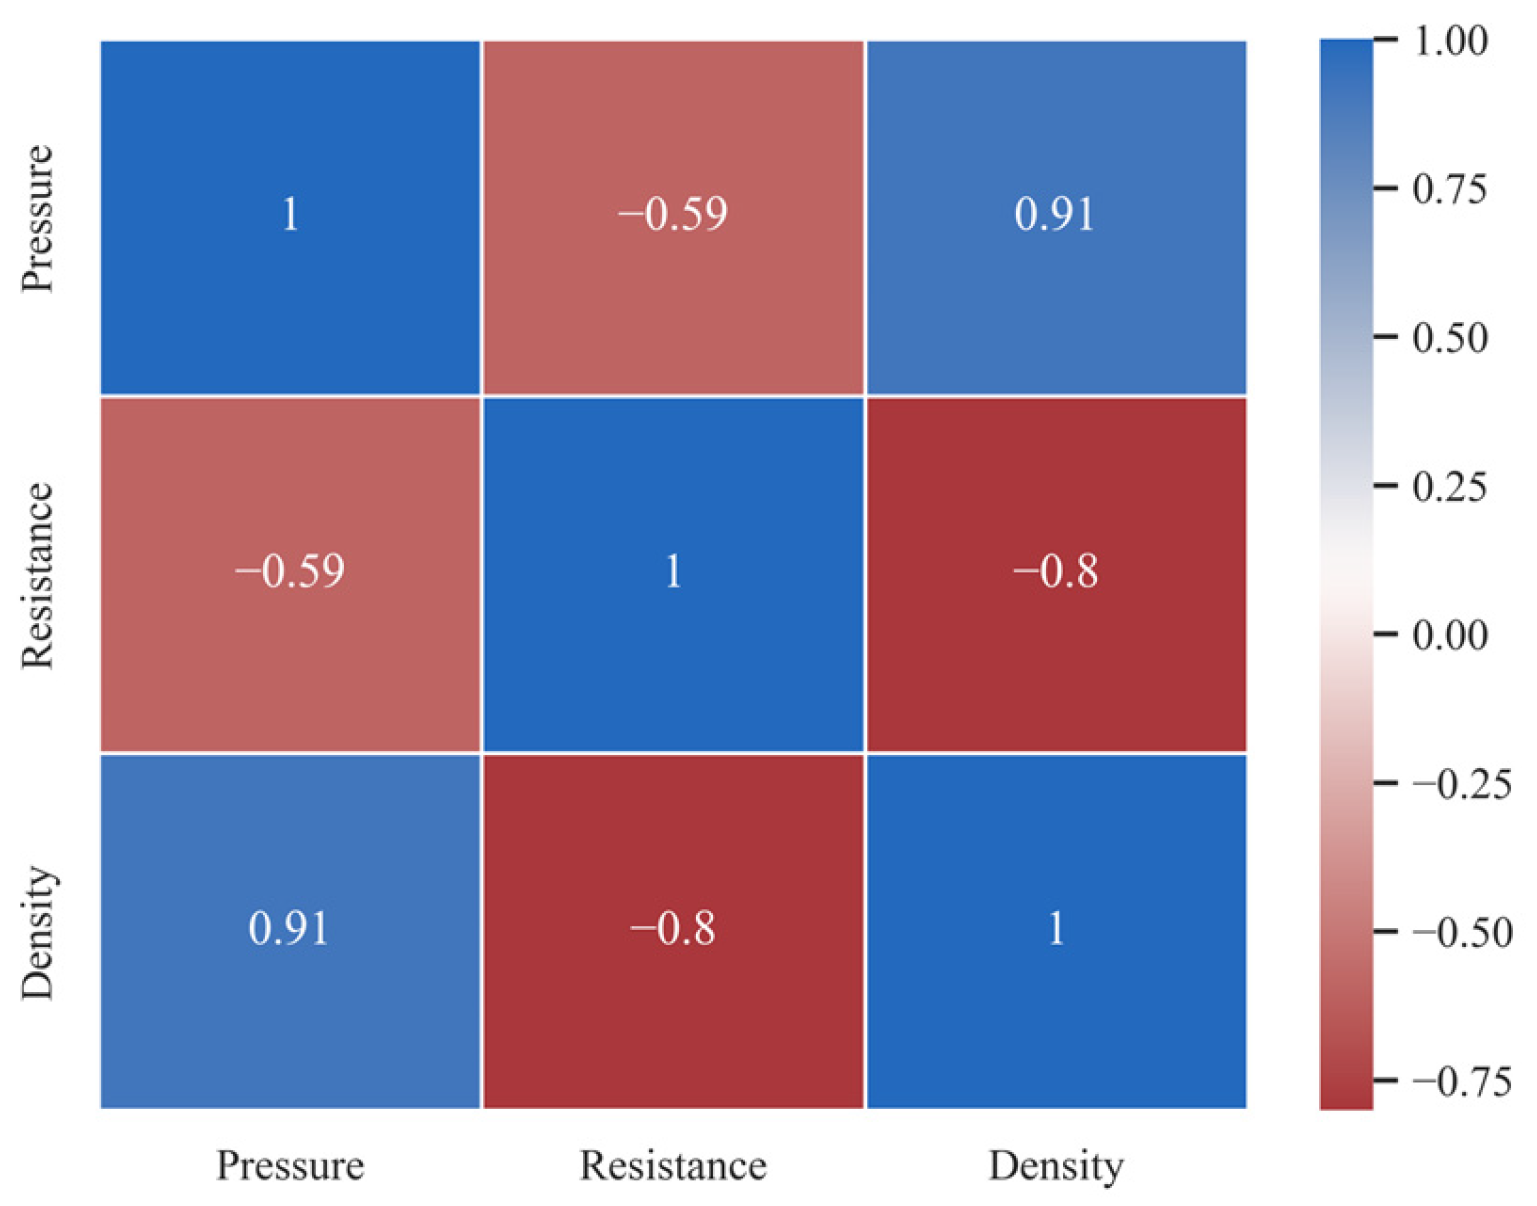
3.4. Analysis of Influencing Factors of Conductivity
The analysis results of the correlations among compression density, contact pressure, and resistance values (
Figure 7) showed that there was a high positive correlation (0.91) between pressure and density. There was also a negative correlation between density and resistance (−0.8) and between pressure and resistance (−0.59). Furthermore, the
p-values for the significance tests of all factors were less than 0.01. Thus, the correlations between the parameters were statistically significant, indicating that further exploration could be conducted.
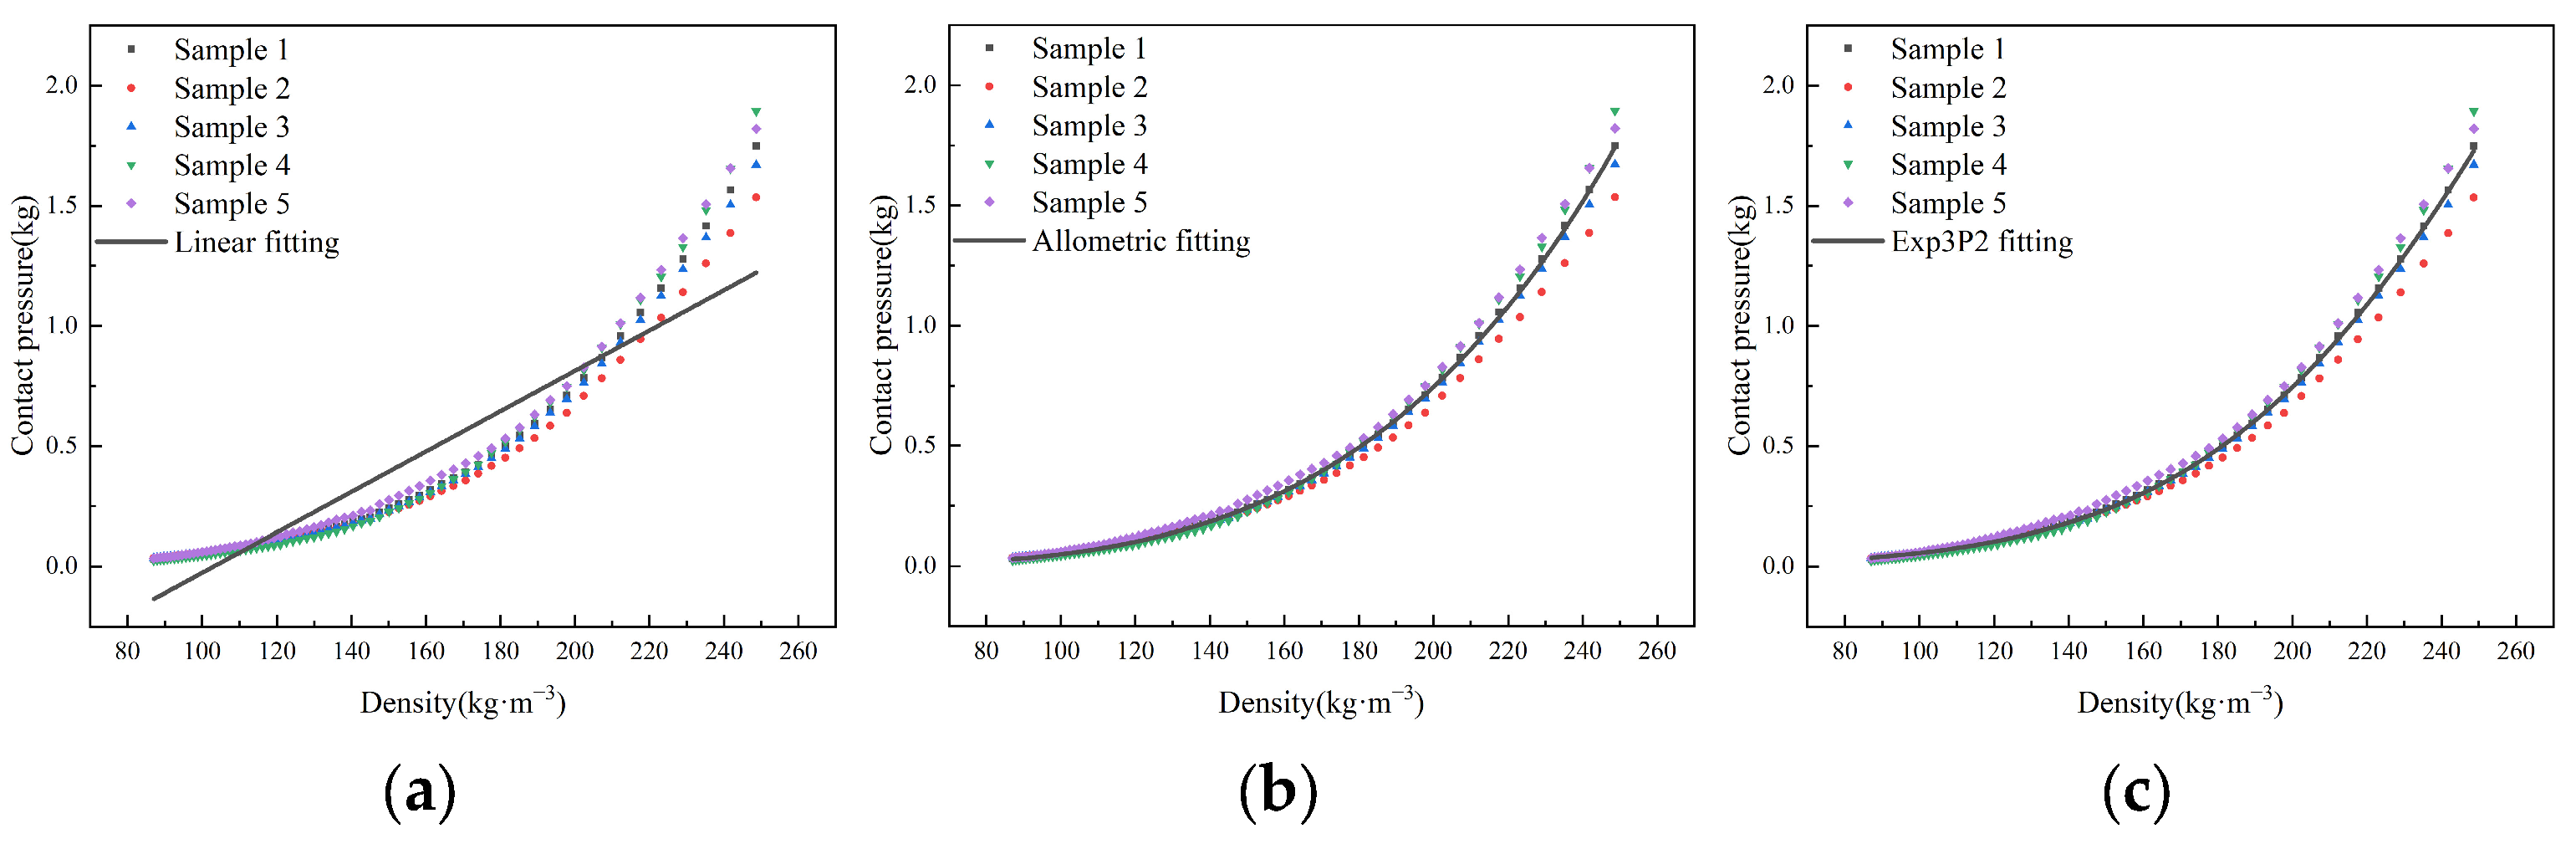
The linear and nonlinear regression analyses (allometric function and exp3p2 function) of contact pressure and density during the densification showed (
Figure 8) that as the density increased, the pressure exhibited a nonlinear increase. Additionally, with the continuous increase in density, the contact pressure tended to be scattered. This may be due to the fact that after completing the measurement of a sample, the next cotton sample needs to be repositioned. The arrangement of cotton fibers has a certain degree of randomness, and an uneven placement of the cotton sample can result in uneven density distribution in the cotton fiber aggregate, leading to different contact pressures at the pressure sensor. After entering the transition and densification stages, the compressibility of the seed cotton gradually reduces, and the contact pressure changes greatly with the increase in density. The fitting results are shown in
Table 2. Comparing the R
2 and RMSE values of the three models, it was found that the nonlinear function models provided a better fit than the linear function models. Besides, among the nonlinear models, the Exp3P2 function model had the highest R
2 and the lowest RMSE, indicating the best fit. Therefore,
is the optimal analytical equation for characterizing the relationship between the density of the cotton fiber aggregate and the pressure.
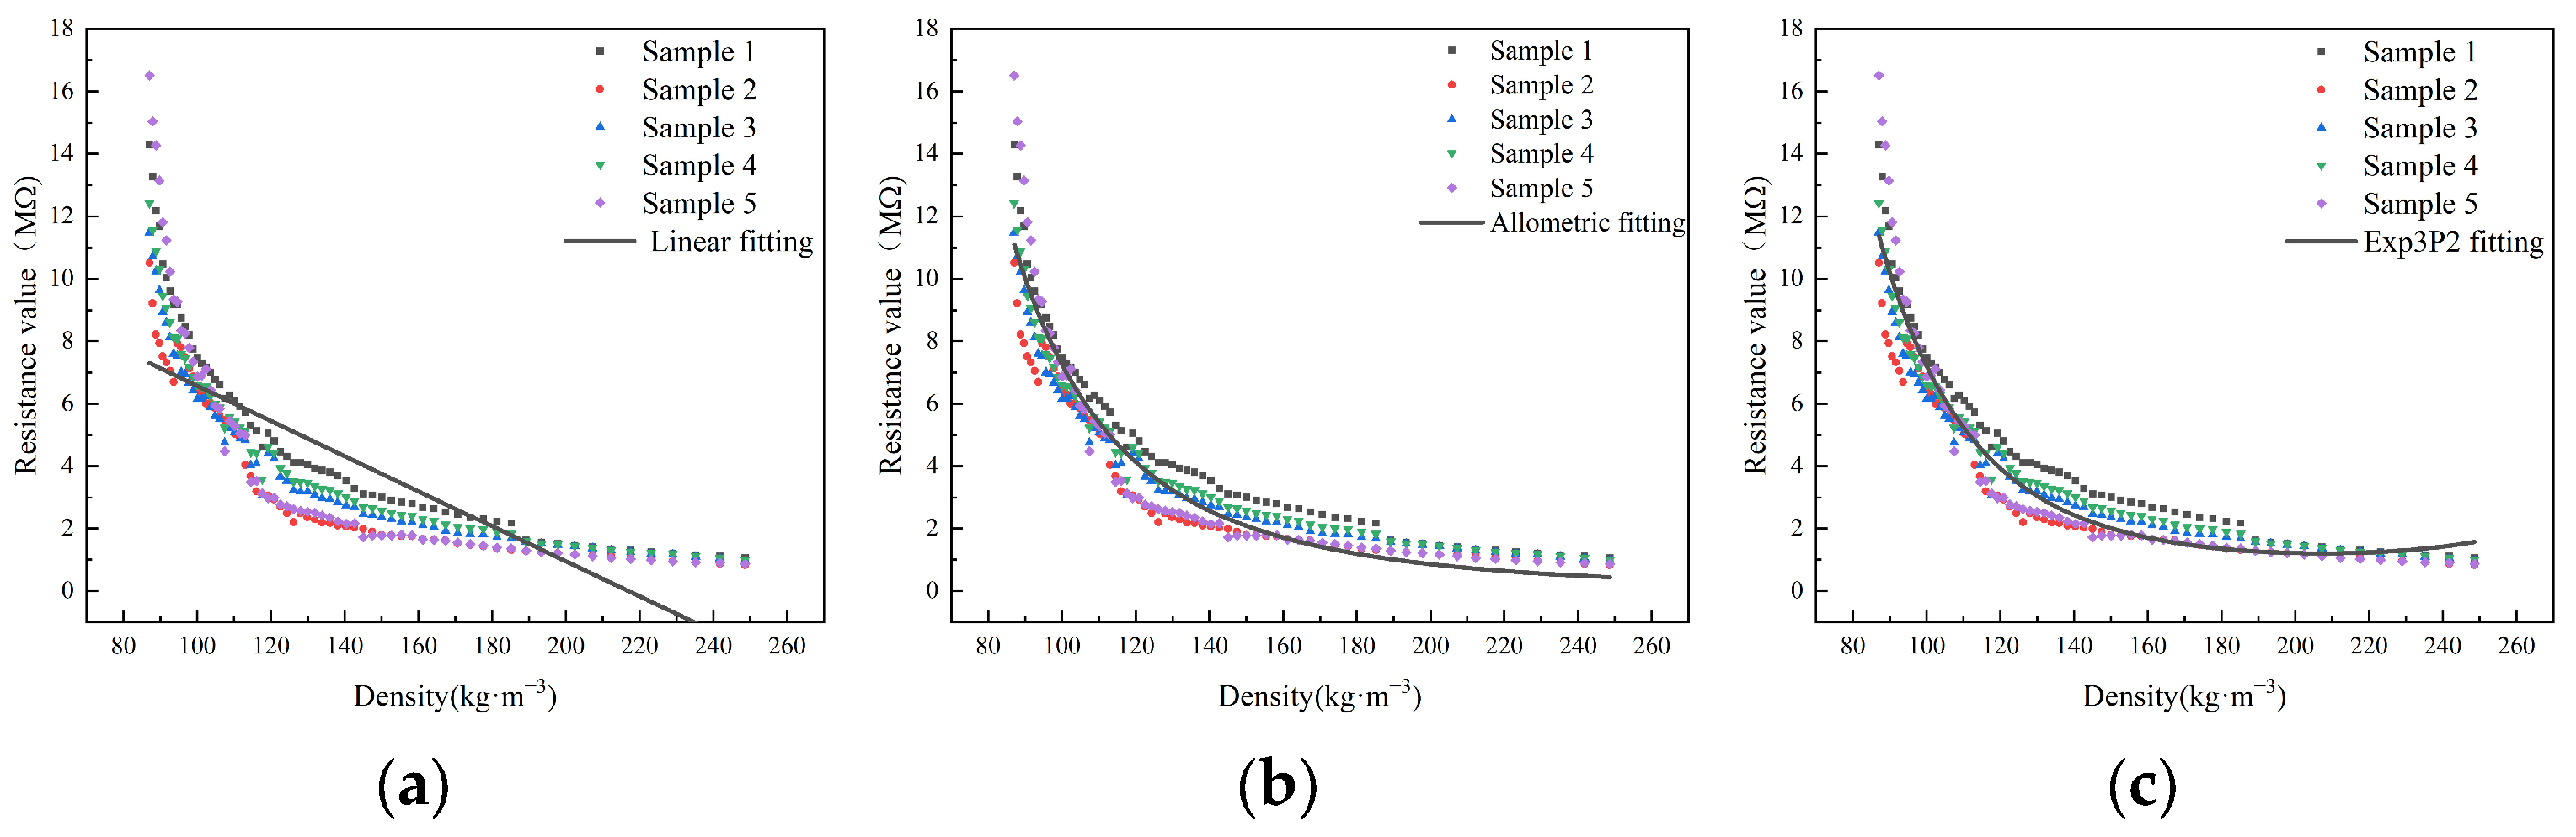
The regression analysis of resistance and density during the densification process using the linear and nonlinear functions (allometric function and exp3p2 function) found that as the density increased, the corresponding resistance decreased (
Figure 9). This may be due to the fact that during the compression of the cotton fiber aggregate, the density gradually increases, the spaces between fibers reduces, and the number of contact points increases. This significantly increases the parallel current paths between the cotton fibers, leading to a decrease in resistance. Additionally, it was also found that when the density was approximately 80~90 kg·m
−3, the resistance decreased rapidly with the increase in density. As the cotton fiber aggregate continued to be compressed, when the density was around 90~140 kg·m
−3, the resistance gradually decreased with the increase in density. When the density exceeded 160 kg·m
−3, the resistance decreased slowly with the increase in density, approaching a certain limit. The fitting results are shown in
Table 3. Comparing the R
2 and RMSE values of the three models, it was found that the nonlinear function models provided a better fit than the linear function models. Moreover, among the nonlinear models, the exp3P2 function model had the highest R
2 and the lowest RMSE, indicating the best fit. Therefore,
is the optimal analytical equation for characterizing the relationship between the density of the cotton fiber aggregate and the pressure.
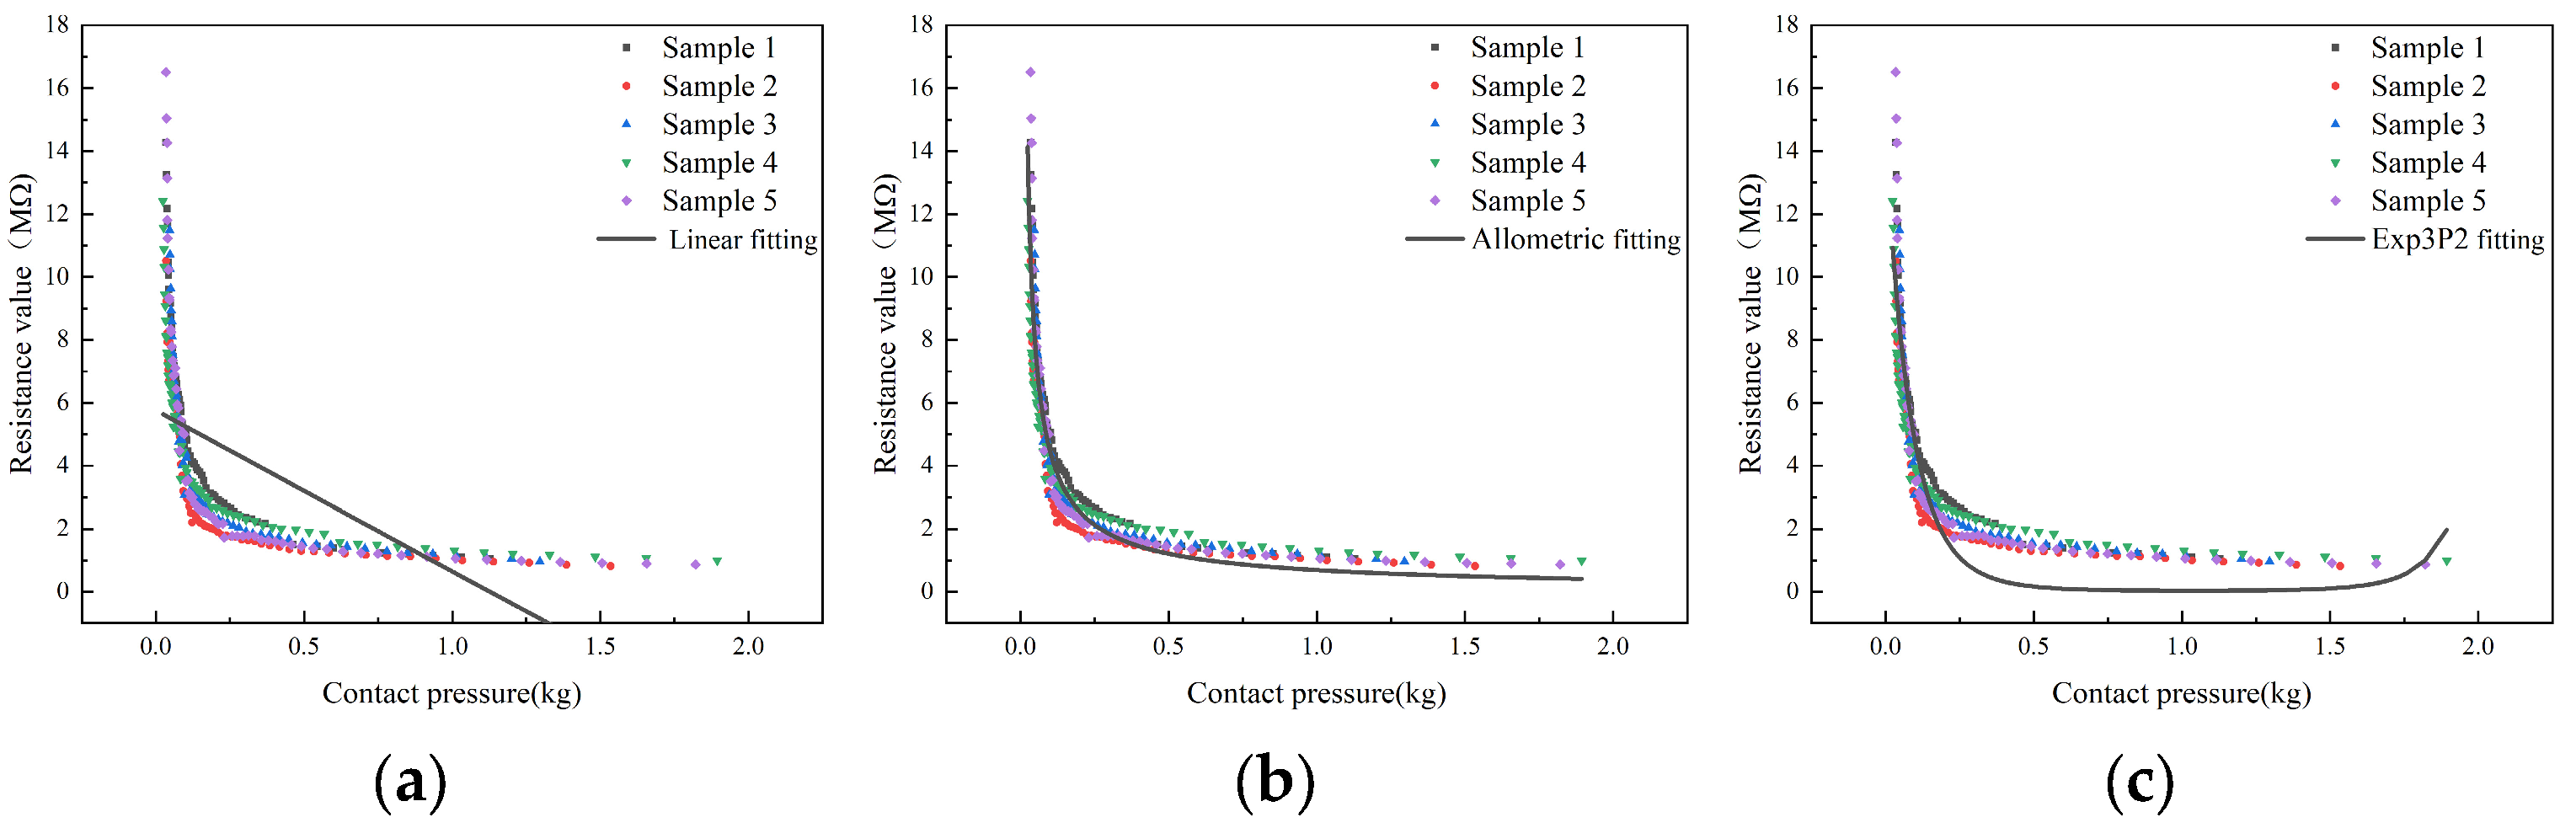
The regression analysis of contact pressure and resistance using both linear and nonlinear functions (allometric function and exp3p2 function) found that as the contact pressure increased, the corresponding resistance decreased (
Figure 10). This may be due to the fact that high contact pressure leads to a high density, which further results in strong conductivity. Additionally, it was also found that when the contact pressure was less than 0.1 kg, the resistance decreased rapidly with the increase in contact pressure. When the contact pressure was in the range of 0.1~0.5 kg, the resistance gradually decreased with the increase in contact pressure. When the contact pressure exceeded 0.5 kg, the resistance decreased slowly with the increase in density, approaching a certain limit. The fitting results are shown in
Table 4. Comparing the R
2 and RMSE values of the three models, it was found that the nonlinear function models provided a better fit than the linear function models. Moreover, among the nonlinear models, the allometric function model had the highest R
2 and the lowest RMSE, indicating the best fit. Therefore,
is the optimal analytical equation for characterizing the relationship between the density of cotton fiber aggregate and the contact pressure.
3.5. Model Performance Comparison and Validation
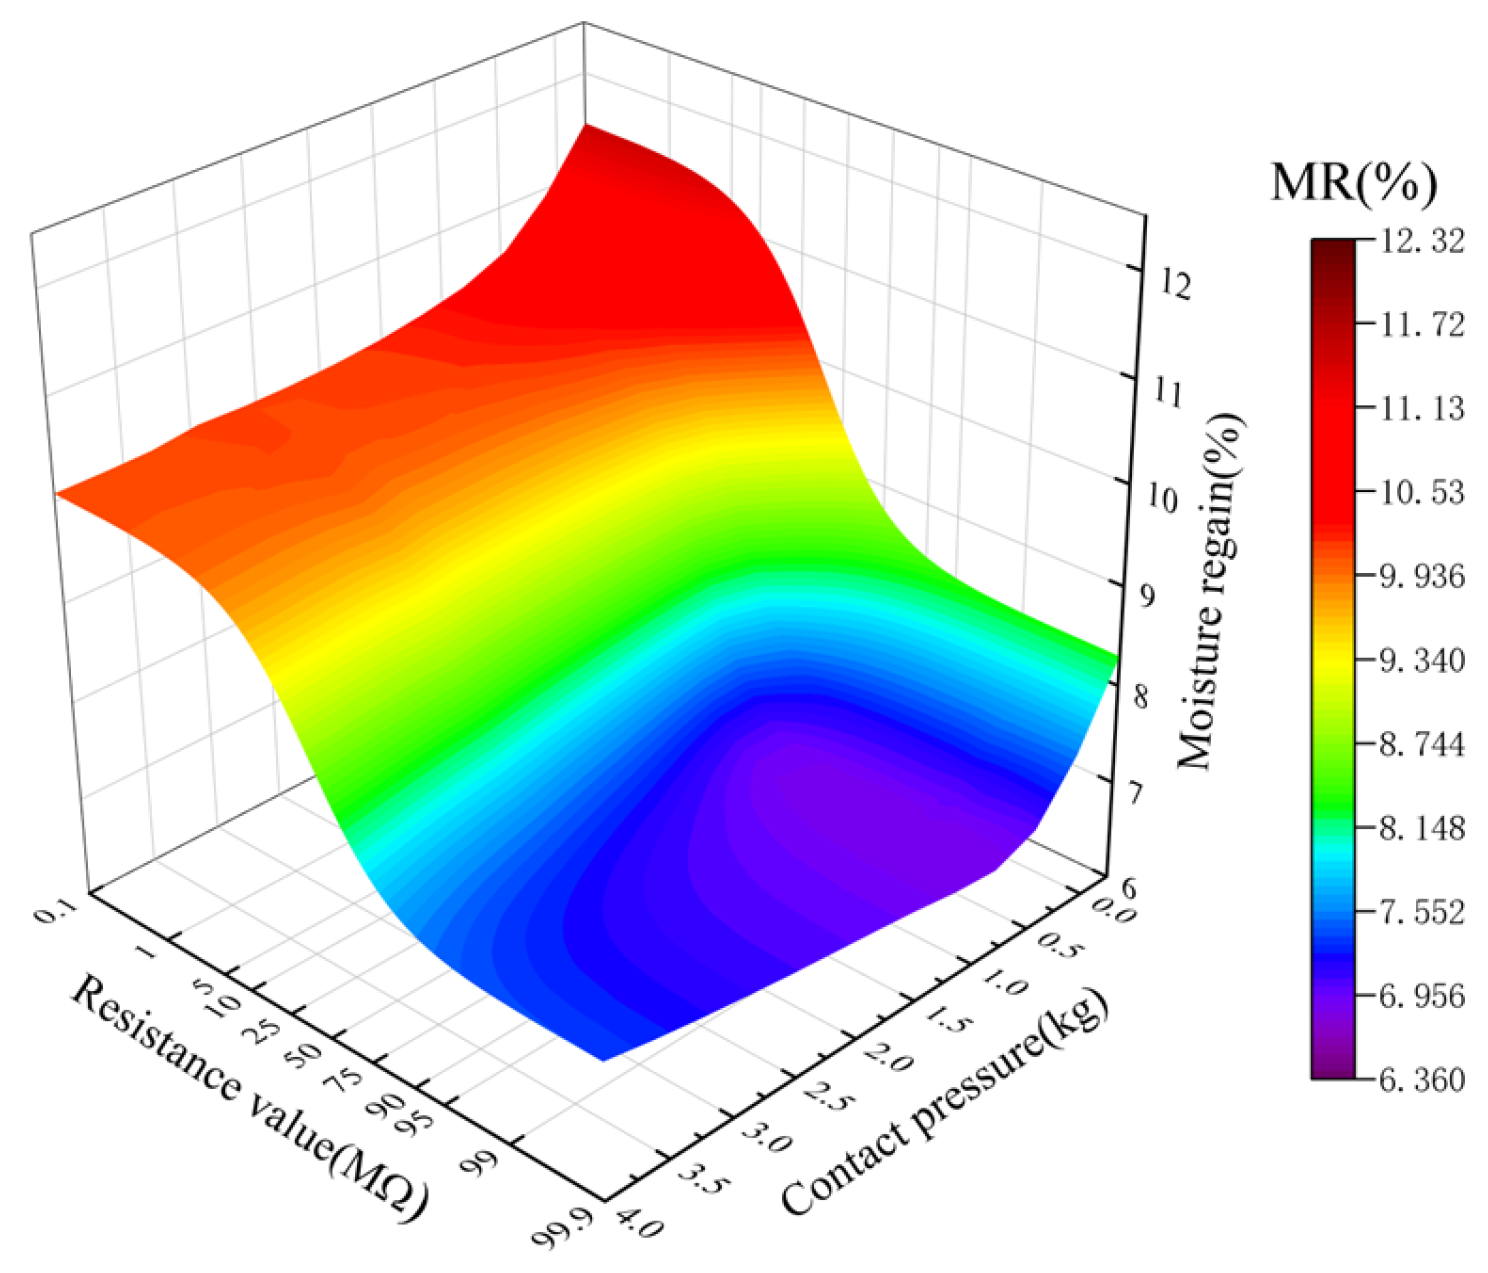
It can be seen from the above results that there is a significant nonlinear correlation between density and contact pressure, as well as between density and resistance value. By measuring the contact pressure, the compression density can be indirectly reflected. Therefore, the contact pressure and resistance can be used as feature variables in the MR prediction model to investigate the relationships between the resistance, contact pressure, and MR. Seed cotton with different MR showed significant differences in resistance under different contact pressures (
Figure 11). With a constant MR, the resistance showed a nonlinear decrease as the contact pressure increased. Similarly, with a constant contact pressure, the resistance also showed a nonlinear decrease as the MR increased; that is, the contact pressure affects the resistance measurement of seed cotton, which, in turn, affects the measurement of MR. Therefore, using contact pressure as a compensation value in the resistance-based MR measurement can improve the accuracy of the measurement.
To achieve MR measurement during the compression process of seed cotton during the harvesting operations, it is necessary to build an MR prediction model based on the experimental results above. In this study, contact pressure and resistance were chosen as the features for the prediction model. Three algorithms, namely, SVR, RF, and BPNN, were utilized for modeling. The prediction accuracy of each model was evaluated using the testing dataset (
Figure 12).
To explore the optimal seed cotton MR prediction model, R
2 and RMSE were used to evaluate the performance of the built models, and then the prediction performances of the three models were compared. It was found that the R
2 and RMSE of SVR model were 0.974 and 0.296%, respectively; the R
2 and RMSE of RF model were 0.977 and 0.261%, respectively; and those of BPNN model were 0.986 and 0.204%, respectively (
Table 5).
It can be seen that the predicted MR of BPNN model was the closest to the actual MR among the three models (
Table 5). BPNN is a type of three-layer feedforward structure. The three layers are the input layer, hidden layer, and output layer (
Figure 13). The input layer receives information (resistance values and pressure values) from external sources and passes it on to the network for processing. The hidden layer receives information from the input layer and processes all the information. The output layer receives the processed information from the network and sends the resulting outputs to external receptors. The input signals are modified via interconnected weights known as weight factors
vmn, which represent the interconnections from the
mth node of the first layer to the
nth node of the second layer. These modified signals are then adjusted using the tanh transfer function to compute the total activation. Similarly, the output signals from the hidden layer are adjusted by the interconnection weights
wij from the
ith node of the output layer to the
jth node of the hidden layer. The adjusted signals are summed using the tanh transfer function, and the resulting outputs are collected at the output layer.
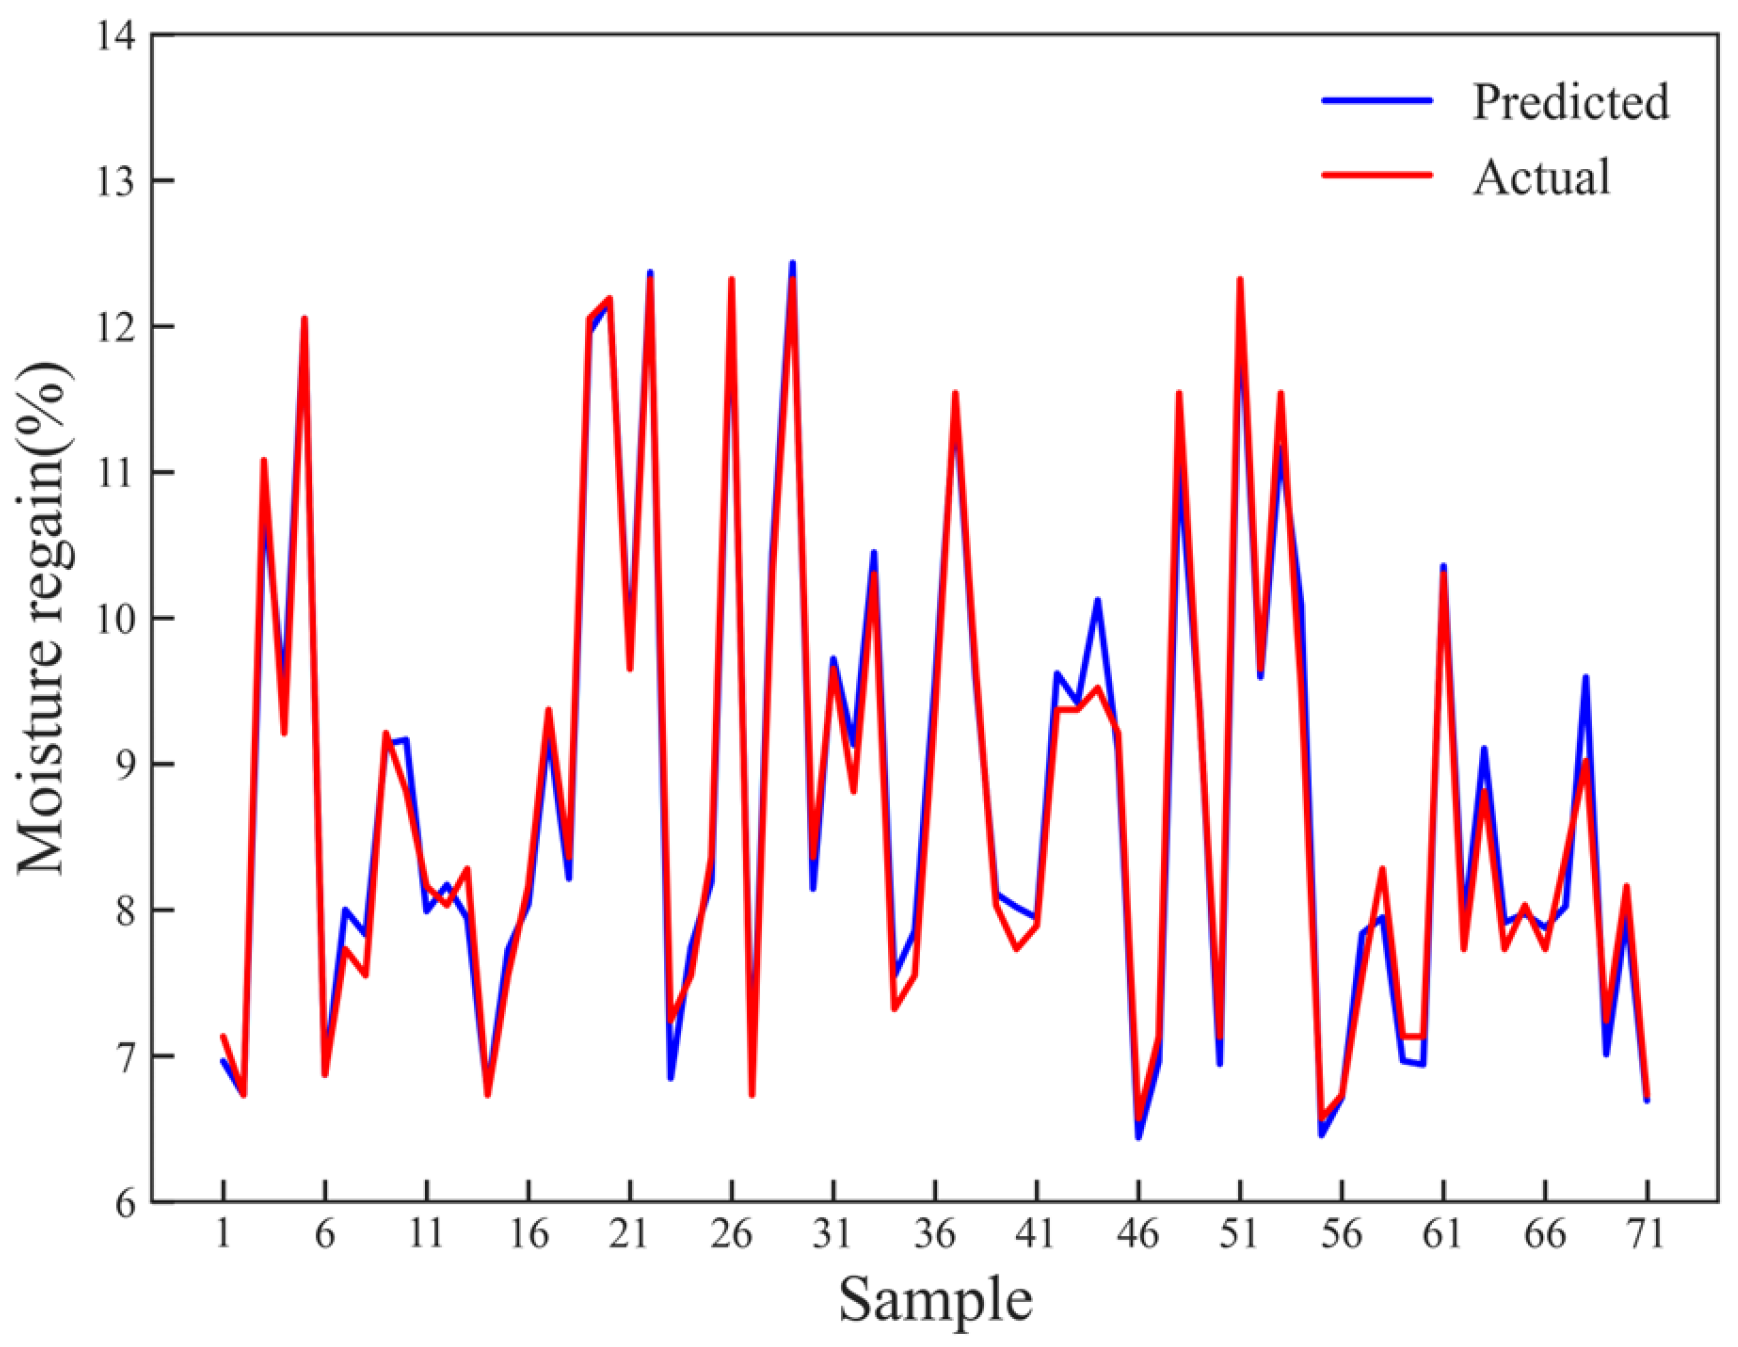
BPNN has strong robustness, memory ability, nonlinear mapping ability, and self-learning ability. Therefore, it has good applicability to the experimental data in this study. BPNN was used to build the seed cotton MR prediction model, and the validation dataset was used to test the stability of the prediction model. It was found that when the BPNN model was used to predict the MR of each sample, all errors were small (
Figure 14). Specifically, the calculation of the standard deviation for each dataset showed that the mean absolute error was less than 0.26%. This indicates the high stability of the model.
3.6. Performance Evaluation
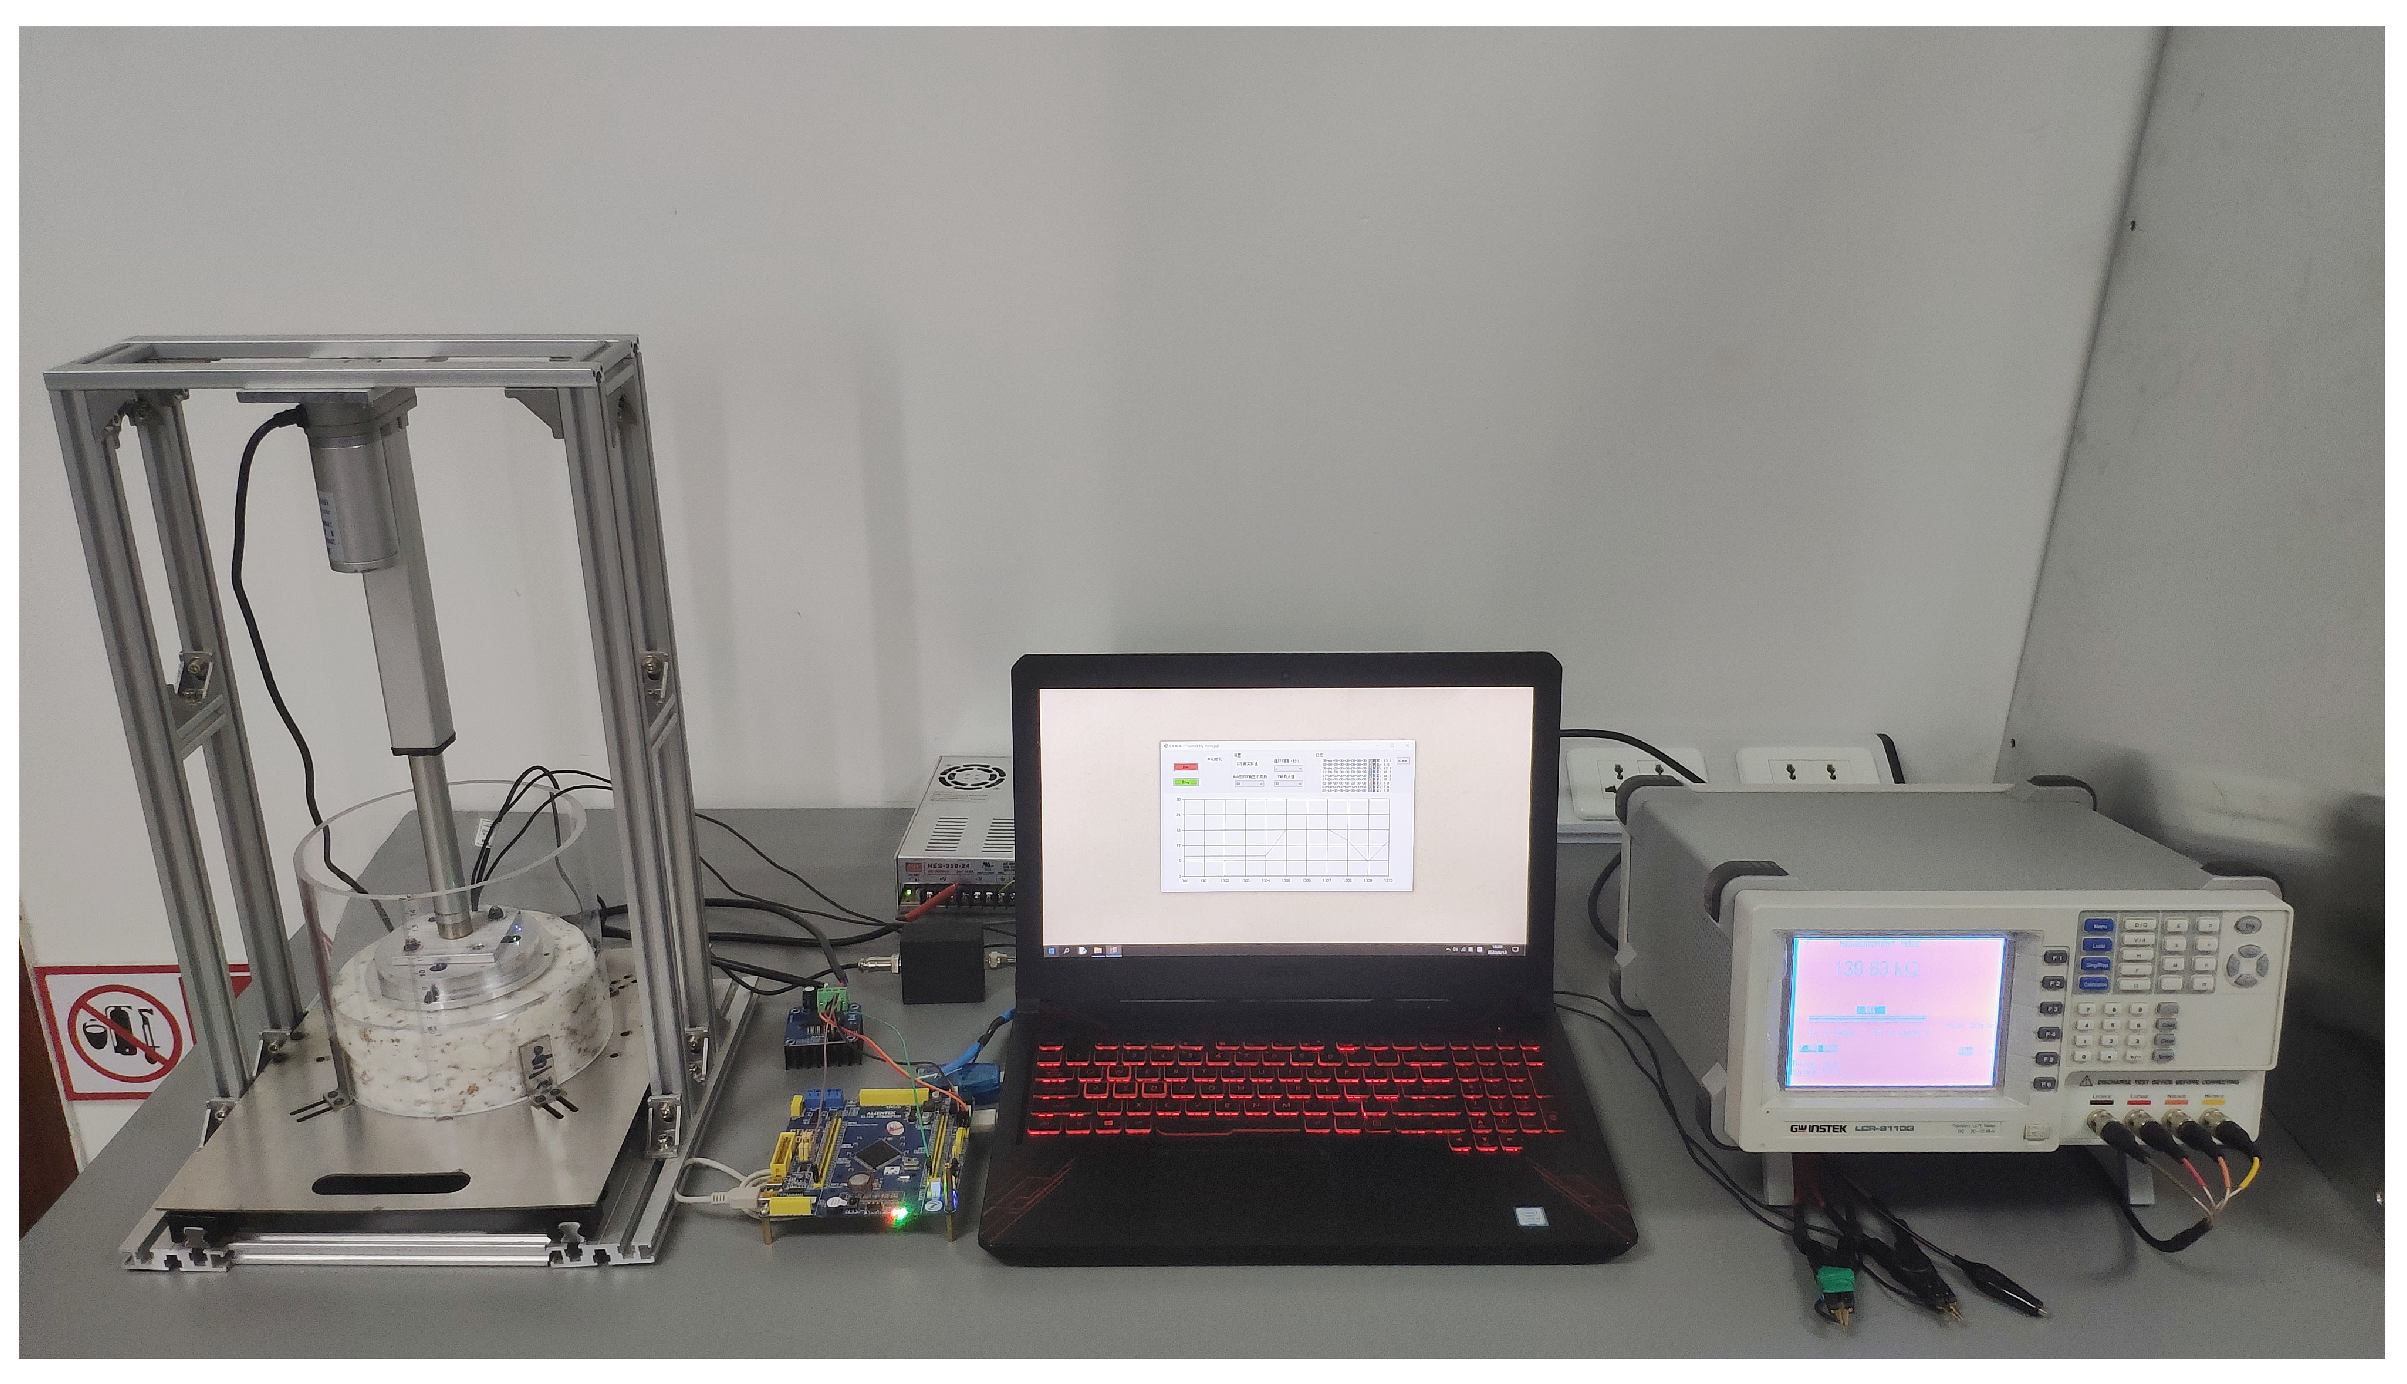
To verify the reliability of the MR measurement method based on pressure compensation, an additional set, including six groups of seed cotton samples with different MR levels, was prepared. Each group included two samples. One sample was measured using the experimental platform, and the MR value was displayed on the computer (
Figure 15). The other sample was measured using a semi-automatic constant-temperature oven. The results from both methods were compared.
It was found that the proposed MR measurement method exhibited a relatively high measurement accuracy, with the maximum RMSE and mean RMSE between the two methods being 0.24% and 0.20%, respectively (
Table 6). This indicates that the pressure compensation-based method for measuring the seed cotton MR is reliable. Furthermore, the maximum CV and mean CV of the measured values on the experimental platform were 3.66% and 2.22%, respectively. This demonstrates the relatively high stability for seed cotton samples with different MR levels. Based on these findings, it can be concluded that even in the case of density changes, the method for resistive sensing of seed cotton MR measurement based on pressure compensation still has relatively high accuracy and stability, so it can be applied in practical measurements.


 ,
, 


