
Using Lower Limb Wearable Sensors to Identify Gait Modalities: A Machine-Learning-Based Approach


Abstract
:1. Introduction
2. Methods
2.1. Participants
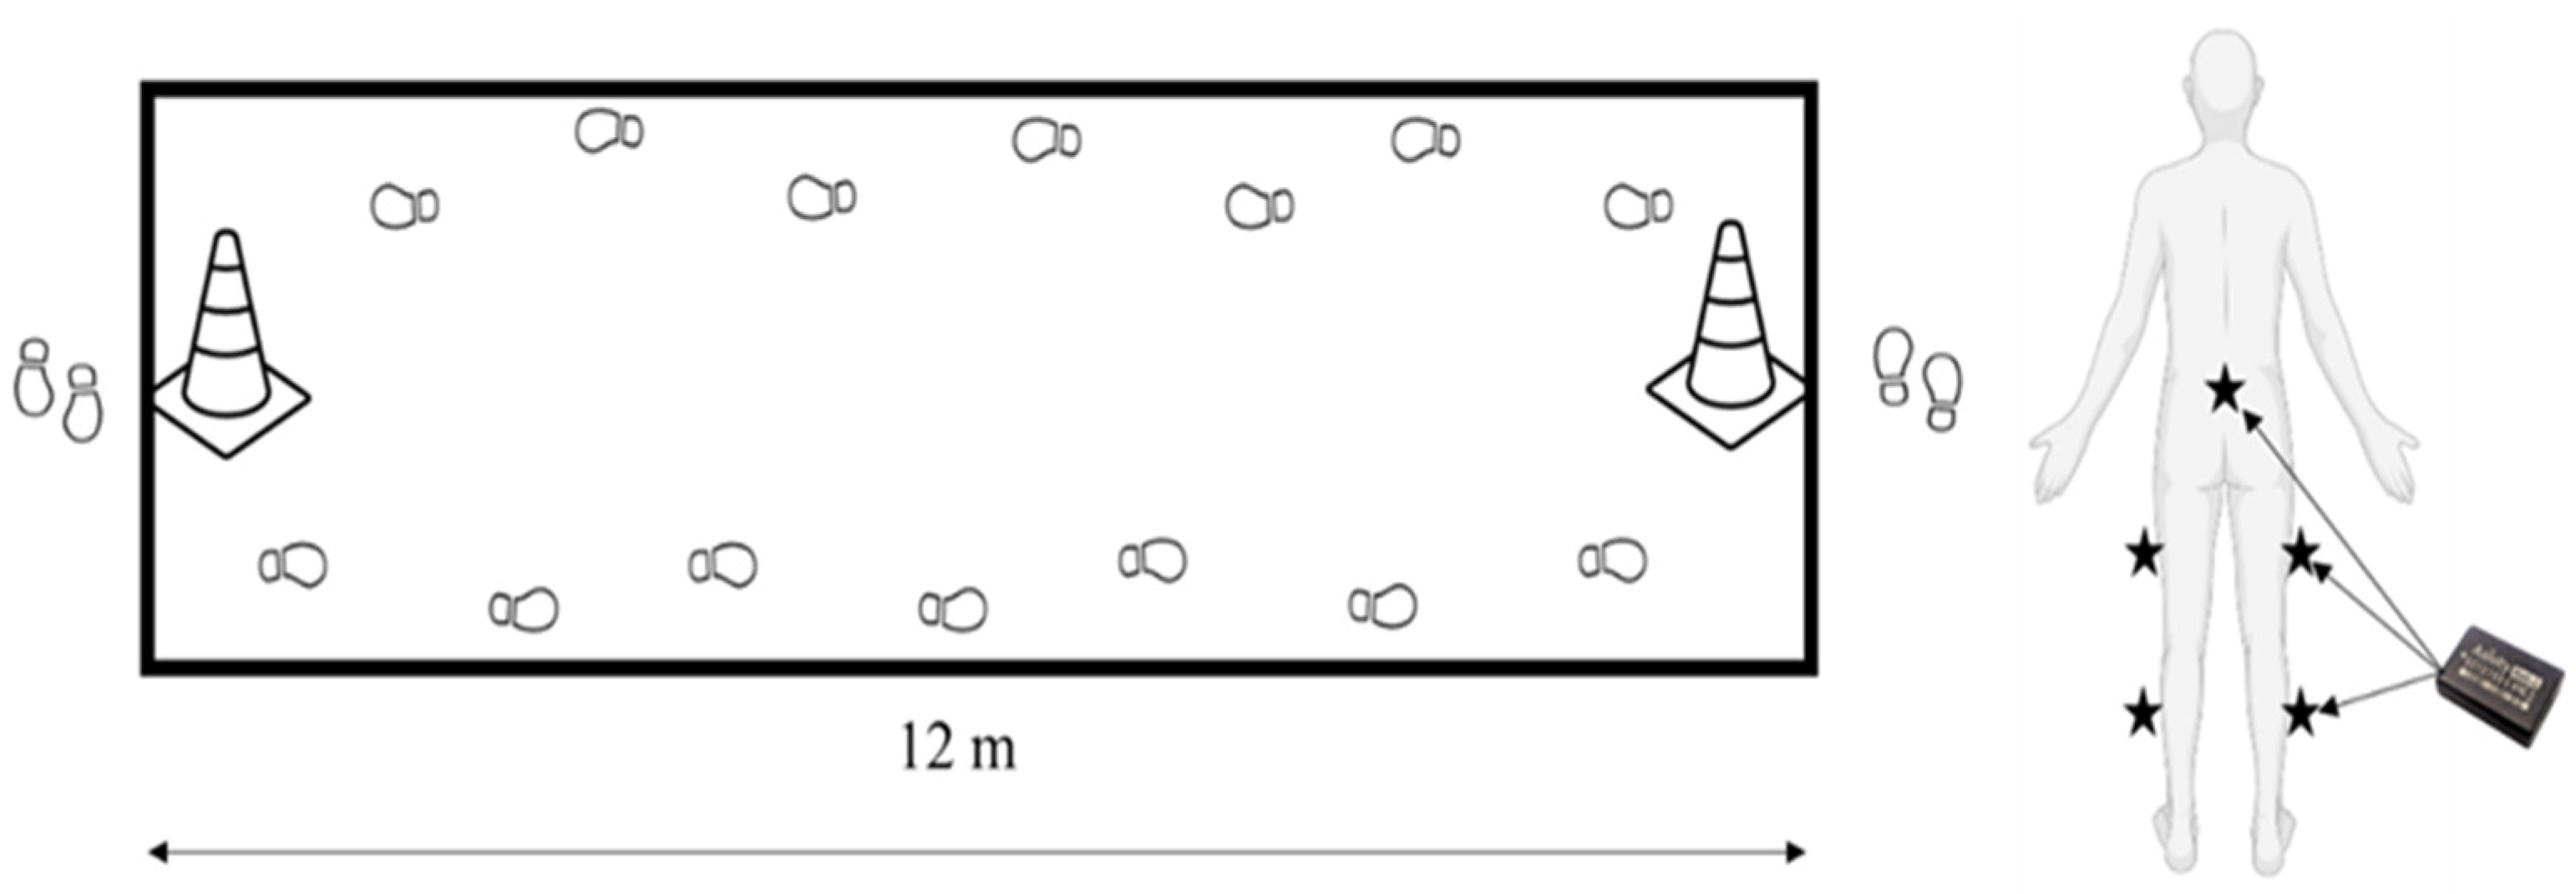
2.2. Study Design
2.3. Instrumentation
2.4. Machine Learning Algorithm
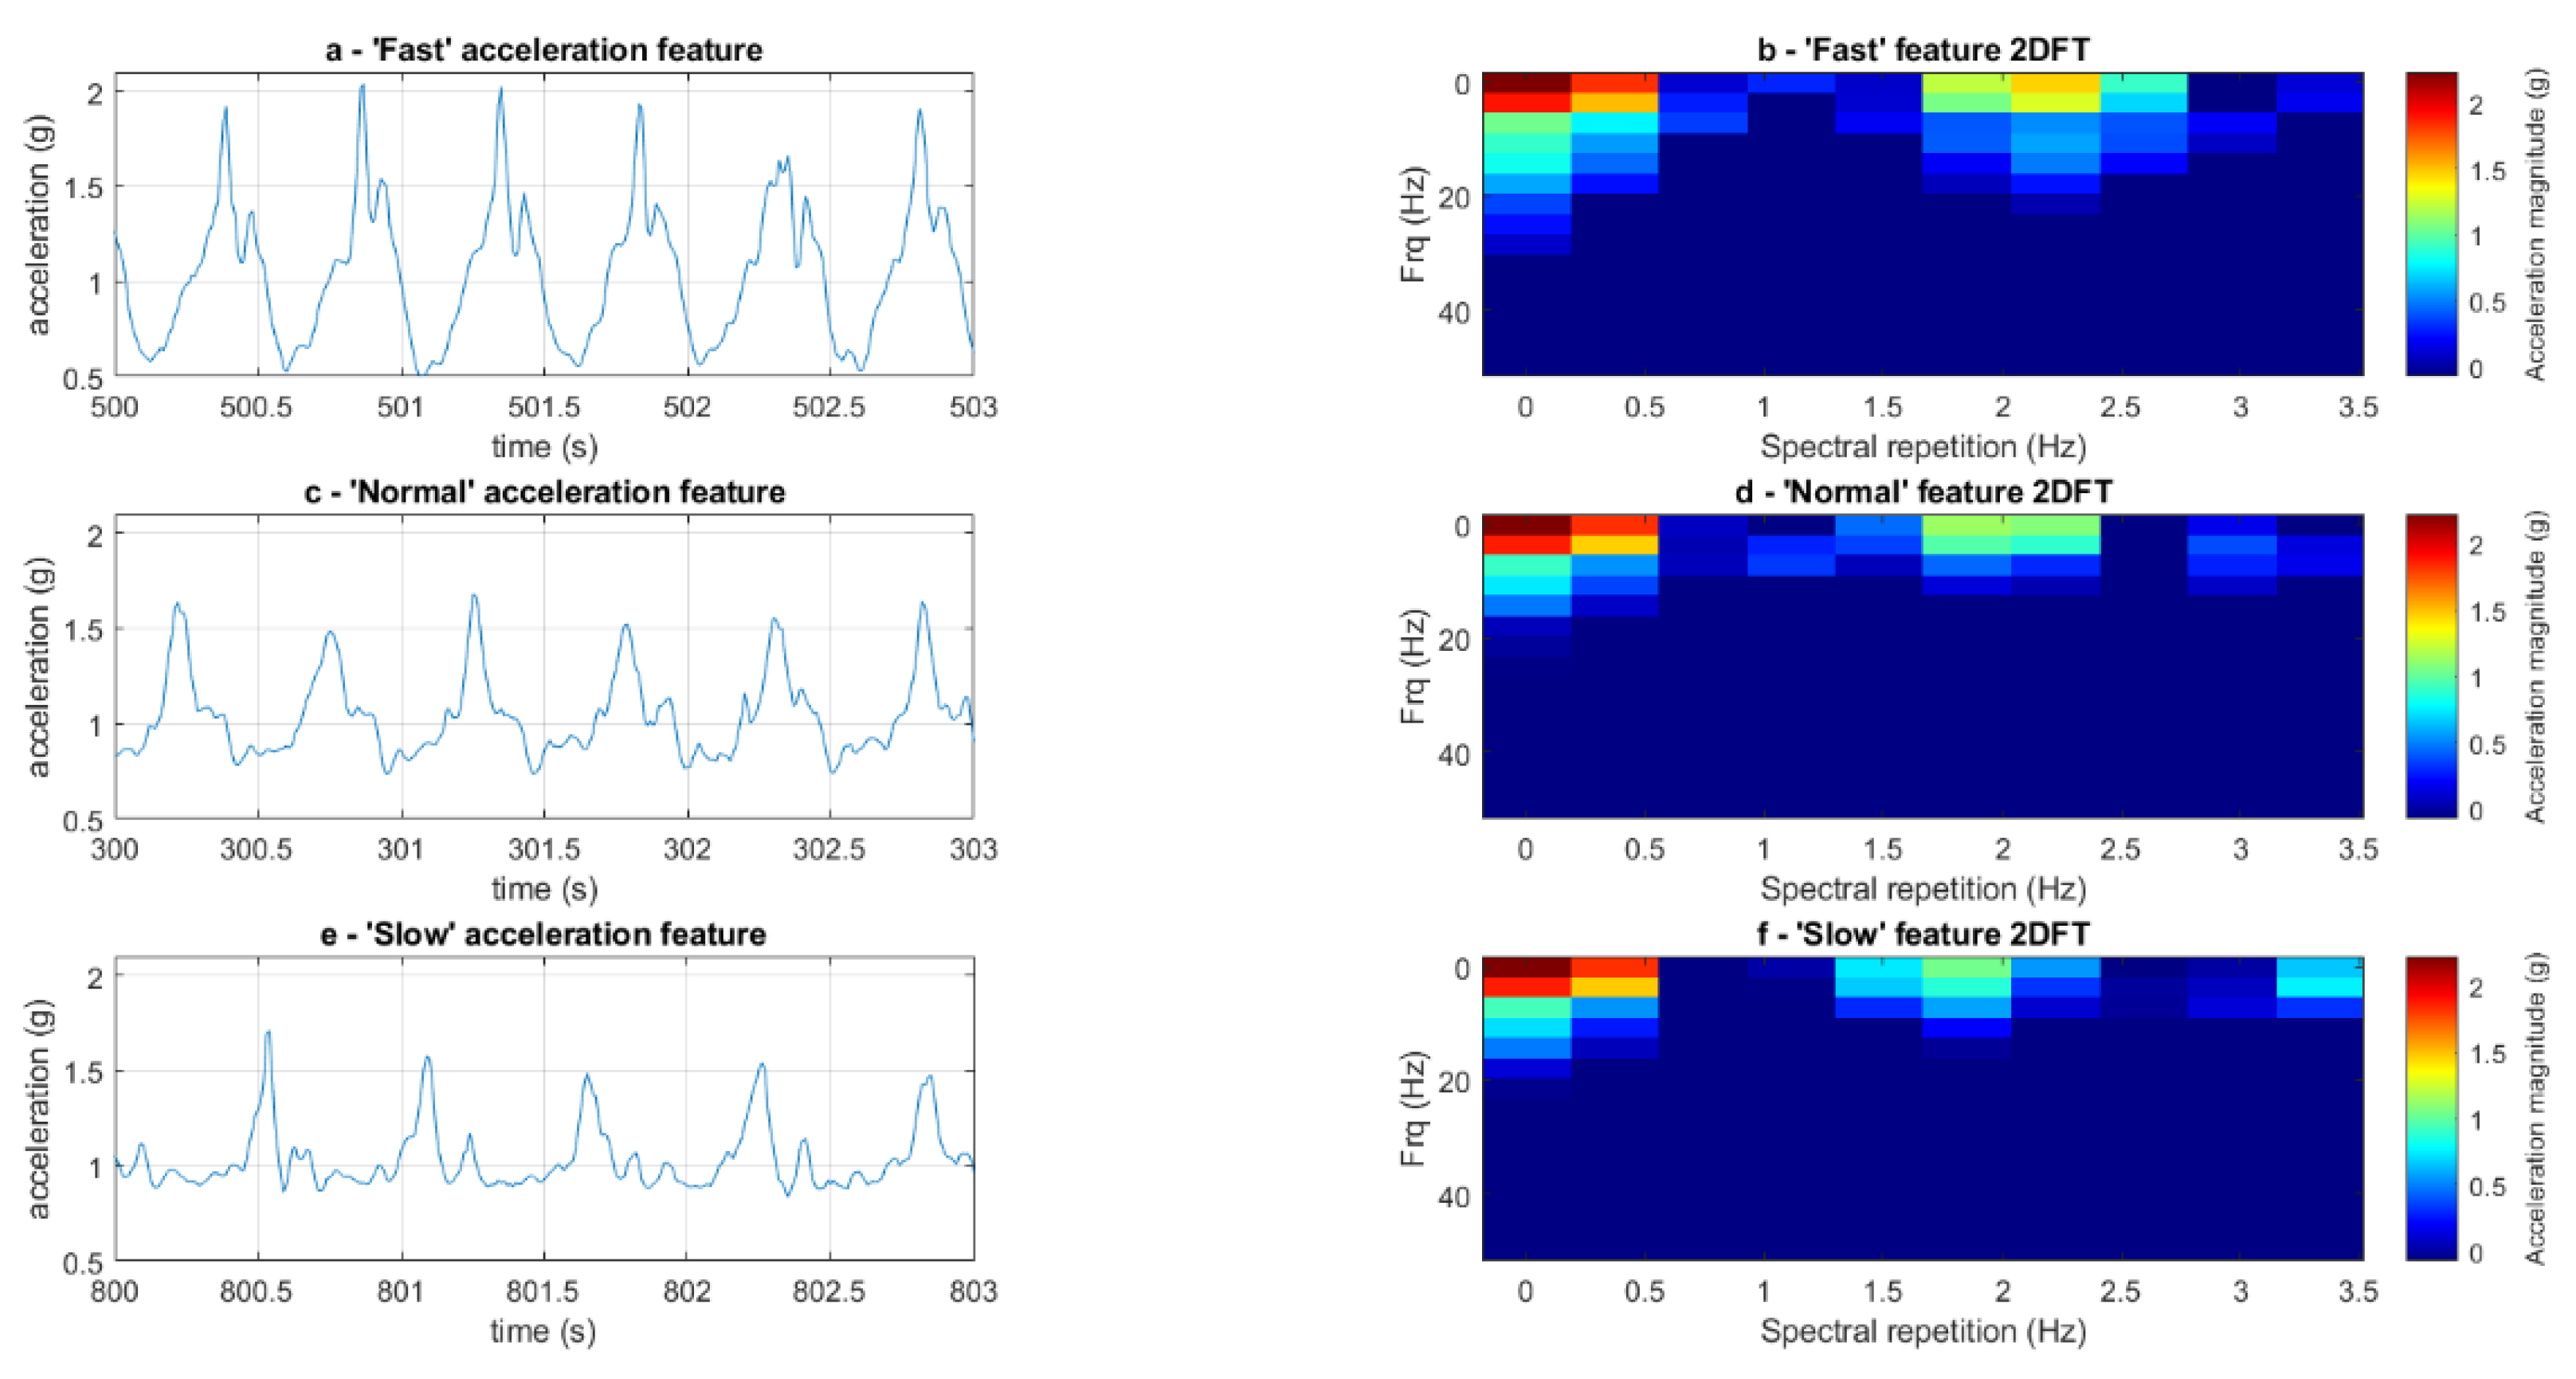
2.4.1. Pre-Processing
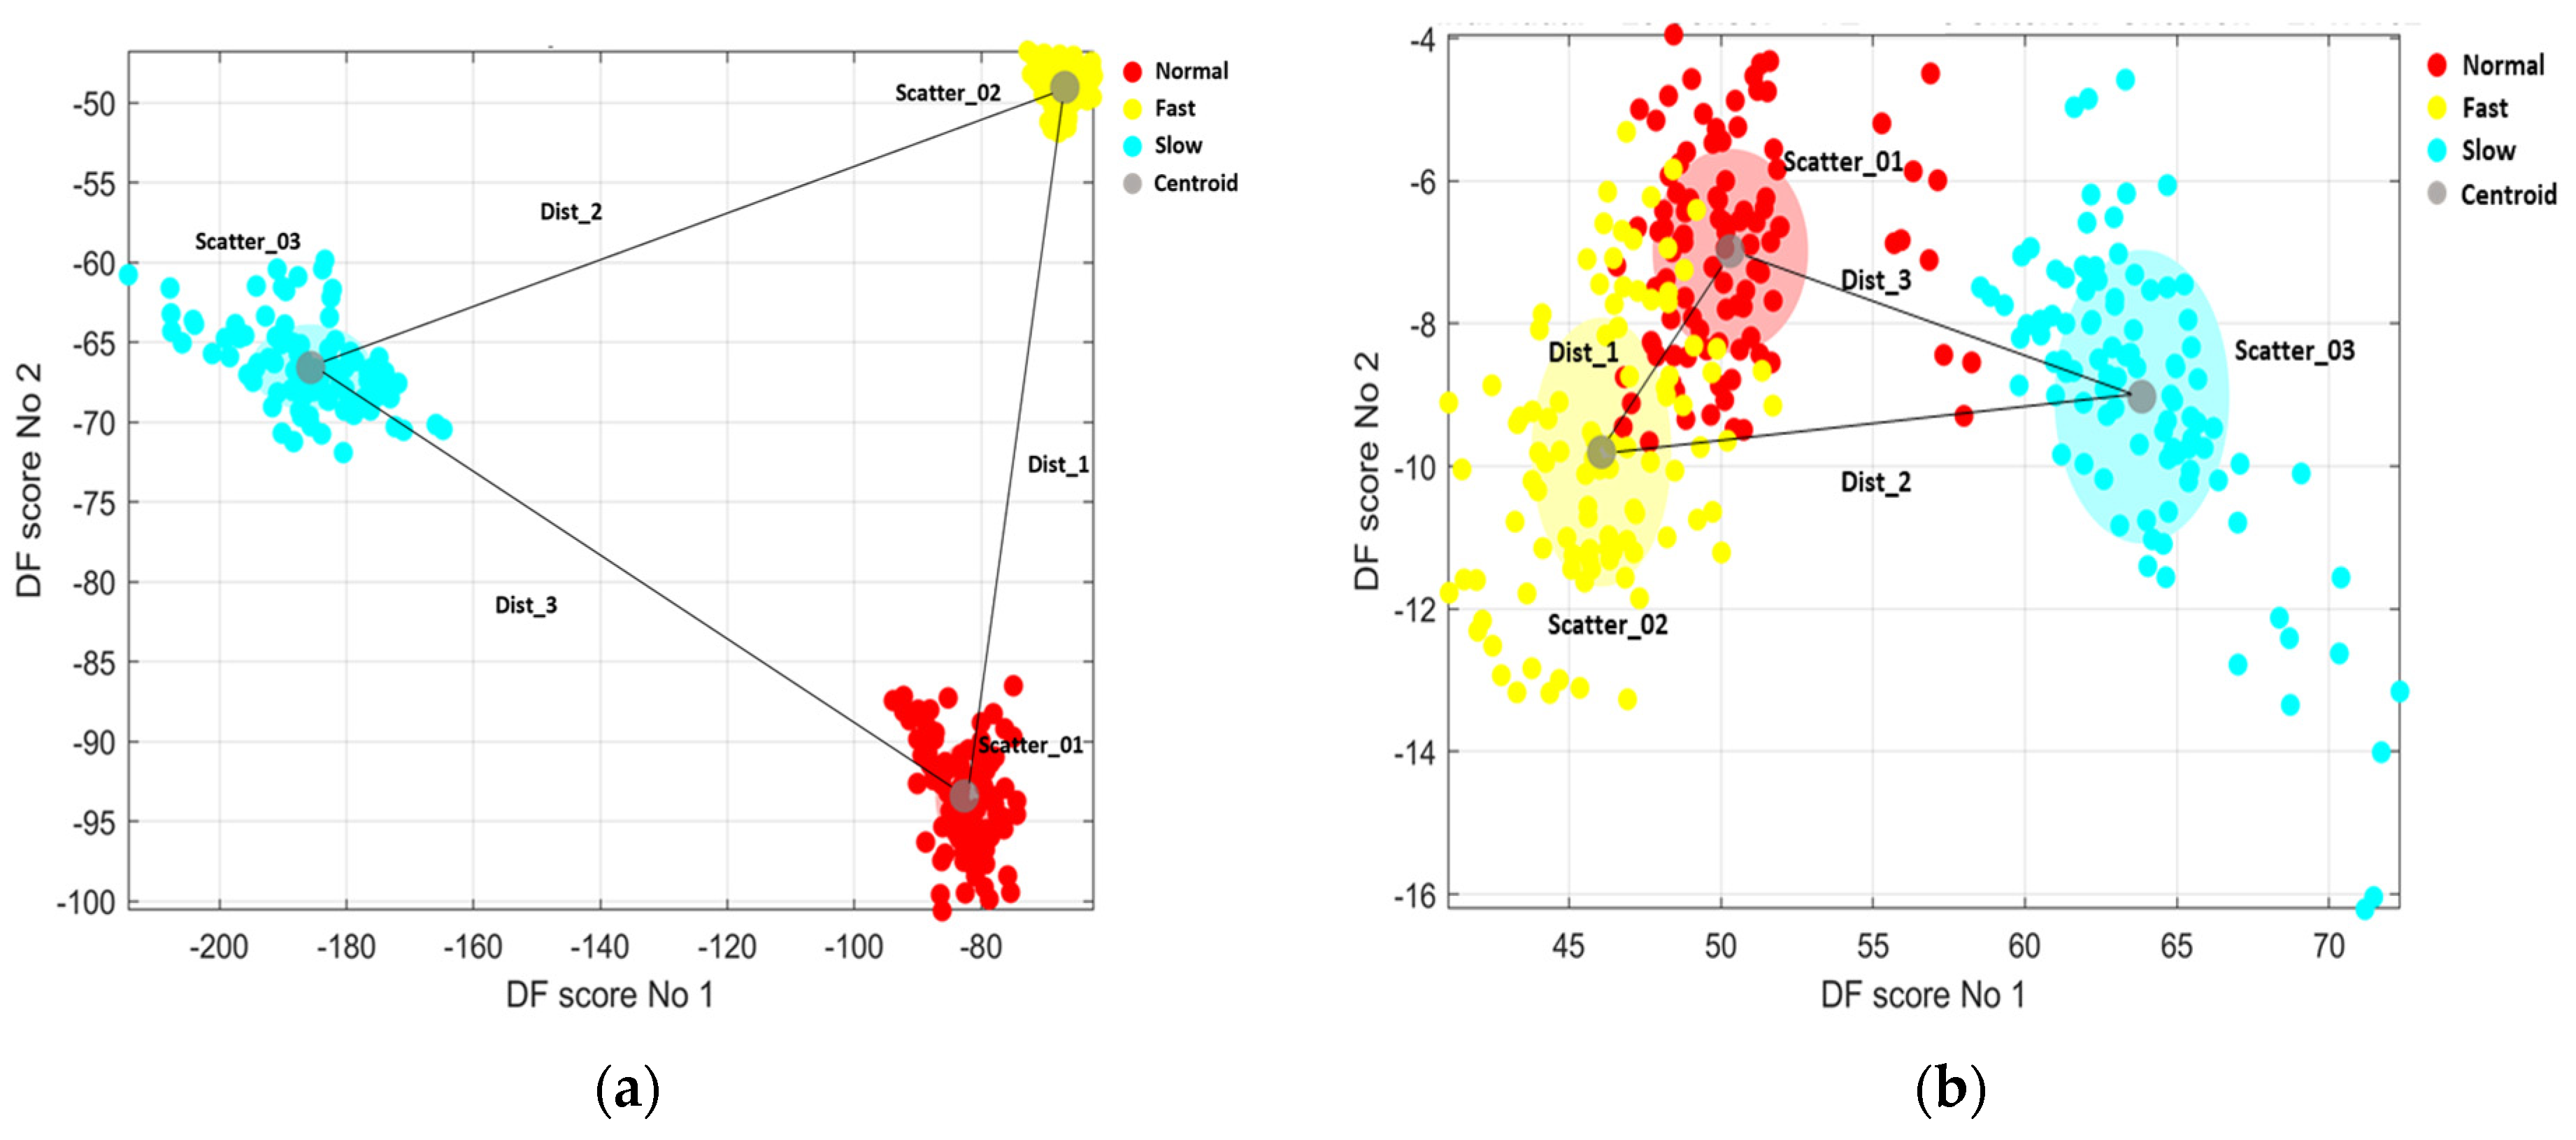
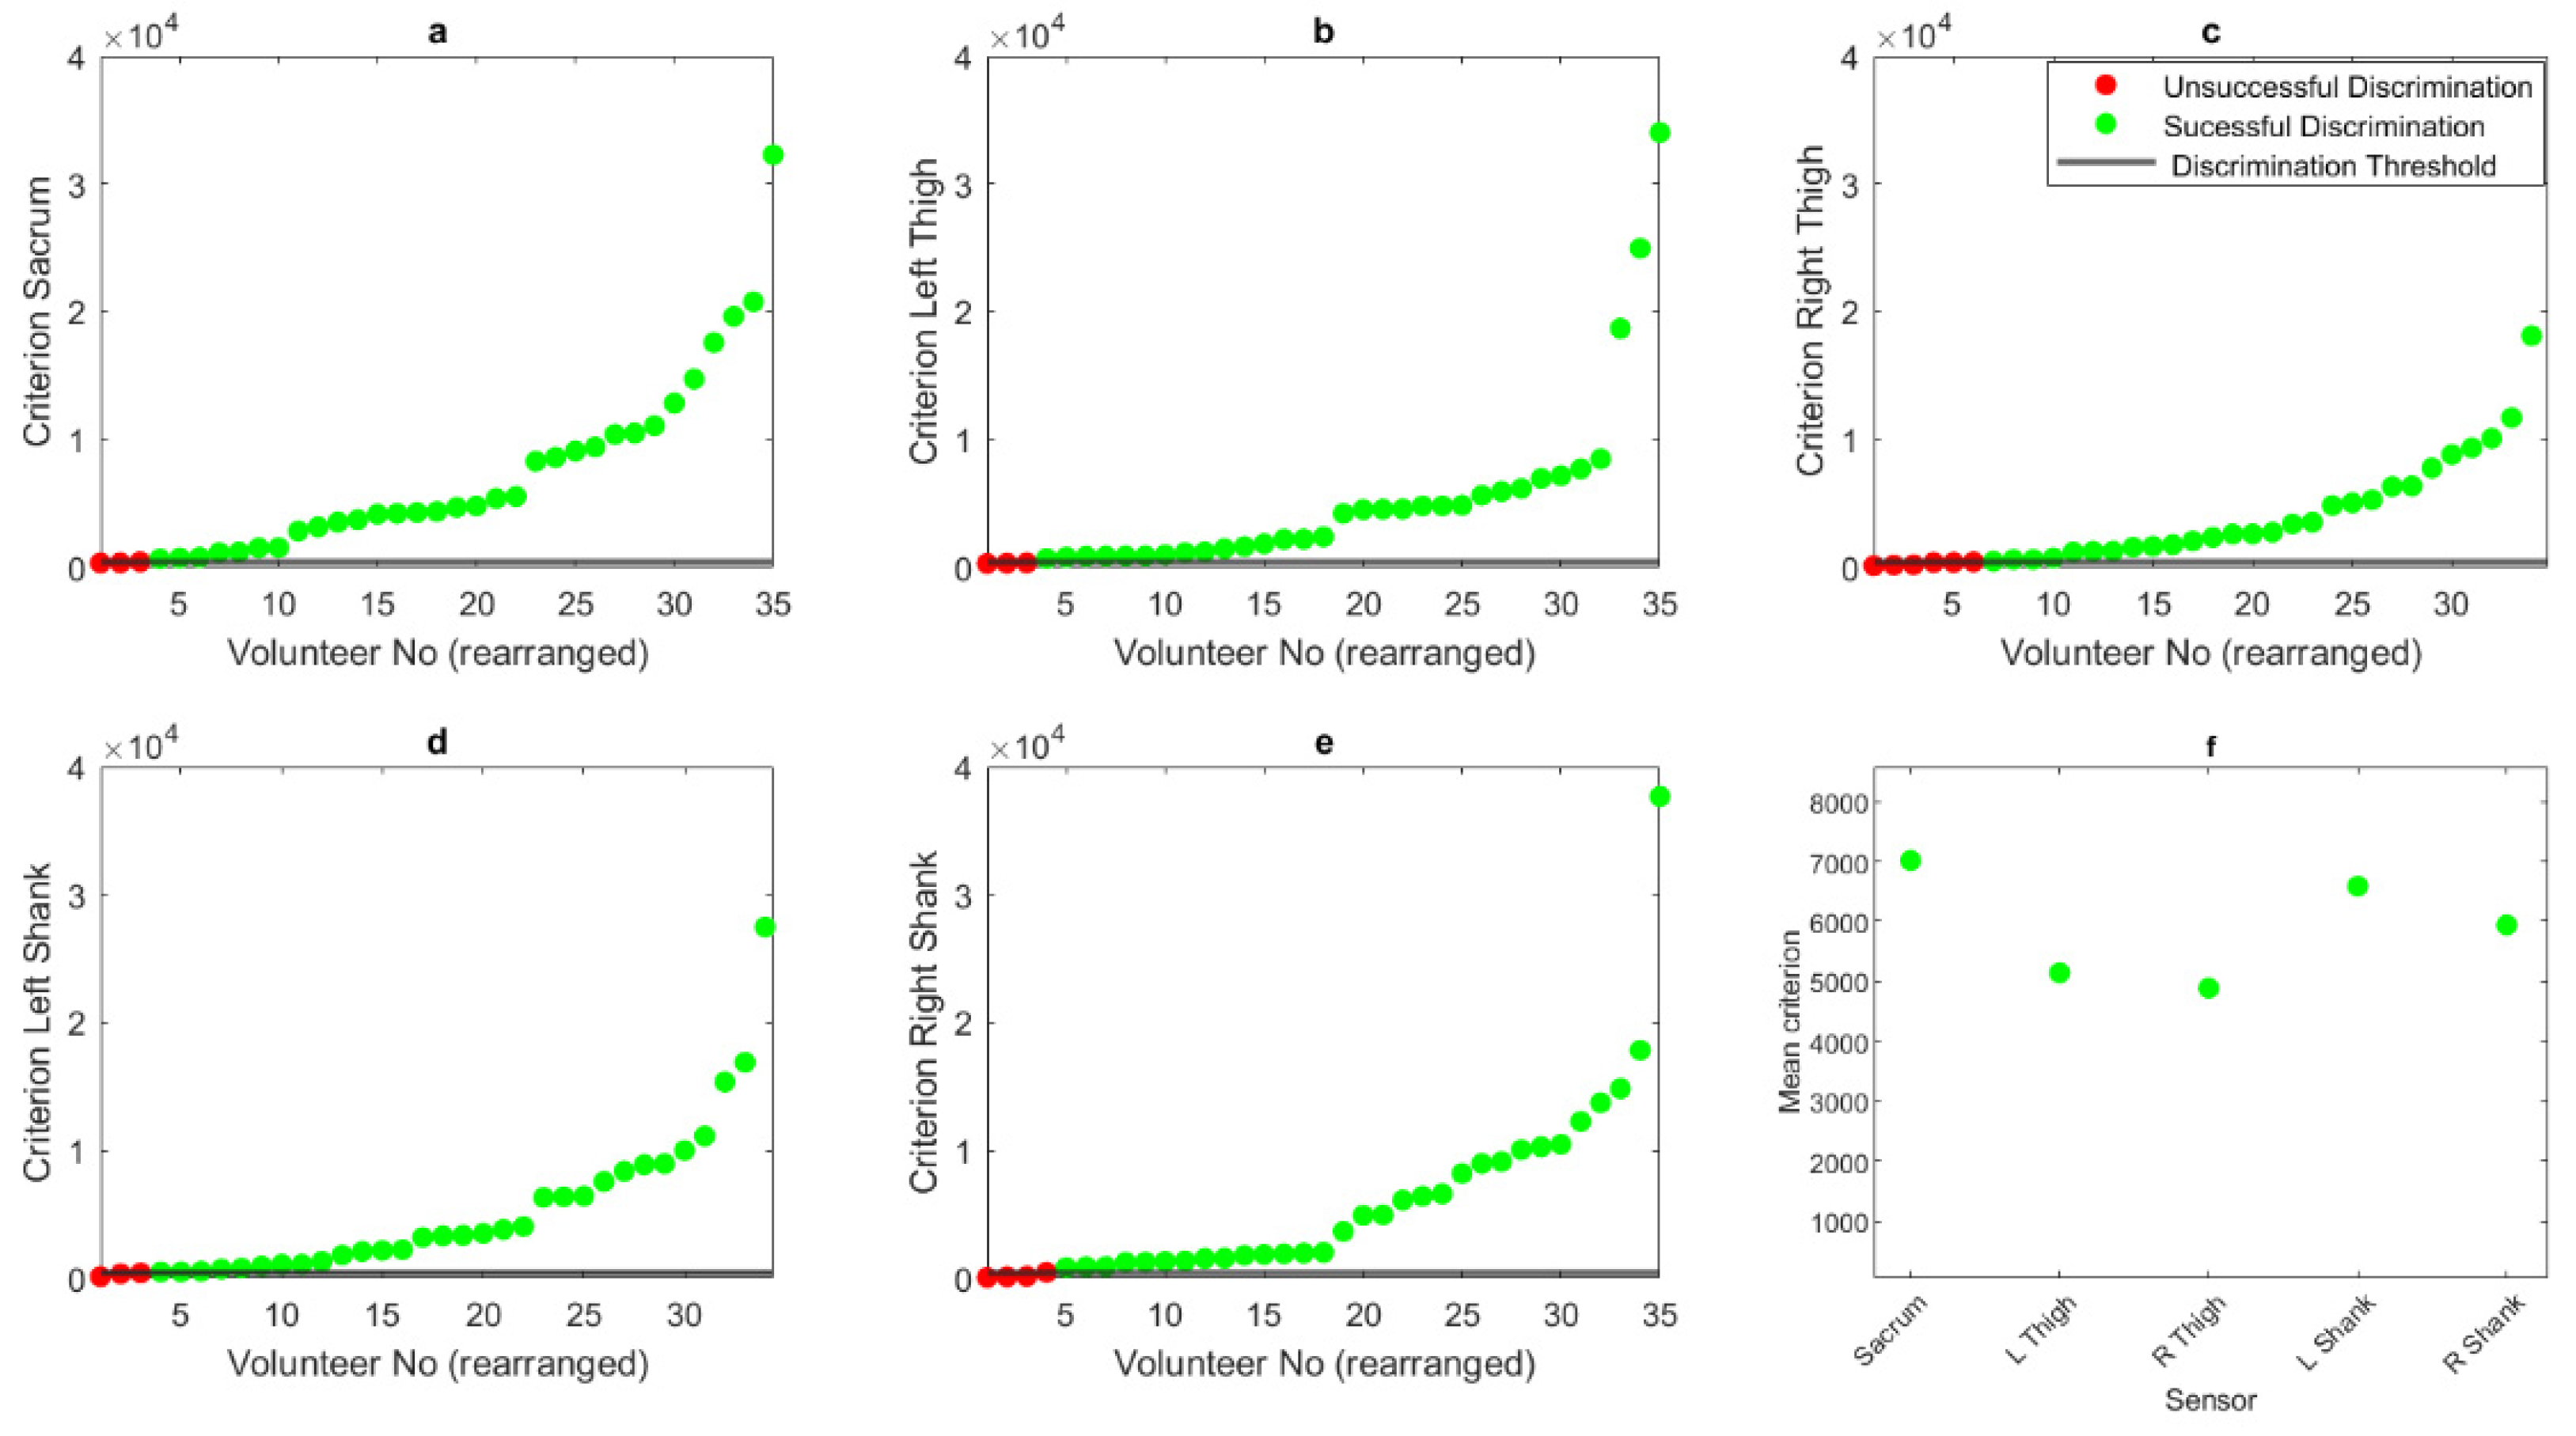
2.4.2. Discrimination Quantification
3. Results
4. Discussion
5. Conclusions
Author Contributions
Funding
Institutional Review Board Statement
Informed Consent Statement
Data Availability Statement
Acknowledgments
Conflicts of Interest
References
- Rehman, R.Z.U.; Del Din, S.; Shi, J.Q.; Galna, B.; Lord, S.; Yarnall, A.J.; Guan, Y.; Rochester, L. Comparison of Walking Protocols and Gait Assessment Systems for Machine Learning-Based Classification of Parkinson’s Disease. Sensors 2019, 19, 5363. [Google Scholar] [CrossRef]
- Buckley, C.; Alcock, L.; McArdle, R.; Rehman, R.; Del Din, S.; Mazzà, C.; Yarnall, A.; Rochester, L. The Role of Movement Analysis in Diagnosing and Monitoring Neurodegenerative Conditions: Insights from Gait and Postural Control. Brain Sci. 2019, 9, 34. [Google Scholar] [CrossRef]
- Rehman, R.Z.U.; Zhou, Y.; Del Din, S.; Alcock, L.; Hansen, C.; Guan, Y.; Hortobágyi, T.; Maetzler, W.; Rochester, L.; Lamoth, C.J.C. Gait Analysis with Wearables Can Accurately Classify Fallers from Non-Fallers: A Step toward Better Management of Neurological Disorders. Sensors 2020, 20, 6992. [Google Scholar] [CrossRef]
- Dauriac, B.; Bonnet, X.; Pillet, H.; Lavaste, F. Estimation of the walking speed of individuals with transfemoral amputation from a single prosthetic shank-mounted IMU. Proc. Inst. Mech. Eng. H 2019, 233, 931–937. [Google Scholar] [CrossRef] [PubMed]
- Noh, B.; Yoon, H.; Youm, C.; Kim, S.; Lee, M.; Park, H.; Kim, B.; Choi, H.; Noh, Y. Prediction of Decline in Global Cognitive Function Using Machine Learning with Feature Ranking of Gait and Physical Fitness Outcomes in Older Adults. Int. J. Environ. Res. Public Health 2021, 18, 11347. [Google Scholar] [CrossRef]
- Trentzsch, K.; Schumann, P.; Śliwiński, G.; Bartscht, P.; Haase, R.; Schriefer, D.; Zink, A.; Heinke, A.; Jochim, T.; Malberg, H.; et al. Using Machine Learning Algorithms for Identifying Gait Parameters Suitable to Evaluate Subtle Changes in Gait in People with Multiple Sclerosis. Brain Sci. 2021, 11, 1049. [Google Scholar] [CrossRef]
- Maki, B.E. Gait Changes in Older Adults: Predictors of Falls or Indicators of Fear? J. Am. Geriatr. Soc. 1997, 45, 313–320. [Google Scholar] [CrossRef] [PubMed]
- Perera, S.; Patel, K.V.; Rosano, C.; Rubin, S.M.; Satterfield, S.; Harris, T.; Ensrud, K.; Orwoll, E.; Lee, C.G.; Chandler, J.M.; et al. Gait Speed Predicts Incident Disability: A Pooled Analysis. J. Gerontol. Ser. A 2016, 71, 63–71. [Google Scholar] [CrossRef] [PubMed]
- Quach, L.; Galica, A.M.; Jones, R.N.; Procter-Gray, E.; Manor, B.; Hannan, M.T.; Lipsitz, L.A. The Nonlinear Relationship Between Gait Speed and Falls: The Maintenance of Balance, Independent Living, Intellect, and Zest in the Elderly of Boston Study. J. Am. Geriatr. Soc. 2011, 59, 1069–1073. [Google Scholar] [CrossRef]
- Rochat, S.; Büla, C.J.; Martin, E.; Seematter-Bagnoud, L.; Karmaniola, A.; Aminian, K.; Piot-Ziegler, C.; Santos-Eggimann, B. What is the Relationship Between Fear of Falling and Gait in Well-Functioning Older Persons Aged 65 to 70 Years? Arch. Phys. Med. Rehabil. 2010, 91, 879–884. [Google Scholar] [CrossRef]
- Mason, R.; Pearson, L.T.; Barry, G.; Young, F.; Lennon, O.; Godfrey, A.; Stuart, S. Wearables for Running Gait Analysis: A Systematic Review. Sports Med. 2023, 53, 241–268. [Google Scholar] [CrossRef] [PubMed]
- Soltani, A.; Dejnabadi, H.; Savary, M.; Aminian, K. Real-World Gait Speed Estimation Using Wrist Sensor: A Personalized Approach. IEEE J. Biomed. Health Inform. 2020, 24, 658–668. [Google Scholar] [CrossRef] [PubMed]
- Dixon, P.C.; Schütte, K.H.; Vanwanseele, B.; Jacobs, J.V.; Dennerlein, J.T.; Schiffman, J.M.; Fournier, P.-A.; Hu, B. Machine learning algorithms can classify outdoor terrain types during running using accelerometry data. Gait Posture 2019, 74, 176–181. [Google Scholar] [CrossRef] [PubMed]
- Mahoney, J.M.; Rhudy, M.B. Methodology and validation for identifying gait type using machine learning on IMU data. J. Med. Eng. Technol. 2019, 43, 25–32. [Google Scholar] [CrossRef] [PubMed]
- Chen, W.-H.; Lee, Y.-S.; Yang, C.-J.; Chang, S.-Y.; Shih, Y.; Sui, J.-D.; Chang, T.-S.; Shiang, T.-Y. Determining motions with an IMU during level walking and slope and stair walking. J. Sports Sci. 2020, 38, 62–69. [Google Scholar] [CrossRef]
- Beaufils, B.; Chazal, F.; Grelet, M.; Michel, B. Robust Stride Detector from Ankle-Mounted Inertial Sensors for Pedestrian Navigation and Activity Recognition with Machine Learning Approaches. Sensors 2019, 19, 4491. [Google Scholar] [CrossRef]
- Lee, M.-W.; Khan, A.M.; Kim, J.-H.; Cho, Y.-S.; Kim, T.-S. A single tri-axial accelerometer-based real-time personal life log system capable of activity classification and exercise information generation. In Proceedings of the 2010 Annual International Conference of the IEEE Engineering in Medicine and Biology, Buenos Aires, Argentina, 31 August–4 September 2010; pp. 1390–1393. [Google Scholar] [CrossRef]
- Li, Z.; Wei, Z.; Yue, Y.; Wang, H.; Jia, W.; Burke, L.E.; Baranowski, T.; Sun, M. An Adaptive Hidden Markov Model for Activity Recognition Based on a Wearable Multi-Sensor Device. J. Med. Syst. 2015, 39, 57. [Google Scholar] [CrossRef]
- Procter, D.S.; Page, A.S.; Cooper, A.R.; Nightingale, C.M.; Ram, B.; Rudnicka, A.R.; Whincup, P.H.; Clary, C.; Lewis, D.; Cummins, S.; et al. An open-source tool to identify active travel from hip-worn accelerometer, GPS and GIS data. Int. J. Behav. Nutr. Phys. Act. 2018, 15, 91. [Google Scholar] [CrossRef]
- Chu, A.H.Y.; Bernard, J.Y.; Koh, D.; Müller-Riemenschneider, F. Accelerometer Profile of Physical Activity and Sedentary Behavior in a Multi-Ethnic Urban Asian Population. Res. Q. Exerc. Sport 2021, 92, 361–368. [Google Scholar] [CrossRef]
- Lonini, L.; Gupta, A.; Kording, K.; Jayaraman, A. Activity recognition in patients with lower limb impairments: Do we need training data from each patient? In Proceedings of the 2016 38th Annual International Conference of the IEEE Engineering in Medicine and Biology Society (EMBC), Orlando, FL, USA, 16–20 August 2016; pp. 3265–3268. [Google Scholar] [CrossRef]
- Lonini, L.; Gupta, A.; Deems-Dluhy, S.; Hoppe-Ludwig, S.; Kording, K.; Jayaraman, A. Activity Recognition in Individuals Walking with Assistive Devices: The Benefits of Device-Specific Models. JMIR Rehabil. Assist. Technol. 2017, 4, e8. [Google Scholar] [CrossRef]
- Aziz, O.; Musngi, M.; Park, E.J.; Mori, G.; Robinovitch, S.N. A comparison of accuracy of fall detection algorithms (threshold-based vs. machine learning) using waist-mounted tri-axial accelerometer signals from a comprehensive set of falls and non-fall trials. Med. Biol. Eng. Comput. 2017, 55, 45–55. [Google Scholar] [CrossRef]
- Mannini, A.; Sabatini, A.M. Accelerometry-Based Classification of Human Activities Using Markov Modeling. Comput. Intell. Neurosci. 2011, 2011, 647858. [Google Scholar] [CrossRef]
- Mannini, A.; Sabatini, A.M. Walking speed estimation using foot-mounted inertial sensors: Comparing machine learning and strap-down integration methods. Med. Eng. Phys. 2014, 36, 1312–1321. [Google Scholar] [CrossRef] [PubMed]
- Benson, L.C.; Clermont, C.A.; Osis, S.T.; Kobsar, D.; Ferber, R. Classifying running speed conditions using a single wearable sensor: Optimal segmentation and feature extraction methods. J. Biomech. 2018, 71, 94–99. [Google Scholar] [CrossRef]
- Hu, B.; Dixon, P.C.; Jacobs, J.V.; Dennerlein, J.T.; Schiffman, J.M. Machine learning algorithms based on signals from a single wearable inertial sensor can detect surface- and age-related differences in walking. J. Biomech. 2018, 71, 37–42. [Google Scholar] [CrossRef]
- Skaramagkas, V.; Pentari, A.; Kefalopoulou, Z.; Tsiknakis, M. Multi-Modal Deep Learning Diagnosis of Parkinson’s Disease—A Systematic Review. IEEE Trans. Neural Syst. Rehabil. Eng. 2023, 31, 2399–2423. [Google Scholar] [CrossRef] [PubMed]
- McGinnis, R.S.; Mahadevan, N.; Moon, Y.; Seagers, K.; Sheth, N.; Wright, J.A.; DiCristofaro, S.; Silva, I.; Jortberg, E.; Ceruolo, M.; et al. A machine learning approach for gait speed estimation using skin-mounted wearable sensors: From healthy controls to individuals with multiple sclerosis. PLoS ONE 2017, 12, e0178366. [Google Scholar] [CrossRef] [PubMed]
- Ejupi, A.; Galang, C.; Aziz, O.; Park, E.J.; Robinovitch, S. Accuracy of a wavelet-based fall detection approach using an accelerometer and a barometric pressure sensor. In Proceedings of the 2017 39th Annual International Conference of the IEEE Engineering in Medicine and Biology Society (EMBC), Seogwipo, Republic of Korea, 11–15 July 2017; pp. 2150–2153. [Google Scholar] [CrossRef]
- Aziz, O.; Klenk, J.; Schwickert, L.; Chiari, L.; Becker, C.; Park, E.J.; Mori, G.; Robinovitch, S.N. Validation of accuracy of SVM-based fall detection system using real-world fall and non-fall datasets. PLoS ONE 2017, 12, e0180318. [Google Scholar] [CrossRef] [PubMed]
- Yurtman, A.; Barshan, B. Activity Recognition Invariant to Sensor Orientation with Wearable Motion Sensors. Sensors 2017, 17, 1838. [Google Scholar] [CrossRef]
- Ma, Y.; Ghasemzadeh, H. An asynchronous multi-view learning approach for activity recognition using wearables. In Proceedings of the 2016 38th Annual International Conference of the IEEE Engineering in Medicine and Biology Society (EMBC), Orlando, FL, USA, 16–20 August 2016; pp. 3105–3108. [Google Scholar] [CrossRef]
- Martindale, C.F.; Sprager, S.; Eskofier, B.M. Hidden Markov Model-Based Smart Annotation for Benchmark Cyclic Activity Recognition Database Using Wearables. Sensors 2019, 19, 1820. [Google Scholar] [CrossRef]
- Fukushi, K.; Huang, C.; Wang, Z.; Kajitani, H.; Nihey, F.; Nakahara, K. On-Line Algorithms of Stride-Parameter Estimation for in-Shoe Motion-Sensor System. IEEE Sens. J. 2022, 22, 9636–9648. [Google Scholar] [CrossRef]
- Figueiredo, J.; Santos, C.P.; Moreno, J.C. Automatic recognition of gait patterns in human motor disorders using machine learning: A review. Med. Eng. Phys. 2018, 53, 1–12. [Google Scholar] [CrossRef]
- Cleland, I.; Kikhia, B.; Nugent, C.; Boytsov, A.; Hallberg, J.; Synnes, K.; McClean, S.; Finlay, D. Optimal Placement of Accelerometers for the Detection of Everyday Activities. Sensors 2013, 13, 9183–9200. [Google Scholar] [CrossRef] [PubMed]
- Ramsey, M.-T. The Ethology of Honeybees (Apis mellifera) Studied Using Accelerometer Technology. Ph.D. Thesis, Nottingham Trent University, Nottingham, UK, 2018. [Google Scholar]
- Hall, H.; Bencsik, M.; Newton, M. Automated, non-invasive Varroa mite detection by vibrational measurements of gait combined with machine learning. Sci. Rep. 2023, 13, 10202. [Google Scholar] [CrossRef] [PubMed]
- Bisele, M.; Bencsik, M.; Lewis, M.G.C.; Barnett, C.T. Optimisation of a machine learning algorithm in human locomotion using principal component and discriminant function analyses. PLoS ONE 2017, 12, e0183990. [Google Scholar] [CrossRef] [PubMed]
- Ramsey, M.-T.; Bencsik, M.; Newton, M.I.; Reyes, M.; Pioz, M.; Crauser, D.; Delso, N.S.; Le Conte, Y. The prediction of swarming in honeybee colonies using vibrational spectra. Sci. Rep. 2020, 10, 9798. [Google Scholar] [CrossRef]
- Binotto, M.A.; Lenardt, M.H.; Rodríguez-Martínez, M.d.C. Fragilidade física e velocidade da marcha em idosos da comunidade: Uma revisão sistemática. Rev. Esc. Enferm. USP 2018, 52, e03392. [Google Scholar] [CrossRef]
- Stansfield, B.; Hawkins, K.; Adams, S.; Church, D. Spatiotemporal and kinematic characteristics of gait initiation across a wide speed range. Gait Posture 2018, 61, 331–338. [Google Scholar] [CrossRef]
- Grande, G.; Triolo, F.; Nuara, A.; Welmer, A.-K.; Fratiglioni, L.; Vetrano, D.L. Measuring gait speed to better identify prodromal dementia. Exp. Gerontol. 2019, 124, 110625. [Google Scholar] [CrossRef]
- Rose, D.K.; Nadeau, S.E.; Wu, S.S.; Tilson, J.K.; Dobkin, B.H.; Pei, Q.; Duncan, P.W. Locomotor Training and Strength and Balance Exercises for Walking Recovery After Stroke: Response to Number of Training Sessions. Phys. Ther. 2017, 97, 1066–1074. [Google Scholar] [CrossRef]
- Barnett, C.T.; Hughes, L.D.; Sullivan, A.E.; Strutzenberger, G.; Levick, J.L.; Bisele, M.; De Asha, A.R. Exploring the interaction of knee and ankle component use on mobility test performance in people with unilateral transfemoral amputation. Prosthet. Orthot. Int. 2021, 45, 470–476. [Google Scholar] [CrossRef] [PubMed]


Disclaimer/Publisher’s Note: The statements, opinions and data contained in all publications are solely those of the individual author(s) and contributor(s) and not of MDPI and/or the editor(s). MDPI and/or the editor(s) disclaim responsibility for any injury to people or property resulting from any ideas, methods, instructions or products referred to in the content. |
© 2023 by the authors. Licensee MDPI, Basel, Switzerland. This article is an open access article distributed under the terms and conditions of the Creative Commons Attribution (CC BY) license (https://creativecommons.org/licenses/by/4.0/).
Share and Cite
Hughes, L.D.; Bencsik, M.; Bisele, M.; Barnett, C.T. Using Lower Limb Wearable Sensors to Identify Gait Modalities: A Machine-Learning-Based Approach. Sensors 2023, 23, 9241. https://doi.org/10.3390/s23229241
Hughes LD, Bencsik M, Bisele M, Barnett CT. Using Lower Limb Wearable Sensors to Identify Gait Modalities: A Machine-Learning-Based Approach. Sensors. 2023; 23(22):9241. https://doi.org/10.3390/s23229241
Chicago/Turabian StyleHughes, Liam David, Martin Bencsik, Maria Bisele, and Cleveland Thomas Barnett. 2023. "Using Lower Limb Wearable Sensors to Identify Gait Modalities: A Machine-Learning-Based Approach" Sensors 23, no. 22: 9241. https://doi.org/10.3390/s23229241
APA StyleHughes, L. D., Bencsik, M., Bisele, M., & Barnett, C. T. (2023). Using Lower Limb Wearable Sensors to Identify Gait Modalities: A Machine-Learning-Based Approach. Sensors, 23(22), 9241. https://doi.org/10.3390/s23229241