
Exploring Technology- and Sensor-Driven Trends in Education: A Natural-Language-Processing-Enhanced Bibliometrics Study †


Abstract
:1. Introduction
- What are the main topics of EC-TEL based on keywords and topic modeling using the full text of manuscripts from the last ten years?
- What has been the evolution of said topics over the last ten years before the conference?
- How have papers and authors interacted over the last ten years before the conference?
2. Related Work
2.1. Bibliometrics
2.2. Natural Language Processing
2.3. Social Network Analysis
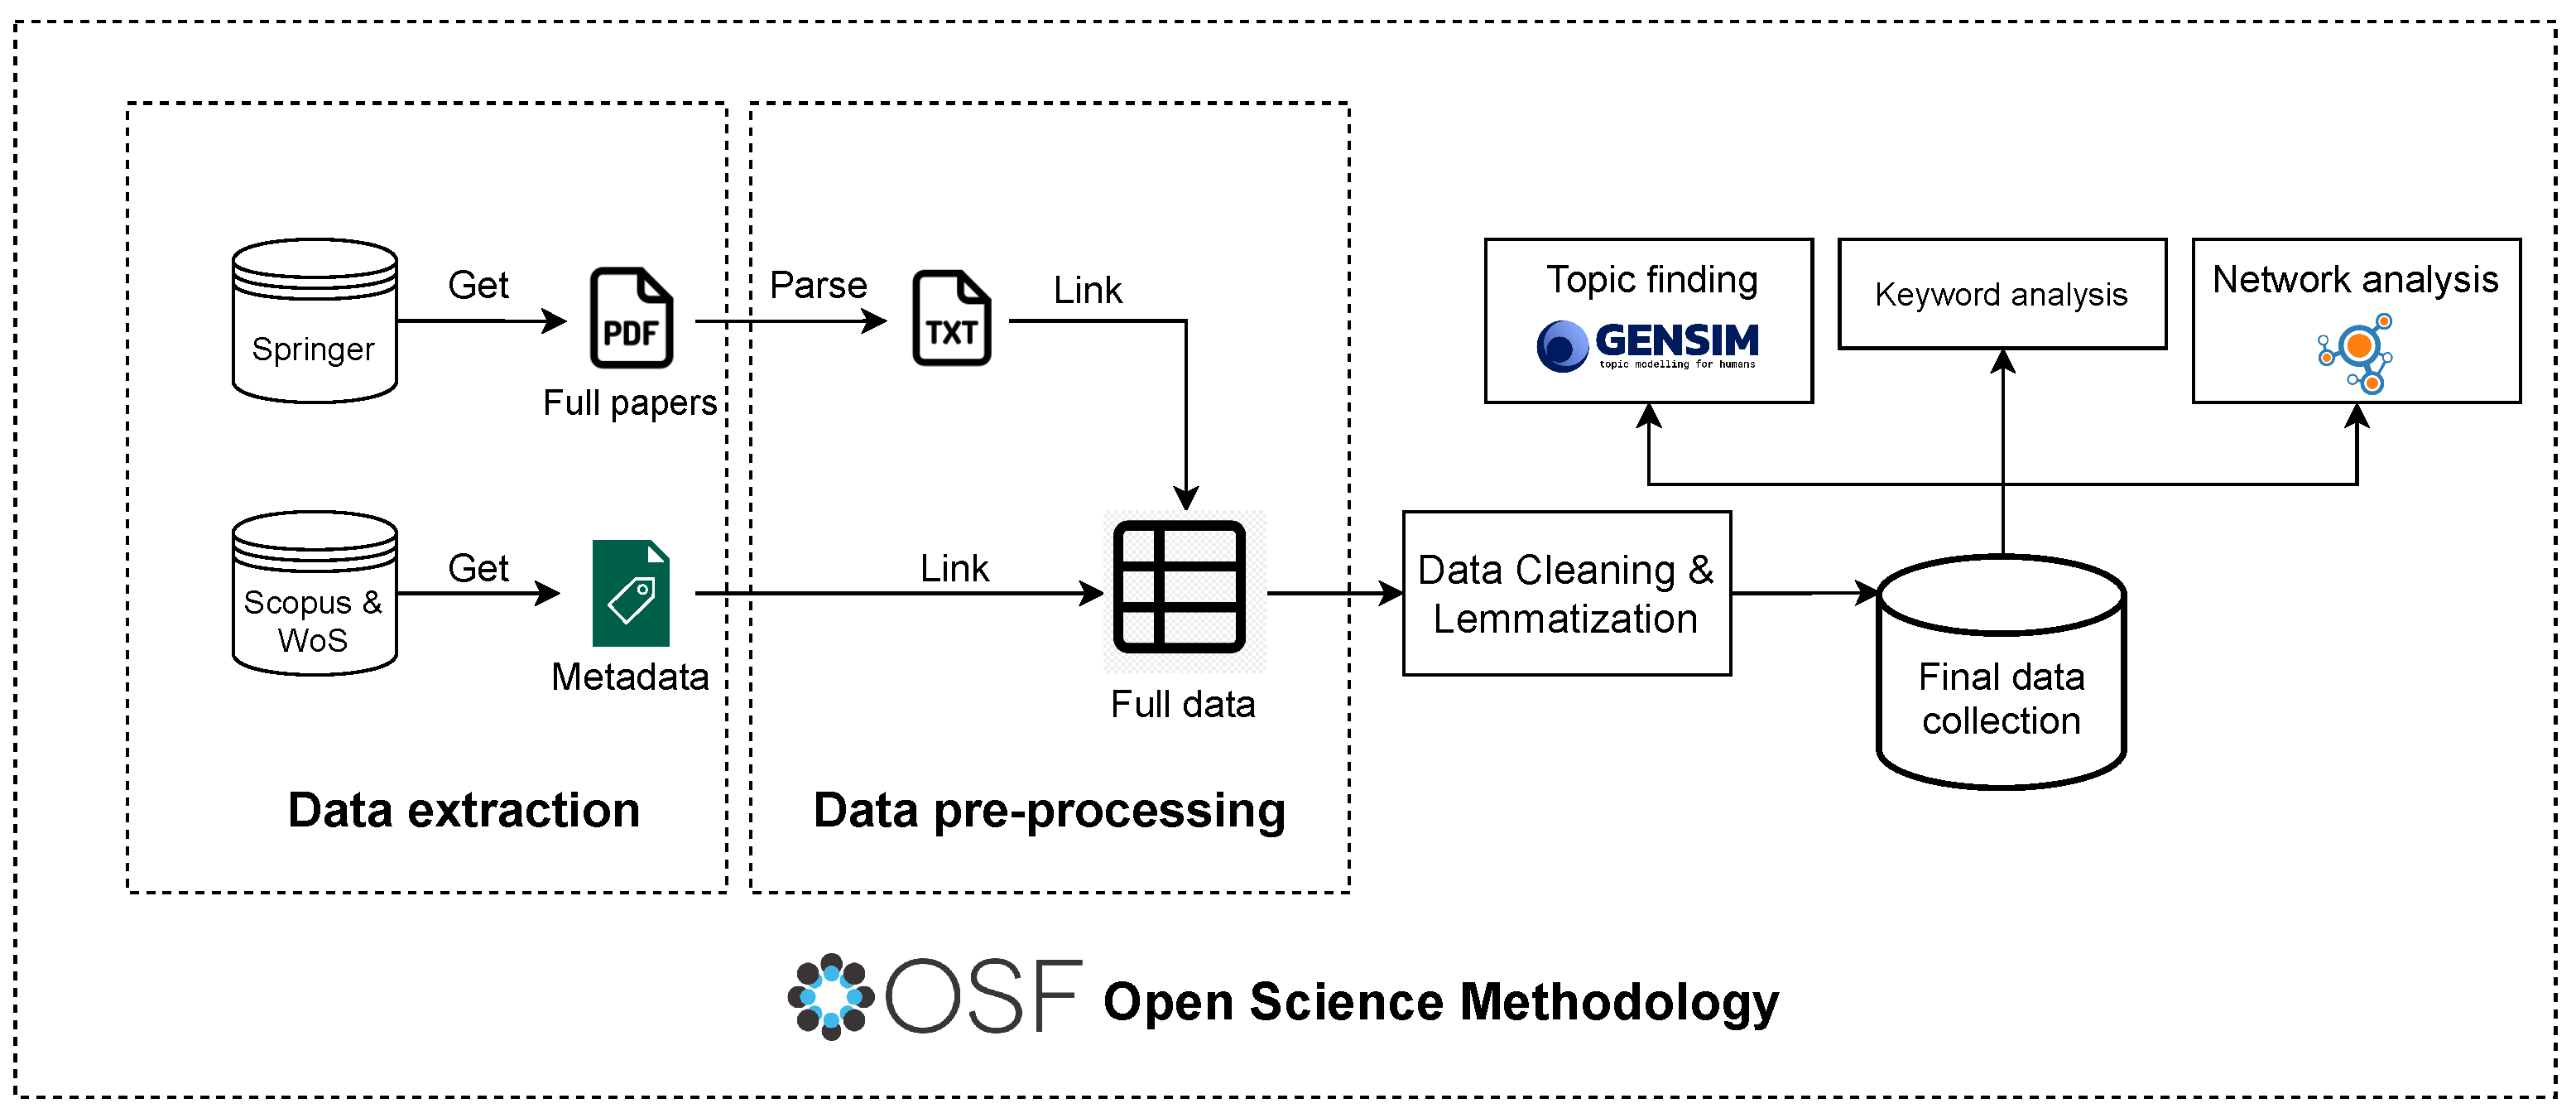
3. Methodology
3.1. Pre-Registration of the Project
- We created an Open Science Framework (OSF) project [36].
- We pre-registered the research questions and methodology of the project.
3.2. Data Extraction
- Scopus [39] offers an extensive abstract and citation database combined with enriched data and linked scholarly content spanning various fields. Across the globe, Scopus is widely used by over 5000 academic, government, and corporate institutions, and plays a key role in supporting the research intelligence portfolio.
- Web of Science [40] is a valuable compilation of citation indexes that highlights the connections between scholarly research articles from prominent journals, books, and proceedings in different fields such as sciences, social sciences, and arts and humanities. It also serves as the basis for the journal impact metrics presented in Journal Citation Reports and the institutional performance metrics provided by InCites.
3.3. Data Pre-Processing
- Search. We explored five different libraries: slate, pdfMiner, pdfPlumber, pyPdf, and PdfToText.
- Parsing evaluation. We assessed each library’s ability to successfully parse the PDF files.
- Manual text review. We manually compared some TXT files with their corresponding raw PDF files to evaluate the quality of parsing.
3.4. Data Cleaning and Lemmatization
- The string is tokenized, breaking it into individual tokens (words).
- A Part-Of-Speech (POS) tagger assigns a POS tag (such as adverb, noun, adjective) to each word.
- The lemmatizer is called with the token and its corresponding POS tag to obtain the word’s base form.
3.5. Final Data Collection Description
3.6. NLP Analysis
- measure employs a sliding window, a one-set segmentation of top words, and an indirect confirmation measure that employs normalized pointwise mutual information (NPMI) and cosine similarity.
- The measure is rooted in document co-occurrence counts, a one-preceding segmentation, and a logarithmic conditional probability as a confirmation measure.
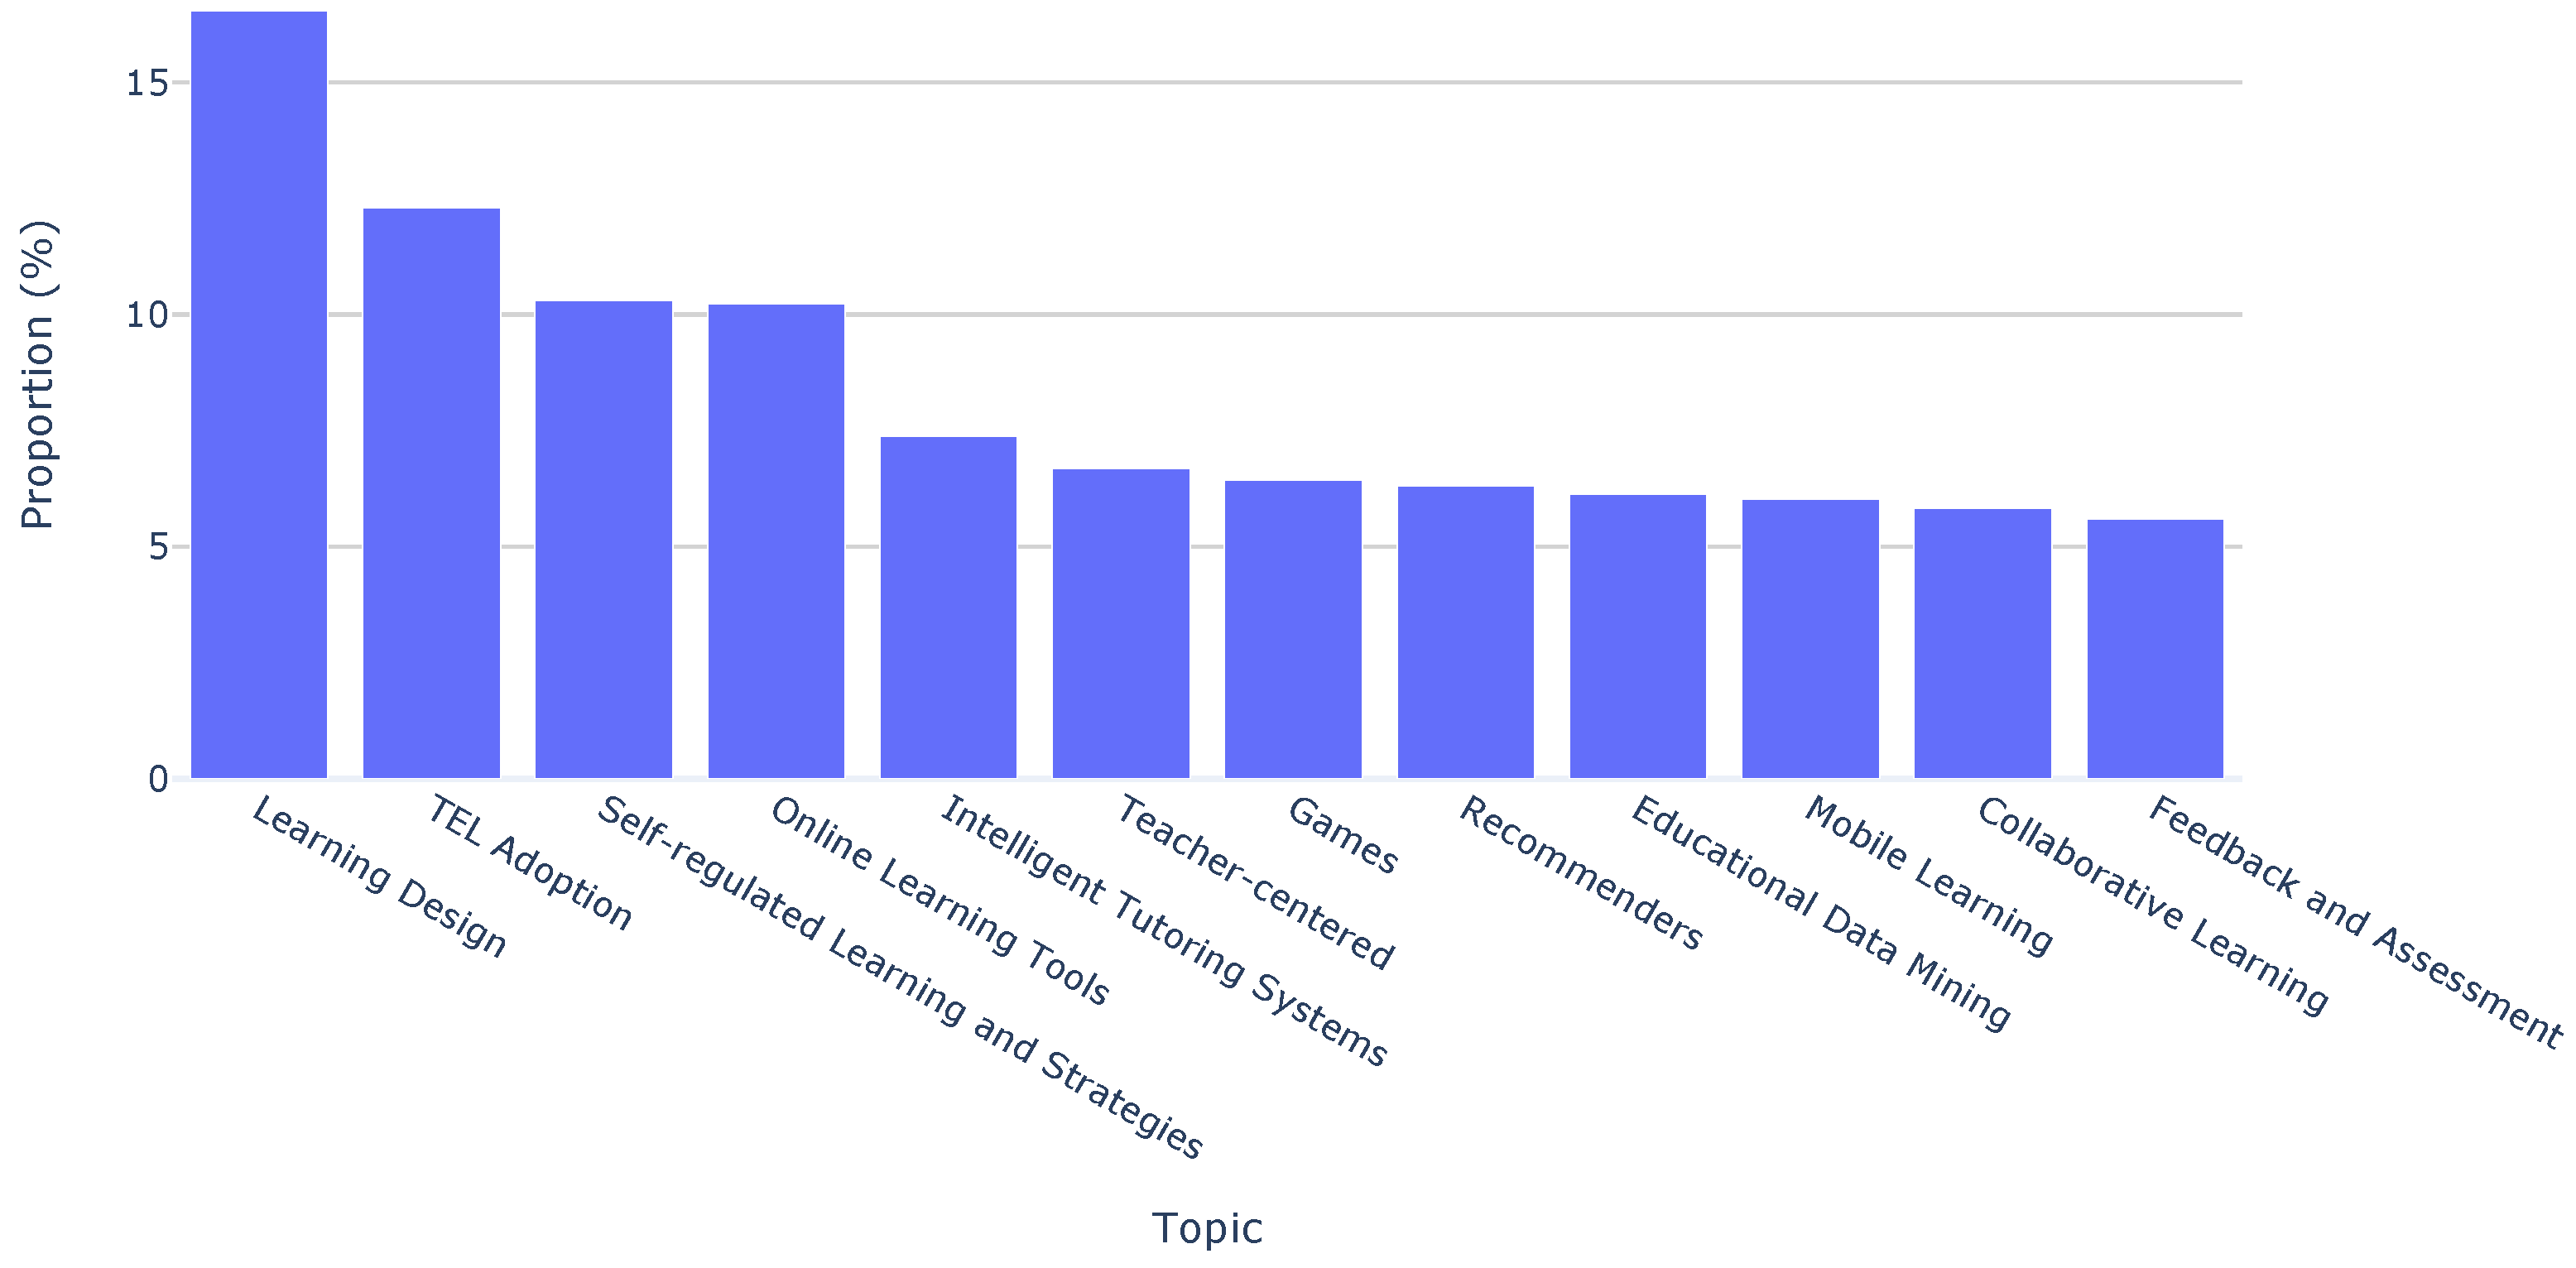
- We generated multiple models to determine the optimal number of topics, relying on the previously mentioned coherence measures. After analysis, 12 topics were identified as optimal, achieving a score of 0.364 and a score of 0.573.
- We conducted initial manual topic labeling based on the first five words of each topic.
- Ten random papers from each topic were reviewed to refine topic delimitation.
- We assigned the final labels to each topic.
3.7. Network Analysis
- A co-authorship network. This network is an undirected graph that describes collaboration between authors within a collection of documents. Each node within the graph represents an author from the collection, while edges connect authors who have collaboratively worked on one or more papers. Co-authorship is commonly regarded as an indicator of research collaboration, bringing together diverse talents to enhance scientific credibility [45]. In our work, we used the metadata from each paper to build the complete network.
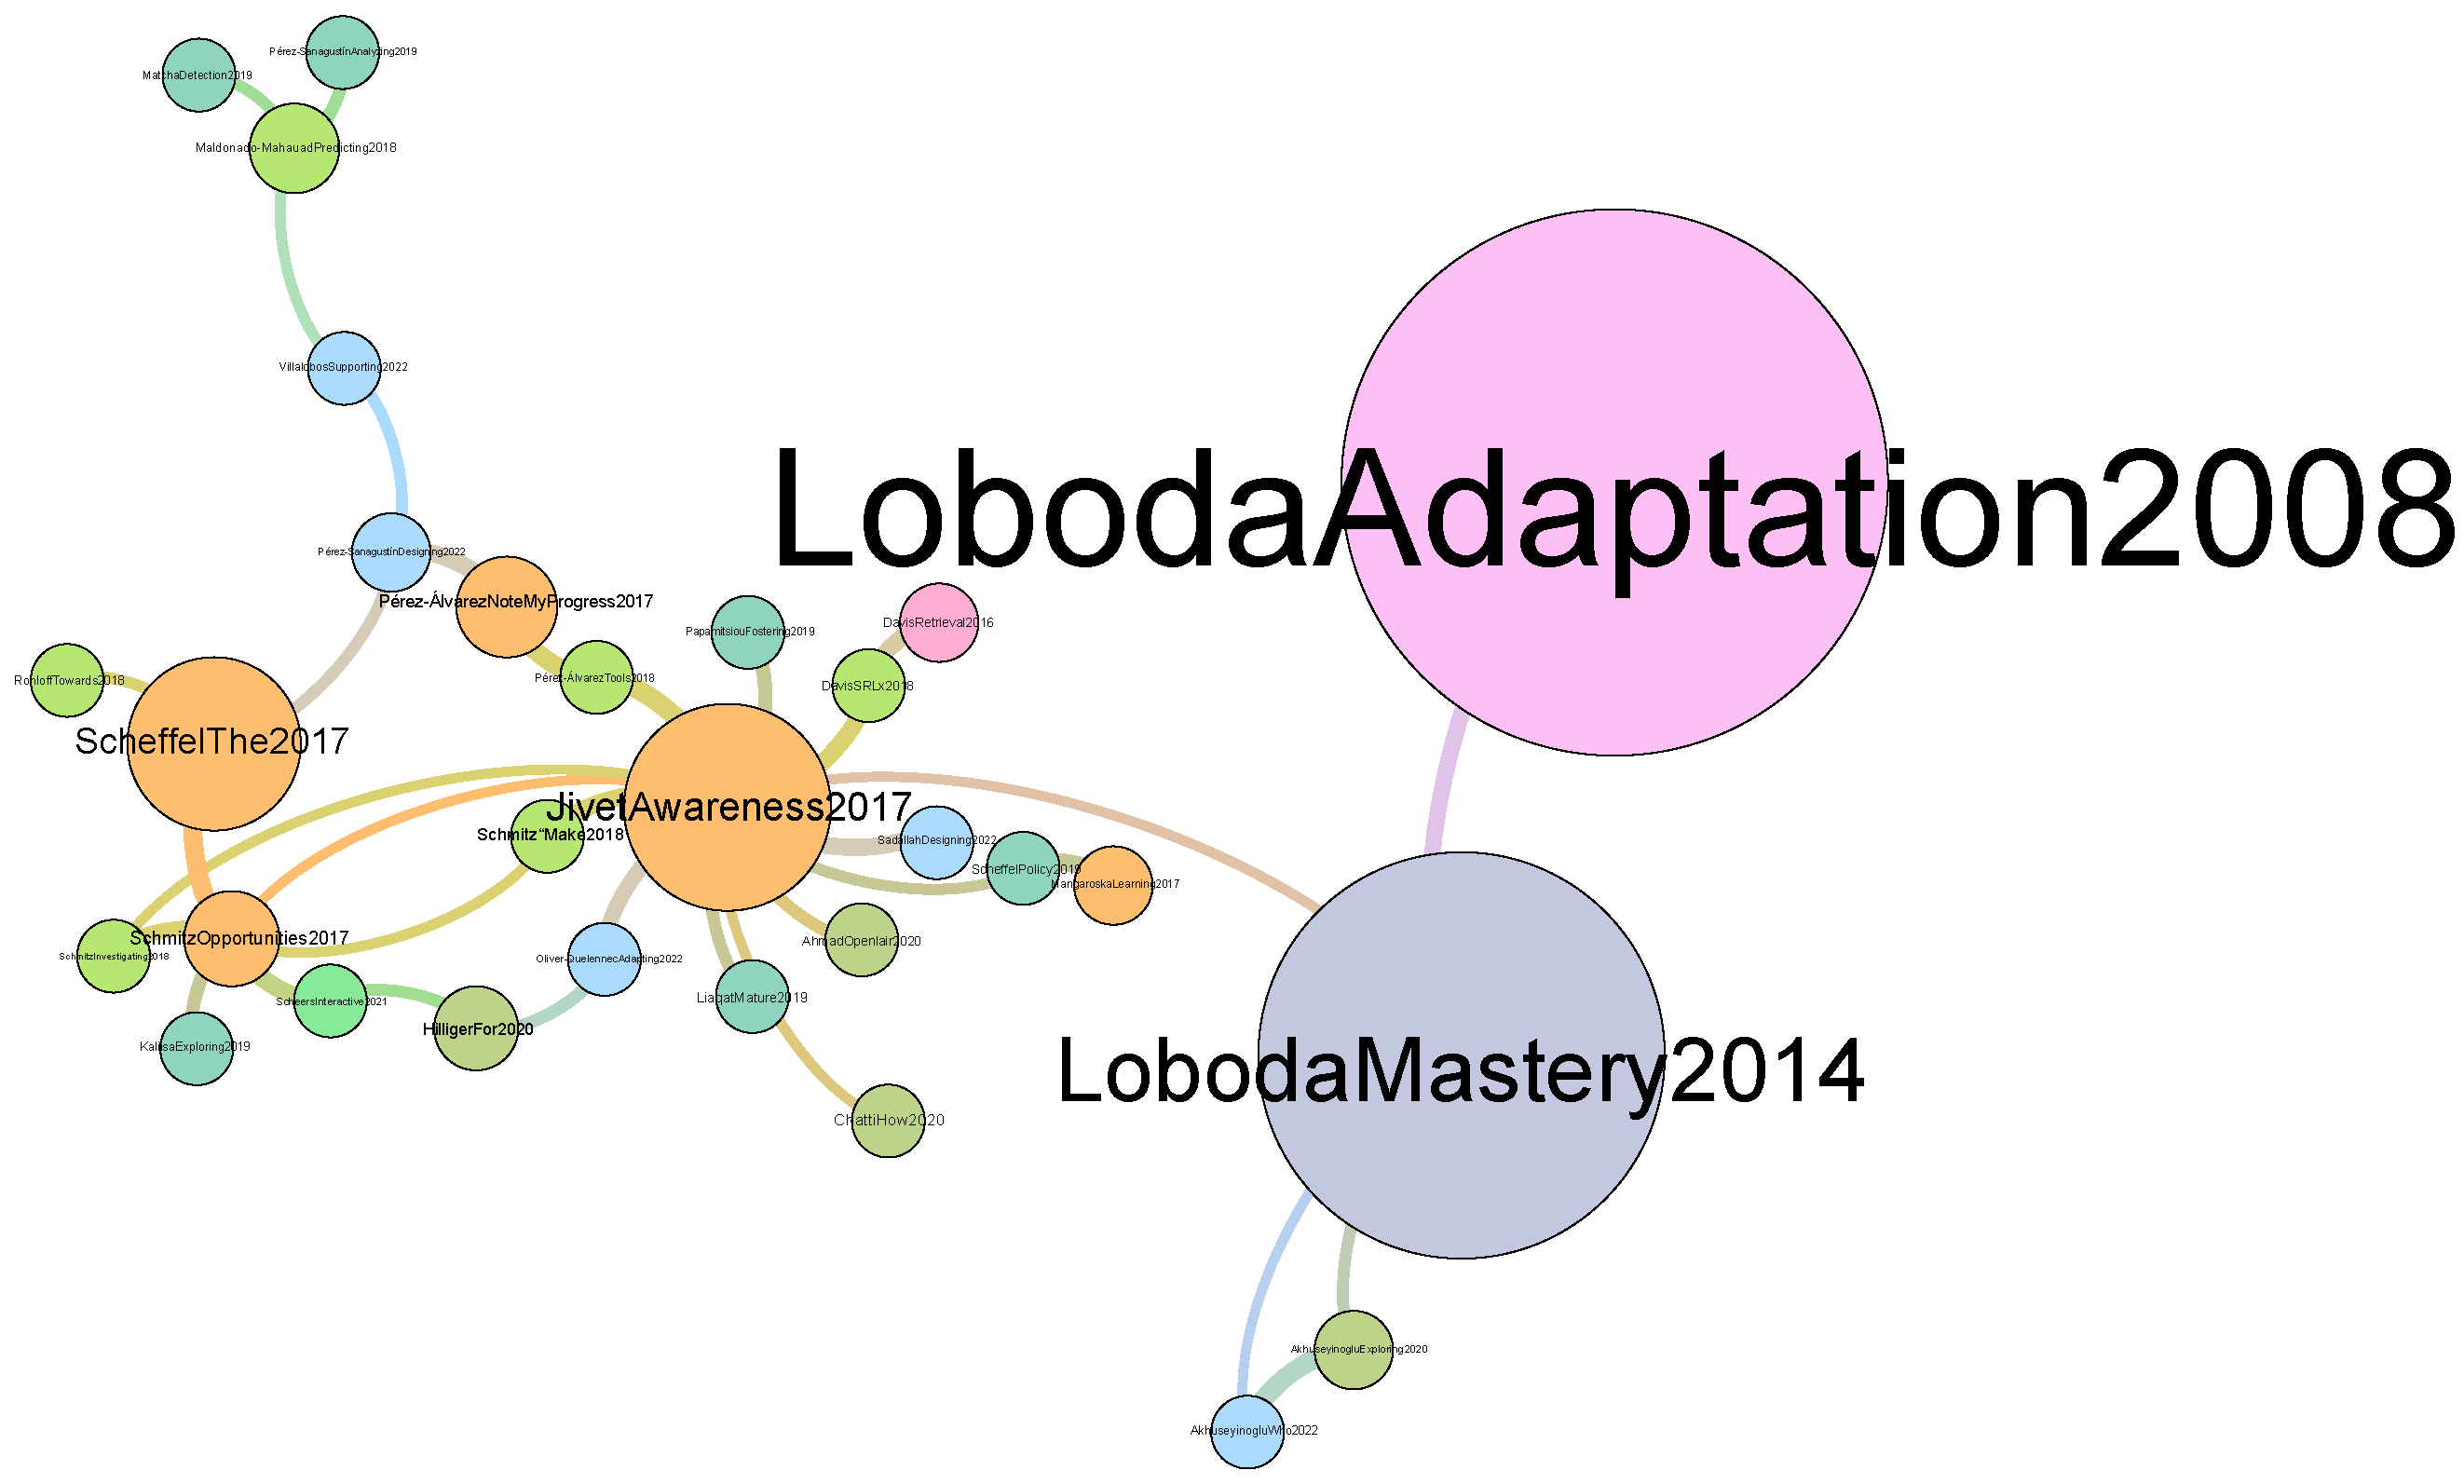
- A citation network. This network constitutes a directed graph that captures citations among documents within the collection. Nodes correspond to documents in the collection, and edges are directed from citing documents to the documents they cite. Since citations of others papers are hand-picked by the authors as being related to their research, the citations can be considered to judge relatedness. Usually, direct references or citations are more likely between papers with temporal separation, rather than those published closely in time [46]. In our research, we leveraged the references extracted from papers’ full texts to identify and represent citations. To uniquely identify each paper in the graph, we created an identifier comprising the first author’s name, the initial word of the paper title, and the year of publication (e.g., for a paper authored by “Berns A.”, and published in 2013 with the title “Using a 3D online game to assess students’ foreign language acquisition and communicative competence”, the identifier would be “BernsUsing2013”).
3.8. Open Data and Analyses
4. Results
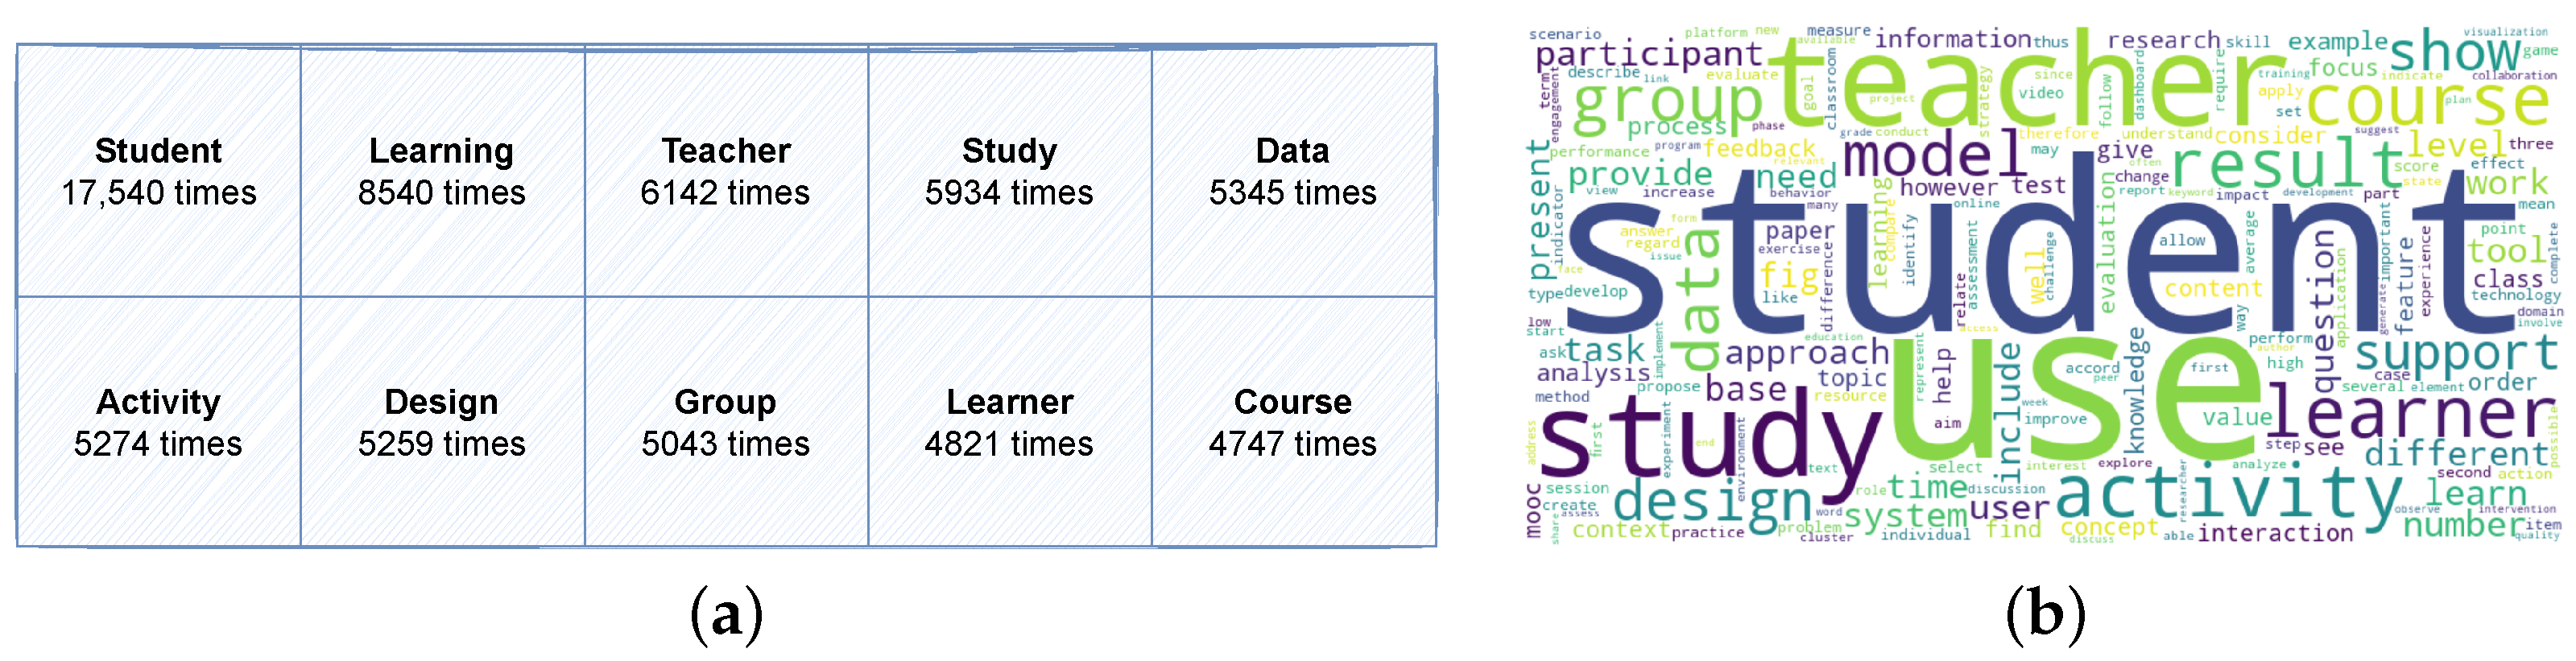
4.1. RQ1: Main Topics of EC-TEL Based on Keywords and Topic Modeling
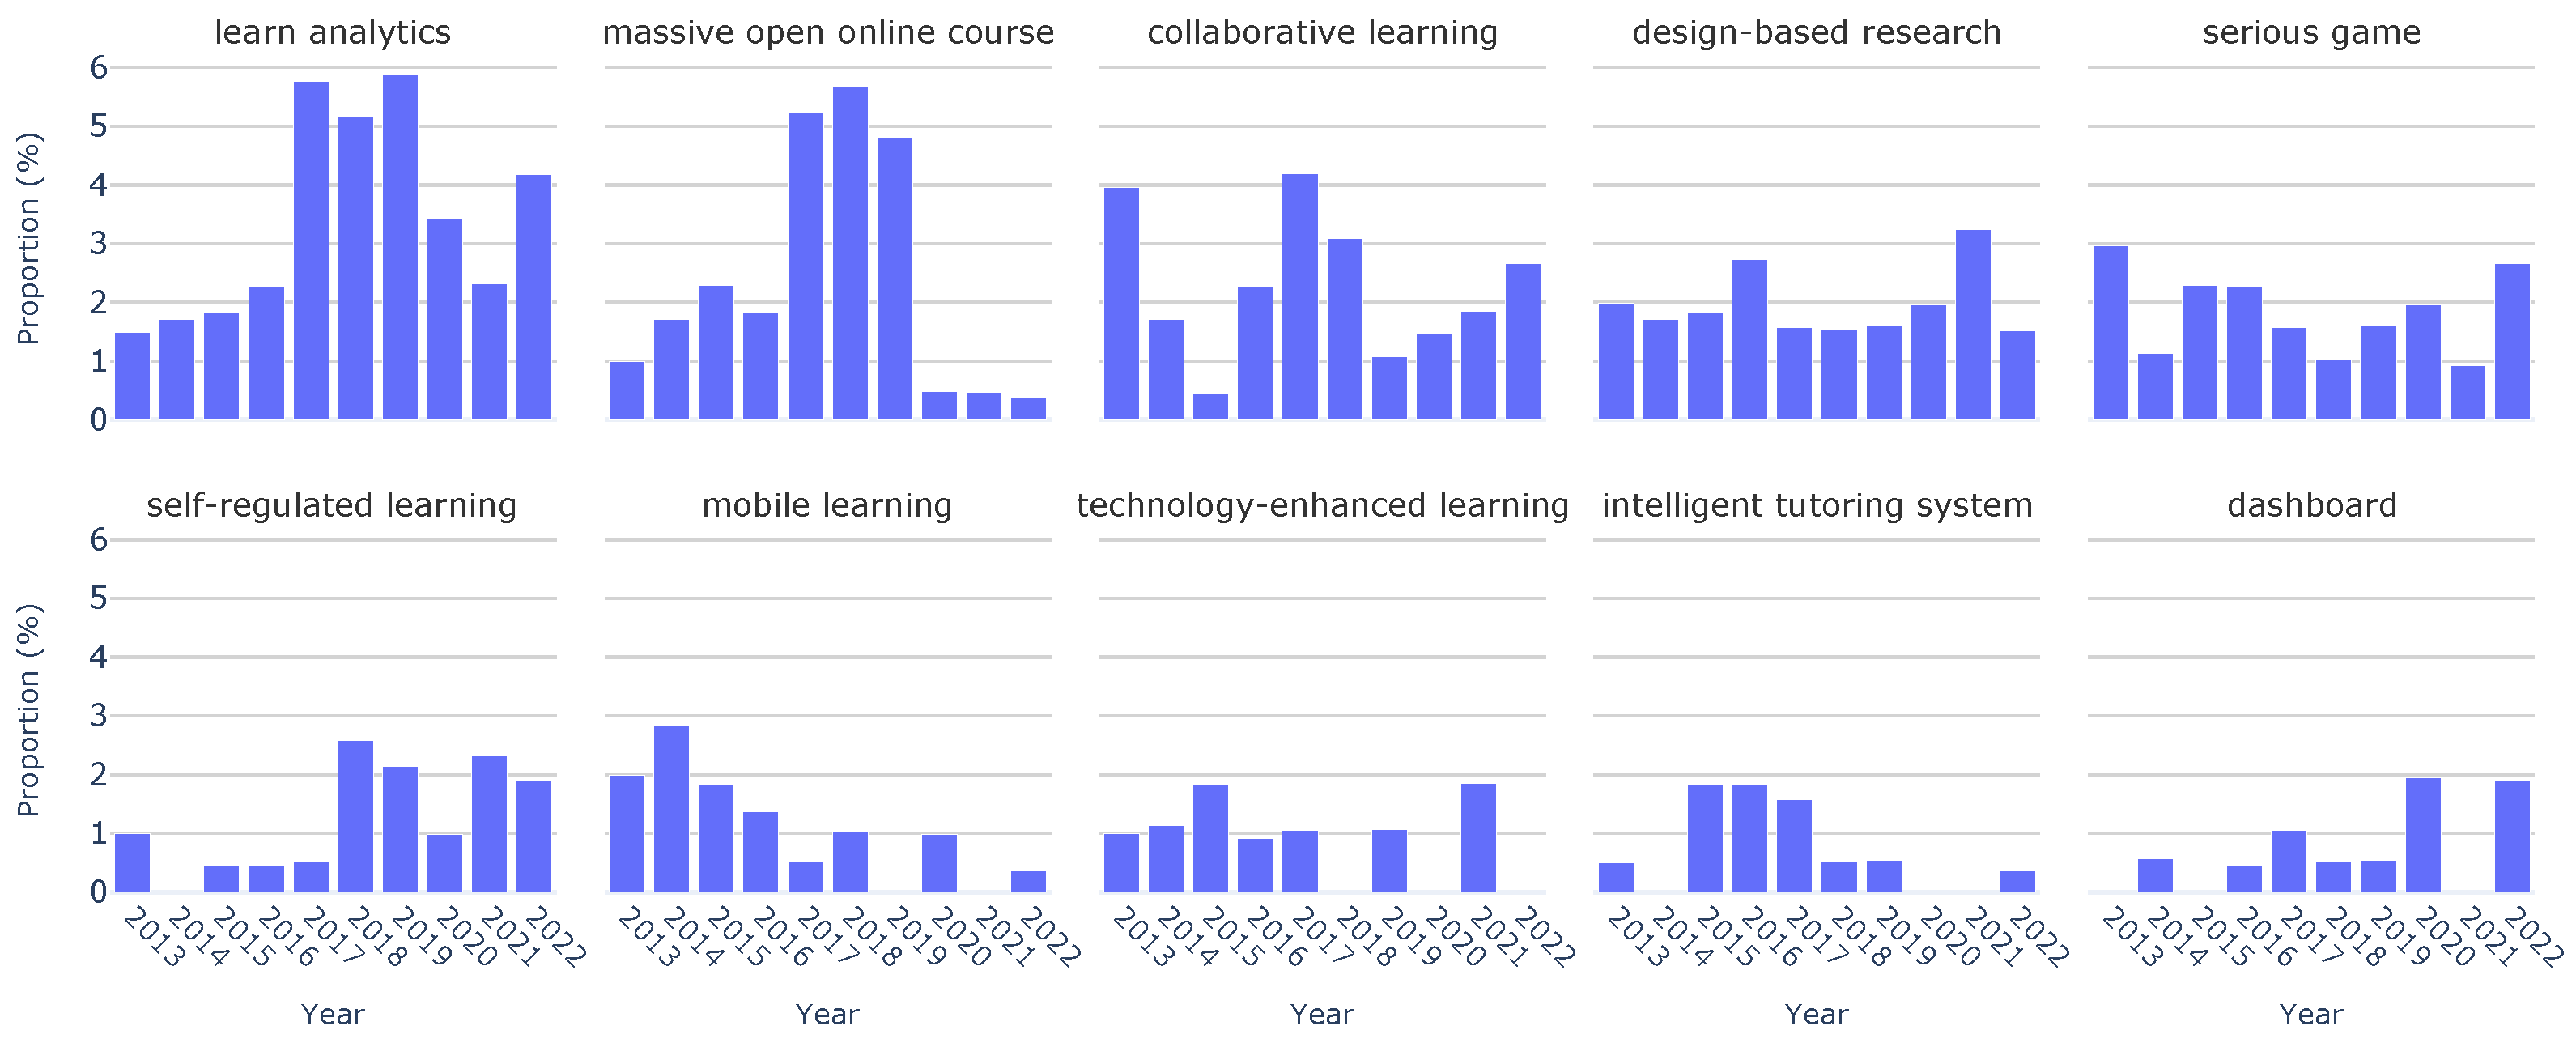
4.2. RQ2: Evolution of Topics across the Previous Ten Years
4.3. RQ3: Interaction between Papers and Authors
5. Discussion
6. Conclusions and Future Work
Author Contributions
Funding
Institutional Review Board Statement
Informed Consent Statement
Data Availability Statement
Conflicts of Interest
References
- Kirkwood, A.; Price, L. Technology-enhanced learning and teaching in higher education: What is ‘enhanced’and how do we know? A critical literature review. Learn. Media Technol. 2014, 39, 6–36. [Google Scholar] [CrossRef]
- Fabry, D.L.; Higgs, J.R. Barriers to the effective use of technology in education: Current status. J. Educ. Comput. Res. 1997, 17, 385–395. [Google Scholar] [CrossRef]
- Noble, H.; Smith, J. Reviewing the Literature: Choosing a Review Design. Evid. Based Nurs. 2018, 21, 39–41. [Google Scholar] [CrossRef] [PubMed]
- Rickinson, M.; May, H. A Comparative Study of Methodological Approaches to Reviewing Literature; The Higher Education Academy: New York, NY, USA, 2009; Volume 23, p. 2017. [Google Scholar]
- Kovačević, A.; Konjović, Z.; Milosavljević, B.; Nenadic, G. Mining methodologies from NLP publications: A case study in automatic terminology recognition. Comput. Speech Lang. 2012, 26, 105–126. [Google Scholar] [CrossRef]
- Liddy, E.D. Natural language processing. In Encyclopedia of Library and Information Science; CRC Press: Boca Raton, FL, USA, 2001. [Google Scholar]
- Pritchard, A. Statistical bibliography or bibliometrics. J. Doc. 1969, 25, 348–349. [Google Scholar]
- Kanna, S.; von Rosenberg, W.; Goverdovsky, V.; Constantinides, A.G.; Mandic, D.P. Bringing wearable sensors into the classroom: A participatory approach [SP education]. IEEE Signal Process. Mag. 2018, 35, 110–130. [Google Scholar] [CrossRef]
- Cowling, M.A.; Crawford, J.; Vallis, C.; Middleton, R.; Sim, K.N. The EdTech difference: Digitalisation, digital pedagogy, and technology enhanced learning. J. Univ. Teach. Learn. Pract. 2022, 19, 1–13. [Google Scholar] [CrossRef]
- Rehman, Z.u. Trends and Challenges of Technology-Enhanced Learning in Geotechnical Engineering Education. Sustainability 2023, 15, 7972. [Google Scholar] [CrossRef]
- Ramlowat, D.D.; Pattanayak, B.K. Exploring the internet of things (IoT) in education: A review. In Proceedings of the Information Systems Design and Intelligent Applications: Proceedings of Fifth International Conference INDIA, 2018; Springer: Îles Mascareignes, Mauritius, 2019; Volume 2, pp. 245–255. [Google Scholar]
- Burchfield, R.W. A Supplement to the Oxford English Dictionary; Oxford (United Kingdon) Clarendon Press: Oxford, UK, 1972. [Google Scholar]
- Broadus, R.N. Toward a definition of “bibliometrics”. Scientometrics 1987, 12, 373–379. [Google Scholar] [CrossRef]
- Diodato, V.P.; Gellatly, P. Dictionary of Bibliometrics; Routledge: London, UK, 2013. [Google Scholar]
- Gao, Y.; Ge, L.; Shi, S.; Sun, Y.; Liu, M.; Wang, B.; Shang, Y.; Wu, J.; Tian, J. Global trends and future prospects of e-waste research: A bibliometric analysis. Environ. Sci. Pollut. Res. 2019, 26, 17809–17820. [Google Scholar] [CrossRef]
- Lv, P.H.; Wang, G.F.; Wan, Y.; Liu, J.; Liu, Q.; Ma, F.C. Bibliometric trend analysis on global graphene research. Scientometrics 2011, 88, 399–419. [Google Scholar] [CrossRef]
- Miau, S.; Yang, J.M. Bibliometrics-based evaluation of the Blockchain research trend: 2008–March 2017. Technol. Anal. Strateg. Manag. 2018, 30, 1029–1045. [Google Scholar] [CrossRef]
- Chowdhury, G.G. Natural language processing. Annu. Rev. Inf. Sci. Technol. 2003, 37, 51–89. [Google Scholar] [CrossRef]
- Buitelaar, P.; Bordea, G.; Coughlan, B. Hot topics and schisms in NLP: Community and trend analysis with saffron on ACL and LREC proceedings. In Proceedings of the 9th Edition of Language Resources and Evaluation Conference (LREC2014), Reykjavik, Iceland, 26–31 May 2014. [Google Scholar]
- Syed, S.; Spruit, M. Full-text or abstract? examining topic coherence scores using latent dirichlet allocation. In Proceedings of the 2017 IEEE International Conference on Data Science and Advanced Analytics (DSAA), Tokyo, Japan, 19–21 October 2017; pp. 165–174. [Google Scholar]
- Abu-Jbara, A.; Ezra, J.; Radev, D. Purpose and polarity of citation: Towards nlp-based bibliometrics. In Proceedings of the 2013 Conference of the North American Chapter of the Association for Computational Linguistics: Human Language Technologies, Atlanta, GA, USA, 9–14 June 2013; pp. 596–606. [Google Scholar]
- Chen, X.; Zou, D.; Xie, H. Fifty years of British Journal of Educational Technology: A topic modeling based bibliometric perspective. Br. J. Educ. Technol. 2020, 51, 692–708. [Google Scholar] [CrossRef]
- Hung, J.l. Trends of e-learning research from 2000 to 2008: Use of text mining and bibliometrics. Br. J. Educ. Technol. 2012, 43, 5–16. [Google Scholar] [CrossRef]
- Reinhardt, W.; Meier, C.; Drachsler, H.; Sloep, P. Analyzing 5 years of EC-TEL proceedings. In Proceedings of the European Conference on Technology Enhanced Learning, Palermo, Italy, 20–23 September 2011; pp. 531–536. [Google Scholar]
- Li, X.; Lei, L. A bibliometric analysis of topic modelling studies (2000–2017). J. Inf. Sci. 2021, 47, 161–175. [Google Scholar] [CrossRef]
- Urru, S.; Sciannameo, V.; Lanera, C.; Salaris, S.; Gregori, D.; Berchialla, P. A topic trend analysis on COVID-19 literature. Digit. Health 2022, 8, 20552076221133696. [Google Scholar] [CrossRef]
- Chen, X.; Zou, D.; Xie, H. A decade of learning analytics: Structural topic modeling based bibliometric analysis. Educ. Inf. Technol. 2022, 27, 10517–10561. [Google Scholar] [CrossRef]
- Gurcan, F.; Ozyurt, O.; Cagitay, N.E. Investigation of emerging trends in the e-learning field using latent dirichlet allocation. Int. Rev. Res. Open Distrib. Learn. 2021, 22, 1–18. [Google Scholar] [CrossRef]
- Pramanik, P.; Jana, R.K. Identifying research trends of machine learning in business: A topic modeling approach. Meas. Bus. Excell. 2022. [Google Scholar] [CrossRef]
- Liu, G.; Nzige, J.H.; Li, K. Trending topics and themes in offsite construction (OSC) research: The application of topic modelling. Constr. Innov. 2019, 19, 343–366. [Google Scholar] [CrossRef]
- Scott, J. Social network analysis. Sociology 1988, 22, 109–127. [Google Scholar] [CrossRef]
- Otte, E.; Rousseau, R. Social network analysis: A powerful strategy, also for the information sciences. J. Inf. Sci. 2002, 28, 441–453. [Google Scholar] [CrossRef]
- Stefaner, M.; Dalla Vecchia, E.; Condotta, M.; Wolpers, M.; Specht, M.; Apelt, S.; Duval, E. MACE–enriching architectural learning objects for experience multiplication. In Proceedings of the European Conference on Technology Enhanced Learning, Crete, Greece, 17–20 September 2007; pp. 322–336. [Google Scholar]
- Atanassova, I.; Bertin, M.; Mayr, P. Mining scientific papers: NLP-enhanced bibliometrics. Front. Res. Metrics Anal. 2019, 4, 2. [Google Scholar] [CrossRef]
- Gomez, M.J.; Ruipérez-Valiente, J.A.; Clemente, F.J.G. Bibliometric Analysis of the Last Ten Years of the European Conference on Technology-Enhanced Learning. In Proceedings of the European Conference on Technology Enhanced Learning, Bolzano, Italy, 20–24 September 2021; Springer: New York, NY, USA, 2021; pp. 337–341. [Google Scholar]
- Gomez, M.J. Supplementary Materials: A NLP-Enhanced Bibliometrics Study of the Technology-Enhanced Learning Field, 2023. Available online: https://osf.io/jtnaq/?view_only=3d4974a06fc441e88cc2d7b5fc51a925 (accessed on 20 November 2023).
- EATEL. In Proceedings of the EC-TEL Conference, Bozen-Bolzano, Italy, 20–24 September 2021.
- Responsive and Sustainable Educational Futures. In Proceedings of the 18th European Conference on Technology Enhanced Learning, Aveiro, Portugal, 4–8 September 2021; Springer International Publishing: Cham, Switerland, 2021.
- Elsevier. About Scopus, 2021. Available online: https://www.elsevier.com/products/scopus (accessed on 20 November 2023).
- Science, W.O. Web of Science, 2021. Available online: https://clarivate.com/products/scientific-and-academic-research/research-discovery-and-workflow-solutions/webofscience-platform/ (accessed on 20 November 2023).
- Yao, L.; Mimno, D.; McCallum, A. Efficient methods for topic model inference on streaming document collections. In Proceedings of the 15th ACM SIGKDD International Conference on Knowledge Discovery and Data Mining, Paris, France, 28 June–1 July 2009; pp. 937–946. [Google Scholar]
- O’callaghan, D.; Greene, D.; Carthy, J.; Cunningham, P. An analysis of the coherence of descriptors in topic modeling. Expert Syst. Appl. 2015, 42, 5645–5657. [Google Scholar] [CrossRef]
- Röder, M.; Both, A.; Hinneburg, A. Exploring the space of topic coherence measures. In Proceedings of the Eighth ACM International Conference on Web Search and Data Mining, Shanghai, China, 2–6 February 2015; pp. 399–408. [Google Scholar]
- Kapadia, S. Evaluate Topic Models: Latent Dirichlet Allocation (LDA). Towards Data Science. 2019. Available online: https://towardsdatascience.com/end-to-end-topic-modeling-in-python-latent-dirichlet-allocation-lda-35ce4ed6b3e0 (accessed on 20 November 2023).
- Kumar, S. Co-authorship networks: A review of the literature. Aslib J. Inf. Manag. 2015, 67, 55–73. [Google Scholar] [CrossRef]
- Lu, W.; Janssen, J.; Milios, E.; Japkowicz, N.; Zhang, Y. Node similarity in the citation graph. Knowl. Inf. Syst. 2007, 11, 105–129. [Google Scholar] [CrossRef]
- Jivet, I.; Scheffel, M.; Drachsler, H.; Specht, M. Awareness is not enough: Pitfalls of learning analytics dashboards in the educational practice. In Proceedings of the European Conference on Technology Enhanced Learning, Tallinn, Estonia, 12–15 September 2017; pp. 82–96. [Google Scholar]
- Schmitz, M.; Van Limbeek, E.; Greller, W.; Sloep, P.; Drachsler, H. Opportunities and challenges in using learning analytics in learning design. In Proceedings of the Data Driven Approaches in Digital Education: 12th European Conference on Technology Enhanced Learning, EC-TEL 2017, Tallinn, Estonia, 12–15 September 2017; Proceedings 12. Springer: Tallinn, Estonia, 2017; pp. 209–223. [Google Scholar]
- Jahnke, I.; Norqvist, L.; Olsson, A. Digital didactical designs of learning expeditions. In Proceedings of the European Conference on Technology Enhanced Learning, Graz, Austria, 16–19 September 2014; pp. 165–178. [Google Scholar]
- Loboda, T.D.; Guerra, J.; Hosseini, R.; Brusilovsky, P. Mastery grids: An open source social educational progress visualization. In Proceedings of the European Conference on Technology Enhanced Learning, Graz, Austria, 16–19 September 2014; pp. 235–248. [Google Scholar]
- Ruiz-Calleja, A.; Prieto, L.P.; Ley, T.; Rodríguez-Triana, M.J.; Dennerlein, S. Learning analytics for professional and workplace learning: A literature review. In Proceedings of the European Conference on Technology Enhanced Learning, Tallinn, Estonia, 12–15 September 2017; Springer: Tallinn, Estonia, 2017; pp. 164–178. [Google Scholar]
- Krichen, M. A Survey on Formal Verification and Validation Techniques for Internet of Things. Appl. Sci. 2023, 13, 8122. [Google Scholar] [CrossRef]
- Hofer-Schmitz, K.; Stojanović, B. Towards formal verification of IoT protocols: A Review. Comput. Netw. 2020, 174, 107233. [Google Scholar] [CrossRef]
- Fischer, J.; Ritchie, E.G.; Hanspach, J. Academia’s obsession with quantity. Trends Ecol. Evol. 2012, 27, 473–474. [Google Scholar] [CrossRef]
- Donaldson, M.R.; Cooke, S.J. Scientific publications: Moving beyond quality and quantity toward influence. BioScience 2014, 64, 12–13. [Google Scholar] [CrossRef]
- Choi, H.S.; Lee, W.S.; Sohn, S.Y. Analyzing research trends in personal information privacy using topic modeling. Comput. Secur. 2017, 67, 244–253. [Google Scholar] [CrossRef]


| Topic | Description | Main Terms |
|---|---|---|
| Learning Design | Papers focusing on the learning design to ensure the quality of instruction and design-based research | Learn, design, activity, tool, process |
| Technology- Enhanced Learning (TEL) Adoption | Papers with the objective of exploring the factors and challenges associated with the integration and utilization of technology in educational settings | Learn, education, barrier, perception, survey |
| Self-regulated Learning and Strategies | Studies where the students monitor their performance and reflect on it, using this reflection to adjust and improve upcoming tasks | Task, error, test, feedback, strategy |
| Online Learning Tools | Research about online learning tools (e.g., online courses, massive open online courses) | Activity, student, video, time, learner |
| Intelligent Tutoring Systems | Includes papers that aim to provide immediate and customized instruction or feedback to learners and customizing those learning experiences | Student, test, tutor, technology, error, skill |
| Teacher-centered | Providing approaches that are centered on teachers, who are actively involved in the learning process | Teacher, student, classroom, activity, lesson |
| Games | Includes papers that aim to use games and gamification to improve learning | Game, child, player, scenario, gamification |
| Recommenders | Papers that use recommender systems applied in education, along with papers aiming to make research accessible (open education) | Resource, tag, user, learn, recommend |
| Educational Data Mining (EDM) | Focused on applying data mining, machine learning and/or statistics techniques to information generated from educational environments | Model, item, performance, measure, training |
| Mobile Learning | Research to improve training and education by incorporating portable devices (e.g., smartphones, tablets) | Application, device, user, experience, learn |
| Collaborative Learning | Research that promotes the use of groups to enhance learning through working together | Group, collaboration, knowledge, member, social |
| Feedback and Assessment | Research that investigates the effectiveness and impact of feedback mechanisms and assessment practices in educational contexts | Feedback, question, argument, assessment, student |
| Method | Topic | General Proportion (RQ1) | Evolution 2013–2022 (RQ2) |
|---|---|---|---|
| Topic finding | Learning Design | 16.5% | ↑ 4.3–11.8% |
| TEL Adoption | 12.3% | ↓ 7.0–5.1% | |
| Self-regulated Learning and Strategies | 10.3% | → 3.6–5.0% | |
| Online Learning Tools | 10.2% | ↑ 1.8–11.8% | |
| Intelligent Tutoring Systems | 7.4% | ↑ 3.0–9.2% | |
| Teacher-centered | 6.7% | → 16.3–13.3% | |
| Games | 6.4% | → 8.2–9.2% | |
| Recommenders | 6.3% | ↓ 6.8–4.6% | |
| EDM | 6.1% | ↓ 9.4–2.7% | |
| Mobile Learning | 6.0% | ↓ 25.3–12.7% | |
| Collaborative Learning | 5.8% | ↑ 5.9–10.7% | |
| Feedback and Assessment | 5.6% | ↓ 8.2–3.8% | |
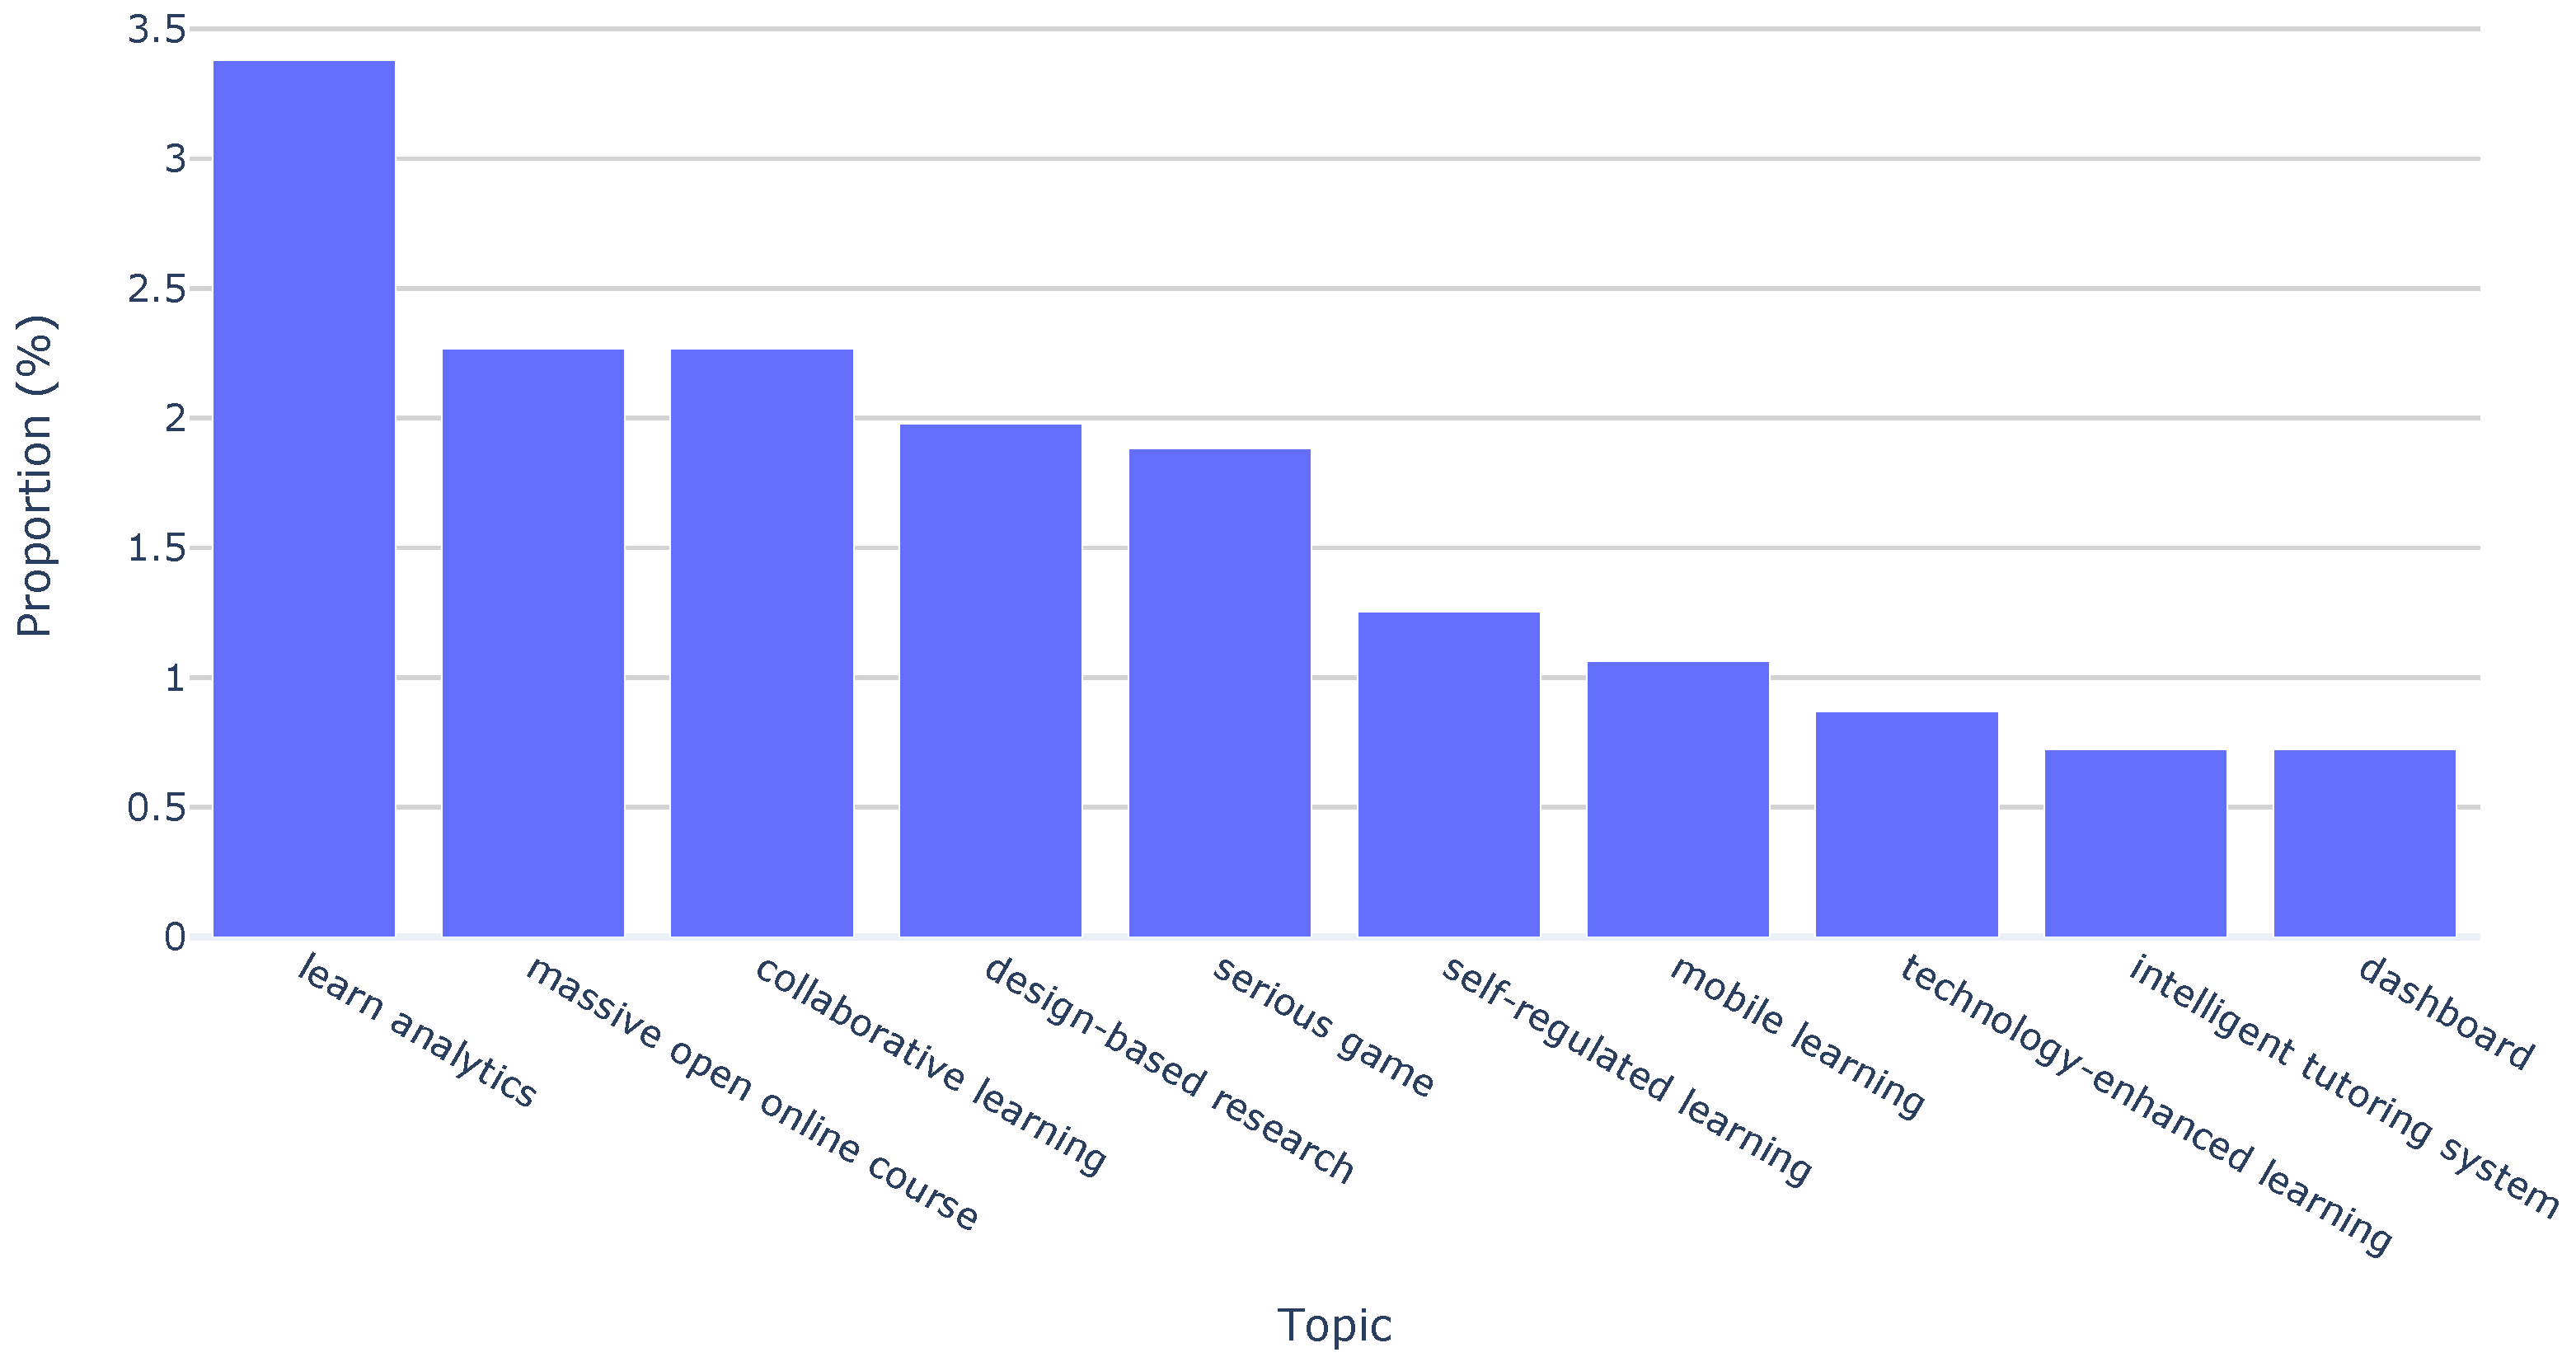
| Keyword analysis | learning analytics | 3.4% | ↑ 1.5–4.2% |
| massive open online course | 2.3% | ↓ 1.0–0.4% | |
| collaborative learning | 2.3% | ↓ 4.0–2.7% | |
| design-based research | 2.0% | → 2.0–1.5% | |
| serious game | 1.9% | → 3.0–2.7% | |
| self-regulated learning | 1.3% | ↑ 1.0–1.9% | |
| mobile learning | 1.1% | ↓ 2.0–0.4% | |
| technology-enhanced learning | 0.9% | ↓ 1.0–0.0% | |
| intelligent tutoring system | 0.7% | → 0.5–0.4% | |
| dashboard | 0.7% | ↑ 0.0–1.9% |
| Method | Finding | Results (RQ3) |
|---|---|---|
| Co-authorship network | Number of authors | 1331 (948 unique) |
| Central authors | “Scheffel M.”, “Sharma K.”, “Dennerlein S.”, “Ley T.”, and “Guest W.” | |
| Most frequent authors | “Specht M.”, “Drachsler H.”, “Kalz M.”, “Pérez-Sanagustín M.”, and “Sharma K.”, | |
| Citation network | References between papers | 143 |
| Central papers | [47,48,49,51] |
Disclaimer/Publisher’s Note: The statements, opinions and data contained in all publications are solely those of the individual author(s) and contributor(s) and not of MDPI and/or the editor(s). MDPI and/or the editor(s) disclaim responsibility for any injury to people or property resulting from any ideas, methods, instructions or products referred to in the content. |
© 2023 by the authors. Licensee MDPI, Basel, Switzerland. This article is an open access article distributed under the terms and conditions of the Creative Commons Attribution (CC BY) license (https://creativecommons.org/licenses/by/4.0/).
Share and Cite
Gomez, M.J.; Ruipérez-Valiente, J.A.; García Clemente, F.J. Exploring Technology- and Sensor-Driven Trends in Education: A Natural-Language-Processing-Enhanced Bibliometrics Study. Sensors 2023, 23, 9303. https://doi.org/10.3390/s23239303
Gomez MJ, Ruipérez-Valiente JA, García Clemente FJ. Exploring Technology- and Sensor-Driven Trends in Education: A Natural-Language-Processing-Enhanced Bibliometrics Study. Sensors. 2023; 23(23):9303. https://doi.org/10.3390/s23239303
Chicago/Turabian StyleGomez, Manuel J., José A. Ruipérez-Valiente, and Félix J. García Clemente. 2023. "Exploring Technology- and Sensor-Driven Trends in Education: A Natural-Language-Processing-Enhanced Bibliometrics Study" Sensors 23, no. 23: 9303. https://doi.org/10.3390/s23239303
APA StyleGomez, M. J., Ruipérez-Valiente, J. A., & García Clemente, F. J. (2023). Exploring Technology- and Sensor-Driven Trends in Education: A Natural-Language-Processing-Enhanced Bibliometrics Study. Sensors, 23(23), 9303. https://doi.org/10.3390/s23239303