Article

Preparation and Gas-Sensing Properties of Two-Dimensional Molybdenum Disulfide/One-Dimensional Copper Phthalocyanine Heterojunction

Key Laboratory of New Energy and Materials Research, Xinjiang Institute of Engineering, Urumqi 830023, China
*
Author to whom correspondence should be addressed.
These authors contributed equally to this work.
Sensors 2023, 23(23), 9321; https://doi.org/10.3390/s23239321
Submission received: 24 October 2023 / Revised: 19 November 2023 / Accepted: 20 November 2023 / Published: 22 November 2023
(This article belongs to the Section Chemical Sensors)

Abstract

:
Although 2D MoS2 alone shows excellent gas-sensing performance, it is prone to stacking when used as the sensitive layer, resulting in insufficient contact with the target gas and lower sensitivity. To solve this, a 2D-MoS2/1D-CuPc heterojunction was prepared with different weight ratios of MoS2 nanosheets to CuPc micro-nanowires, and its room-temperature gas-sensing properties were studied. The response of the 2D-MoS2/1D-CuPc heterojunction to a target gas was related to the weight ratio of MoS2 to CuPc. When the weight ratio of MoS2 to CuPc was 20:7 (7-CM), the gas sensitivity of MoS2/CuPc composites was the best. Compared with the pure MoS2 sensor, the responses of 7-CM to 1000 ppm formaldehyde (CH2O), acetone (C3H6O), ethanol (C2H6O), and 98% RH increased by 122.7, 734.6, 1639.8, and 440.5, respectively. The response of the heterojunction toward C2H6O was twice that of C3H6O and 13 times that of CH2O. In addition, the response time of all sensors was less than 60 s, and the recovery time was less than 10 s. These results provide an experimental reference for the development of high-performance MoS2-based gas sensors.

1. Introduction

Due to industrial development, large amounts of toxic and harmful gases pollute the environment and endanger people’s health [1,2]. Thus, there is a need to control and monitor air pollution in real time. Common harmful gases include volatile organic compounds (VOCs), nitrogen oxides, sulfur oxides, and carbon oxides, which can damage a person’s sense of smell, vision, mucosa, lung function, liver function, and central nervous system [3,4]. These gases are produced mainly during industrial production, transportation, and household activities [5].
Numerous strategies have been developed for air-quality monitoring in recent years, including semiconductor gas sensors, which are detection devices with high sensitivity, a fast response speed, and low cost [6,7]. Commonly used sensing materials to construct semiconductor gas sensors include zero-dimensional [8], one-dimensional [9], two-dimensional [10], and three-dimensional [11] materials. Layered molybdenum disulfide (MoS2) is a two-dimensional (2D) material that has been widely studied because of its photoelectric properties, stable chemical properties, and simple preparation process [12,13,14]. Two-dimensional MoS2 has an ultra-high specific surface area, abundant surface defects, a tunable band gap (~1.8 eV), and excellent carrier mobility. These properties give it a high affinity for most harmful gas molecules [15,16], making it highly suitable for gas detection and gas sensor research. In the past decade, many studies have reported the gas-sensing properties of 2D MoS2 and its composites. Hai et al. obtained monolayer and multilayered MoS2 films via a mechanical peeling method using transparent tape. They prepared field-effect transistors (FETs) for NO gas detection for the first time by using photolithography. When 2–4 layers of MoS2 were used, the FET was stable and showed a LOD of 0.8 ppm for NO, but the stability when using a MoS2 monolayer was poor [17]. Li et al. prepared MoS2 via a hydrothermal method and obtained resistive devices. At an operating temperature of 100 °C, the device showed good selectivity for carbon monoxide (CO) and hydrogen sulfide (H2S), showing good repeatability and linearity [18]. Li Wenbo et al. prepared three different morphologies of molybdenum disulfide sensors for ammonia detection via a hydrothermal method. The results showed that the nanoflower-like MoS2 sensor had a better response to ammonia and showed excellent repeatability, stability, and selectivity, with a response of 7.41% and a recovery time of 874 s toward NH3 at 10 ppm. The response to NH3 was 4.5 times as high as methanol and isopropanol and 8 times higher than acetone. Under the same conditions, the response values of the other two morphologies were 2.01% and 5.11%, respectively [19].
The above studies showed that although 2D-MoS2 showed excellent gas-sensing performance when used alone, it was prone to stacking when used as the sensitive layer. This resulted in insufficient contact with the target gas, which reduced the sensitivity of the sensor and prolonged the response-recovery time of the sensor. Building on the research on 2D-MoS2 sensors, researchers have found that constructing heterojunctions is a feasible research method for solving the above shortcomings. The heterostructure formed of composite materials and MoS2 nanosheets can inhibit the interlayer agglomeration of MoS2 sheets, thereby providing sufficient active sites for the adsorption of gas molecules. This can help improve the gas detection performance of MoS2-based sensors [20]. Bu Xin et al. prepared MoS2/Cd2SnO4 composites via water heating–calcination and studied the effect of MoS2 doping on the gas-sensing properties. The experimental results showed that when the mass ratio between MoS2 and Cd2SnO4 was 2.5%, the response of the gas-sensing element prepared using MoS2/Cd2SnO4 composites to 100 ppm formaldehyde gas was 40 at 170 °C. This was 29 times that of pure MoS2 for the same concentration of formaldehyde gas [21]. Zhang et al. prepared CeO2/MoS2 composites via a hydrothermal method, which exhibited a better room-temperature NO2-sensing response and a 69.1% higher sensitivity to 5 ppm NO2 than pure MoS2. In total, 85% of the resistance was recovered within 900 s, and the sensor showed a fast response, long-term stability, and selectivity [22]. Hemalatha et al. designed an NH3 sensor consisting of two-dimensional transition-metal dichalcogenide (mainly WS2 and MoS2), and polyaniline (PANI). The test results showed that the WS2/PANI and MoS2/PANI composites had higher sensitivity to NH3 than individual MoS2 and PANI. The response and recovery times of the composite films were 10/16 s and 14/16 s, respectively [23].
The above results show that 2D MoS2 composites have better gas-sensing performance than monolayer MoS2 but still have the following problems when used in traditional composite thin-film sensors: (1) the thin-film material is highly ordered, which is not conducive to gas diffusion in the membrane and affects the response speed of the sensor; (2) they have a low flexibility, which affects the practical applications of the sensor. Most research has used inorganic nanomaterials and 2D-MoS2 composites, but there has been no research on organic one-dimensional (1D) materials and 2D-MoS2 composites. Copper phthalocyanine (CuPc) is a typical organic semiconductor material [24] with good thermal and chemical stability. Its structure can be easily modified, and it has been widely used to design and research thin-film gas sensors with good selectivity and low operating temperatures. Moreover, one-dimensional CuPc exhibits better gas-sensing properties than bulk CuPc. Therefore, a heterojunction strategy was used to improve the performance of gas sensors by combining the advantages of 2-D MoS2 and 1-D CuPc.
Here, we report a gas sensor based on a heterojunction between synthetic CuPc micro-nanowires and exfoliated MoS2 nanosheets. One-dimensional CuPc was prepared via physical vapor deposition (PVD), and MoS2/CuPc composites with different mass ratios were prepared via a magnetic reflux stirring method. The performance of 2D-MoS2/1D-CuPc heterojunction gas sensing was studied using XRD, SEM, XPS, FTIR, and Raman spectroscopy.

2. Materials and Methods

2.1. Materials

Molybdenum disulfide (MoS2) and copper phthalocyanine (CuPc) were purchased from Sigma Aldrich. Potassium sulfate (K2SO4) was purchased from Xuzhuangzi, Dongli District, Tianjin. Absolute ethanol (C2H6O), acetonitrile (CH3CN), N-methyl pyrrolidone (C5H9NO), formaldehyde (CH2O), and acetone (C3H6O) were purchased from Tianjin Zhiyuan Chemical Reagent Co., Ltd. (Tianjin, China). The above chemicals were of analytical grade (AR) and did not require further purification.

2.2. Synthesis of MoS2 Nanosheets

MoS2 nanosheets were prepared via grinding-assisted liquid phase stripping [25]. First, 100 mg of MoS2 raw material was weighed and ground in an agate mortar for 2 h, and an appropriate amount of NMP was added during the grinding process. After that, the samples were placed in a vacuum oven and dried for 12 h after grinding. After drying, the samples were dispersed in 45 vol% absolute ethanol for 1 h, and then, the dispersion was centrifuged for 20 min (1500 r/min) to obtain MoS2 nanosheets. Finally, the sample was dried in air for later use (Figure S1a).

2.3. Preparation of 1D-CuPc

CuPc (copper phthalocyanine) micro-nanowires (1D-CuPc) were prepared via physical vapor deposition (PVD) [26], as shown in Figure S1b. Purified CuPc (1 mg) was placed in a beaker, 20 mL ethanol was added, and the beaker was sealed and sonicated for 1 h to form a CuPc suspension in ethanol. The suspension was left to stand for 24 h at room temperature to obtain a supernatant for later use. A silicon wafer substrate was clamped with forceps and immersed in the supernatant so that the nanoparticles in the suspension were transferred to the substrate. The nanoparticles acted as crystal nuclei on the substrate surface to induce the growth of 1D-CuPc. Materials with a length of more than 100 μm were obtained at a growth time of 4 h and a growth temperature of 400 °C, and using N2 as the carrier gas at a flow rate of 20 mL/min.

2.4. Preparation of 2D-MoS2/1D-CuPc Heterojunction

Composites were prepared via heating with magnetic reflux stirring. The prepared MoS2 nanosheets (20 mg) were dispersed in 20 mL of absolute ethanol. Then, CuPc micro-nanowires were added, subjected to magnetic reflux stirring, and heated for 2 h. Finally, 2D-MoS2/1D-CuPc heterojunction samples were obtained via centrifugation at 8000 r/min. A series of 2D-MoS2/1D-CuPc heterojunction samples at different mass ratios were synthesized using the same method. The preparation of the 2D-MoS2/1D-CuPc heterojunction is shown in Figure S1. The weight ratios of MoS2 to CuPc were controlled at 20:3, 20:5, 20:7, 20:10, and 20:20, and the samples were named 3-CM, 5-CM, 7-CM, 10-CM, and 20-CM, respectively.

2.5. Material Characterization

A Raman spectrometer (inVia Renishaw) was used to analyze phases and the vibrational characteristics of the sample. The structures of all the samples were measured via X-ray diffraction (XRD) (Bruker D8 Advance, with Cu-Kα radiation), and Fourier-transform infrared (FTIR) spectrometry (Bruker VERTEX 70, Saarbrücken, Germany). Field emission scanning electron microscopy (JSM-7610F Plus) was used to study the topography of the sample. The surface chemistry of the sample was measured via X-ray photoelectron spectroscopy (XPS K-Alpha+, Thermo Fisher Scientific, Waltham, MA, USA).

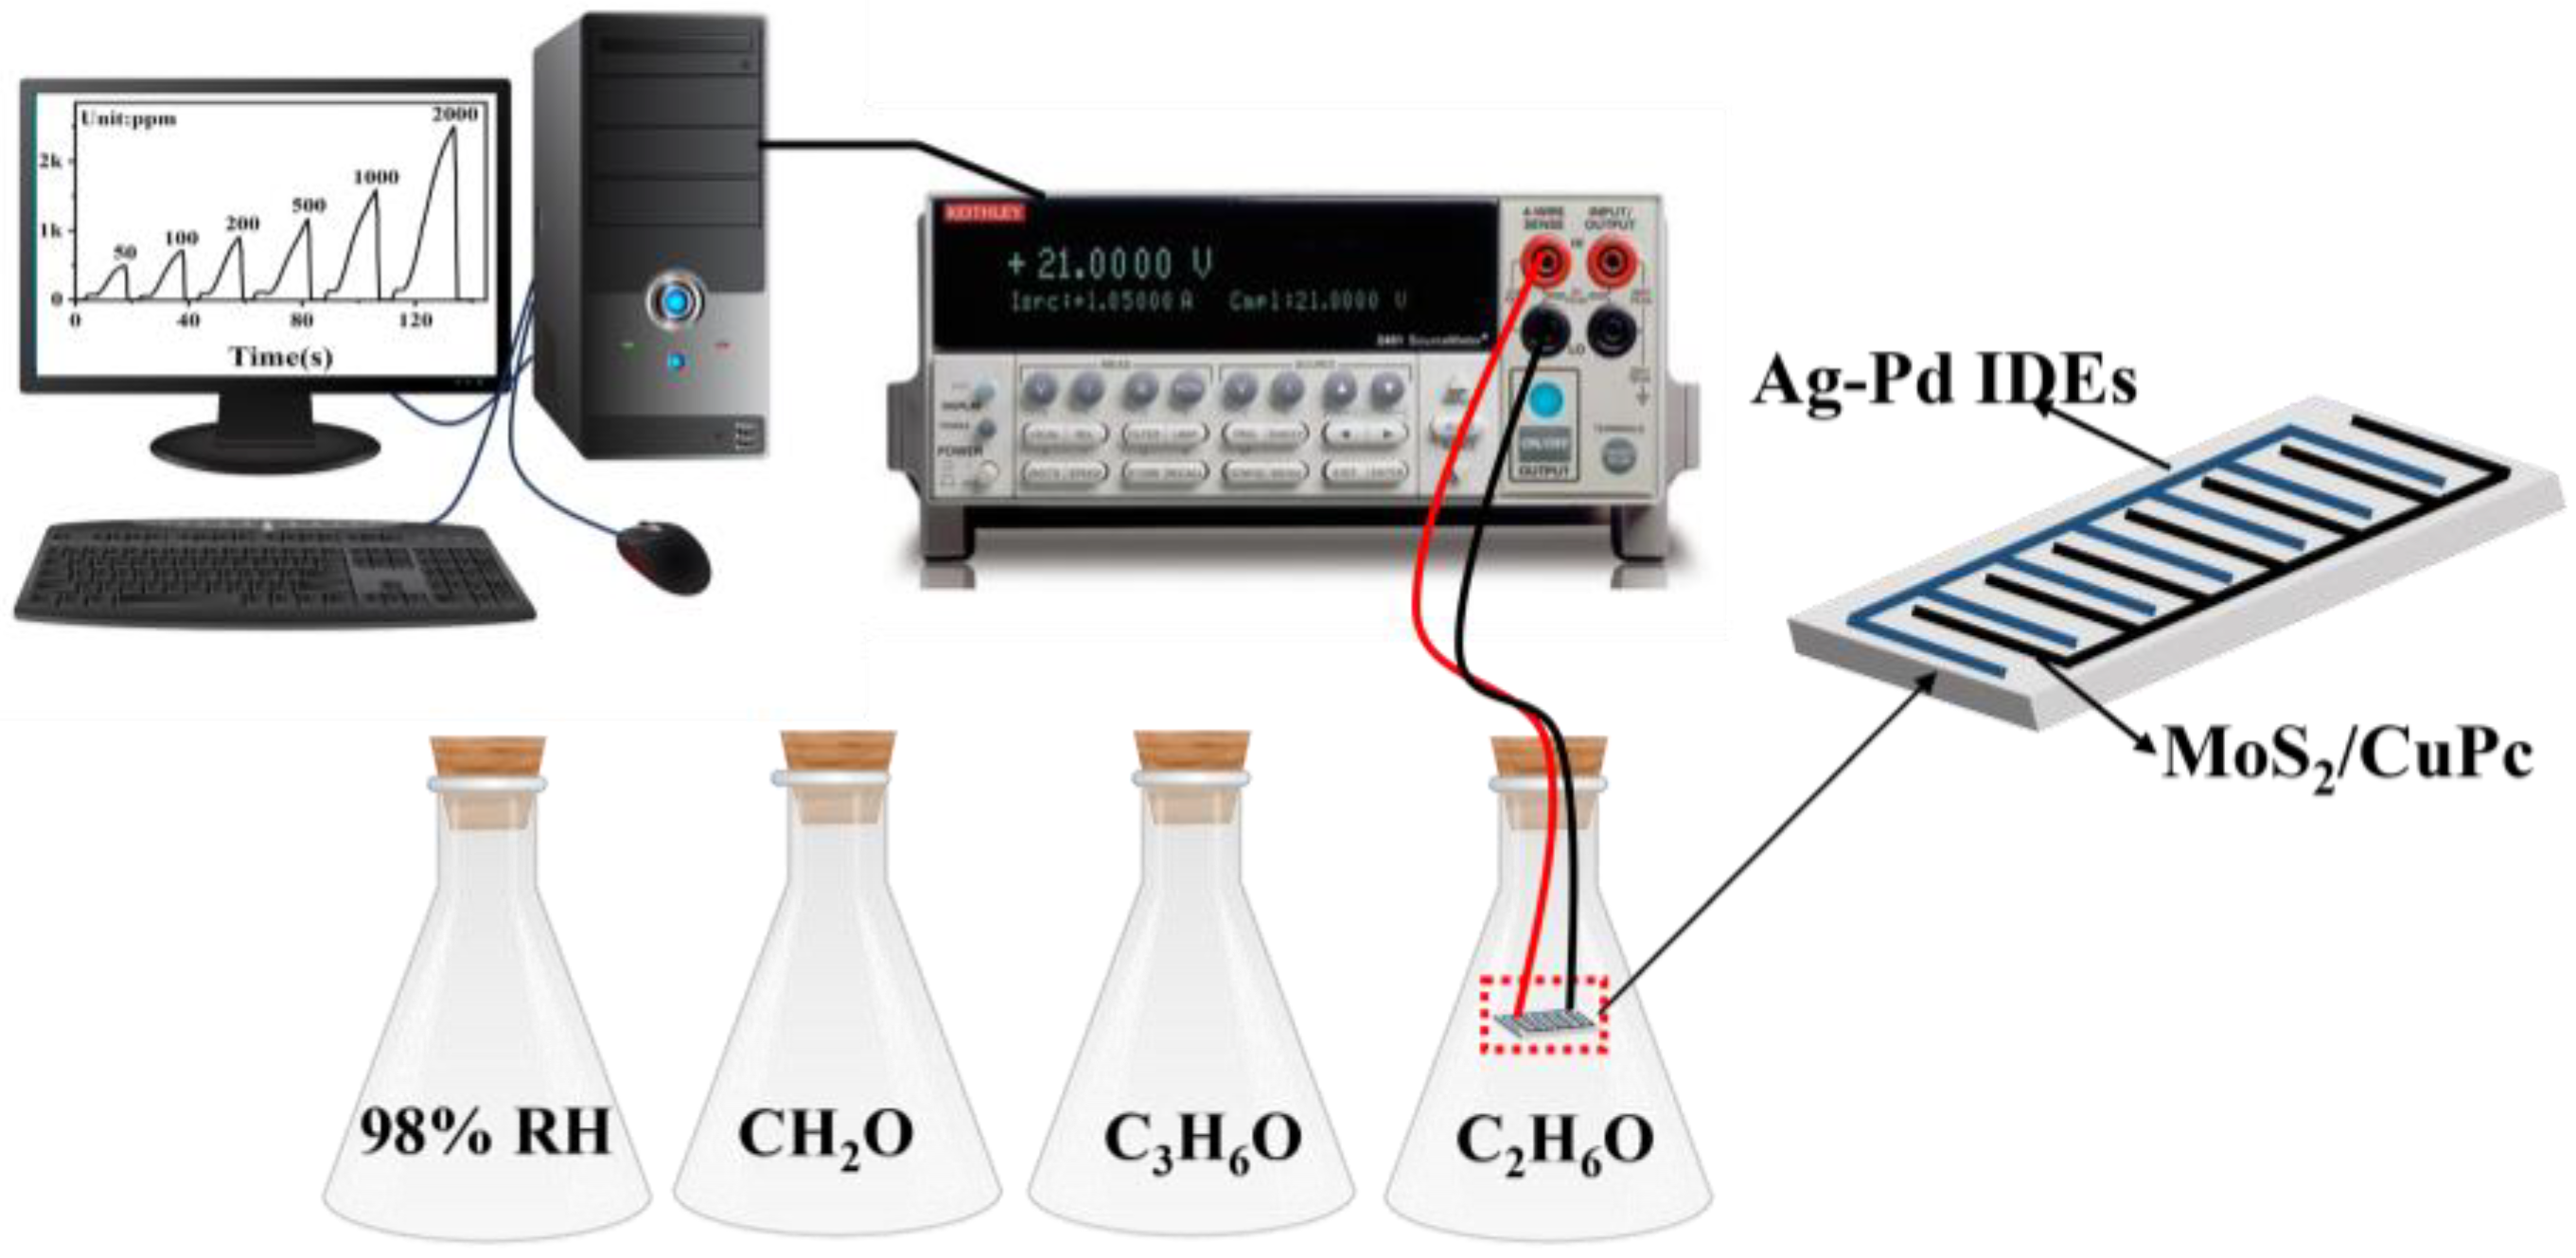
2.6. Gas-Sensing Performance Evaluation

First, 2D-MoS2/1D-CuPc heterojunctions with different mass ratios (20:3, 20:5, 20:7, 20:10, and 20:20) were dispersed in absolute ethanol at a concentration of 10 mg/mL. Then, the dispersions were used to carry out uniform coating (2 μL MoS2/CuPc composite dispersion) to fabricate a 2D-MoS2/1D-CuPc-based sensing chip (13 mm × 7 mm, 0.5 mm thick) with Ag-Pd interdigital electrodes (IDEs). The minimum width and spacing of the electrodes was 0.2 mm). Finally, the interdigital electrode was dried at 60 °C and aged for 48 h at a voltage of 2 V to obtain a sensing chip with good stability (Figure S1c).
In this experiment, ethanol (C2H6O), acetone (C3H6O), and formaldehyde (CH2O) solutions were used to obtain 1000 ppm C2H6O, C3H6O, and CH2O gas environments, respectively. In addition, a 98%-relative-humidity environment was obtained using KNO3-saturated saline solution. The gas-sensing performance of the sensors was evaluated using a constant voltage of 2 V at 24 °C using a Keithley 2636b workstation (Keithley Instruments, Cleveland, OH, USA). The gas sensors were placed in different types of gas environments for testing, as shown in Figure 1. When the current stabilized, we switched to the next gas environment to continue the test. The current response of the gas performance test was defined as Response = (IGIR)/IR, where IR and IG are the current of the sensor in the reference gas and the target gas, respectively. The response time was defined as the time period during which the sensor current reached 90% of the response value after exposure to the target gas, and the recovery time was defined as the time period when the sensor current become 10% of the response value after the target gas was removed.

3. Results and Discussion

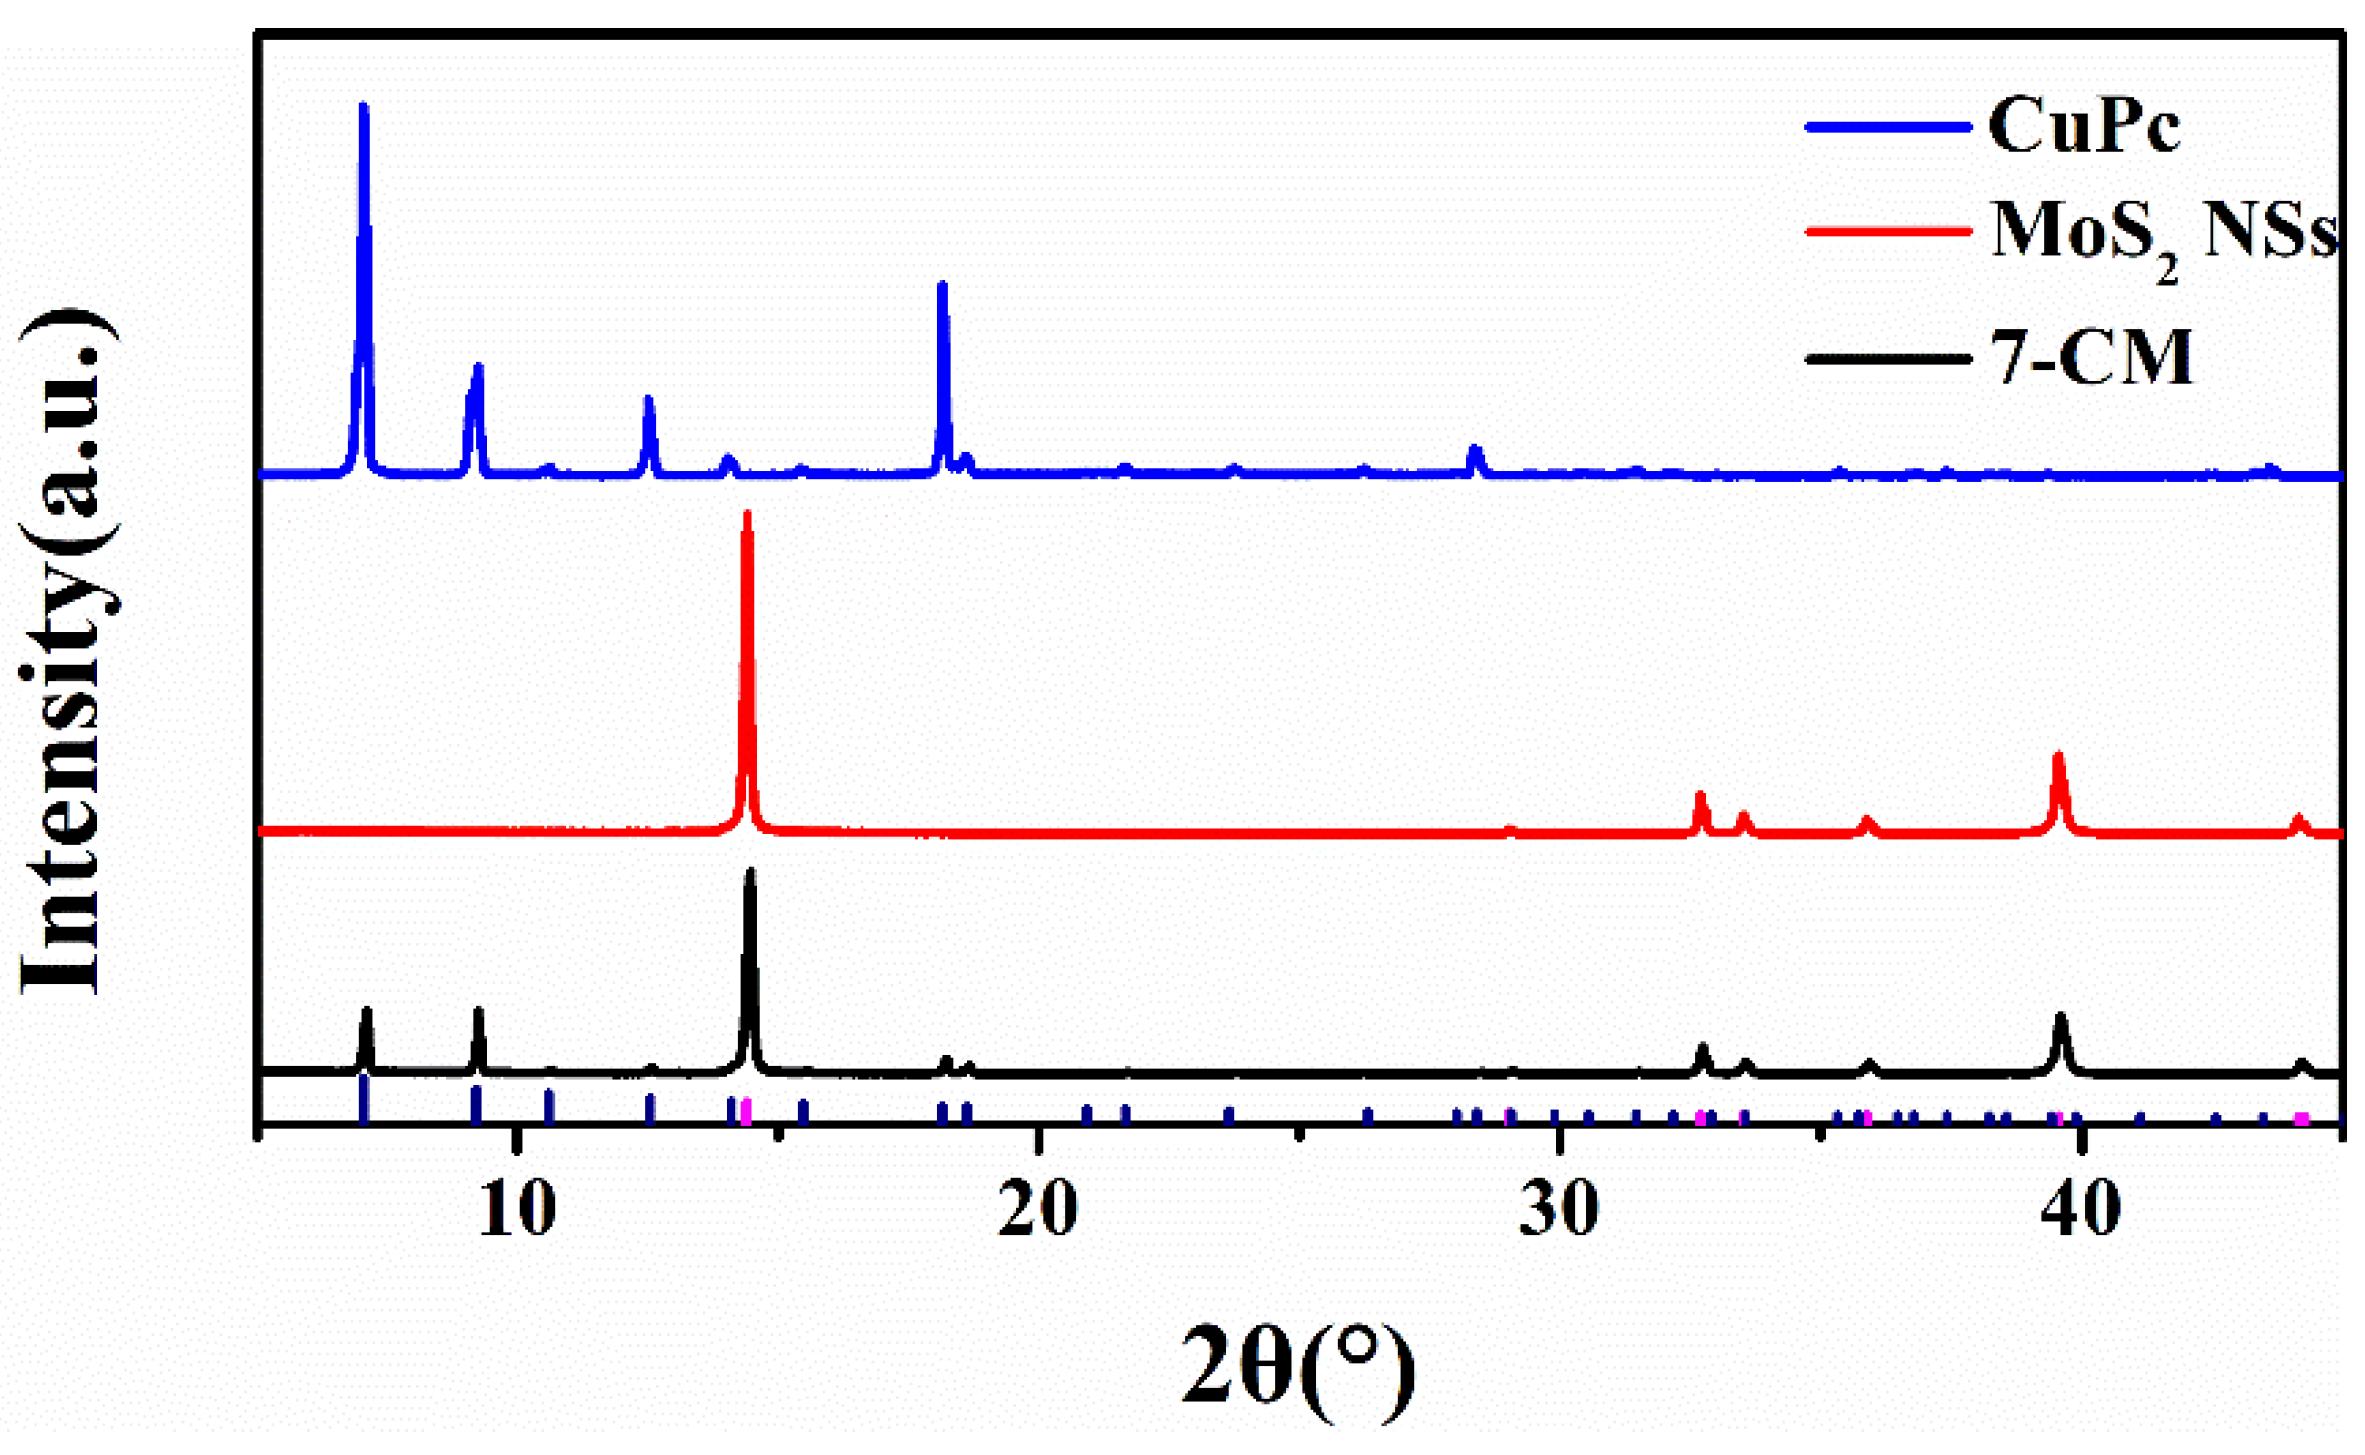
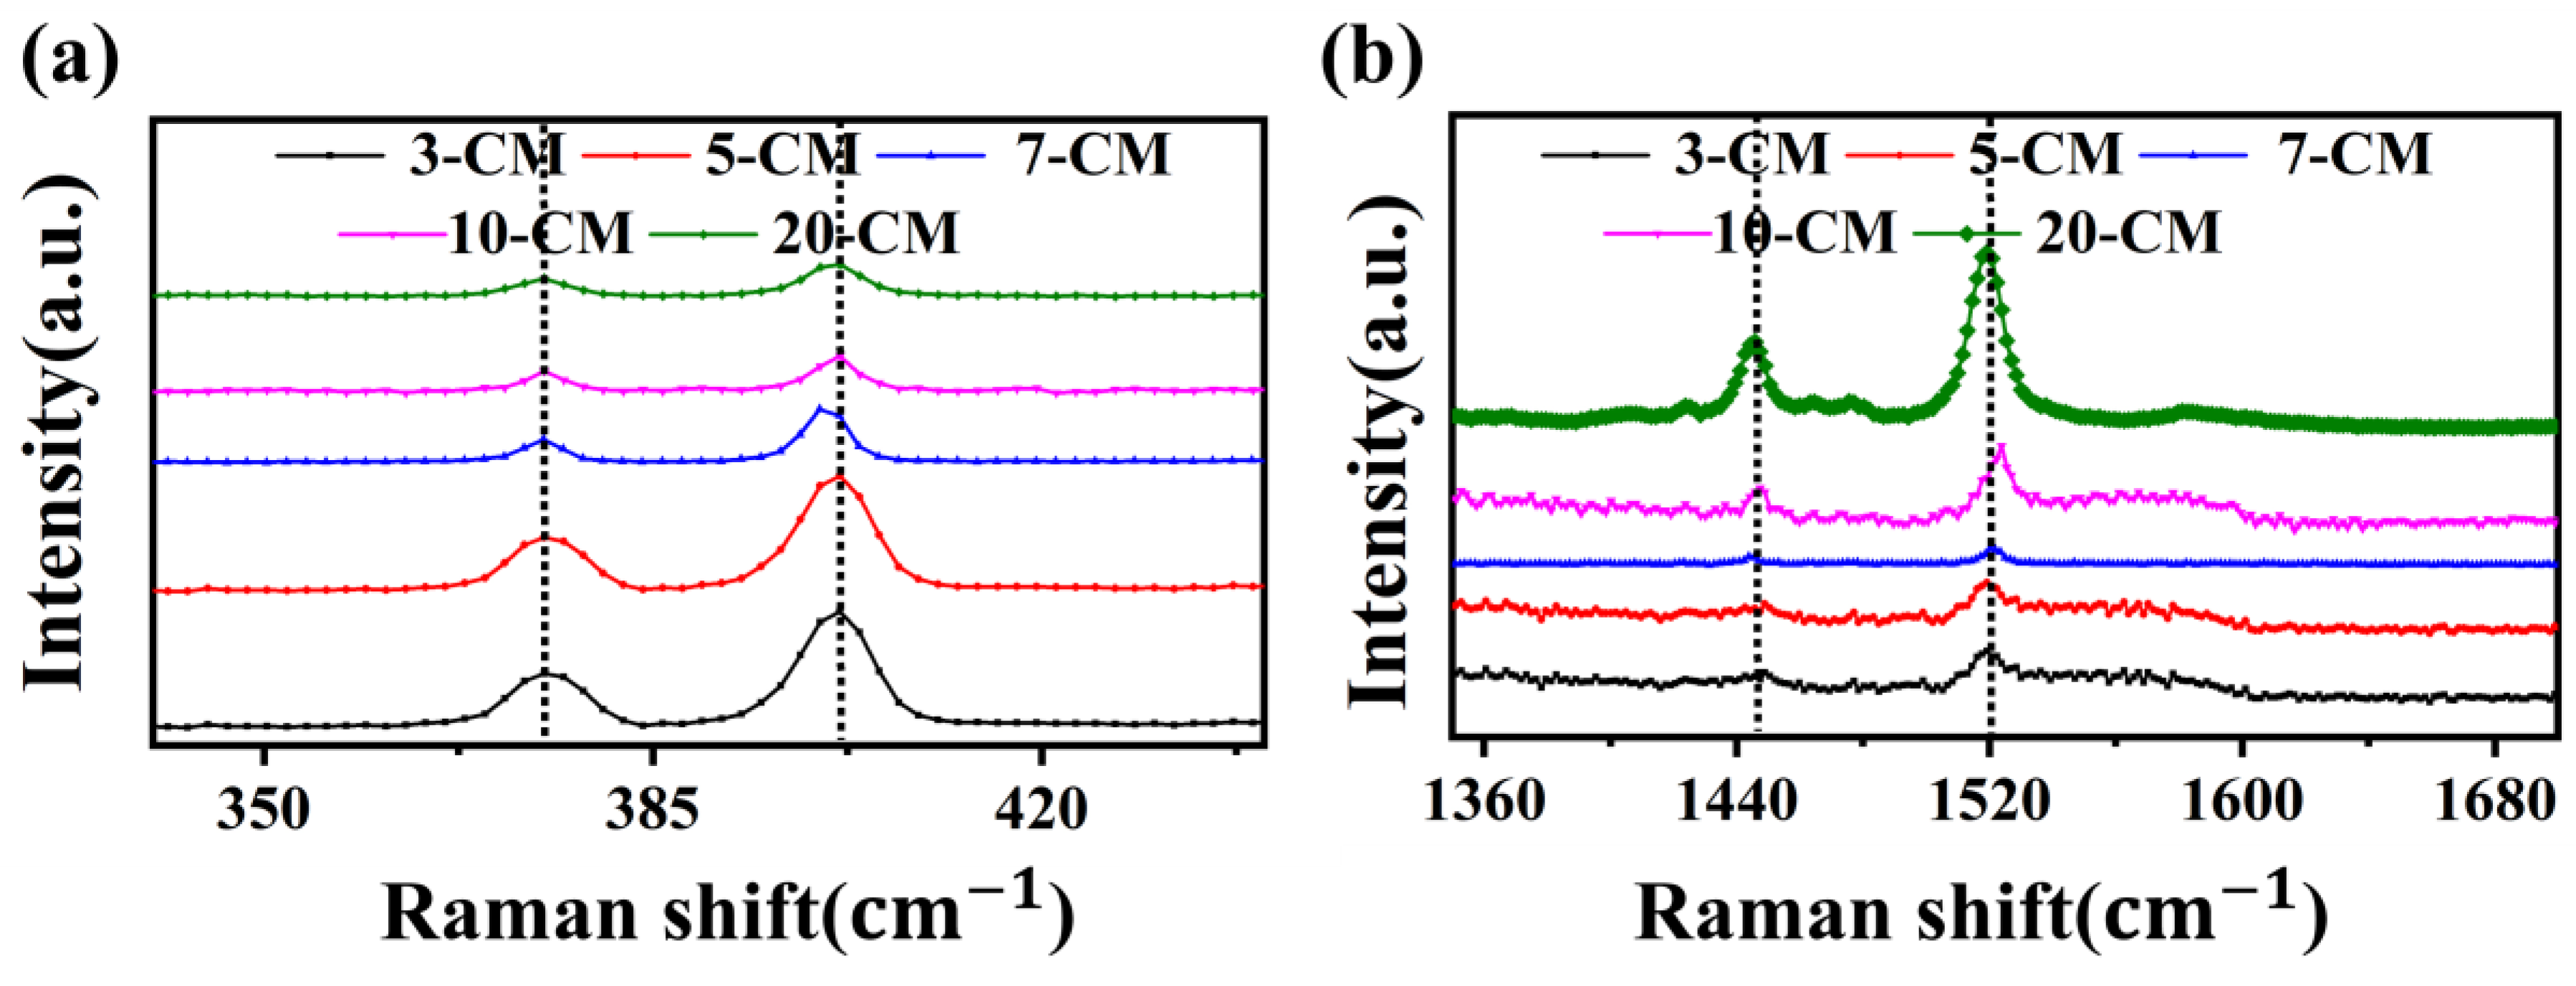
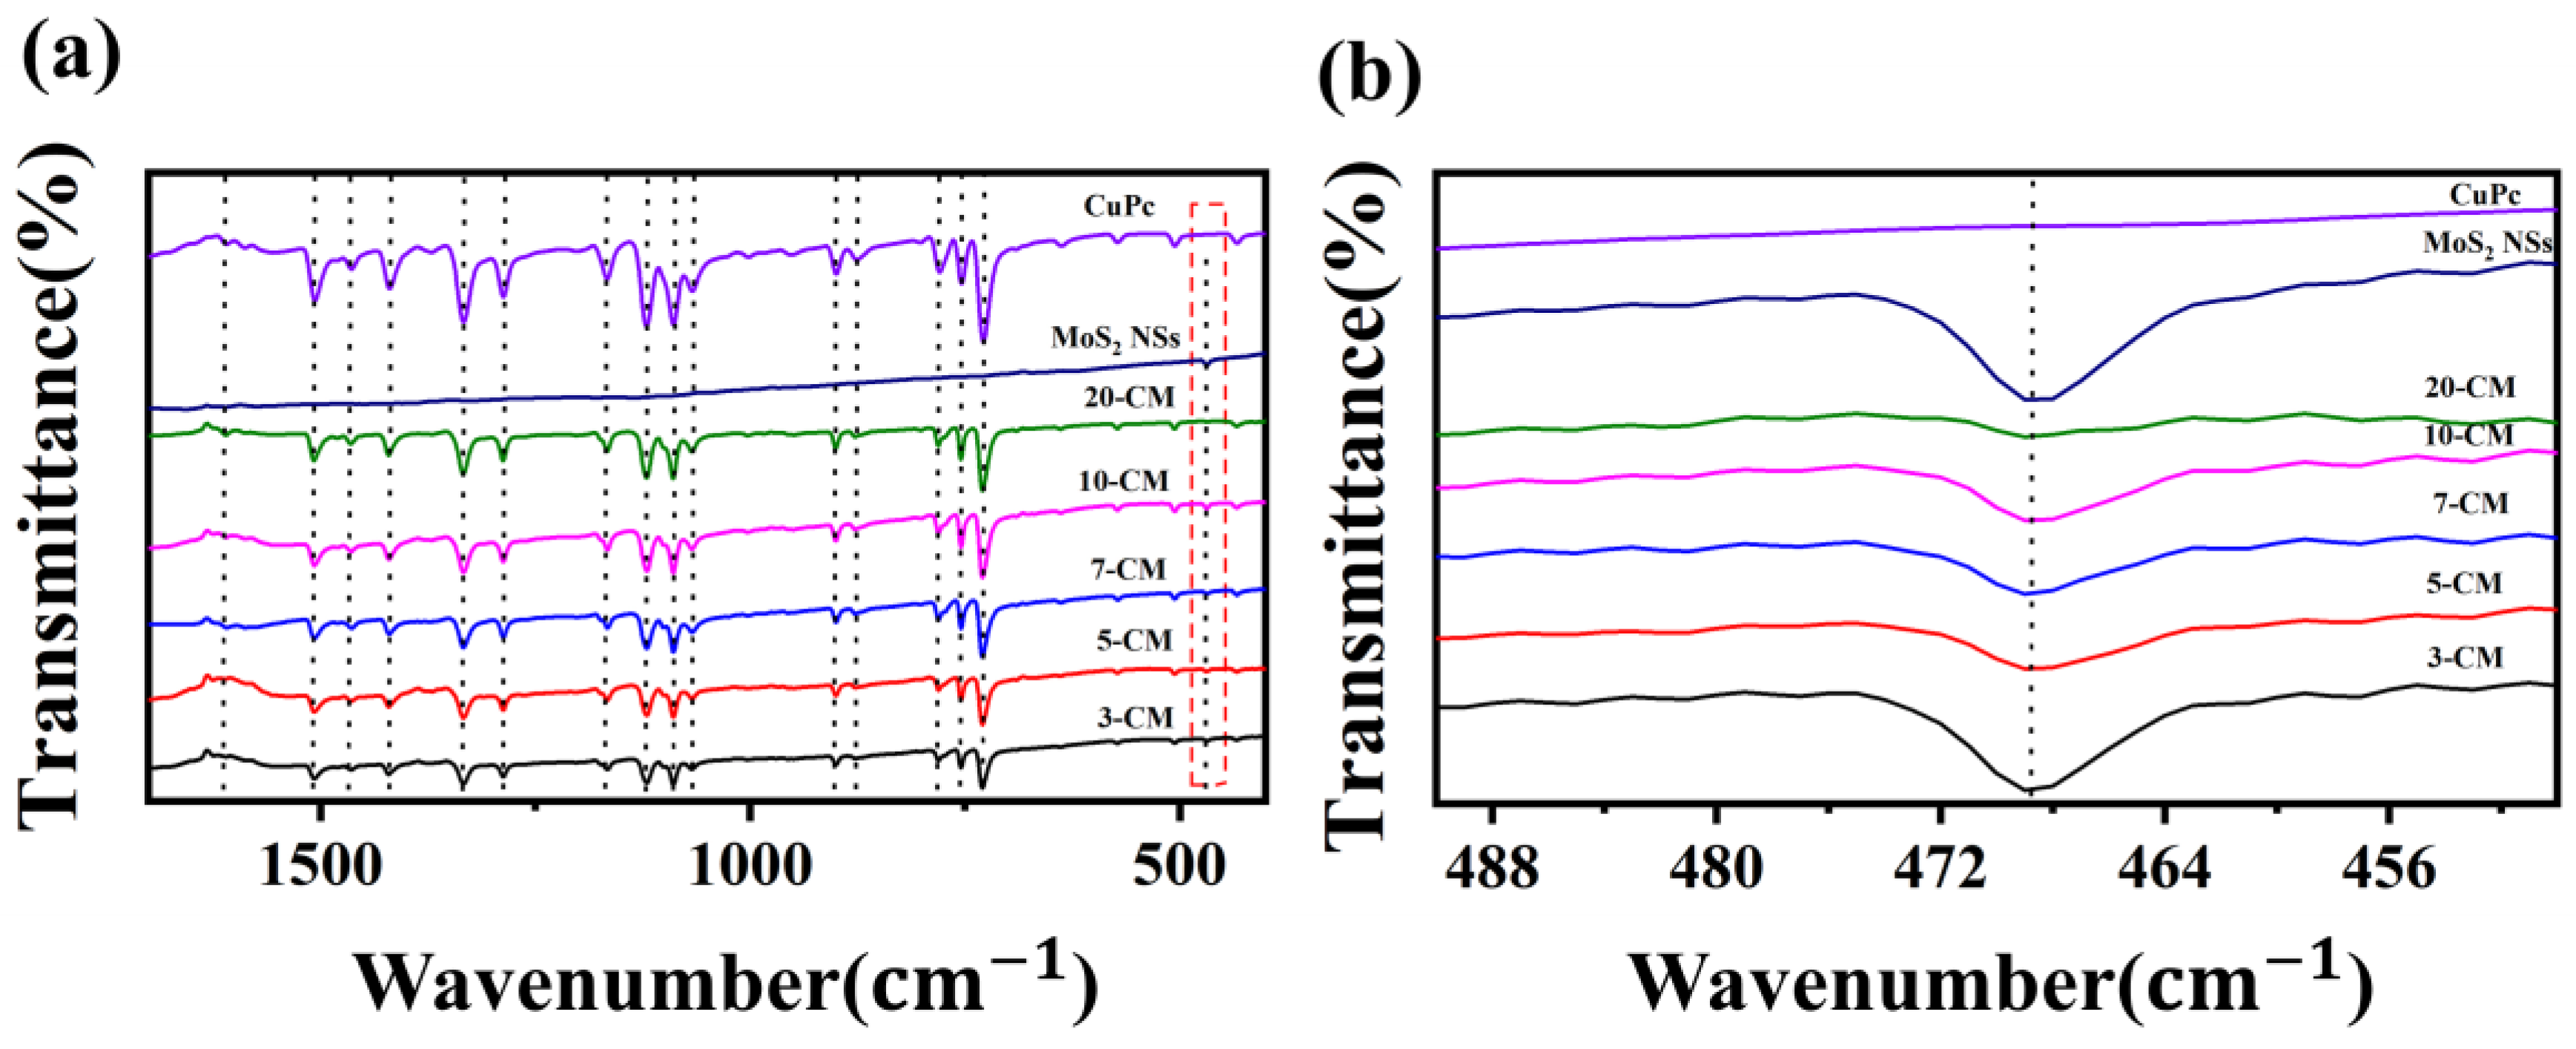
3.1. Material Characterization and Analysis

The surface morphology of the 2D-MoS2/1D-CuPc heterojunction was characterized via SEM. As shown in Figure 2a–f, the morphologies of all samples were composed of MoS2 nanosheets and CuPc. The different mass ratios of MoS2 and CuPc changed the morphology of the 2D-MoS2/1D-CuPc heterojunction samples. Figure 2a shows the morphology of 3-CM, in which MoS2 nanosheets wrapped CuPc micro-nanowires, and MoS2 nanosheets were the main material. Figure 2b shows the morphology of 5-CM. Upon increasing the higher content of 3-CM CuPc micro-nanowires, MoS2 nanosheets were stacked on CuPc micro-nanowires. Figure 2c shows the morphology of 7-CM, in which MoS2 nanosheets penetrated the network of CuPC micro-nanowires, which should have allowed gas molecules to fully contact the material, and thus, improved the gas-sensing performance. Figure 2d shows that the MoS2 nanosheets were tightly bonded to the CuPC micro-nanowires to form a 2D-MoS2/1D-CuPc heterojunction. Figure 2e,f show 10-CM and 20-CM, respectively, which both had roughly the same structure, in which CuPc micro-nanowires were stacked to form conductive micro-nanowires.
Figure 3 shows the X-ray diffraction (XRD) patterns of CuPc micro-nanowires, MoS2 nanosheets, and 2D-MoS2/1D-CuPc (7-CM), which were used to determine the crystallinity and phase structure of the samples. Typical diffraction peaks at 7° and 9.2° were observed in the 2D-MoS2/1D-CuPc pattern, which corresponded to the (−1,0,1) and (1,0,1) crystal planes of β-phase CuPc, respectively. The diffraction peaks at 14.4°, 32.6°, 33.5°, 35.8°, 39.5°, 44.2°, and 49.8° corresponded to the (0,0,2), (1,0,0), (1,0,1), (1,0,2), (1,0,3), (1,0,4), and (1,0,5) crystal planes of MoS2. The results in Figure 4 show that CuPc was compounded onto the MoS2 surface [27].
Figure 4 shows the Raman spectra of 3-CM, 5-CM, 7-CM, 10-CM, and 20-CM, in which the strong signals at 375.3 cm−1 and 401.9 cm−1 in Figure 4a were attributed to the in-plane E 1 2 g and out-of-plane   A 1 g vibration modes [28]. The characteristic peaks of the 7-CM out-of-plane   A 1 g vibration mode underwent a blue shift and their intensity was reduced, indicating that the MoS2 nanosheets had fewer layers than the other samples. In Figure 4b, the strong signals at 1445.7 cm−1 and 1520.2 cm−1 were attributed to the asymmetric vibration of C=N and the telescopic vibration of C=C [29], either due to the presence of CuPc, residual NMP, or their combination.
The elemental composition and valence states of the composites were tested via XPS. It is obvious that MoS2 was composed of Mo, S, C, and O, and CuPc was composed of C, O, N, and Cu. The 2D-MoS2/1D-CuPc heterojunction was composed of Mo, S, Cu, C, and N elements (Figure S2). Figure 5a shows the Mo 3d spectra of the 2D-MoS2 nanosheet and the 2D-MoS2/1D-CuPc heterojunction. For the pure MoS2 nanosheet, two peaks can be seen at 232.21 eV and 229.27 eV, which correspond to Mo 3d3/2 and Mo 3d5/2, respectively [30]. In addition, the two faint peaks at 232.82 eV and 236.32 eV are typical signals of Mo6+ 3d5/2 and Mo6+ 3d3/2 in Mo-O bonds, respectively, suggesting that the introduction of O was caused by defects or vacancies on the surface of MoS2 [31]. The overall shape of the 2D-MoS2/1D-CuPc heterojunction’s Mo 3d spectrum was almost identical to that of pure MoS2 nanosheets. However, all peaks moved to lower binding energies, suggesting an increase in the electron cloud density around MoS2. A shift to lower binding energies was also found in the S 2p spectrum (Figure 5b). The results showed that the pure MoS2 nanosheets had two typical peaks at 162.15 eV and 163.40 eV, attributed to S 2p3/2 and S 2p1/2, respectively, while the 2D-MoS2/1D-CuPc heterojunction had peaks at lower binding energies of 162.73 eV and 163.96 eV [9]. Based on the above test results, it can be inferred that the superior interfacial contact at the 2D-MoS2/1D-CuPc heterojunction effectively transferred electrons.
Figure 6 shows the FTIR spectra of CuPc, MoS2 NSs, 3-CM, 5-CM, 7-CM, 10-CM, and 20-CM. In Figure 6a, the spectra of MoS2 nanosheets, 3-CM, 5-CM, 7-CM, 10-CM, and 20-CM all showed an absorption peak at 468 cm−1. The magnification in Figure 6b shows that the intensity of the MoS2 absorption peak increased with the MoS2-to-CuPc ratio. Figure 6a also shows that CuPc, 3-CM, 5-CM, 7-CM, 10-CM, and 20-CM all contained similar absorption peaks, whose intensity decreased upon increasing the MoS2-to-CuPc ratio. Among them, the peaks at 726 cm−1, 752 cm−1, and 780 cm−1 belonged to the -C-H- out-of-plane bending vibration, and the peaks at 874 cm−1, 900 cm−1, 1065 cm−1, 1086 cm−1, and 1119 cm−1 belonged to -C-C-telescopic vibrations. The peaks at 1166 cm−1 and 1333 cm−1 belonged to -C-O- telescopic vibration. The peak at 1285 cm−1 belonged to -O-H-in-plane telescopic vibrations. The peaks at 1418 cm−1, 1465 cm−1, 1507 cm−1, and 1611 cm−1 belonged to telescopic vibrations of the -C=C- bonds in the phthalocyanine skeleton [30].

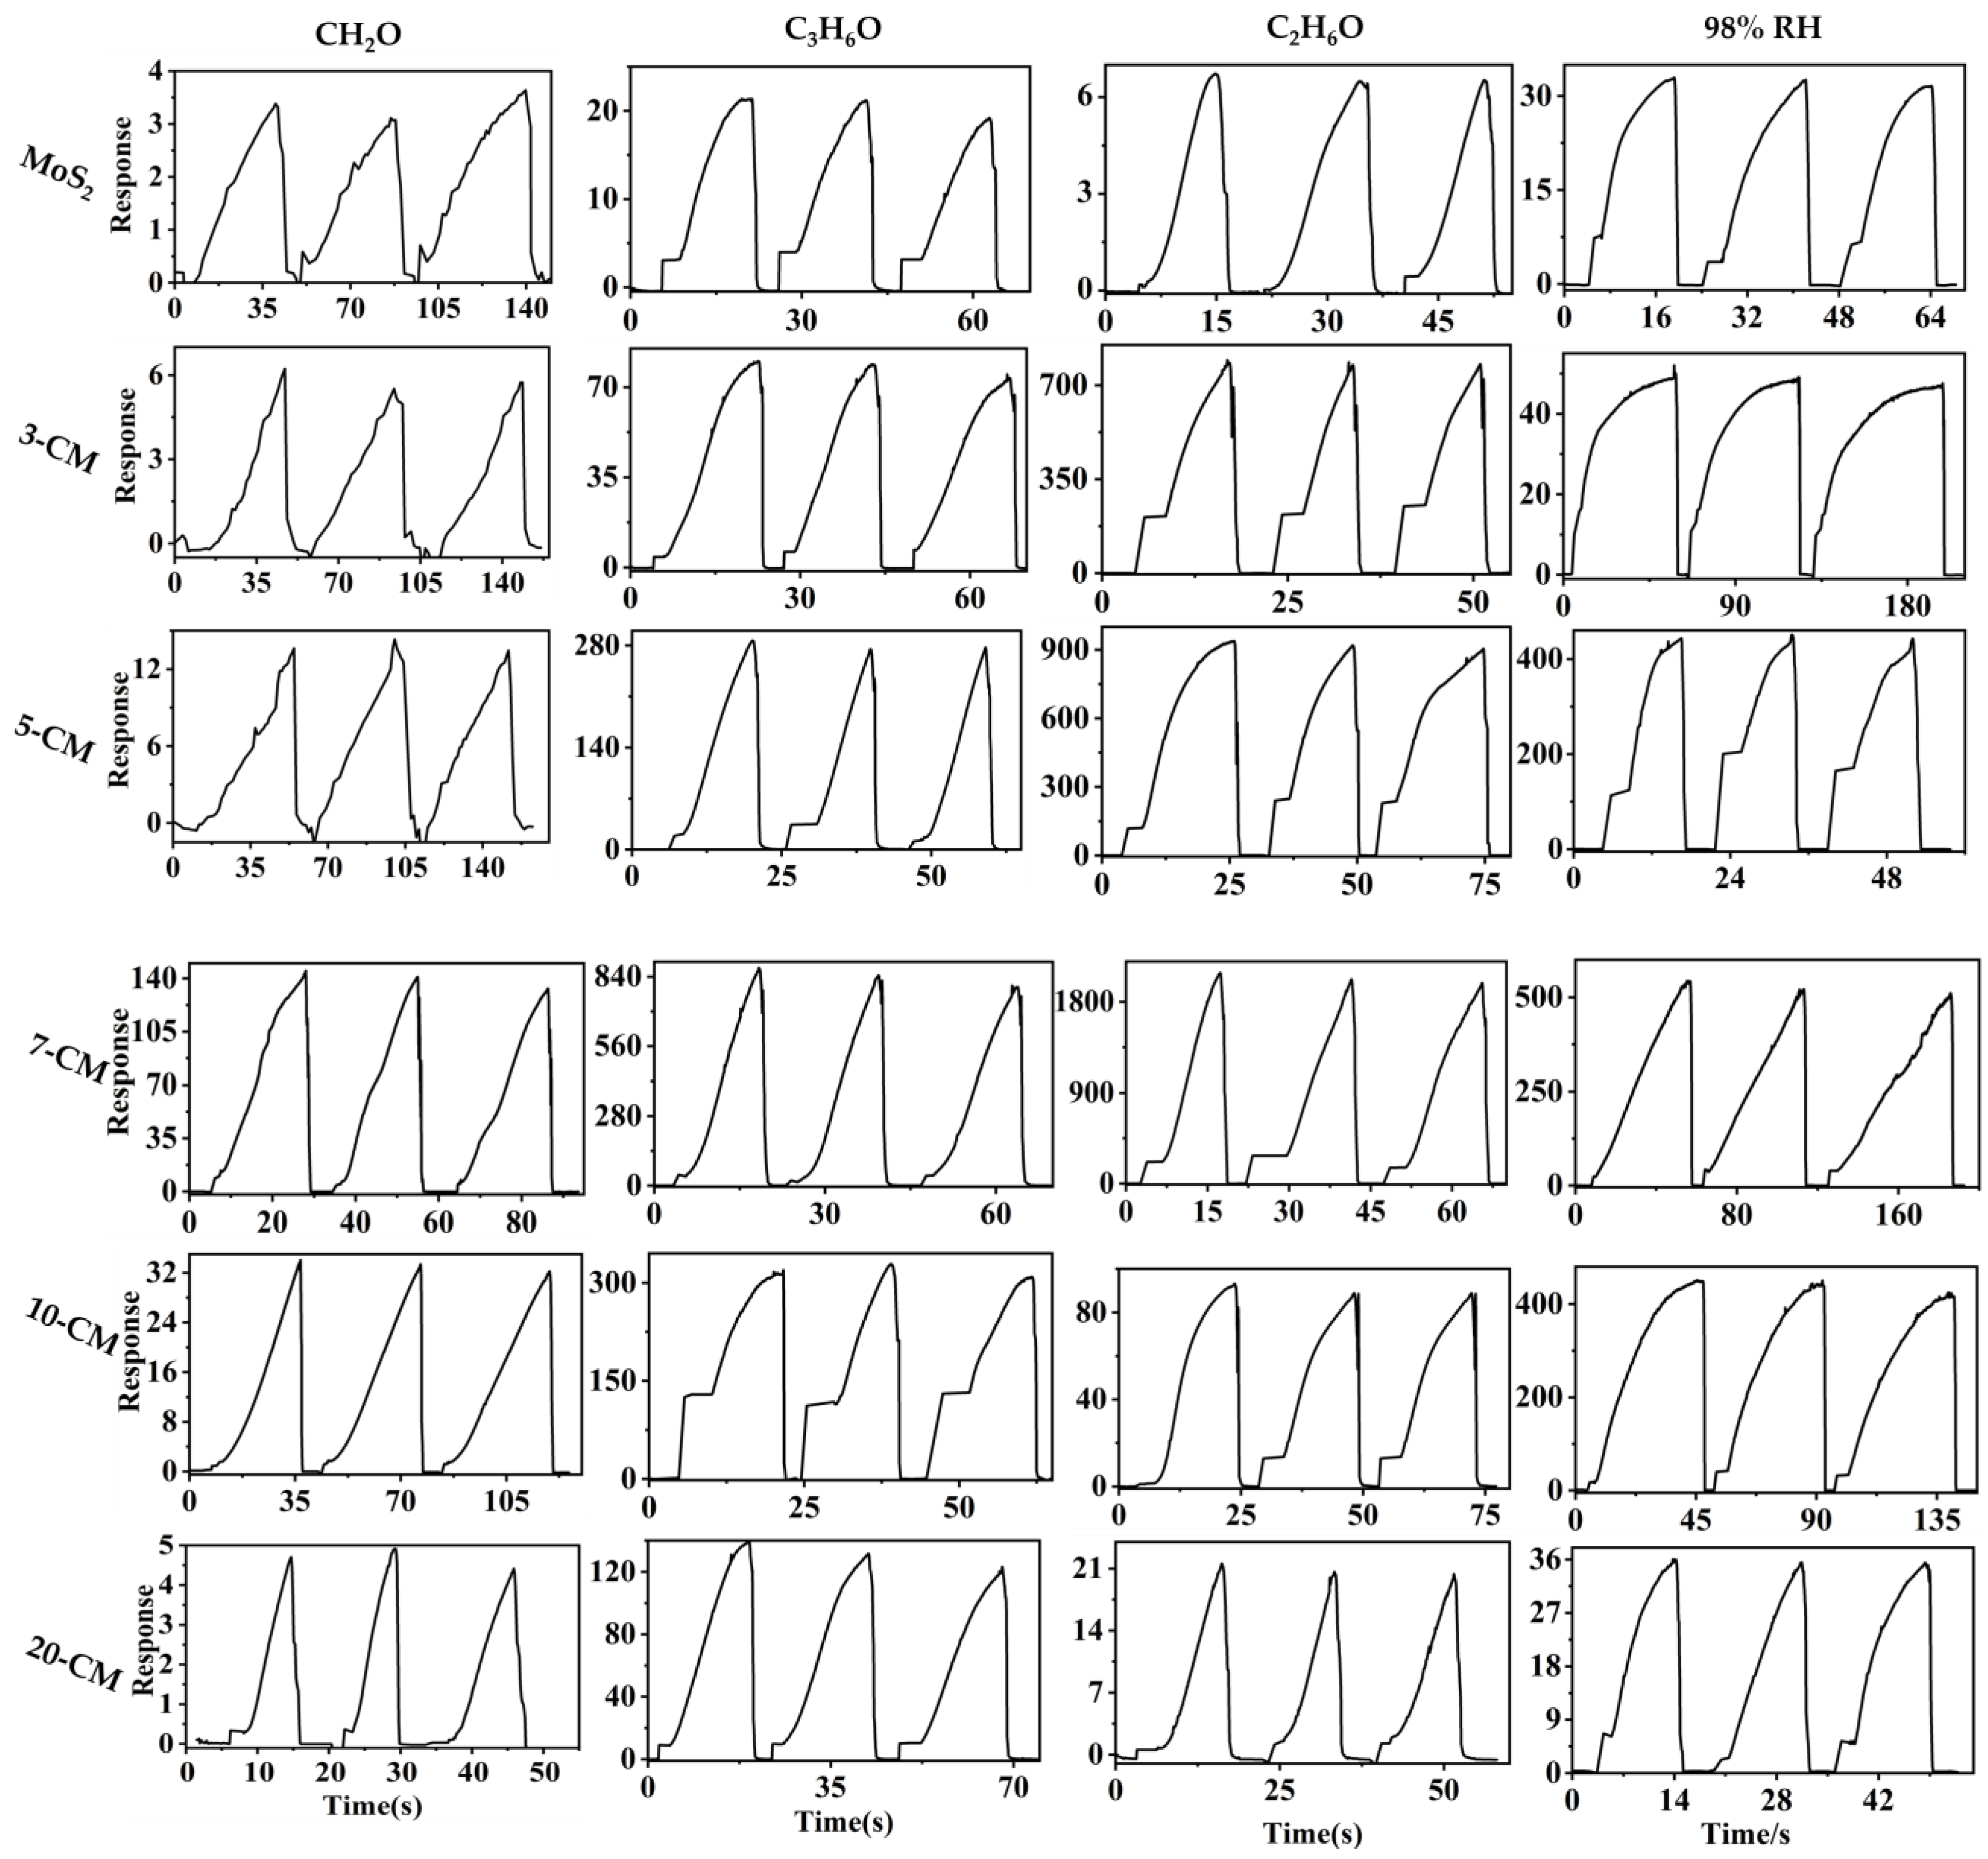
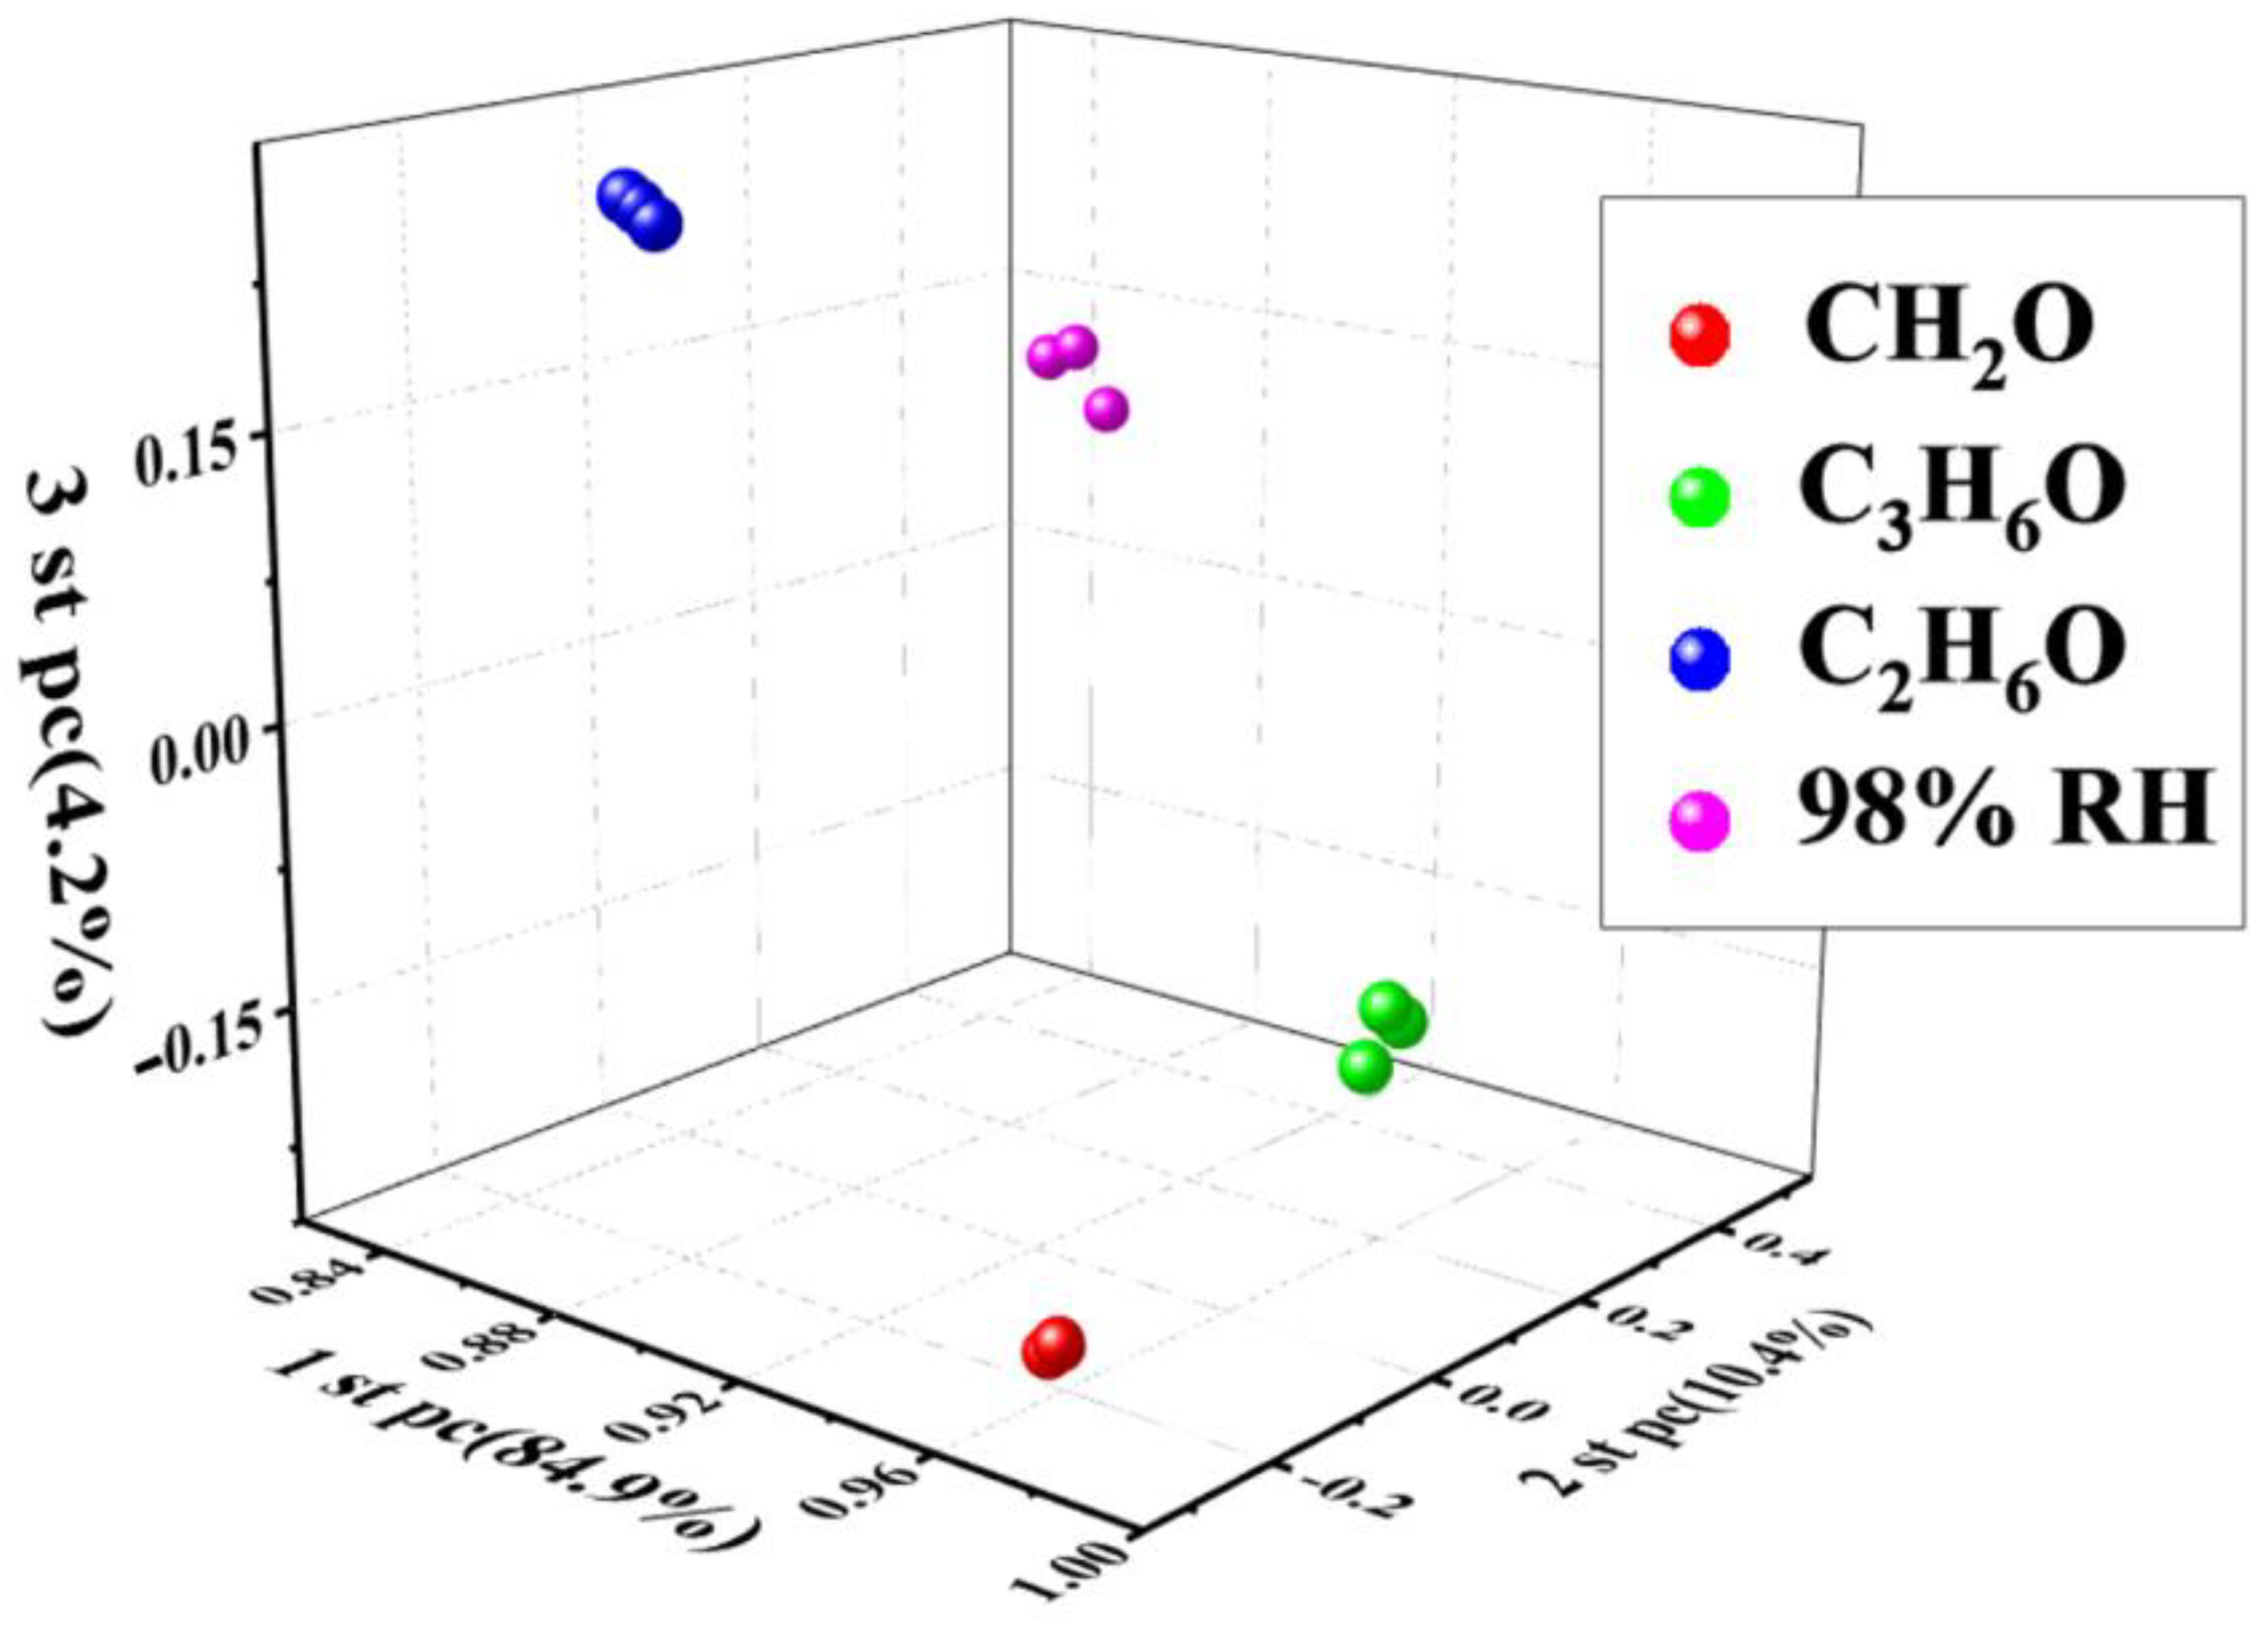
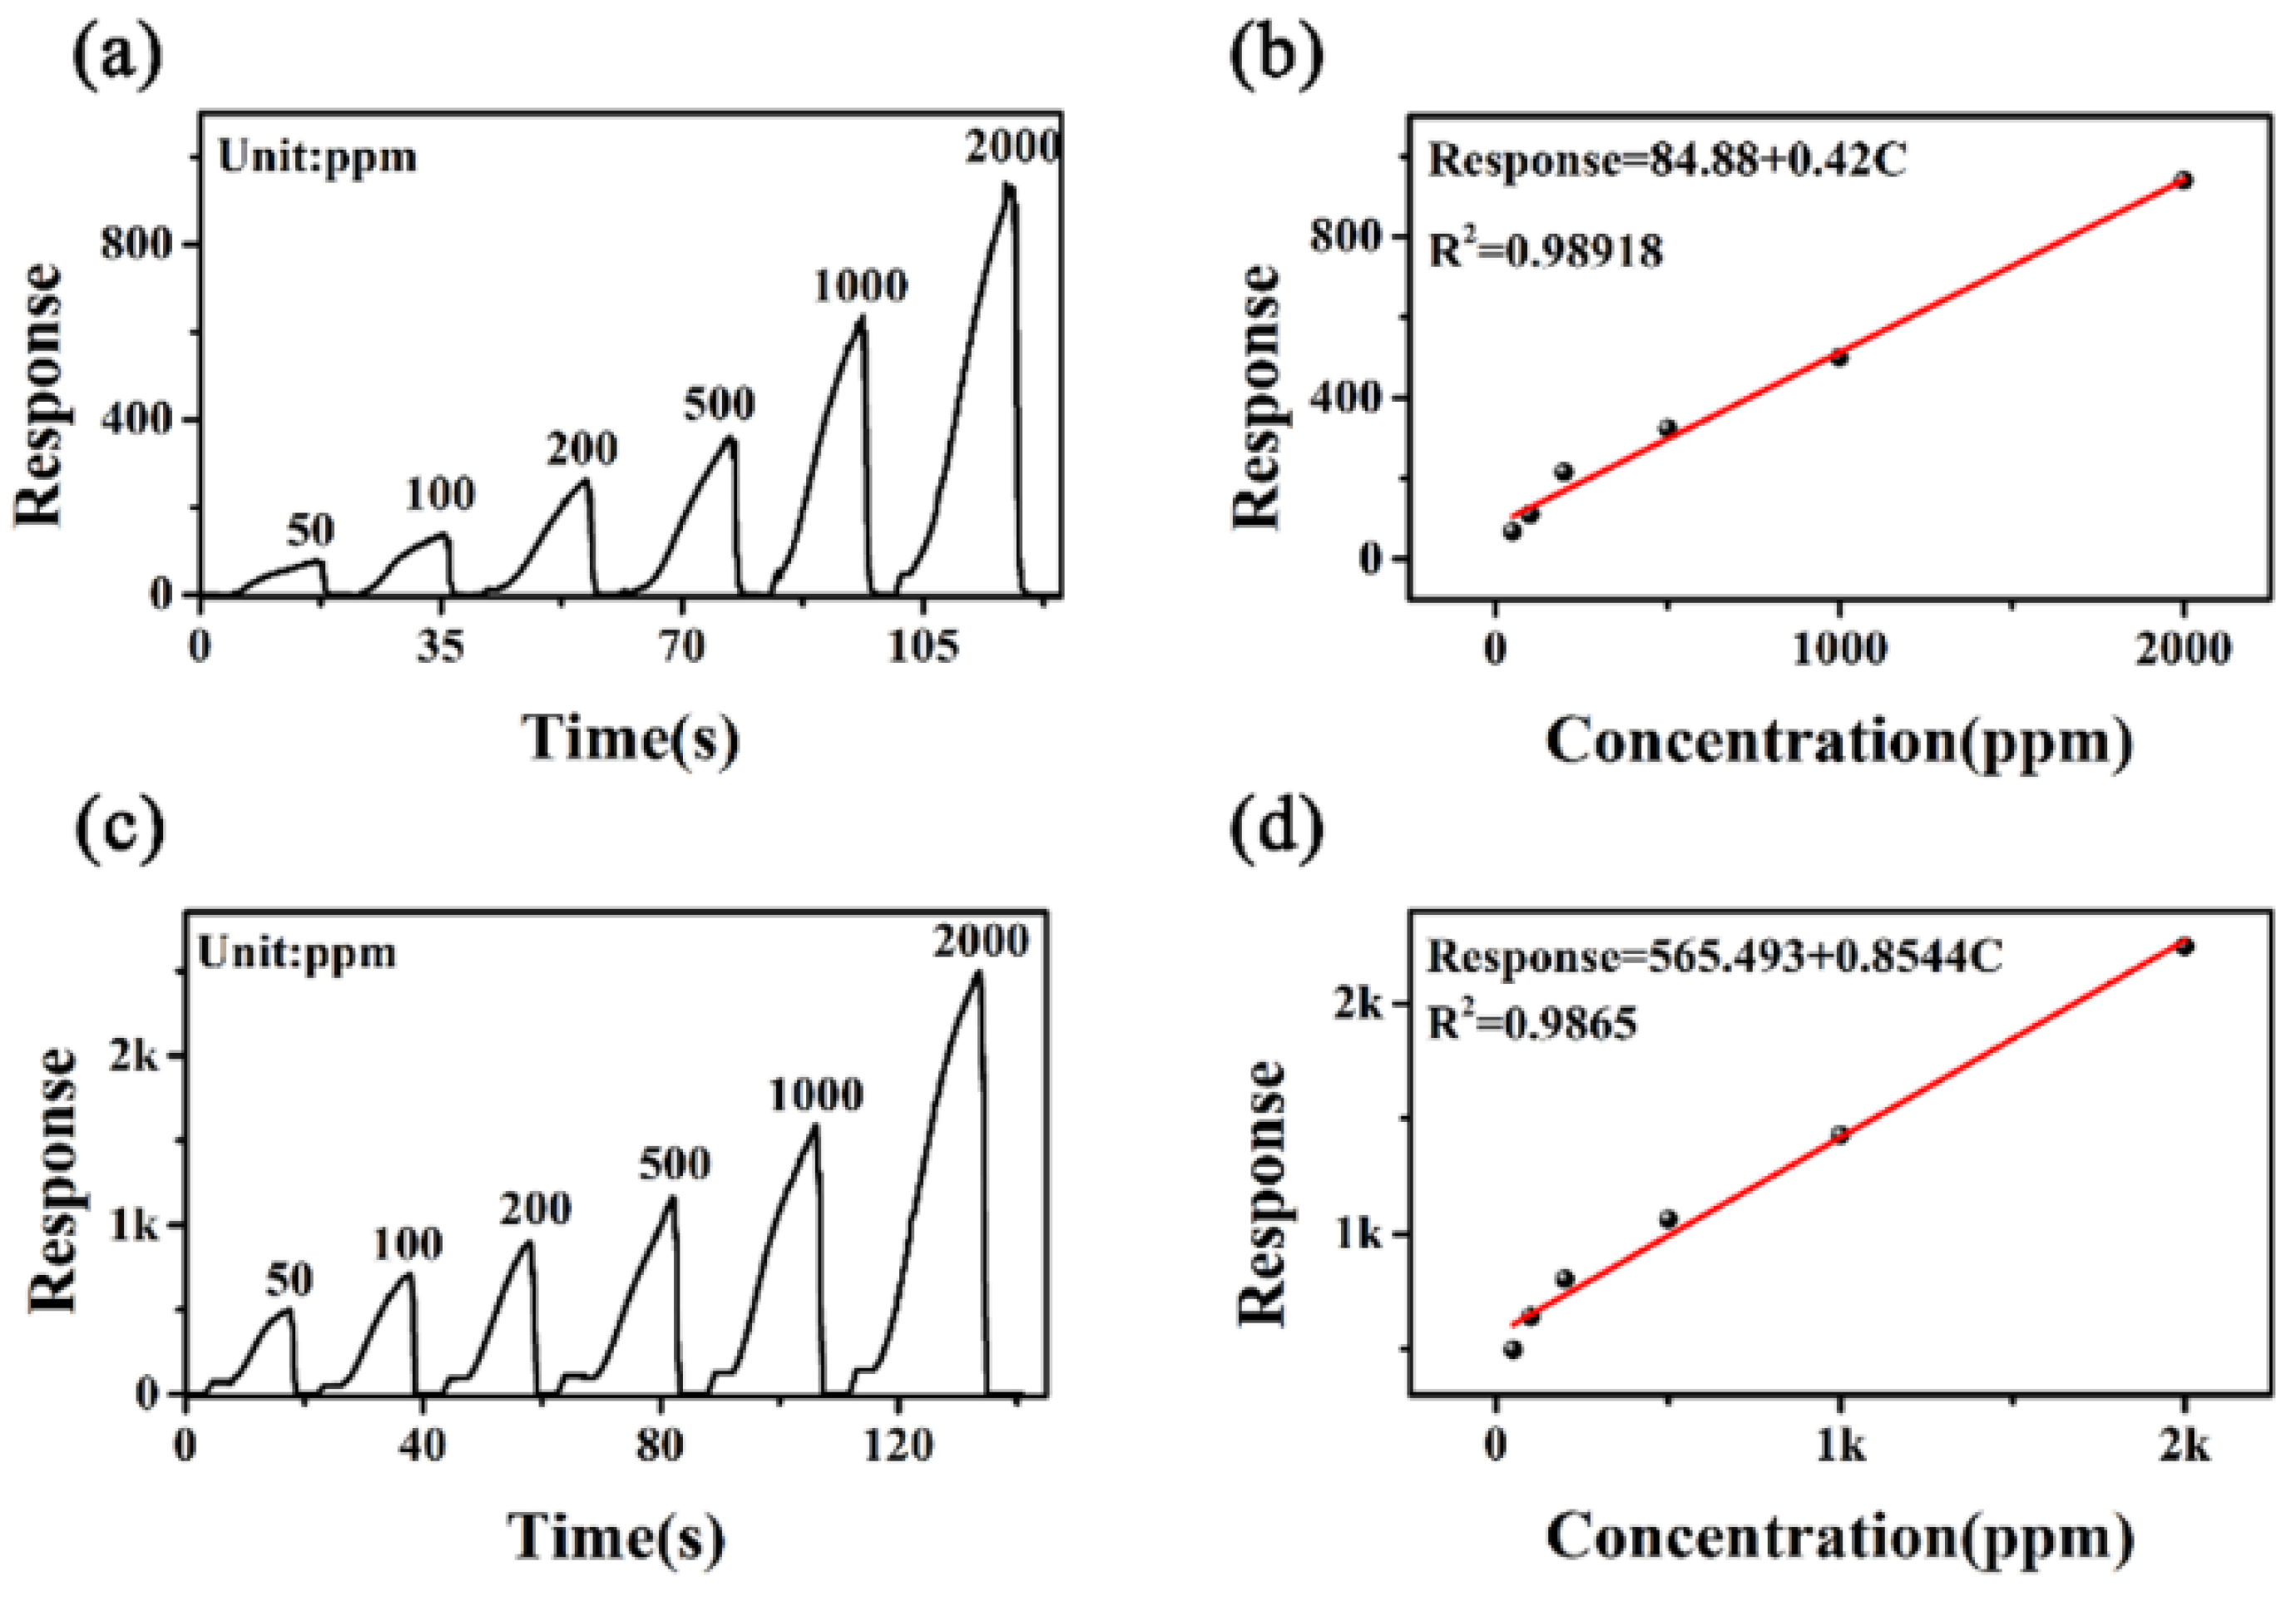
3.2. Gas-Sensing Studies

The gas-sensing performance of gas sensors based on the 2D-MoS2/1D-CuPc heterojunction was studied using a homemade gas-sensing detection platform. Figure 7 shows the effect of the MoS2-to-CuPc ratio on the gas-sensing response. The response curve shows that the 2D-MoS2/1D-CuPc heterojunction with different doping ratios had a relatively stable response to 1000 ppm of formaldehyde (CH2O), acetone (C3H6O), ethanol (C2H6O), and 98% RH at room temperature. The response of the 2D-MoS2/1D-CuPc heterojunction to the four target gases first increased, and then, decreased as the proportion of CuPc increased. Figure 8a shows that the best gas-sensing performance was obtained when the ratio of MoS2 to CuPc was 20:7. Two-dimensional MoS2/one-dimensional CuPc had the highest sensitivity toward C2H6O. The average responses of pure MoS2 to 1000 ppm CH2O, C3H6O, C2H6O, and 98% RH were 2.9, 18.4, 5.3, and 31.1, respectively. For 3-CM, the mean response of 1000 ppm CH2O, C3H6O, C2H6O, and 98% RH increased to 5.2, 69.5, 630.6, and 43.3, respectively. The mean responses of 5-CM toward 1000 ppm CH2O, C3H6O, C2H6O, and 98% RH were 12.4, 285.1, 745.5, and 400.7, respectively. The average responses of 7-CM to 1000 ppm CH2O, C3H6O, C2H6O, and 98% RH were 125.6, 753.1, 1645.1, and 471.7, respectively. Compared with pure MoS2, the response of 7-CM to 1000 ppm CH2O, C3H6O, C2H6O, and 98% RH increased by 122.7, 734.6, 1639.8, and 440.5, respectively. When the ratio of MoS2 to CuPc further decreased, the sensitivity of 2D-MoS2/1D-CuPc began to decrease. The results showed that the responses of 10-CM to 1000 ppm CH2O, C3H6O, C2H6O, and 98% RH were 30.9, 251.4, 72.9, and 396.8, respectively, which were all better than those of pure MoS2. The responses of 20-CM to 1000 ppm CH2O, C3H6O, C2H6O, and 98%RH were 4.2, 117.9, 16.8, and 32.1, respectively, which were also better than those of pure MoS2. These results show that the ratio of MoS2 and CuPc had a significant effect on the gas sensitivity of the 2D-MoS2/1D-CuPc heterojunction.
When the 2D-MoS2/1D-CuPc heterojunction sensor was exposed to C2H6O, C3H6O, and CH2O gas, surface-adsorbed oxygen ( O 2 < 100 °C, O 2 100–300 °C, O 2 > 300 °C) reacted with C2H6O, C3H6O, and CH2O as follows:
C 2 H 6 O g + 3 O 2 s 2 C O 2 + 3 H 2 O + 3 e
C 3 H 6 O g + 4 O 2 s 3 C O 2 + 3 H 2 O + 4 e
C H 2 O g + O 2 s C O 2 + H 2 O + e
In the above reaction [32,33,34], e represents electron conduction, and O 2 s represents surface-adsorbed oxygen ions. C 2 H 6 O g ,   C 3 H 6 O g , and   C H 2 O g , respectively represent adsorbed C2H6O, C3H6O, and CH2O molecules. The reduced gas molecules released electrons into 2D-MoS2/1D-CuPc during the reaction, and the current of 7-CM increased rapidly, indicating a good synergistic effect between the materials at this ratio.
To further evaluate the effect of the ratio of MoS2 and CuPc on the sensing performance of 2D-MoS2/1D-CuPc, the average response size, response time, and recovery time of the six sensors to four target analytes was analyzed. Figure 8b,c show that the response of the 2D-MoS2/1D-CuPc heterojunction to the analyte increased first, and then, decreased as the mass ratio of MoS2 to CuPc decreased. The response time of all sensors was less than 60 s, and the recovery time was less than 10 s. This fast recovery was due to the good crystallinity of the sensitive structural elements, which provided the gas sensors with greater electron mobility. The one-dimensional structure facilitated the transport and transfer of electrons, as well as rapid response and recovery.
A significant advantage of this sensor array over a single-sensor array is that an unknown analyte can be identified and detected based on mathematical analyses, kinetics, and thermodynamics [35] or via principal component analysis (PCA) [36,37]. The sensor array was made of 2D-MoS2/1D-CuPc with different MoS2/CuPc ratios. The recognition performance of the sensor array was further evaluated using 3D PCA (Figure 9). The coordinates of the four test samples could be distinguished, and the sensor identified all four samples. The results show that the 2D-MoS2/1D-CuPc heterojunction had high sensitivity and selectivity.
To further investigate the gas-sensing properties of the sensor array, its thermodynamic and kinetic parameters were combined, converted into a graphical signal, and combined with image recognition technology. The reaction amplitude and reaction time were taken as the thermodynamic and kinetic parameters, respectively. Six sensors showed six reaction amplitudes and six reaction times for each analyte. The ratio of the six reaction values to the six reaction times yielded six new thermodynamic and kinetic parameters, which were used to construct visually distinct hexagons, as shown in Figure 10. This shows that the sensor array had high recognition performance.
To study the real-time monitoring performance of 7-CM, dynamic tests with different concentrations of C3H6O and C2H6O were carried out. The relationship between response and vapor concentration at room temperature is shown in Figure 11. Figure 11a,c show that the surface C3H6O and C2H6O vapors of 7-CM had good gas-sensing characteristics. Figure 11b,d demonstrate that 7-CM had good linearity toward C3H6O and C2H6O vapors. The device had outstanding advantages in terms of quantitative detection, direct readout, simplified correction, and auxiliary circuitry.
To evaluate the performance of 2D-MoS2/1D-CuPc heterojunction-based sensors, Table 1 compares the sensing performance of C2H6O sensors with different sensing materials. Three-dimensional (MoS2)/ZnO and MoS2/TiO2 detected C2H6O, but their response time and recovery time were longer than those of 7-CM and MoS2/CeO2. MoS2/NiCo2O4 and CdS/MoS2 exhibited a faster response and recovery, but they only operated at temperatures above 100 °C, which means higher power consumption and a more complex operating environment. Compared with these composites, the 2D-MoS2/1D-CuPc heterojunction showed higher responses and shorter response times at room temperature. Especially, the responses of the 2D-MoS2/1D-CuPc composite were better than all the sensing materials in Table 1, showing good application potential.

4. Analysis of Gas-Sensing Mechanism

Figure 12 shows the current–voltage (I-V) characteristic curves of MoS2, 3-CM, 5-CM, 7-CM, 10-CM, and 20-CM sensors, in which the conductivity of 3-CM to 7-CM decreased sequentially. This was attributed to an increase in the heterojunction barrier between MoS2 nanosheets and CuPc micro-nanowires. In addition, as the mass ratio of CuPc increased, the electrical conductivity of the material decreased due to the lower electrical conductivity of CuPc compared with MoS2. The 7-CM surface contained dispersed CuPc micro-nanowires that ensured the penetration and diffusion of gas molecules, which improved the sensitivity of the sensor [46].
Enhancements in the gas-sensing performance of the 2D-MoS2/1D-CuPc heterojunction were attributed to the heterojunction between MoS2 and CuPc. CuPc is a p-type semiconductor, while MoS2 is an n-type semiconductor. Figure 13a shows a schematic diagram of the band structure of MoS2 and CuPc, where Ef and Φ are the Fermi level and work function, respectively. The work functions of MoS2 and CuPc were 4.39 eV and 2.96 eV, respectively. Figure 13a shows that CuPc had a higher Fermi level than MoS2, allowing electrons to quickly transfer from CuPc to MoS2. Thus, the bands of CuPc and MoS2 began to shift until their Fermi levels reached a new equilibrium (Figure 13d) and generated a built-in Schottky barrier (qV0). Thus, a depletion layer existed at the interface between MoS2 and CuPc [47]. When the 2D-MoS2/1D-CuPc composite contacted the target gas (e.g., ethanol), electron exchange occurred (Figure 13c). As a result, the conductivity of the MoS2/CuPc heterojunction was greatly increased, which improved its response. In addition, the CuPC micro-nanowires on the surface of the MoS2 nanosheets acted as a p-type dopant and increased the specific surface area of the 2D-MoS2/1D-CuPc heterojunction, which provided more adsorption sites for target gas molecules, thus improving its sensitivity. The enhanced charge transfer and increased number of active sites improved the sensing performance of the 2D-MoS2/1D-CuPc heterojunction.

5. Conclusions

We prepared 2D-MoS2/1D-CuPc heterojunction composites with different mass ratios of MoS2 to CuPc via a heating/magnetic reflux stirring method, and then, used them to construct 2D-MoS2/1D-CuPc-based gas sensors. The results showed that the response of the 2D-MoS2/1D-CuPc heterojunction to gas analytes was related to the mass ratio of MoS2 to CuPc. When the ratio of MoS2 to CuPc was 20:7, the best gas-sensing performance of the 2D-MoS2/1D-CuPc heterojunction was obtained. Compared with the MoS2 sensor, the responses of 7-CM to 1000 ppm CH2O, C3H6O, C2H6O, and 98% RH were increased by 122.7, 734.6, 1639.8, and 440.5, respectively, at room temperature. According to PCA and radar analysis, a 2D-MoS2/1D-CuPc heterojunction sensor array could identify and detect four target gases. After further data processing, the sensor array showed higher recognition ability. These results provide an experimental reference for the development of high-performance MoS2-based gas sensors.

Supplementary Materials

The following supporting information can be downloaded at: https://www.mdpi.com/article/10.3390/s23239321/s1, Figure S1: (a) Schematic of synthesis of MoS2 nanosheets; (b) Schematic of the preparation process of CuPc micro-nanowires; (c) Schematic of the preparation process of the 2D-MoS2/1D-CuPc based gas sensor; Figure S2: (a) XPS survey spectra of MoS2, CuPc, and 7-CM; (b) Cu 2p1/2, Cu 2p3/2 spectra of CuPc and 7-CM; (c) C 1s spectra of MoS2; (d) C 1s spectra of CuPc; (e) C 1s spectra of 7-CM; (f) O 1s spectra of MoS2; (g) O 1s spectra of CuPc; (h) O 1s spectra of 7-CM; (i) MoS2 S2p1/2, S2p3/2, and S-C spectra; (j) 7-CM S2p1/2 and S2p3/2 spectra; (k) Mo4+ 3d3/2, Mo4+ 3d5/2 spectra of MoS2; (l) Mo4+ 3d3/2, Mo4+ 3d5/2, and S 2s spectra of 7-CM; (m) N 1s spectrum of CuPc; (n) C-NH2, C-N, N 1s, N-Cu (N ions in CuPc), Mo 3p3/2 spectra of 7-CM.

Author Contributions

G.C. designed the experiments, analyzed the data, and wrote the paper. X.X. and H.W. performed the theoretical analysis. T.S. edited the manuscript and supervised the study. All authors have read and agreed to the published version of the manuscript.

Funding

This research was funded by the National Natural Science Foundation of China (grant number 62061046), the Natural Science Foundation of Xinjiang Uygur Autonomous Region (grant number 2023D01A81), and the Third “Tianshan Talents” Training Project of Xinjiang Uygur Autonomous Region.

Institutional Review Board Statement

Not applicable.

Informed Consent Statement

Not applicable.

Data Availability Statement

The data presented in this study are available on request from the corresponding author.

Conflicts of Interest

The authors declare no conflict of interest.

References

  1. Haineng, B.; Hui, G.; Cheng, F.; Wang, J.; Liu, B.; Xie, Z.; Guo, F.; Chen, D.; Zhang, R.; Zheng, Y. Light-activated ultrasensitive NO2 gas sensor based on heterojunctions of CuO nanospheres/MoS2 nanosheets at room temperature. Sens. Actuators B Chem. 2022, 368, 132131. [Google Scholar]
  2. Yong, Y.; Wufei, G.; Xin, L.; Liu, Y.; Liang, Y.; Chen, B.; Yang, Y.; Luo, X.; Xu, K.; Yuan, C. Light-assisted room temperature gas sensing performance and mechanism of direct Z-scheme MoS2/SnO2 crystal faceted heterojunctions. J. Hazard. Mater. 2022, 436, 129246. [Google Scholar] [CrossRef]
  3. Robinson, M.T.; Tung, J.; Heydari Gharahcheshmeh, M.; Gleason, K.K. Humidity-Initiated Gas Sensors for Volatile Organic Compounds Sensing. Adv. Funct. Mater. 2021, 31, 2101310. [Google Scholar] [CrossRef]
  4. Zhang, H.M.; Zheng, Z.; Yu, T.; Liu, C.; Qian, H.; Li, J.G. Seasonal and Diurnal Patterns of Outdoor Formaldehyde and Impacts on Indoor Environments and Health. Environ. Res. 2022, 205, 112550. [Google Scholar] [CrossRef] [PubMed]
  5. Zhang, K.; Qin, S.; Tang, P.; Feng, Y.; Li, D. Ultra-sensitive ethanol gas sensors based on nanosheet-assembled hierarchical ZnO-In2O3heterostructures. J. Hazard. Mater. 2020, 391, 122191. [Google Scholar] [CrossRef] [PubMed]
  6. Umar, A.; Ibrahim, A.A.; Nakate, U.T.; Albargi, H.; Alsaiari, M.A.; Ahmed, F.; Alharthi, F.A.; Alghamdi, A.A.; Al-Zaqri, N. Fabrication and Characterization of CuO Nanoplates Based Sensor Device for Ethanol Gas Sensing Application. Chem. Phys. Lett. 2021, 763, 138204. [Google Scholar] [CrossRef]
  7. Yuan, Z.Y.; Yang, C.; Meng, F.L. Strategies for Improving the Sensing Performance of Semiconductor Gas Sensors for High-Performance Formaldehyde Detection: A Review. Chemosensors 2021, 9, 179. [Google Scholar] [CrossRef]
  8. Liu, J.; Hu, Z.; Zhang, Y.; Li, H.-Y.; Gao, N.; Tian, Z.; Zhou, L.; Zhang, B.; Tang, J.; Zhang, J.; et al. MoS2 Nanosheets Sensitized with Quantum Dots for Room-Temperature Gas Sensors. Nano-Micro Lett. 2020, 12, 24–36. [Google Scholar] [CrossRef]
  9. Zhao, P.X.; Tang, Y.; Mao, J.; Chen, Y.; Song, H.; Wang, J.; Song, Y.; Liang, Y.; Zhang, X. One-dimensional MoS2-decorated TiO2 nanotube gas sensors for efficient alcohol sensing. J. Alloys Compd. 2016, 674, 252–258. [Google Scholar] [CrossRef]
  10. Kim, Y.; Kang, S.; Oh, N.; Lee, H.; Lee, S.; Park, J.; Kim, H. Improved Sensitivity in Schottky Contacted Two-Dimensional MoS2 Gas Sensor. ACS Appl. Mater. Interfaces 2019, 11, 38902–38909. [Google Scholar] [CrossRef]
  11. Sun, Y.; Zhang, L.; Zhang, R. Progress in Preparation of Molybdenum Disulfide and its Application in Electrochemical Sensors. Hua Xue Shi Ji 2022, 44, 1063–1070. [Google Scholar]
  12. Meng, S.; Li, H.; Huang, C.; Zhang, C.; Jiang, C.; Li, W.; Xiao, X. MoS2 field-effect transistor-based biosensor for label-free detection. J. Light Scatt. 2023, 35, 135–141. [Google Scholar]
  13. Long, L.; Zhiyan, F.; Zhongzhou, D.; Tao, H.; Hu, C. Transition metal disulfide (MoTe2, MoSe2 and MoS2) were modified to improve NO2 gas sensitivity sensing. J. Ind. Eng. Chem. 2023, 118, 533–543. [Google Scholar]
  14. Ruijuan, D.; Wei, W. Adsorption of gas molecule on Rh, Ru doped monolayer MoS2 for gas sensing applications: A DFT study. Chem. Phys. Lett. 2022, 789, 139300. [Google Scholar]
  15. Wang, Z.; Zhang, T.; Zhao, C.; Han, T.; Fei, T.; Liu, S.; Lu, G. Rational synthesis of molybdenum disulfide nanoparticles decorated reduced graphene oxide hybrids and their application for high-performance NO2 sensing. Sens. Actuators B Chem. 2018, 260, 508–518. [Google Scholar] [CrossRef]
  16. Eda, G.; Yamaguchi, H.; Voiry, D.; Fujita, T.; Chen, M.; Chhowalla, M. Photoluminescence from chemically exfoliated MoS2. Nano Lett. 2011, 11, 5111–5116. [Google Scholar] [CrossRef]
  17. Hai, L.; Zongyou, Y.; Qiyuan, H.; Li, H.; Huang, X.; Lu, G.; Fam, D.W.H.; Tok, A.I.Y.; Zhang, Q.; Zhang, H. Fabrication of single- and multilayer MoS2 film-based field-effect transistors for sensing NO at room temperature. Small 2012, 8, 63–67. [Google Scholar]
  18. Li, L.; Wan, K.; Wang, Q.; Yang, A.; Yuan, H.; Wang, X.; Rong, M. Study on Sensitivity Characteristic of Decomposed Gas of MoS2 Sensor with Insulating Medium Feature. High Volt. Appar. 2021, 57, 36–43. [Google Scholar]
  19. Wenbo, L.; Rong, Q.; Shangjun, Z.; Hong, J.; Cheng, S.; Yueqin, Z. MoS2 with Different Morphologies: Preparation and Gas-sensing Property of NH3. J. Inorg. Mater. 2022, 37, 1135–1140. [Google Scholar]
  20. Shen, J.; Yang, Z.; Wang, Y.; Xu, L.-C.; Liu, R.; Liu, X. The gas sensing performance of borophene/MoS2 heterostructure. Appl. Surf. Sci. 2020, 504, 144412. [Google Scholar] [CrossRef]
  21. Xin, B.; Si-Jie, B.; Xiang-Feng, C.; Shi-Ming, L.; Chun-Shui, W.; Yu-Ying, B. Preparation and Gas⁃Sensing Properties of MoS2/Cd2SnO4 Composite Materials. Chin. J. Inorg. Chem. 2022, 38, 2173–2180. [Google Scholar]
  22. Lizhai, Z.; Chuangbei, M.; Jinniu, Z.; Huang, Y.; Xu, H.; Lu, H.; Xu, K.; Ma, F. Enhanced NO2-sensing performances of CeO2 nanoparticles on MoS2 at room temperature. Appl. Surf. Sci. 2022, 600, 154157. [Google Scholar]
  23. Hemalatha, P.; Jolly, B.; Amer, R.A.; Elhadrami, E.C.; Al-Thani, N.J. Comparative Study on Gas-Sensing Properties of 2D (MoS2, WS2)/PANI Nanocompositesb-Based Sensor. Nanomaterials 2022, 12, 4423. [Google Scholar]
  24. Zhang, M.; Shao, C.; Guo, Z.; Zhang, Z.; Mu, J.; Cao, T.; Liu, Y. Hierarchical nanostructures of copper (II) phthalocyanine on electrospun TiO2 nanofibers: Controllable solvothermal-fabrication and enhanced visible photocatalytic properties. ACS Appl. Mater. Interfaces 2011, 3, 369–377. [Google Scholar] [CrossRef]
  25. Wang, H.; Xu, X.; Shaymurat, T. Effect of Different Solvents on Morphology and Gas-Sensitive Properties of Grinding-Assisted Liquid-Phase-Exfoliated MoS2 Nanosheets. Nanomaterials 2022, 12, 4485. [Google Scholar] [CrossRef]
  26. Xu, X.; Wang, H.; Talgar, S.; Peng, M. Preparation and humidity sensitive properties of cobaltphthalocyanine micro-nanowires. Electron. Compon. Mater. 2022, 41, 164–169. [Google Scholar]
  27. Huang, J.; Jiang, D.; Zhou, J.; Ye, J.; Sun, Y.; Li, X.; Geng, Y.; Wang, J.; Du, Y.; Qian, Z. Visible light-activated room temperature NH3 sensor base on CuPc-loaded ZnO nanorods. Sens. Actuators B Chem. 2021, 327, 128911. [Google Scholar] [CrossRef]
  28. Ikram, M.; Liu, L.; Liu, Y.; Ma, L.; Lv, H.; Ullah, M.; He, L.; Wu, H.; Wang, R.; Shi, K. Fabrication and characterization of a high-surface area MoS2@WS2 heterojunction for the ultra-sensitive NO2 detection at room temperature. J. Mater. Chem. A 2019, 7, 14602–14612. [Google Scholar] [CrossRef]
  29. Deng, D.R.; Wu, Q.H. Raman spectroscopy of copper phthalocyanine /graphene and 2, 3, 5, 6-tetrafluoro-tetracyano-quino-dimethane/graphene interfaces. Surf. Interface Anal. 2021, 53, 466–472. [Google Scholar] [CrossRef]
  30. Han, Y.; Huang, D.; Ma, Y.; He, G.; Hu, J.; Zhang, J.; Hu, N.; Su, Y.; Zhou, Z.; Zhang, Y.; et al. Design of hetero-nanostructures on MoS2 nanosheets to boost NO2 room-temperature sensing. ACS Appl. Mater. Interfaces 2018, 10, 22640–22649. [Google Scholar] [CrossRef]
  31. Bai, X.; Lv, H.; Liu, Z.; Chen, J.K.; Wang, J.; Sun, B.H.; Zhang, Y.; Wang, R.H.; Shi, K.Y. Thin-layered MoS2 nanoflakes vertically grown on SnO2 nanotubes as highly effective room-temperature NO2 gas sensor. Hazard. Mater. 2021, 416, 125830. [Google Scholar] [CrossRef] [PubMed]
  32. Shen, C.; Xu, N.; Guan, R.; Yue, L.; Zhang, W. Highly sensitive ethanol gas sensor based on In2O3 spheres. Ionics 2021, 27, 3647–3653. [Google Scholar] [CrossRef]
  33. Mishra, R.K.; Choi, G.J.; Choi, H.J.; Gwag, J.S. ZnS Quantum Dot Based Acetone Sensor for Monitoring Health-Hazardous Gases in Indoor/Outdoor Environment. Micromachines 2021, 12, 598. [Google Scholar] [CrossRef]
  34. Zhang, D.; Mi, Q.; Wang, D.; Li, T. MXene/Co3O4 composite based formaldehyde sensor driven by ZnO/MXene nanowire arrays piezoelectric nanogenerator. Sens. Actuators B Chem. 2021, 339, 129923. [Google Scholar] [CrossRef]
  35. Lichtenstein, A.; Havivi, E.; Shacham, R.; Hahamy, E.; Leibovich, R.; Pevzner, A.; Krivitsky, V.; Davivi, G.; Presman, I.; Elnathan, R.; et al. Supersensitive fingerprinting of explosives by chemically modified nanosensors arrays. Nat. Commun. 2014, 5, 4195. [Google Scholar] [CrossRef]
  36. Sun, Q.; Wu, Z.; Cao, Y.; Guo, J.; Long, M.; Duan, H.; Jia, D. Chemiresistive sensor arrays based on noncovalently functionalized multi-walled carbon nanotubes for ozone detection. Sens. Actuators B Chem. 2019, 297, 126689. [Google Scholar] [CrossRef]
  37. Chen, Z.; Yang, Y.; Xie, Y.; Guo, B.; Hu, Z. Non-contact crack detection of high-speed blades based on principal component analysis and Euclidian angles using optical-fiber sensors. Sens. Actuators A Phys. 2013, 201, 66–72. [Google Scholar] [CrossRef]
  38. Qingyu, L.; Dengwang, L.; Wei, T. SnO2 quantum dots modified MoS2nanoflowers for enhanced ethanol sensing performance. Vacuum 2023, 213, 112168. [Google Scholar]
  39. Jianhua, Z.; Tingting, L.; Jingyu, G.; Hu, Y.; Zhang, D. Two-step hydrothermal fabrication of CeO2-loaded MoS2 nanoflowers for ethanol gas sensing application. Appl. Surf. Sci. 2021, 568, 150942. [Google Scholar]
  40. Song, Z.; Zhang, J.; Jiang, J. Morphological evolution, luminescence properties and a highsensitivity ethanol gas sensor based on 3D flower-like MoS2-ZnO micro/nanosphere arrays. Ceram. Int. 2020, 46, 6636–6640. [Google Scholar]
  41. Singh, S.; Raj, S.; Sharma, S. Ethanol sensing using MoS2/TiO2 composite prepared via hydrothermal method. Mater. Today Proc. 2021, 46, 6083–6086. [Google Scholar] [CrossRef]
  42. Priyanka, D.; Samaresh, D.; Saakshi, D. Wafer-Scale Synthesized MoS2/Porous Silicon Nanostructures for Efficient and Selective Ethanol Sensing at Room Temperature. ACS Appl. Mater. Interfaces 2017, 9, 21017–21024. [Google Scholar]
  43. Ali, A.; Wu, D.; Jianqiao, L.; Fu, C.; Wang, J.; Chu, X. The detection of ethanol vapors based on a p-type gas sensor fabricated from heterojunction MoS2-NiCo2O4. Mater. Chem. Phys. 2022, 282, 125964. [Google Scholar]
  44. Ma, H.; Yang, R.; Li, C.; Han, Y. Fabrication and Characteristics of MoS2 nanosheets on Photo-sensing and Gas-sensing. Mater. Rep. 2018, 32, 860–864. [Google Scholar]
  45. Liu, L.; Yang, W.; Zhang, H.; Yan, X.; Liu, Y. Ultra-High Response Detection of Alcohols Based on CdS/MoS2 Composite. Nanoscale Res. Lett. 2022, 17, 7. [Google Scholar] [CrossRef] [PubMed]
  46. Kato, H.; Takemura, S.; Watanabe, Y.; Ishii, A.; Tsuchida, I.; Akai, Y.; Sugiyama, T.; Hiramatsu, T.; Nanba, N.; Nishikawa, O.; et al. X-ray photoemission spectroscopy and Fourier transform infrared studies of electrochemical doping of copper phthalocyanine molecule in conducting polymer. J. Vac. Sci. Technol. A 2007, 25, 1147. [Google Scholar] [CrossRef]
  47. Sun, Q.; Wu, Z.; Zhang, M.; Qin, Z.; Cao, S.; Zhong, F.; Li, S.; Duan, H.M.; Zhang, J. Improved Gas-Sensitive Properties by a Heterojunction of Hollow Porous Carbon Microtubes Derived from Sycamore Fibers. ACS Sustain. Chem. Eng. 2021, 9, 14345–14352. [Google Scholar] [CrossRef]
Figure 1. Schematic of sensing test system.
Sensors 23 09321 g001
Figure 2. SEM image of 2D-MoS2/1D-CuPc heterojunction: (a) a weight ratio of 20:3 (3-CM); (b) a weight ratio of 20:5 (5-CM); (c,d) a weight ratio of 20:7 (7-CM); (e,f) weight ratios of 20:10 (10-CM) and 20:20 (20-CM), respectively.
Sensors 23 09321 g002
Figure 3. XRD patterns of CuPc, MoS2 NSs, and 2D-MoS2/1D-CuPc heterojunction (7-CM).
Sensors 23 09321 g003
Figure 4. Raman spectra of 3-CM, 5-CM, 7-CM, 10-CM, and 20-CM. (a) Enlargement of the MoS2 peaks E 2 g 1 and A 1 g and (b) Enlargement of the MoS2 peaks from 1360 cm−1 to 1680 cm−1.
Sensors 23 09321 g004
Figure 5. XPS spectra of (a) Mo 3d and (b) S 2p of the different samples.
Sensors 23 09321 g005
Figure 6. (a) Fourier transform infrared spectra of CuPc, MoS2 NSs, 3-CM, 5-CM, 7-CM, 10-CM, and 20-CM. (b) Local magnification of figure (a).
Sensors 23 09321 g006
Figure 7. Response curves of MoS2-, 3-CM-, 5-CM-, 7-CM-, 10-CM-, and 20-CM-based sensors to 1000 ppm CH2O, C3H6O, C2H6O, and 98% RH at room temperature.
Sensors 23 09321 g007
Figure 8. (a) Mean response; (b) response time; and (c) recovery time for MoS2, 3-CM, 5-CM, 7-CM, 10-CM, and 20-CM sensors to 1000 ppm CH2O, C3H6O, C2H6O, and 98% RH.
Sensors 23 09321 g008
Figure 9. Three-dimensional PCA plot derived from the average response of MoS2, 3-CM, 5-CM, 7-CM, 10-CM, and 20-CM sensors.
Sensors 23 09321 g009
Figure 10. Characteristic fingerprints derived from kinetic and thermodynamic parameters from (a) CH2O, (b) C3H6O, (c) C2H6O, and (d) 98% RH at 1000 ppm at room temperature.
Sensors 23 09321 g010
Figure 11. (a) Sensing curves of the 7-CM sensor to different concentrations of C3H6O; (b) fitted plots of the response vs. C3H6O concentration; (c) sensing curves of the 7-CM sensor to different concentrations of C2H6O; (d) fitted plots of the response vs. C2H6O concentration.
Sensors 23 09321 g011
Figure 12. I–V curves of MoS2-, 3-CM-, 5-CM-, 7-CM-, 10-CM-, and 20-CM-based sensors.
Sensors 23 09321 g012
Figure 13. Schematic diagrams of (a) the band structure of MoS2 and CuPc; (b) the gas-sensing mechanism of MoS2/CuPc composites in the air; (c) the gas-sensing mechanism of MoS2/CuPc composites in ethanol; (d) the band structure of MoS2/CuPc composites in the air; (e) the band structure of MoS2/CuPc composites in ethanol.
Sensors 23 09321 g013
Table 1. Comparison of C2H6O-sensing performance using different sensors.
MaterialsWorking
Temperature
Concentration
(ppm)
ResponseRes/Rec Time (s)Ref.
SnO2QD/MoS2180 °C500.4925/85 [38]
MoS2/CeO2RT507.787/5 [39]
3D(MoS2)/ZnO220 °C50012.0830/10 [40]
MoS2/TiO2350 °C1000.6252/155 [41]
MoS2/PSiRT400.17---[42]
MoS2/NiCo2O4170 °C1009.0015/6[43]
MoS2NanosheetsRT1141.142.4/29[44]
CdS/MoS2210 °C1000.9520/9[45]
2D-MoS2/1D-CuPcRT100710.42<10/<4This work
50497.69
Disclaimer/Publisher’s Note: The statements, opinions and data contained in all publications are solely those of the individual author(s) and contributor(s) and not of MDPI and/or the editor(s). MDPI and/or the editor(s) disclaim responsibility for any injury to people or property resulting from any ideas, methods, instructions or products referred to in the content.

