
Wind Energy Harvesting with Vertically Aligned Piezoelectric Inverted Flags


Abstract
:1. Introduction
2. Materials and Methods
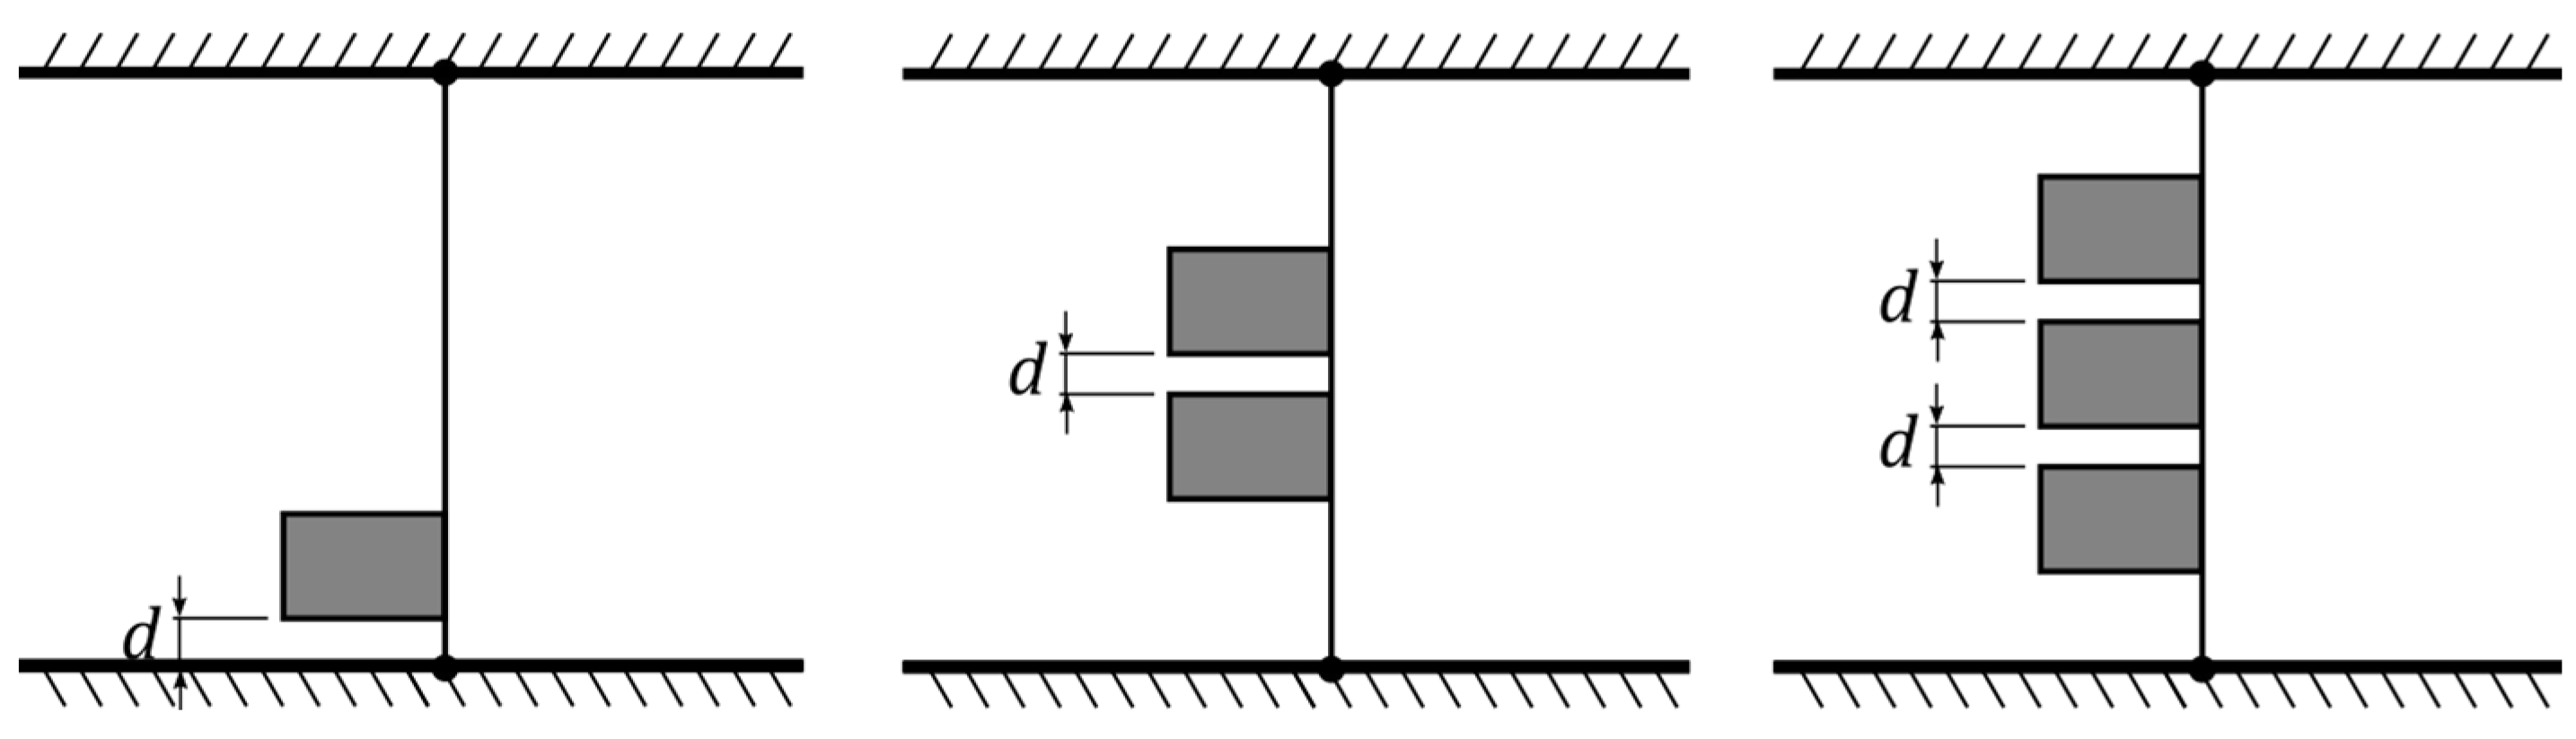
2.1. Flags Tested
2.2. Experimental Setup
2.3. Conducted Tests
3. Results and Discussion
3.1. Overview
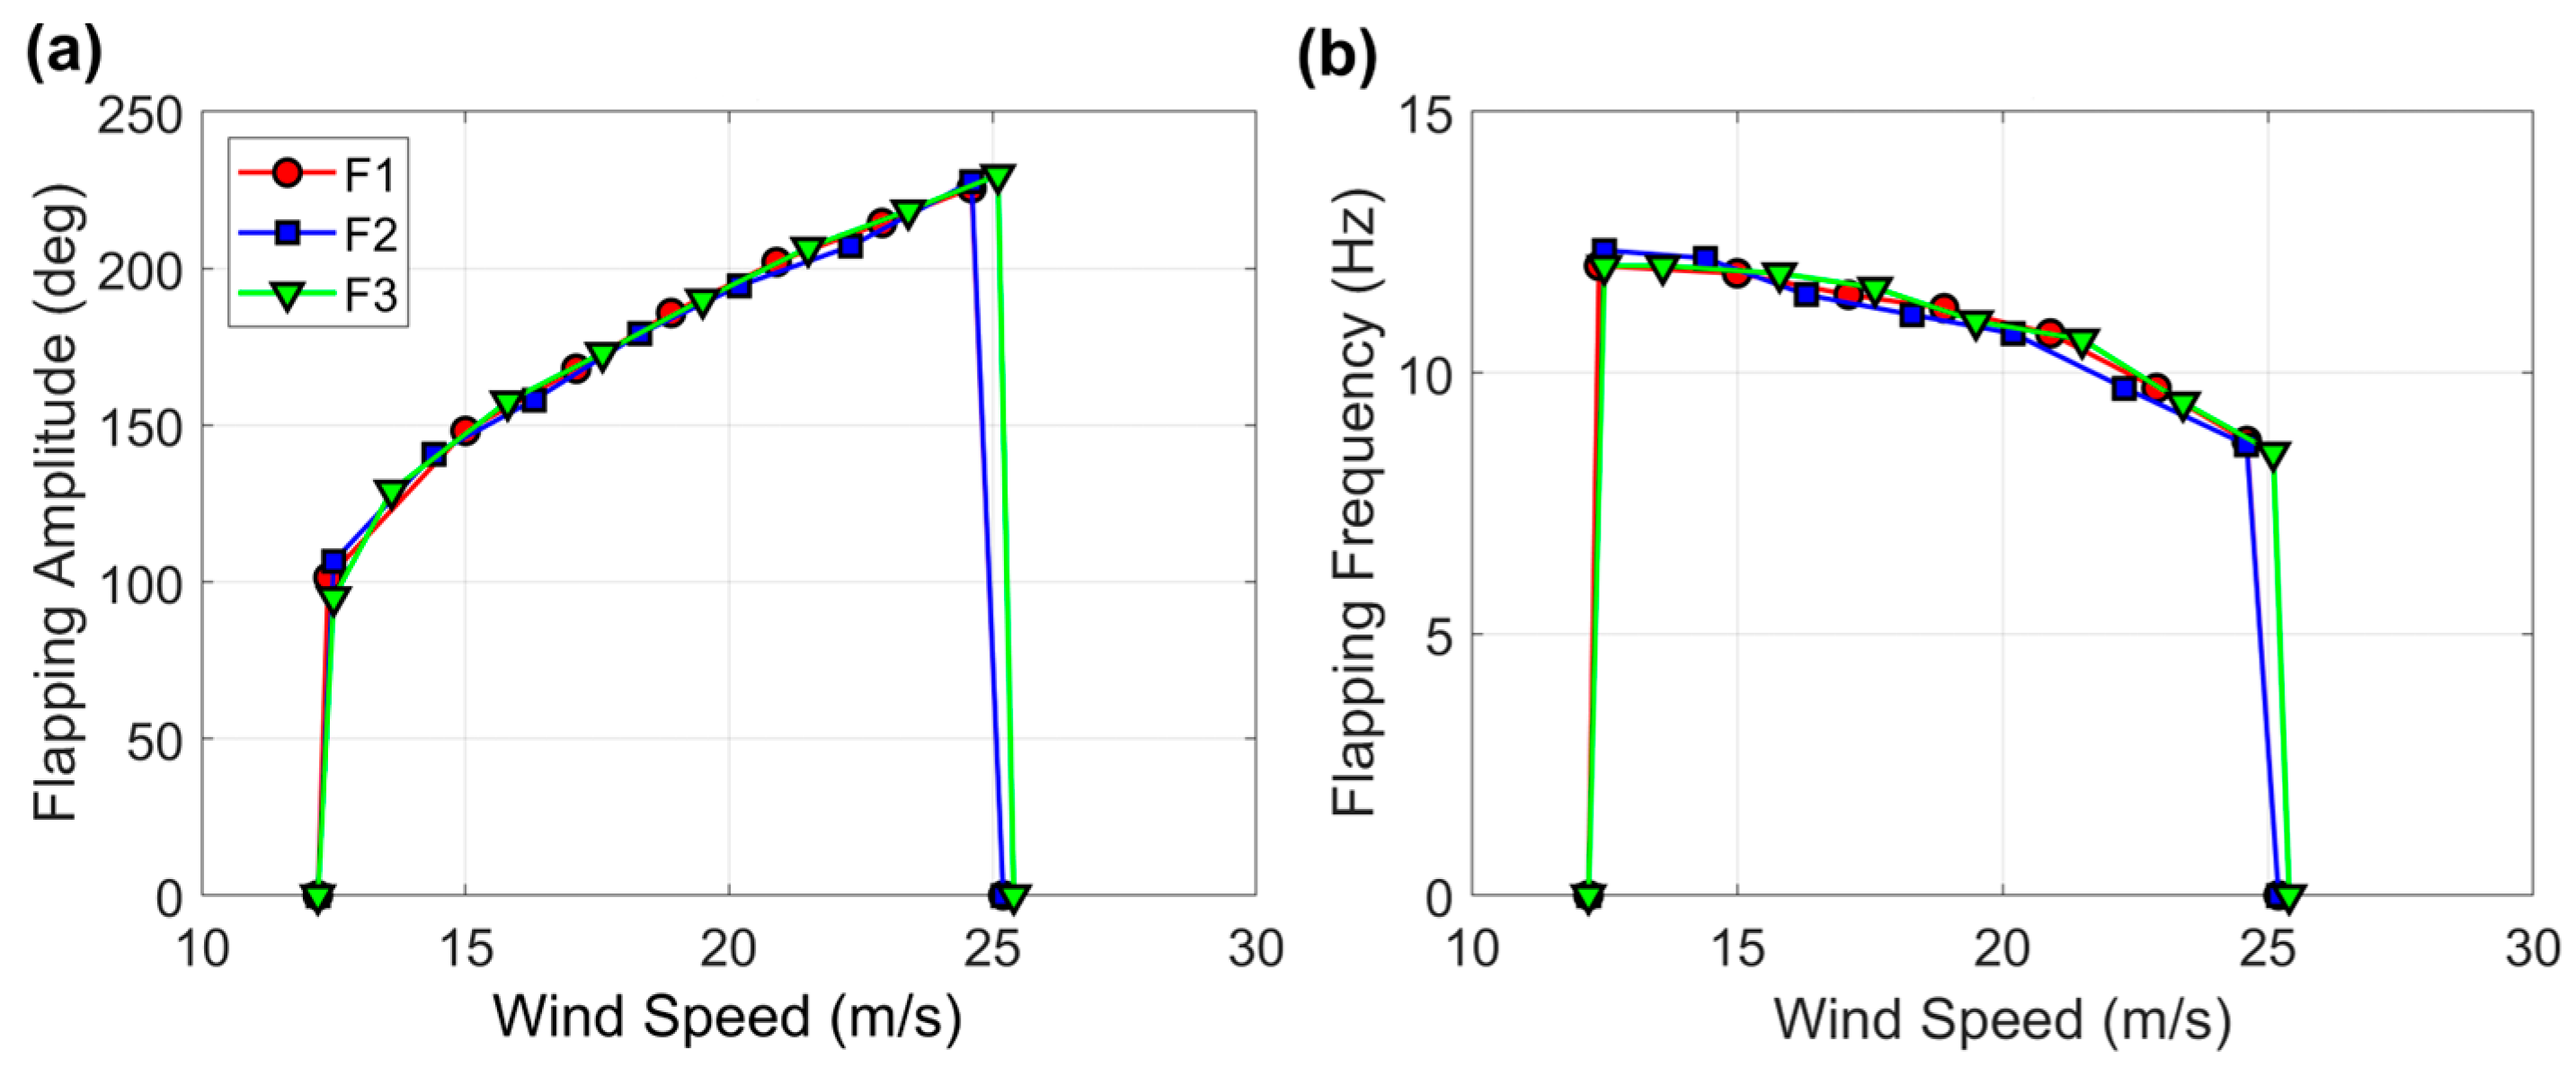
3.2. Baseline Flags
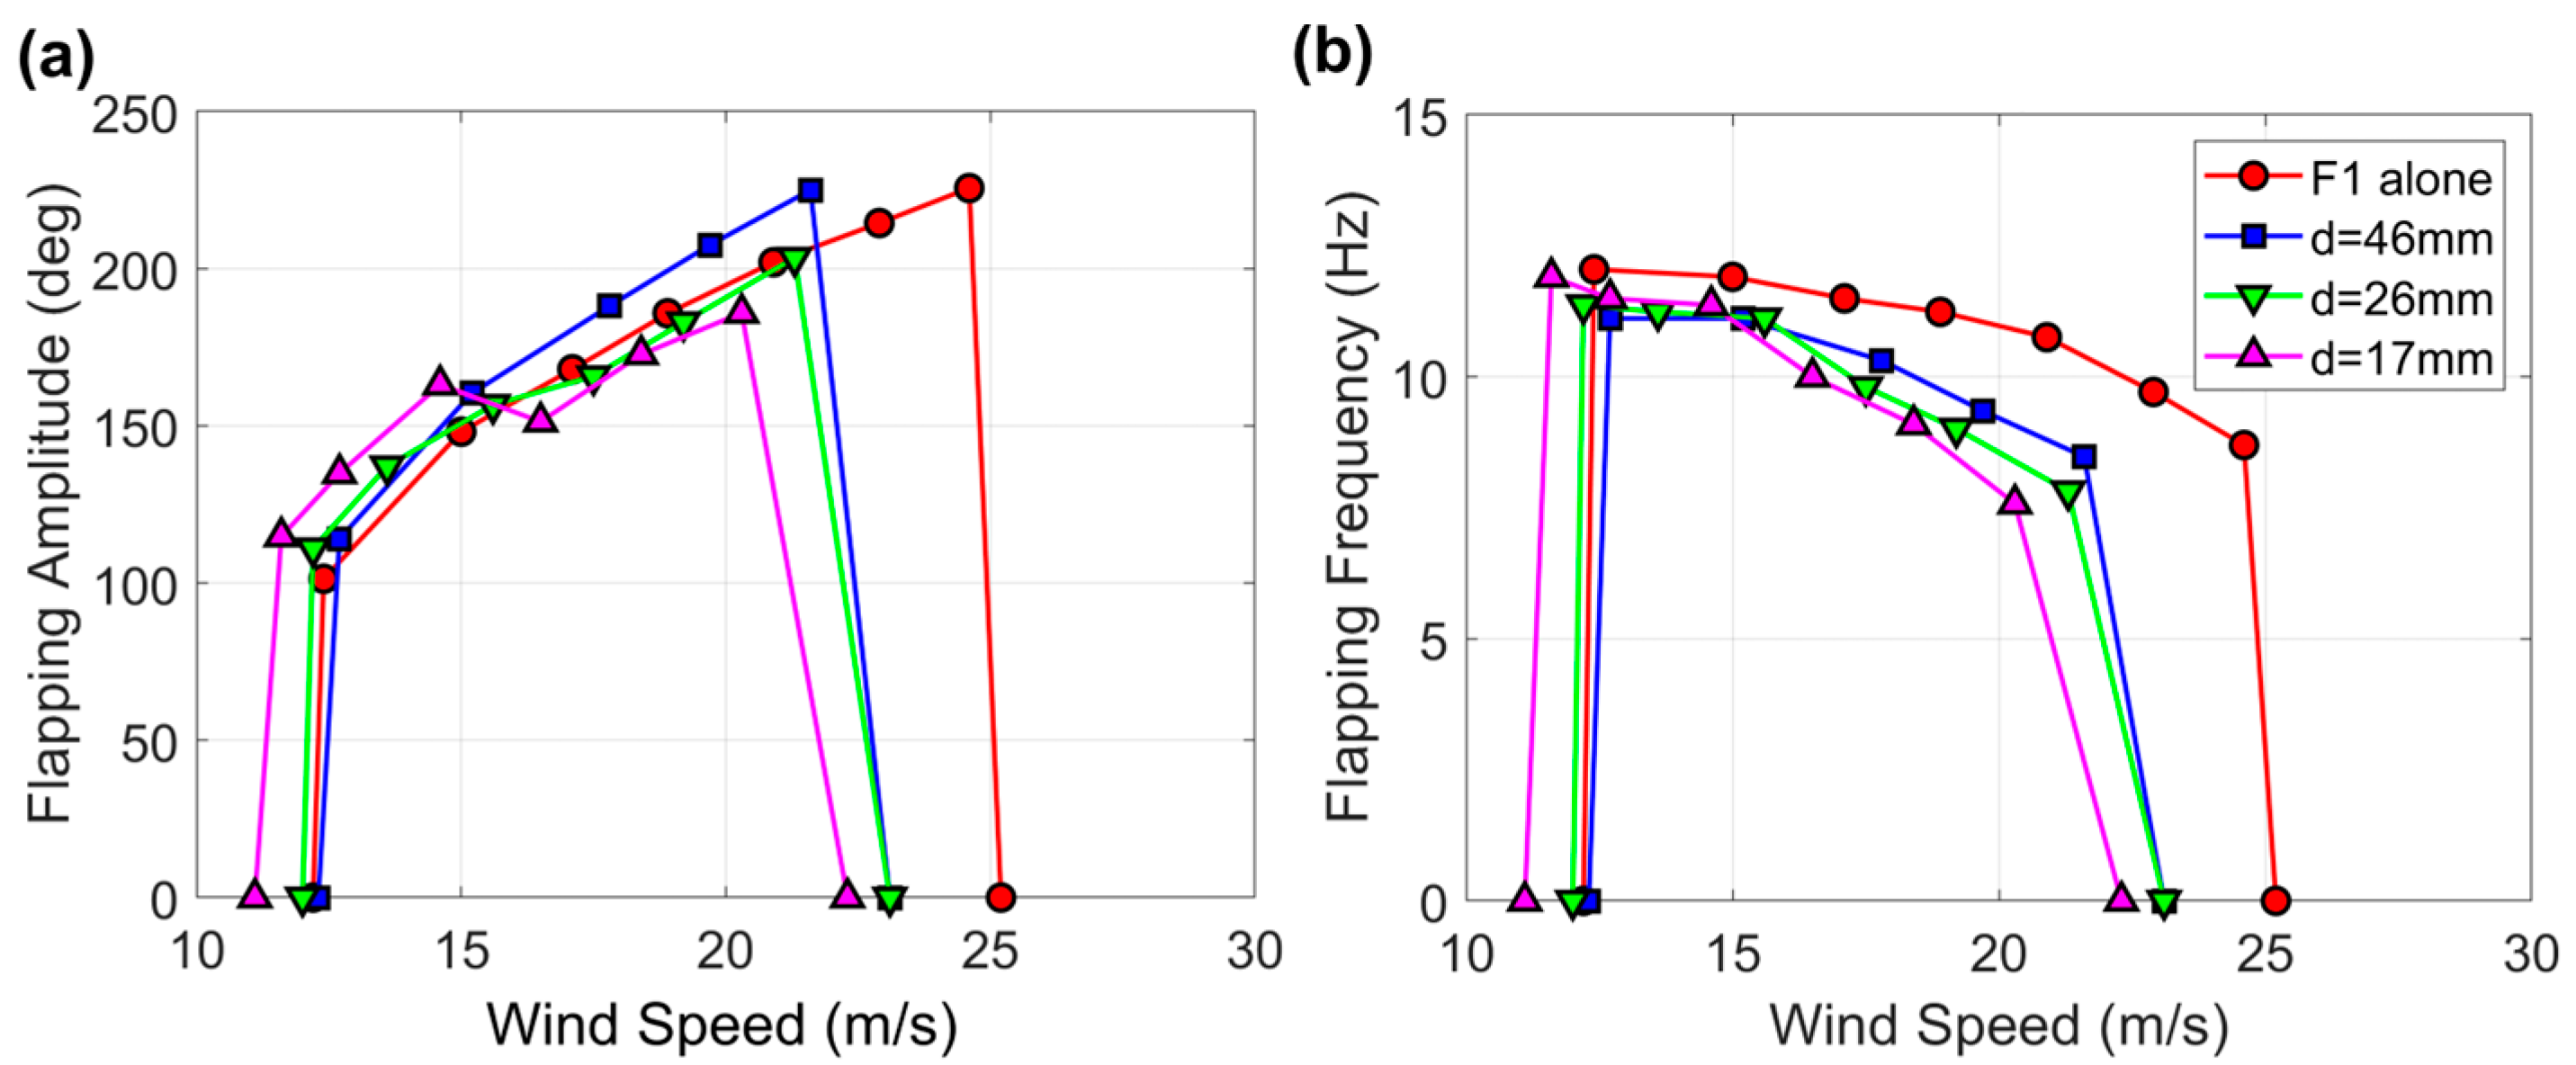
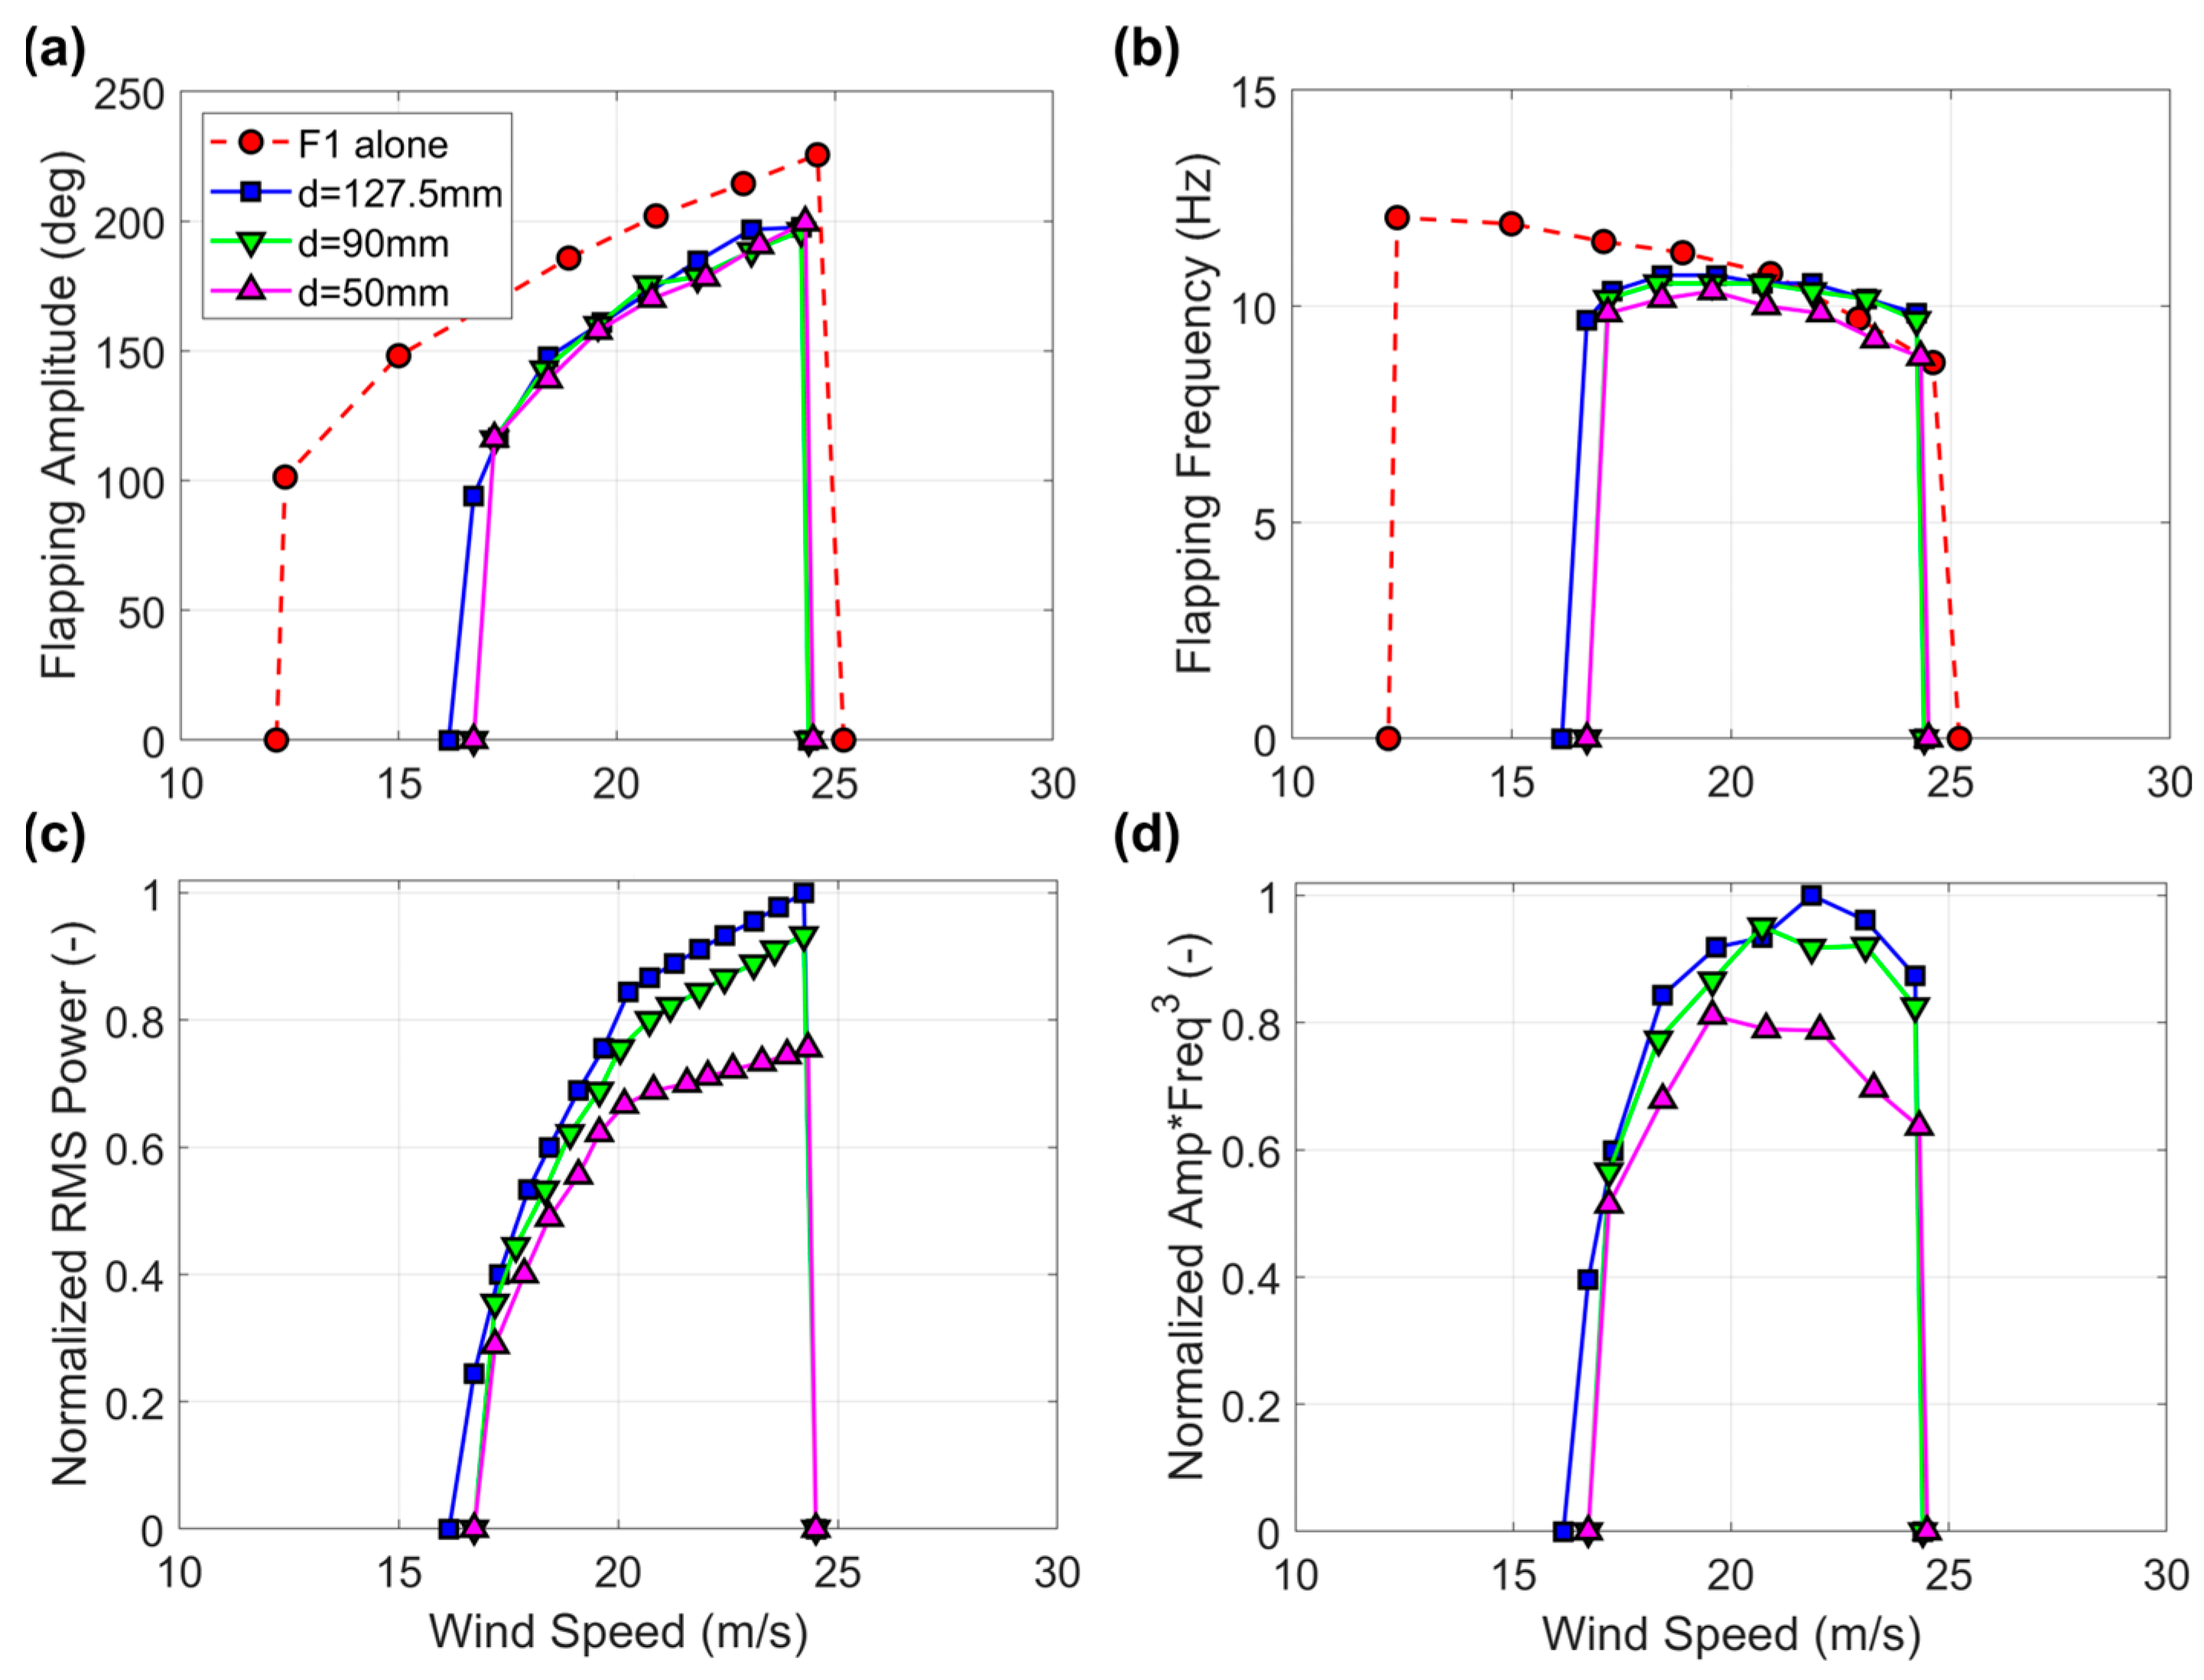
3.3. Harvester Flags
4. Concluding Remarks
Author Contributions
Funding
Institutional Review Board Statement
Informed Consent Statement
Data Availability Statement
Acknowledgments
Conflicts of Interest
References
- Karim, M.E.; Munir, A.B.; Karim, M.A.; Muhammad-Sukki, F.; Abu-Bakar, S.H.; Sellami, N.; Bani, N.A.; Hassan, M.Z. Energy revolution for our common future: An evaluation of the emerging international renewable energy law. Energies 2018, 11, 1769. [Google Scholar] [CrossRef]
- Zhao, G. Wireless Sensor Networks for Industrial Process Monitoring and Control: A Survey. Netw. Protoc. Algorithms 2011, 3, 46–63. [Google Scholar] [CrossRef]
- Avci, O.; Abdeljaber, O.; Kiranyaz, S.; Hussein, M.; Inman, D.J. Wireless and real-time structural damage detection: A novel decentralized method for wireless sensor networks. J. Sound Vib. 2018, 424, 158–172. [Google Scholar] [CrossRef]
- Yi, W.Y.; Lo, K.M.; Mak, T.; Leung, K.S.; Leung, Y.; Meng, M.L. A Survey of Wireless Sensor Network Based Air Pollution Monitoring Systems. Sensors 2015, 15, 31392–31427. [Google Scholar] [CrossRef] [PubMed]
- Adu-Manu, K.S.; Tapparello, C.; Heinzelman, W.; Katsriku, F.A.; Abdulai, J.D. Water quality monitoring using wireless sensor networks: Current trends and future research directions. ACM Trans. Sens. Netw. (TOSN) 2017, 13, 1–41. [Google Scholar] [CrossRef]
- Bouabdellah, K.; Noureddine, H.; Larbi, S. Using Wireless Sensor Networks for Reliable Forest Fires Detection. Procedia Comput. Sci. 2013, 19, 794–801. [Google Scholar] [CrossRef]
- Vera-Amaro, R.; Angeles, M.E.R.; Luviano-Juarez, A. Design and Analysis of Wireless Sensor Networks for Animal Tracking in Large Monitoring Polar Regions Using Phase-Type Distributions and Single Sensor Model. IEEE Access 2019, 7, 45911–45929. [Google Scholar] [CrossRef]
- Erdelj, M.; Król, M.; Natalizio, E. Wireless Sensor Networks and Multi-UAV systems for natural disaster management. Comput. Netw. 2017, 124, 72–86. [Google Scholar] [CrossRef]
- Ojha, T.; Misra, S.; Raghuwanshi, N.S. Wireless sensor networks for agriculture: The state-of-the-art in practice and future challenges. Comput. Electron. Agric. 2015, 118, 66–84. [Google Scholar] [CrossRef]
- Tarannum, S.; Farheen, S. Wireless sensor networks for healthcare monitoring: A review. In Inventive Computation Technologies 4; Springer: Berlin/Heidelberg, Germany, 2020; pp. 669–676. [Google Scholar]
- Tan, T.; Yan, Z.; Zou, H.; Ma, K.; Liu, F.; Zhao, L.; Peng, Z.; Zhang, W. Renewable energy harvesting and absorbing via multi-scale metamaterial systems for Internet of things. Appl. Energy 2019, 254, 113717. [Google Scholar] [CrossRef]
- Ottman, G.; Hofmann, H.; Bhatt, A.; Lesieutre, G. Adaptive piezoelectric energy harvesting circuit for wireless remote power supply. IEEE Trans. Power Electron. 2002, 17, 669–676. [Google Scholar] [CrossRef]
- Sudevalayam, S.; Kulkarni, P. Energy Harvesting Sensor Nodes: Survey and Implications. IEEE Commun. Surv. Tutor. 2010, 13, 443–461. [Google Scholar] [CrossRef]
- Priya, S. Advances in energy harvesting using low profile piezoelectric transducers. J. Electroceramics 2007, 19, 167–184. [Google Scholar] [CrossRef]
- Cleante, V.G.; Brennan, M.J.; Gatti, G.; Thompson, D.J. Energy harvesting from the vibrations of a passing train: Effect of speed variability. In Journal of Physics: Conference Series; IOP Publishing: Bristol, UK, 2016. [Google Scholar]
- Zhao, X.; Xiang, H.; Shi, Z. Piezoelectric energy harvesting from vehicles induced bending deformation in pavements considering the arrangement of harvesters. Appl. Math. Model. 2020, 77, 327–340. [Google Scholar] [CrossRef]
- Qian, F.; Xu, T.-B.; Zuo, L. Piezoelectric energy harvesting from human walking using a two-stage amplification mechanism. Energy 2019, 189, 116140. [Google Scholar] [CrossRef]
- Abdelkareem, M.A.; Xu, L.; Ali, M.K.A.; Elagouz, A.; Mi, J.; Guo, S.; Liu, Y.; Zuo, L. Vibration energy harvesting in automotive suspension system: A detailed review. Appl. Energy 2018, 229, 672–699. [Google Scholar] [CrossRef]
- Truitt, A.; Mahmoodi, S.N. A review on active wind energy harvesting designs. Int. J. Precis. Eng. Manuf. 2013, 14, 1667–1675. [Google Scholar] [CrossRef]
- McCarthy, J.; Watkins, S.; Deivasigamani, A.; John, S. Fluttering energy harvesters in the wind: A review. J. Sound Vib. 2016, 361, 355–377. [Google Scholar] [CrossRef]
- Nabavi, S.; Zhang, L. Portable Wind Energy Harvesters for Low-Power Applications: A Survey. Sensors 2016, 16, 1101. [Google Scholar] [CrossRef]
- Younesian, D.; Alam, M.-R. Multi-stable mechanisms for high-efficiency and broadband ocean wave energy harvesting. Appl. Energy 2017, 197, 292–302. [Google Scholar] [CrossRef]
- Hoffmann, D.; Willmann, A.; Göpfert, R.; Becker, P.; Folkmer, B.; Manoli, Y. Energy Harvesting from Fluid Flow in Water Pipelines for Smart Metering Applications. In Journal of Physics: Conference Series; IOP Publishing: Bristol, UK, 2013. [Google Scholar]
- Wang, Y.; Duan, J.; Zhao, Y.; He, B.; Tang, Q. Harvest rain energy by polyaniline-graphene composite films. Renew. Energy 2018, 125, 995–1002. [Google Scholar] [CrossRef]
- Mariello, M.; Guido, F.; Mastronardi, V.; Todaro, M.; Desmaële, D.; De Vittorio, M. Nanogenerators for harvesting mechanical energy conveyed by liquids. Nano Energy 2019, 57, 141–156. [Google Scholar] [CrossRef]
- Haji, M.N.; Kluger, J.M.; Sapsis, T.P.; Slocum, A.H. A symbiotic approach to the design of offshore wind turbines with other energy harvesting systems. Ocean Eng. 2018, 169, 673–681. [Google Scholar] [CrossRef]
- Iqbal, M.; Khan, F.U. Hybrid vibration and wind energy harvesting using combined piezoelectric and electromagnetic conversion for bridge health monitoring applications. Energy Convers. Manag. 2018, 172, 611–618. [Google Scholar] [CrossRef]
- Zhao, L.; Yang, Y. An impact-based broadband aeroelastic energy harvester for concurrent wind and base vibration energy harvesting. Appl. Energy 2018, 212, 233–243. [Google Scholar] [CrossRef]
- Wang, J.; Nabawy, M.R.A.; Cioncolini, A.; Revell, A. Solar Panels as Tip Masses in Low Frequency Vibration Harvesters. Energies 2019, 12, 3815. [Google Scholar] [CrossRef]
- Silva-Leon, J.; Cioncolini, A.; Nabawy, M.R.; Revell, A.; Kennaugh, A. Simultaneous wind and solar energy harvesting with inverted flags. Appl. Energy 2019, 239, 846–858. [Google Scholar] [CrossRef]
- Cioncolini, A.; Nabawy, M.R.; Silva-Leon, J.; O’connor, J.; Revell, A. An Experimental and Computational Study on Inverted Flag Dynamics for Simultaneous Wind–Solar Energy Harvesting. Fluids 2019, 4, 87. [Google Scholar] [CrossRef]
- Nguyen, H.T.; Genov, D.; Bardaweel, H. Mono-stable and bi-stable magnetic spring based vibration energy harvesting systems subject to harmonic excitation: Dynamic modeling and experimental verification. Mech. Syst. Signal Process. 2019, 134, 106361. [Google Scholar] [CrossRef]
- Tang, X.; Zuo, L. Vibration energy harvesting from random force and motion excitations. Smart Mater. Struct. 2012, 21, 075025. [Google Scholar] [CrossRef]
- Yang, G.; Stark, B.H.; Hollis, S.J.; Burrow, S.G. Challenges for Energy Harvesting Systems Under Intermittent Excitation. IEEE J. Emerg. Sel. Top. Circuits Syst. 2014, 4, 364–374. [Google Scholar] [CrossRef]
- Brennan, M.J.; Gatti, G. Harvesting Energy From Time-Limited Harmonic Vibrations: Mechanical Considerations. J. Vib. Acoust. 2017, 139, 051019. [Google Scholar] [CrossRef]
- Maamer, B.; Boughamoura, A.; El-Bab, A.M.F.; Francis, L.A.; Tounsi, F. A review on design improvements and techniques for mechanical energy harvesting using piezoelectric and electromagnetic schemes. Energy Convers. Manag. 2019, 199, 111973. [Google Scholar] [CrossRef]
- Wang, J.; Nabawy, M.R.A.; Cioncolini, A.; Revell, A.; Weigert, S. Planform Geometry and Excitation Effects of PVDF-Based Vibration Energy Harvesters. Energies 2021, 14, 211. [Google Scholar] [CrossRef]
- Hirst, J.; Wang, J.; Nabawy, M.R.A.; Cioncolini, A. Long-term power degradation testing of piezoelectric vibration energy harvesters for low-frequency applications. Eng. Res. Express 2020, 2, 035026. [Google Scholar] [CrossRef]
- Ryu, J.; Park, S.G.; Kim, B.; Sung, H.J. Flapping dynamics of an inverted flag in a uniform flow. J. Fluids Struct. 2015, 57, 159–169. [Google Scholar] [CrossRef]
- Tang, C.; Liu, N.-S.; Lu, X.-Y. Dynamics of an inverted flexible plate in a uniform flow. Phys. Fluids 2015, 27, 073601. [Google Scholar] [CrossRef]
- Gurugubelli, P.S.; Jaiman, R.K. Self-induced flapping dynamics of a flexible inverted foil in a uniform flow. J. Fluid Mech. 2015, 781, 657–694. [Google Scholar] [CrossRef]
- Orrego, S.; Shoele, K.; Ruas, A.; Doran, K.; Caggiano, B.; Mittal, R.; Kang, S.H. Harvesting ambient wind energy with an inverted piezoelectric flag. Appl. Energy 2017, 194, 212–222. [Google Scholar] [CrossRef]
- Yang, K.; Nabawy, M.R.A.; Cioncolini, A.; Revell, A.; AlGhrairy, S. Planform geometry effects of piezoelectric wind energy harvesting composite inverted flags. Smart Mater. Struct. 2021, 30, 115014. [Google Scholar] [CrossRef]
- Yang, K.; Cioncolini, A.; Nabawy, M.R.A.; Revell, A. Mechanical Durability Assessment of an Energy-Harvesting Piezoelectric Inverted Flag. Energies 2021, 15, 77. [Google Scholar] [CrossRef]
- Huertas-Cerdeira, C.; Fan, B.; Gharib, M. Coupled motion of two side-by-side inverted flags. J. Fluids Struct. 2018, 76, 527–535. [Google Scholar] [CrossRef]
- Ryu, J.; Park, S.G.; Sung, H.J. Flapping dynamics of inverted flags in a side-by-side arrangement. Int. J. Heat Fluid Flow 2018, 70, 131–140. [Google Scholar] [CrossRef]
- Kim, H.; Kim, D. Stability and coupled dynamics of three-dimensional dual inverted flags. J. Fluids Struct. 2019, 84, 18–35. [Google Scholar] [CrossRef]
- Jia, K.; Fang, L.; Huang, W.-X. Coupled states of dual side-by-side inverted flags in a uniform flow. J. Fluids Struct. 2019, 91, 102768. [Google Scholar] [CrossRef]
- Hu, Y.-W.; Feng, L.-H.; Wang, J.-J. Passive oscillations of inverted flags in a uniform flow. J. Fluid Mech. 2020, 884, A32. [Google Scholar] [CrossRef]
- Hu, Y.-W.; Feng, L.-H.; Wang, J.-J. Flow-structure interactions of two parallel inverted flags with small separation distances in a water tunnel. J. Fluids Struct. 2020, 94, 102960. [Google Scholar] [CrossRef]
- Mazharmanesh, S.; Young, J.; Tian, F.-B.; Lai, J.C. Energy harvesting of two inverted piezoelectric flags in tandem, side-by-side and staggered arrangements. Int. J. Heat Fluid Flow 2020, 83, 108589. [Google Scholar] [CrossRef]
- Huang, H.; Wei, H.; Lu, X.-Y. Coupling performance of tandem flexible inverted flags in a uniform flow. J. Fluid Mech. 2018, 837, 461–476. [Google Scholar] [CrossRef]
- Hu, Y.-W.; Feng, L.-H.; Wang, J.-J. Flow-structure interactions of two tandem inverted flags in a water tunnel. Phys. Fluids 2020, 32, 087114. [Google Scholar] [CrossRef]
- Jia, L.-B.; Yin, X.-Z. Passive Oscillations of Two Tandem Flexible Filaments in a Flowing Soap Film. Phys. Rev. Lett. 2008, 100, 228104. [Google Scholar] [CrossRef]
- Ristroph, L.; Zhang, J. Anomalous Hydrodynamic Drafting of Interacting Flapping Flags. Phys. Rev. Lett. 2008, 101, 194502. [Google Scholar] [CrossRef]
- Feng, L.-H.; Hu, Y.-W.; Wang, J.-J. Flow-structure interactions of multiple inverted flags in different arrangements. Exp. Fluids 2021, 62, 254. [Google Scholar] [CrossRef]
- Al-Obaidi, A.S.M.; Madivaanan, G. Investigation of the Blockage Correction to Improve the Accuracy of Taylor’s Low-Speed Wind Tunnel. In Journal of Physics: Conference Series; IOP Publishing: Bristol, UK, 2022. [Google Scholar]
- Takeda, K.; Kato, M. Wind tunnel blockage effects on drag coefficient and wind-induced vibration. J. Wind. Eng. Ind. Aerodyn. 1992, 42, 897–908. [Google Scholar] [CrossRef]
- Mitcheson, P.D.; Yeatman, E.M.; Rao, G.K.; Holmes, A.S.; Green, T.C. Energy Harvesting From Human and Machine Motion for Wireless Electronic Devices. Proc. IEEE 2008, 96, 1457–1486. [Google Scholar] [CrossRef]


Disclaimer/Publisher’s Note: The statements, opinions and data contained in all publications are solely those of the individual author(s) and contributor(s) and not of MDPI and/or the editor(s). MDPI and/or the editor(s) disclaim responsibility for any injury to people or property resulting from any ideas, methods, instructions or products referred to in the content. |
© 2023 by the authors. Licensee MDPI, Basel, Switzerland. This article is an open access article distributed under the terms and conditions of the Creative Commons Attribution (CC BY) license (https://creativecommons.org/licenses/by/4.0/).
Share and Cite
Yang, K.; Cioncolini, A.; Revell, A.; Nabawy, M.R.A. Wind Energy Harvesting with Vertically Aligned Piezoelectric Inverted Flags. Sensors 2023, 23, 9673. https://doi.org/10.3390/s23249673
Yang K, Cioncolini A, Revell A, Nabawy MRA. Wind Energy Harvesting with Vertically Aligned Piezoelectric Inverted Flags. Sensors. 2023; 23(24):9673. https://doi.org/10.3390/s23249673
Chicago/Turabian StyleYang, Kaidong, Andrea Cioncolini, Alistair Revell, and Mostafa R. A. Nabawy. 2023. "Wind Energy Harvesting with Vertically Aligned Piezoelectric Inverted Flags" Sensors 23, no. 24: 9673. https://doi.org/10.3390/s23249673