
Real-Time Detection of an Undercarriage Based on Receptive Field Blocks and Coordinate Attention

Abstract
:1. Introduction
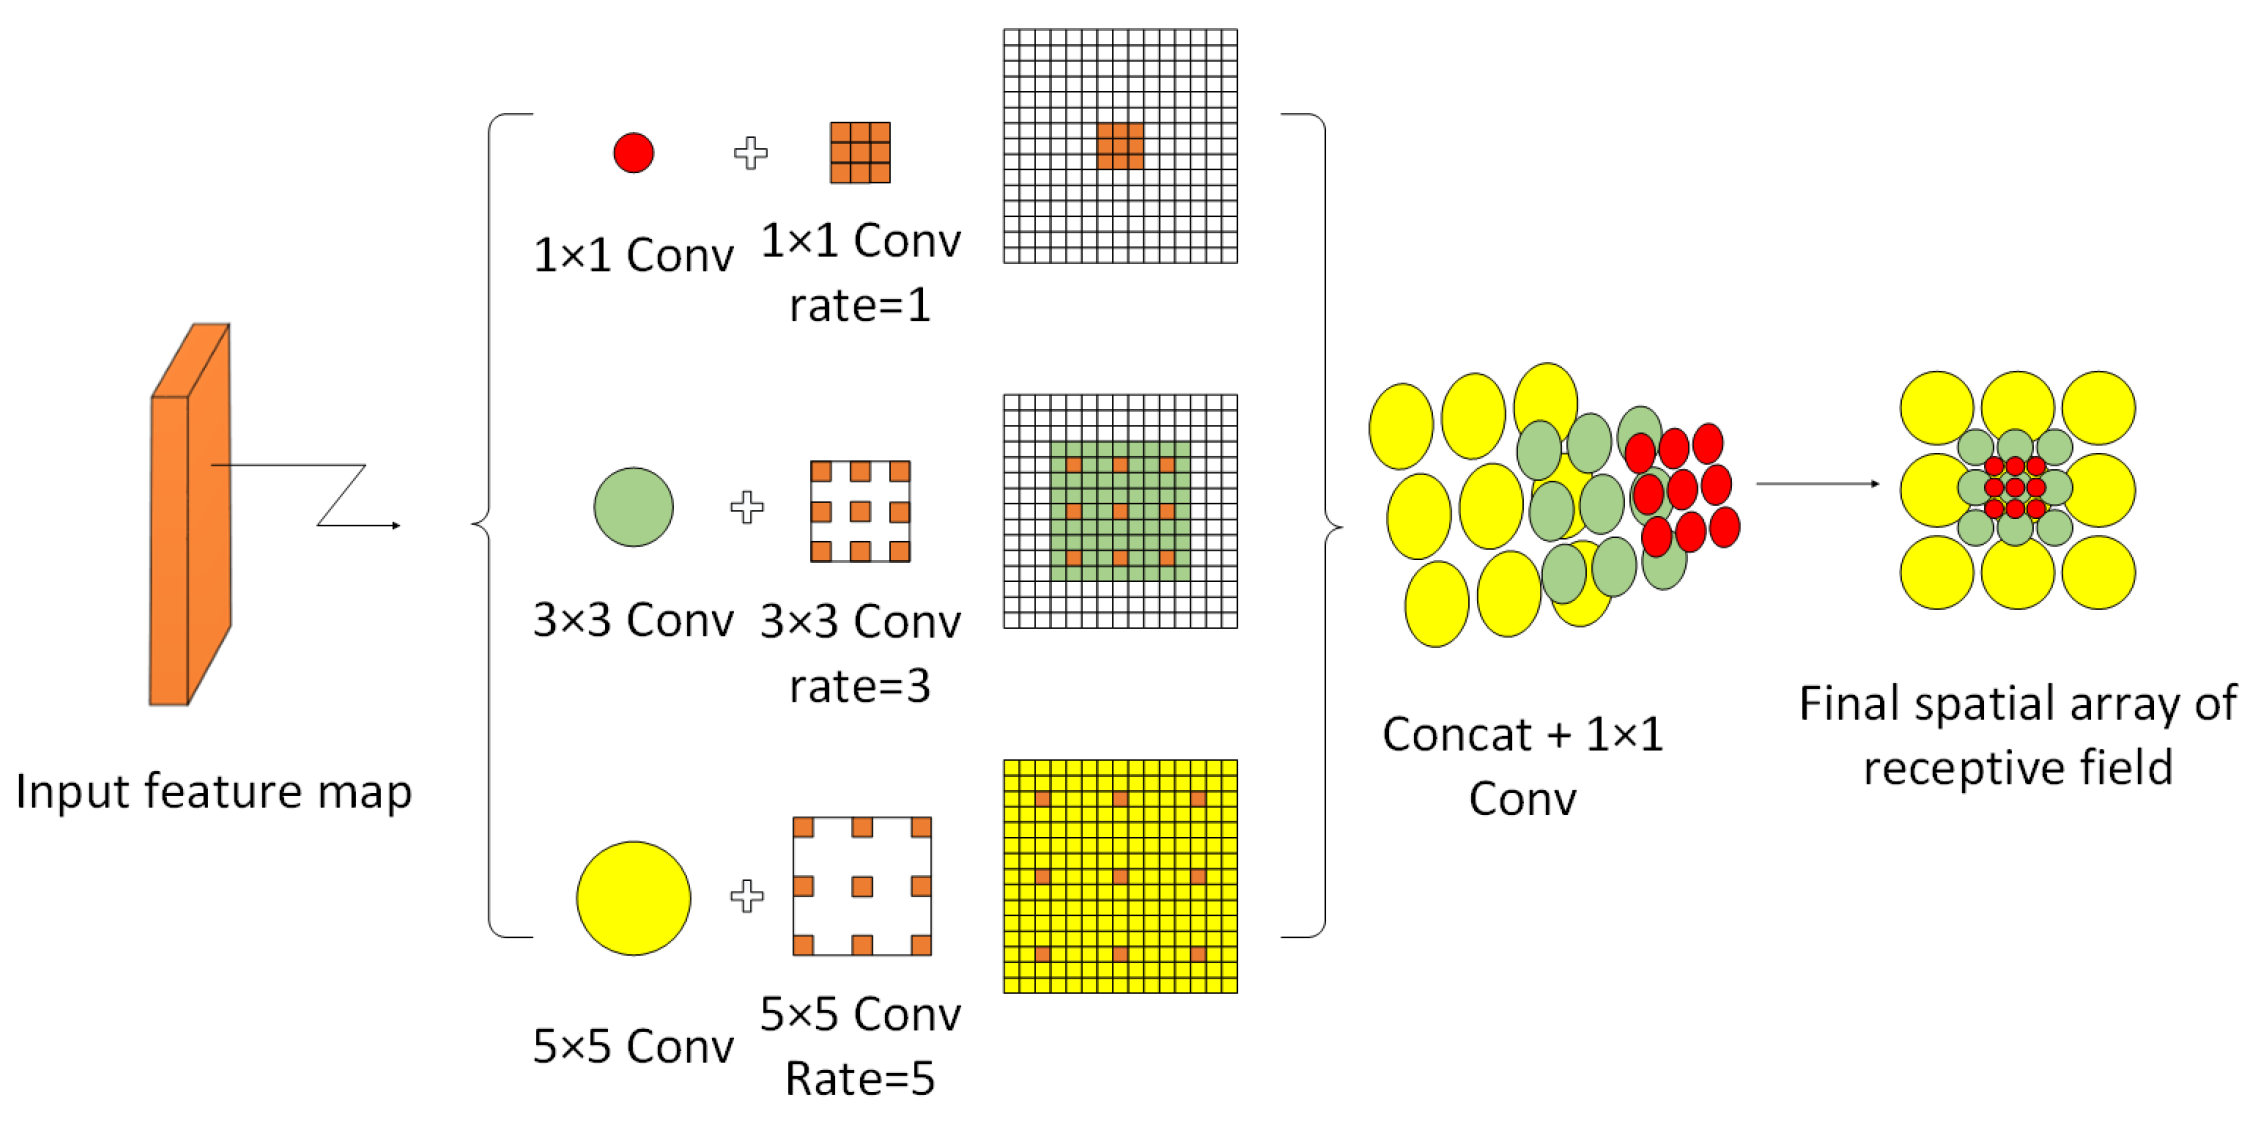
- Adding a Receptive Field Block to the backbone network to improve the feature map receptive field and fully extract multiscale features.
- Adding a coordinate attention mechanism to the feature fusion network to enhance the model’s focus on key information and improve the model’s detection precision.
- Introducing the SIOU loss function to accelerate model convergence and further improve model detection performance.
- Construct a dataset to validate the reliability and scientific validity of the improved model and design multiple sets of ablation experiments to verify the validity of each module based on the improvement points.
2. Related Work
2.1. Definition of Small Targets and Challenges
2.2. Small Targets Detection Methods
2.3. Problems with Undercarriage Inspection Systems
2.4. Research Object
3. Methodology
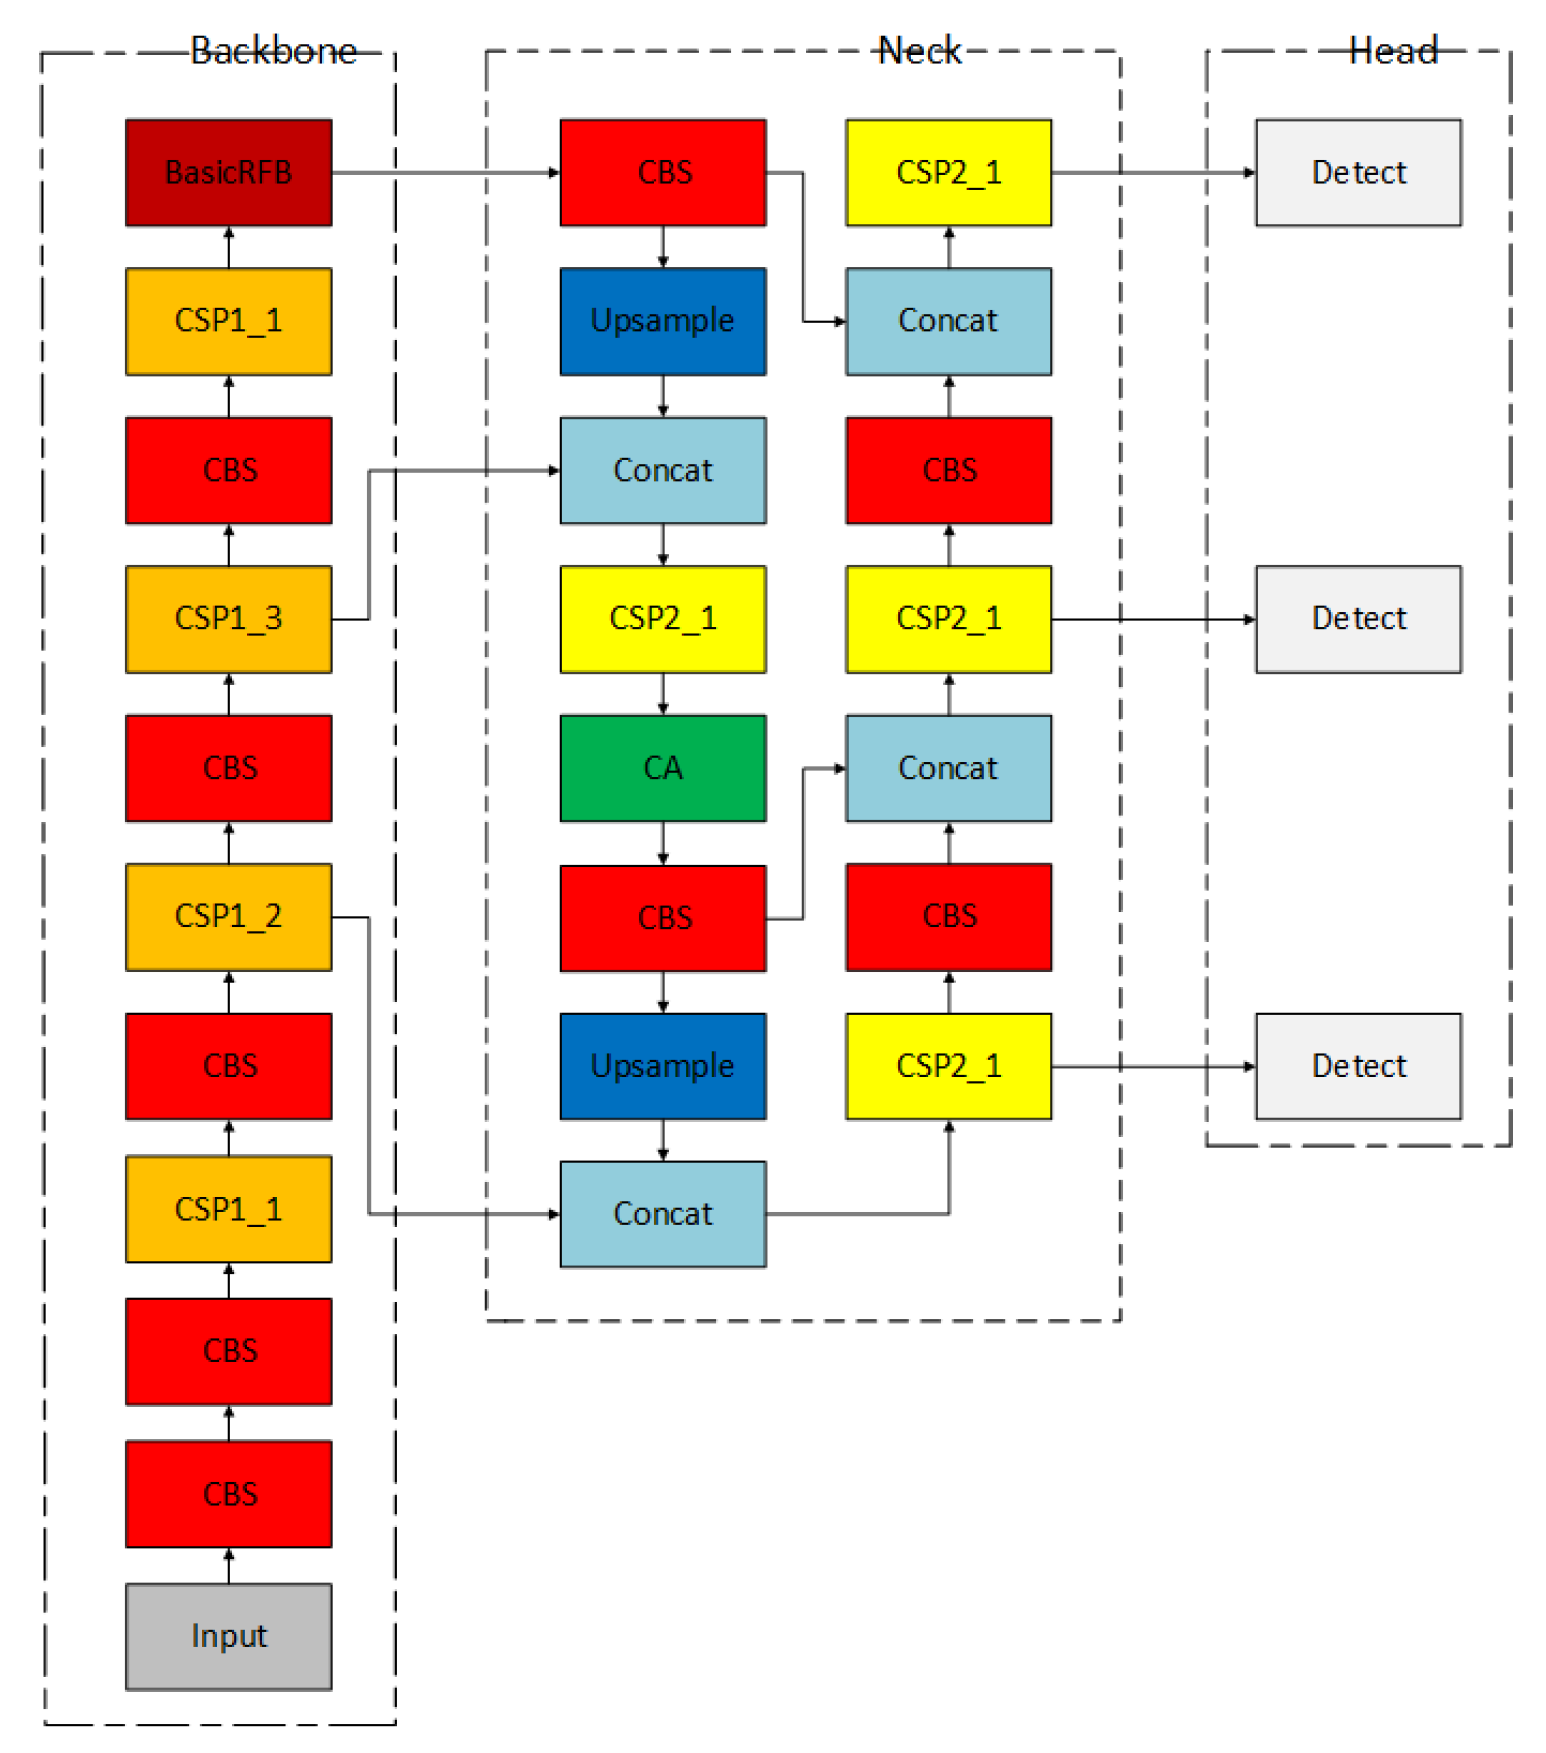
3.1. YOLOV5-RSC Model Structure
3.2. Receptive Field Block
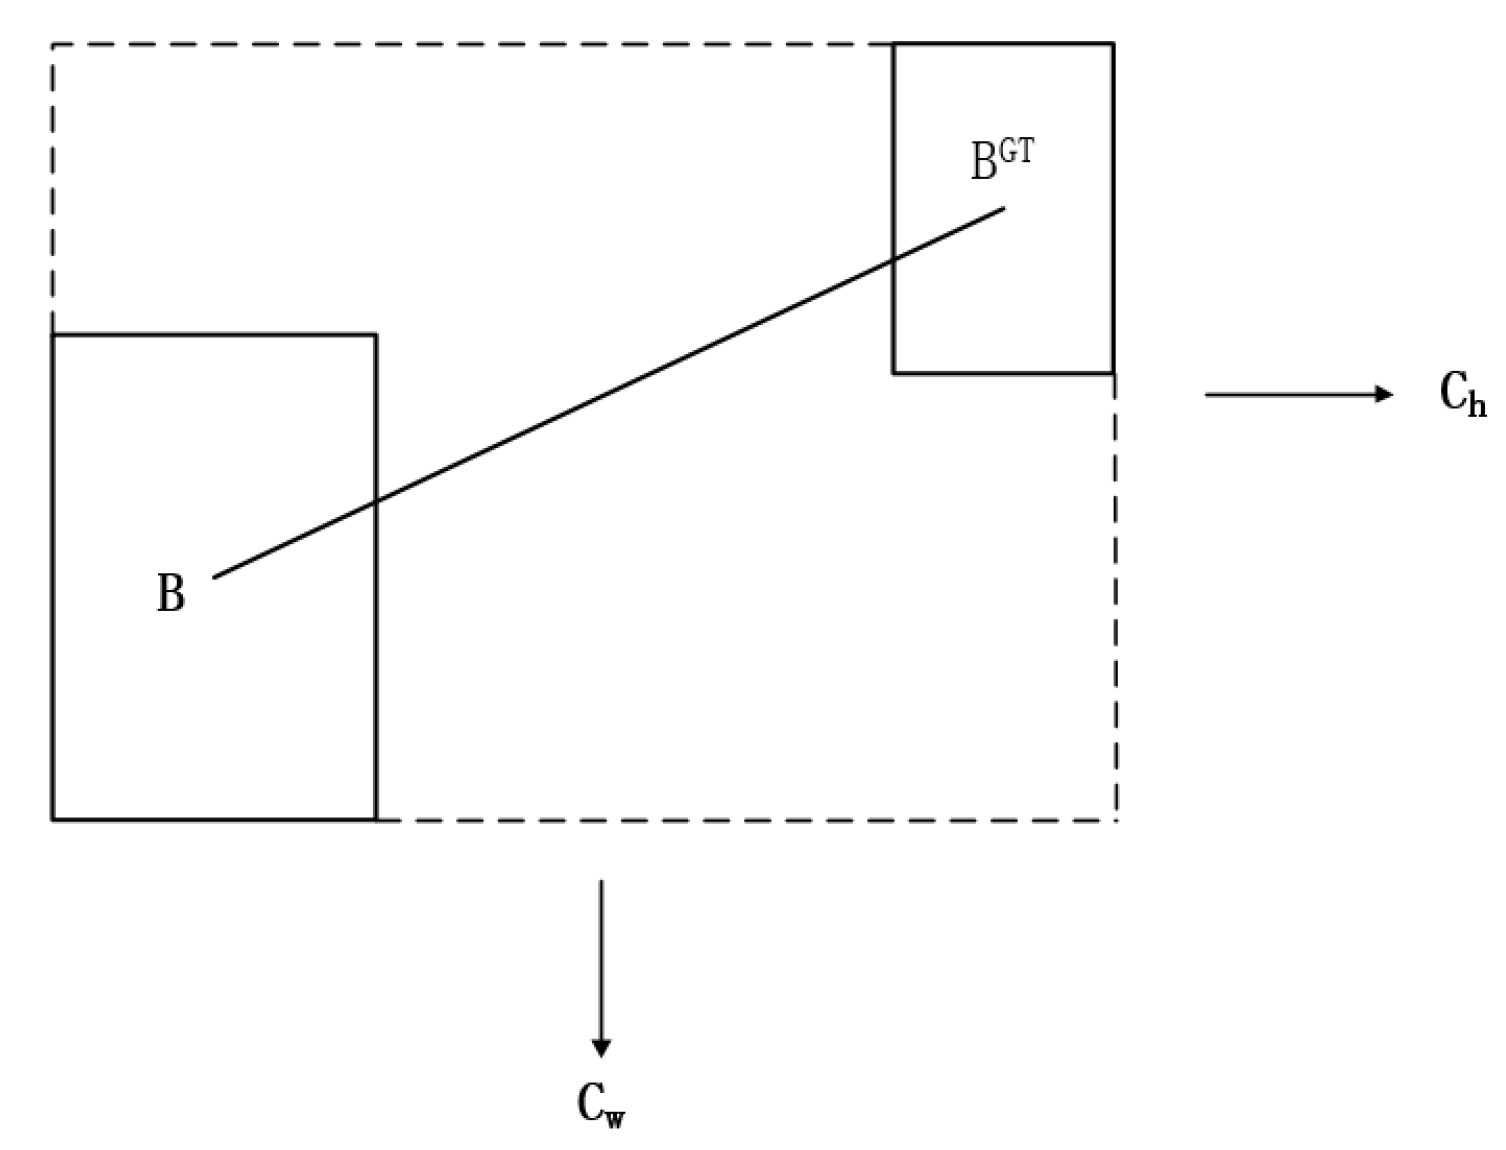
3.3. SIOU Loss Function
3.3.1. Angle Loss
3.3.2. Distance Loss
3.3.3. Shape Loss
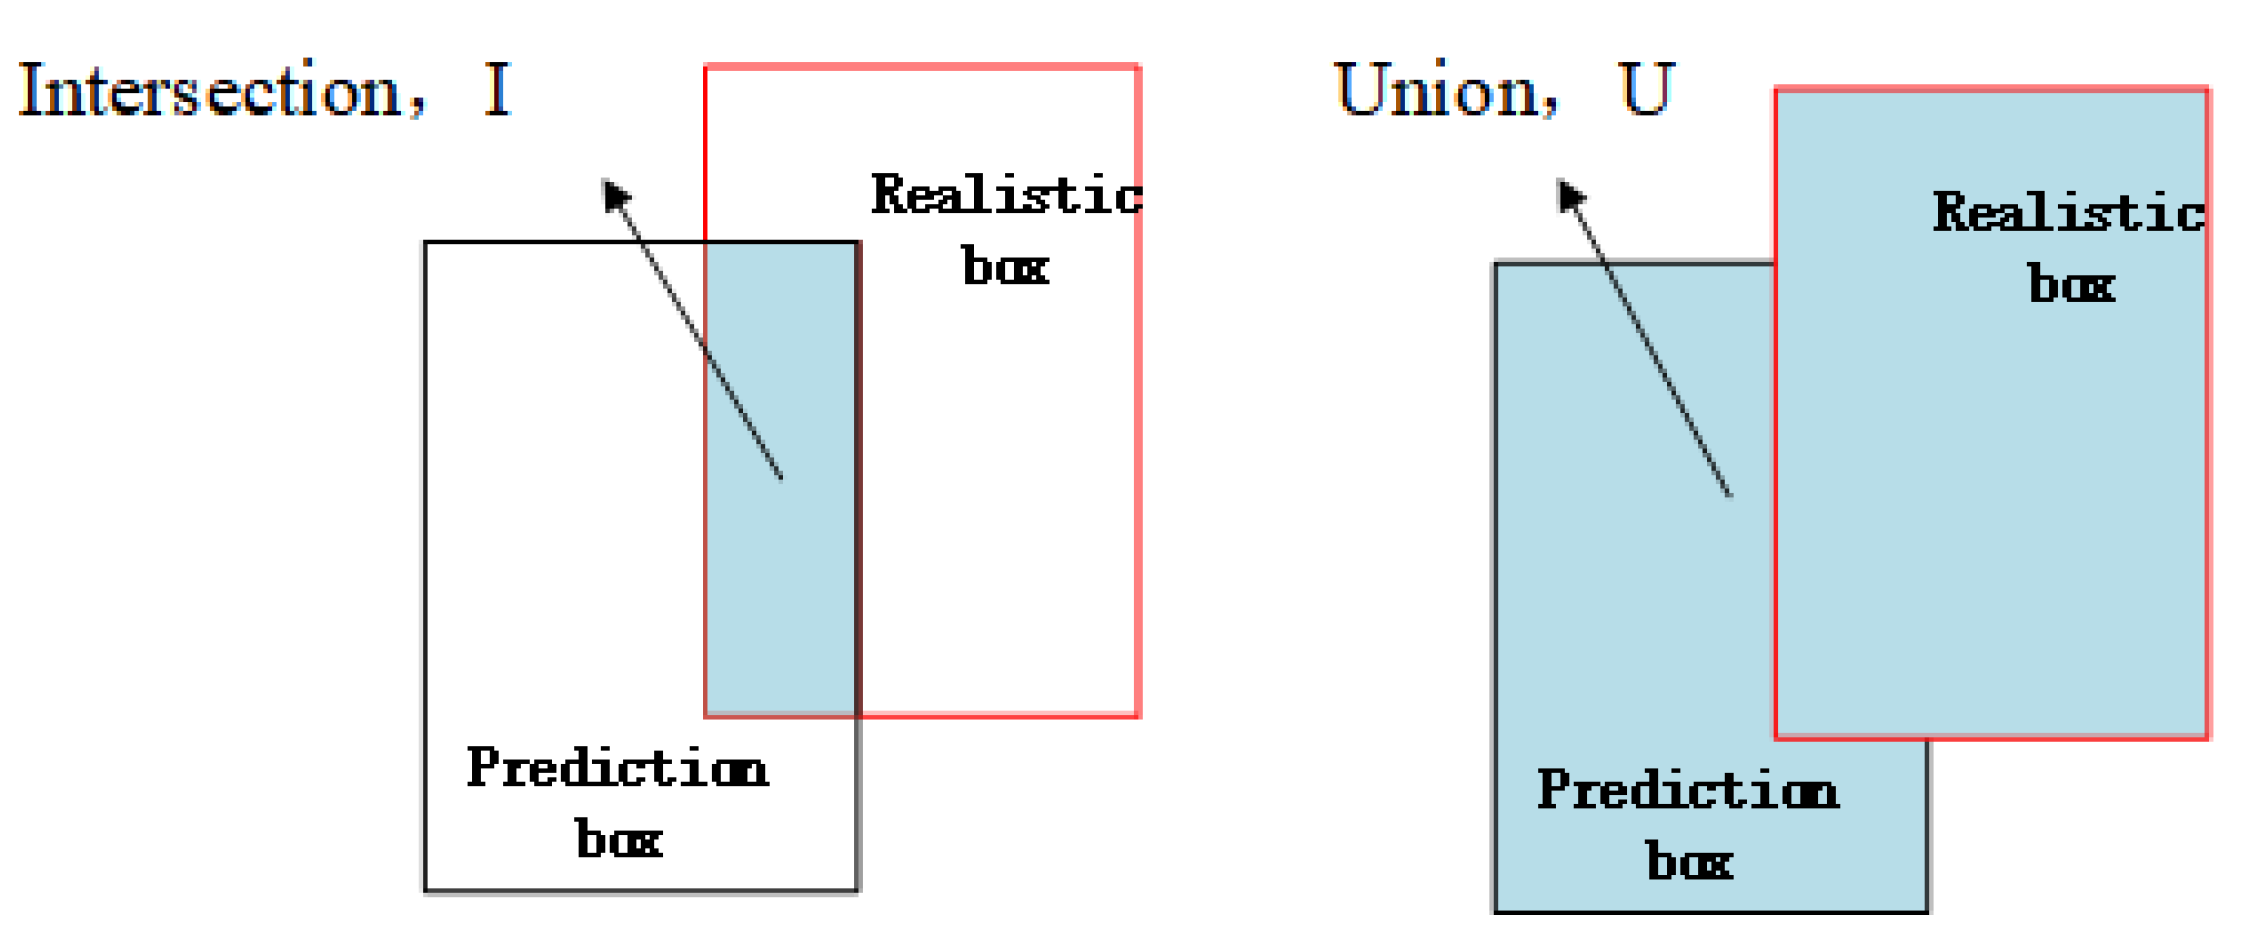
3.3.4. IoU Loss
3.3.5. Introducing the SIOU Loss Boundary Box Loss Function
3.4. Coordinate Attention Mechanism
3.4.1. Principle of Coordinate Attention Mechanism
3.4.2. Adding Coordinate Attention
4. Experiments and Results
4.1. Dataset
4.2. Experimental Environment and Parameter Configuration
4.3. Evaluation Indicators
4.4. Comparison Experiments
4.5. Ablation Experiments
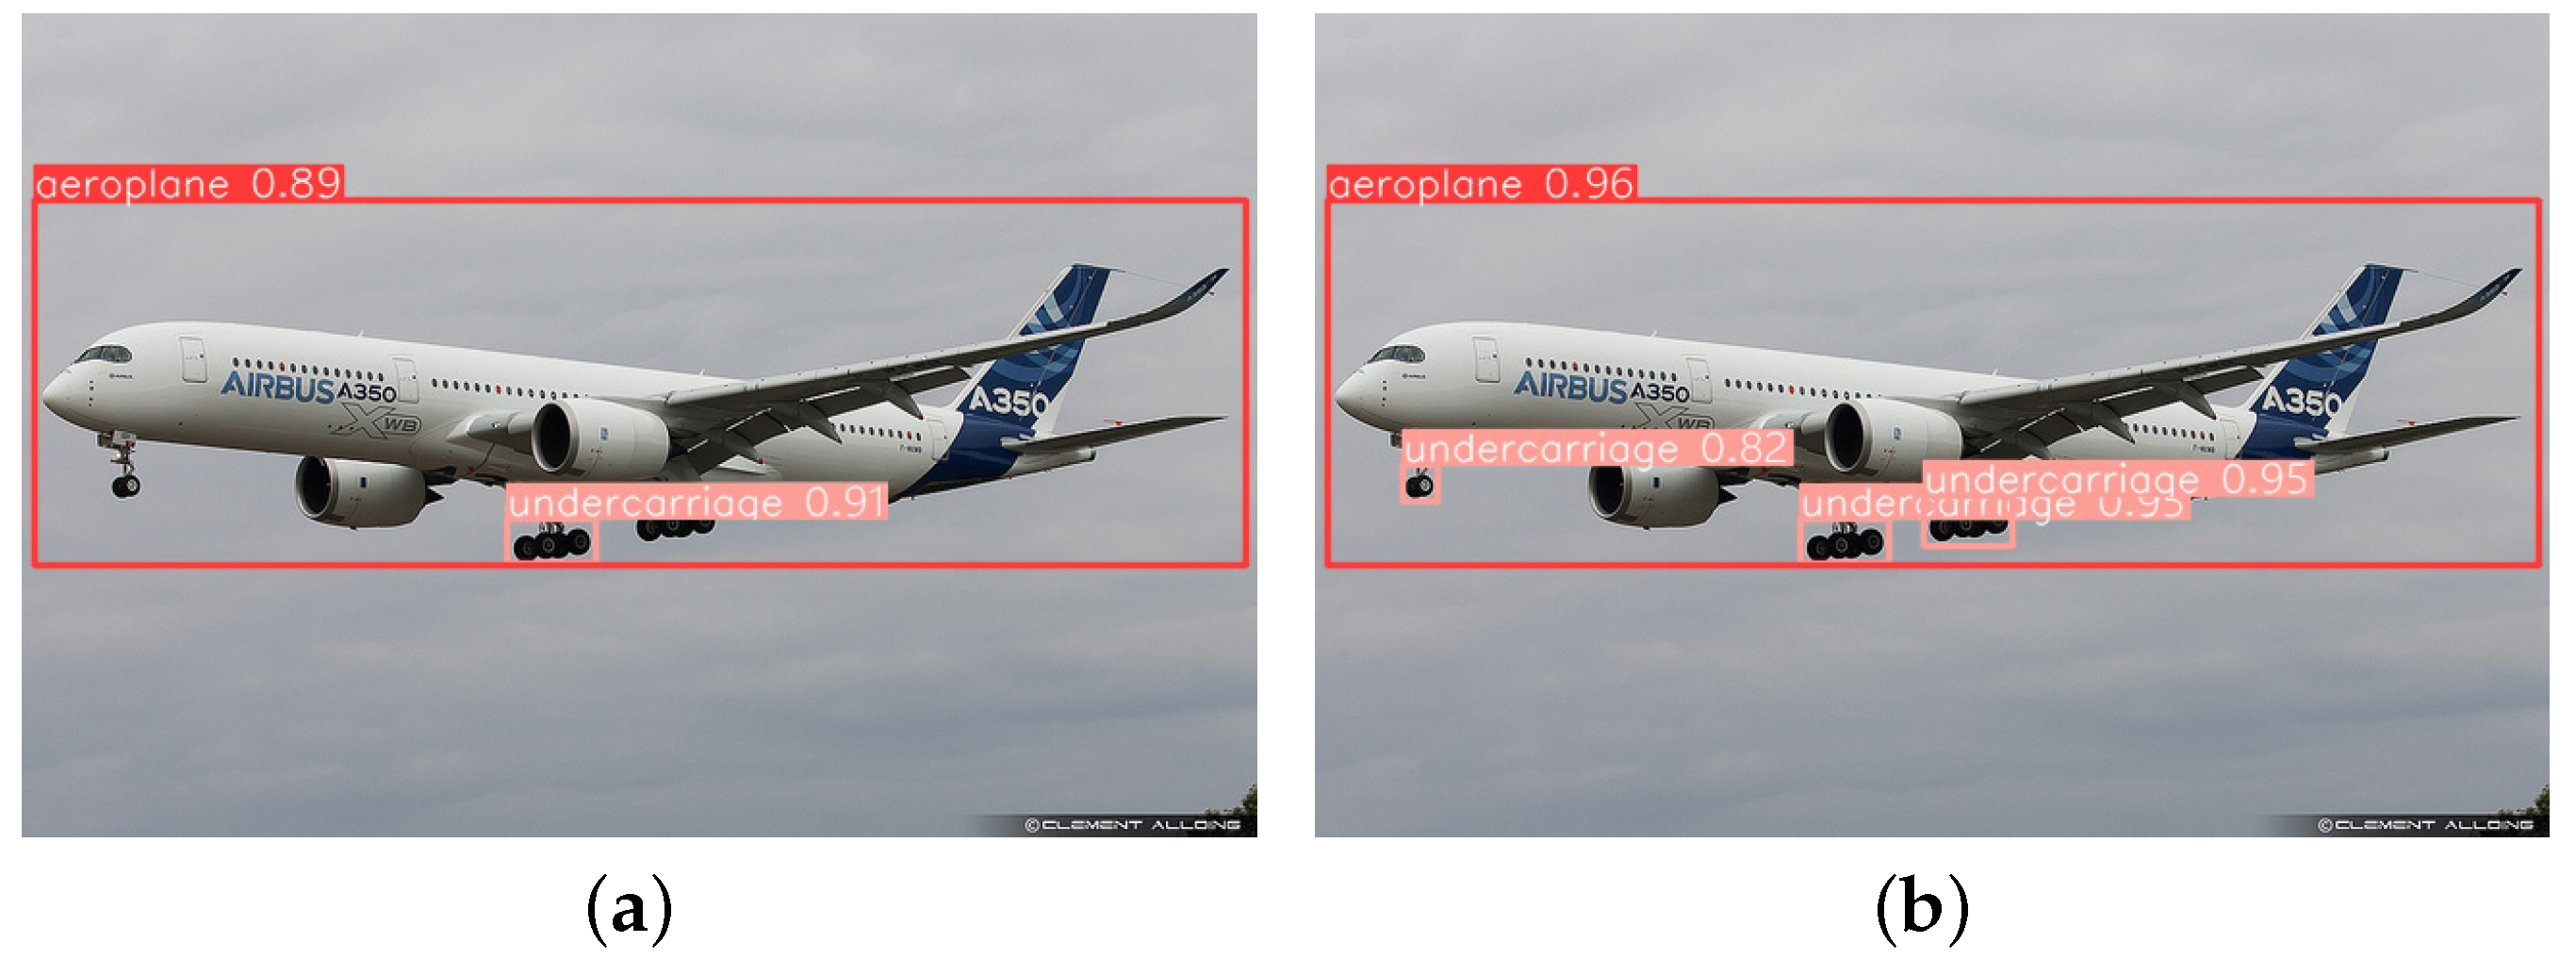
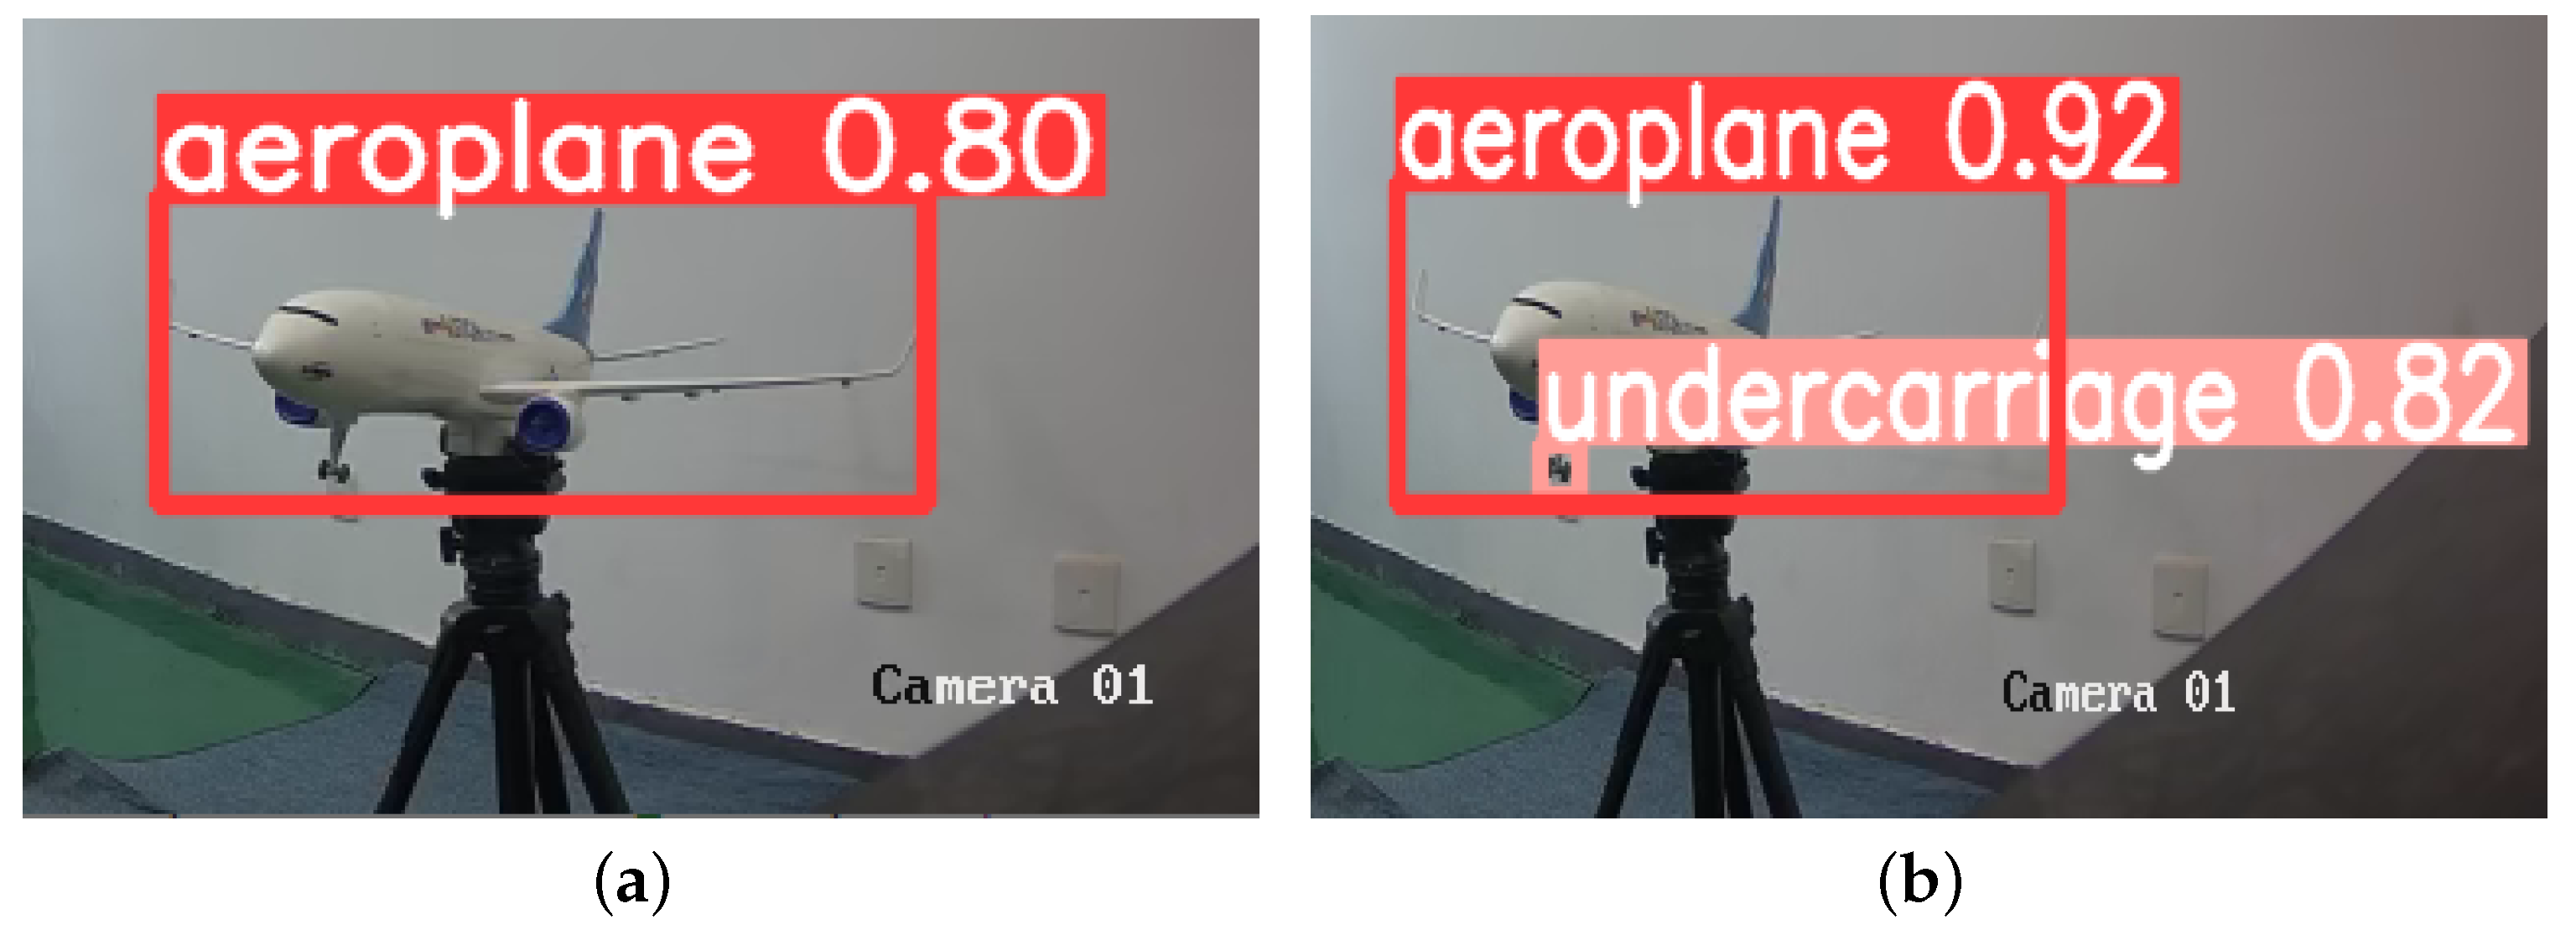
4.6. Analysis of Test Results
5. Conclusions
Author Contributions
Funding
Institutional Review Board Statement
Informed Consent Statement
Data Availability Statement
Acknowledgments
Conflicts of Interest
References
- Valdés, R.M.A.; Comendador, F.G.; Gordún, L.M.; Nieto, F.J.S. The development of probabilistic models to estimate accident risk (due to runway overrun and landing undershoot) applicable to the design and construction of runway safety areas. Saf. Sci. 2011, 49, 633–650. [Google Scholar] [CrossRef]
- Girshick, R.; Donahue, J.; Darrell, T.; Malik, J. Rich feature hierarchies for accurate object detection and semantic segmentation. In Proceedings of the IEEE Conference on Computer Vision and Pattern Recognition, Columbus, OH, USA, 23–28 June 2014; pp. 580–587. [Google Scholar]
- Girshick, R. Fast r-cnn. In Proceedings of the IEEE International Conference on Computer Vision, Santiago, Chile, 7–13 December 2015; pp. 1440–1448. [Google Scholar]
- Ren, S.; He, K.; Girshick, R.; Sun, J. Faster r-cnn: Towards real-time object detection with region proposal networks. In Proceedings of the 28th International Conference on Neural Information Processing Systems, Cambridge, MA, USA, 7–12 December 2015; Volume 28. [Google Scholar]
- He, K.; Gkioxari, G.; Dollár, P.; Girshick, R. Mask r-cnn. In Proceedings of the IEEE International Conference on Computer Vision, Venice, Italy, 22–29 October 2017; pp. 2961–2969. [Google Scholar]
- Lin, T.Y.; Goyal, P.; Girshick, R.; He, K.; Dollár, P. Focal loss for dense object detection. In Proceedings of the IEEE International Conference on Computer Vision, Venice, Italy, 22–29 October 2017; pp. 2980–2988. [Google Scholar]
- Tan, M.; Pang, R.; Le, Q.V. Efficientdet: Scalable and efficient object detection. In Proceedings of the IEEE/CVF Conference on Computer Vision and Pattern Recognition, Seattle, WA, USA, 13–19 June 2020; pp. 10781–10790. [Google Scholar]
- Liu, W.; Anguelov, D.; Erhan, D.; Szegedy, C.; Reed, S.; Fu, C.Y.; Berg, A.C. Ssd: Single shot multibox detector. In Proceedings of the Computer Vision–ECCV 2016: 14th European Conference, Amsterdam, The Netherlands, 11–14 October 2016; Proceedings, Part I 14. pp. 21–37. [Google Scholar]
- Redmon, J.; Divvala, S.; Girshick, R.; Farhadi, A. You only look once: Unified, real-time object detection. In Proceedings of the IEEE Conference on Computer Vision and Pattern Recognition, Las Vegas, NV, USA, 27–30 June 2016; pp. 779–788. [Google Scholar]
- Redmon, J.; Farhadi, A. YOLO9000: Better, faster, stronger. In Proceedings of the IEEE Conference on Computer Vision and Pattern Recognition, Honolulu, HI, USA, 21–26 July 2017; pp. 7263–7271. [Google Scholar]
- Redmon, J.; Farhadi, A. Yolov3: An incremental improvement. arXiv 2018, arXiv:1804.02767. [Google Scholar]
- Bochkovskiy, A.; Wang, C.Y.; Liao, H.Y.M. Yolov4: Optimal speed and accuracy of object detection. arXiv 2020, arXiv:2004.10934. [Google Scholar]
- Cheng, L.; Li, J.; Duan, P.; Wang, M. A small attentional YOLO model for landslide detection from satellite remote sensing images. Landslides 2021, 18, 2751–2765. [Google Scholar] [CrossRef]
- Bao, W.; Du, X.; Wang, N.; Yuan, M.; Yang, X. A Defect Detection Method Based on BC-YOLO for Transmission Line Components in UAV Remote Sensing Images. Remote Sens. 2022, 14, 5176. [Google Scholar] [CrossRef]
- Gong, H.; Mu, T.; Li, Q.; Dai, H.; Li, C.; He, Z.; Wang, W.; Han, F.; Tuniyazi, A.; Li, H.; et al. Swin-Transformer-Enabled YOLOv5 with Attention Mechanism for Small Object Detection on Satellite Images. Remote Sens. 2022, 14, 2861. [Google Scholar] [CrossRef]
- Yang, D.; Cui, Y.; Yu, Z.; Yuan, H. Deep learning based steel pipe weld defect detection. Appl. Artif. Intell. 2021, 35, 1237–1249. [Google Scholar] [CrossRef]
- Chen, L.C.; Pardeshi, M.S.; Lo, W.T.; Sheu, R.K.; Pai, K.C.; Chen, C.Y.; Tsai, P.Y.; Tsai, Y.T. Edge-glued wooden panel defect detection using deep learning. Wood Sci. Technol. 2022, 56, 477–507. [Google Scholar] [CrossRef]
- Ciaparrone, G.; Sánchez, F.L.; Tabik, S.; Troiano, L.; Tagliaferri, R.; Herrera, F. Deep learning in video multi-object tracking: A survey. Neurocomputing 2020, 381, 61–88. [Google Scholar] [CrossRef]
- Xiang, J.; Xu, G.; Ma, C.; Hou, J. End-to-end learning deep CRF models for multi-object tracking deep CRF models. IEEE Trans. Circuits Syst. Video Technol. 2020, 31, 275–288. [Google Scholar] [CrossRef]
- Guo, G.; Zhang, N. A survey on deep learning based face recognition. Comput. Vis. Image Underst. 2019, 189, 102805. [Google Scholar] [CrossRef]
- Lin, C.H.; Wang, Z.H.; Jong, G.J. A de-identification face recognition using extracted thermal features based on deep learning. IEEE Sens. J. 2020, 20, 9510–9517. [Google Scholar] [CrossRef]
- Doniyorjon, M.; Madinakhon, R.; Shakhnoza, M.; Cho, Y.I. An Improved Method of Polyp Detection Using Custom YOLOv4-Tiny. Appl. Sci. 2022, 12, 10856. [Google Scholar] [CrossRef]
- Liu, K. Stbi-yolo: A real-time object detection method for lung nodule recognition. IEEE Access 2022, 10, 75385–75394. [Google Scholar] [CrossRef]
- Ji, W.; Gao, X.; Xu, B.; Pan, Y.; Zhang, Z.; Zhao, D. Apple target recognition method in complex environment based on improved YOLOv4. J. Food Process Eng. 2021, 44, e13866. [Google Scholar] [CrossRef]
- Xu, B.; Cui, X.; Ji, W.; Yuan, H.; Wang, J. Apple grading method design and implementation for automatic grader based on improved YOLOv5. Agriculture 2023, 13, 124. [Google Scholar] [CrossRef]
- Li, Z.; Yuan, J.; Li, G.; Wang, H.; Li, X.; Li, D.; Wang, X. RSI-YOLO: Object Detection Method for Remote Sensing Images Based on Improved YOLO. Sensors 2023, 23, 6414. [Google Scholar] [CrossRef]
- Su, Z.; Yu, J.; Tan, H.; Wan, X.; Qi, K. MSA-YOLO: A Remote Sensing Object Detection Model Based on Multi-Scale Strip Attention. Sensors 2023, 23, 6811. [Google Scholar] [CrossRef]
- Torralba, A.; Fergus, R.; Freeman, W.T. 80 million tiny images: A large data set for nonparametric object and scene recognition. IEEE Trans. Pattern Anal. Mach. Intell. 2008, 30, 1958–1970. [Google Scholar] [CrossRef]
- Chen, C.; Liu, M.Y.; Tuzel, O.; Xiao, J. R-CNN for small object detection. In Proceedings of the Computer Vision–ACCV 2016: 13th Asian Conference on Computer Vision, Taipei, Taiwan, 20–24 November 2016; Revised Selected Papers, Part V 13. pp. 214–230. [Google Scholar]
- Yaeger, L.; Lyon, R.; Webb, B. Effective training of a neural network character classifier for word recognition. In Proceedings of the 9th International Conference on Neural Information Processing Systems, Cambridge, MA, USA, 3–5 December 1996; Volume 9. [Google Scholar]
- Krizhevsky, A.; Sutskever, I.; Hinton, G.E. Imagenet classification with deep convolutional neural networks. In Proceedings of the 25th International Conference on Neural Information Processing Systems, Red Hook, NY, USA, 3–6 December 2012; Volume 25. [Google Scholar]
- Chen, C.; Zhang, Y.; Lv, Q.; Wei, S.; Wang, X.; Sun, X.; Dong, J. Rrnet: A hybrid detector for object detection in drone-captured images. In Proceedings of the IEEE/CVF International Conference on Computer Vision Workshops, Seoul, Republic of Korea, 27–28 October 2019. [Google Scholar]
- Lin, T.Y.; Dollár, P.; Girshick, R.; He, K.; Hariharan, B.; Belongie, S. Feature pyramid networks for object detection. In Proceedings of the IEEE Conference on Computer Vision and Pattern Recognition, Honolulu, HI, USA, 21–26 July 2017; pp. 2117–2125. [Google Scholar]
- Goodfellow, I.; Pouget-Abadie, J.; Mirza, M.; Xu, B.; Warde-Farley, D.; Ozair, S.; Courville, A.; Bengio, Y. Generative adversarial nets. In Proceedings of the 27th International Conference on Neural Information Processing Systems, Cambridge, MA, USA, 8–13 December 2014; Volume 27. [Google Scholar]
- Yang, Z.; Liu, S.; Hu, H.; Wang, L.; Lin, S. Reppoints: Point set representation for object detection. In Proceedings of the IEEE/CVF International Conference on Computer Vision, Seoul, Republic of Korea, 27 October–2 November 2019; pp. 9657–9666. [Google Scholar]
- Kong, T.; Sun, F.; Liu, H.; Jiang, Y.; Li, L.; Shi, J. Foveabox: Beyound anchor-based object detection. IEEE Trans. Image Process. 2020, 29, 7389–7398. [Google Scholar] [CrossRef]
- Liu, S.; Huang, D.; Wang , Y. Receptive field block net for accurate and fast object detection. In Proceedings of the European Conference on Computer Vision (ECCV), Munich, Germany, 8–14 September 2018; pp. 385–400. [Google Scholar]
- Gevorgyan, Z. SIoU loss: More powerful learning for bounding box regression. arXiv 2022, arXiv:2205.12740. [Google Scholar]
- Woo, S.; Park, J.; Lee, J.Y.; Kweon, I.S. Cbam: Convolutional block attention module. In Proceedings of the European Conference on Computer Vision (ECCV), Munich, Germany, 8–14 September 2018; pp. 3–19. [Google Scholar]
- Hou, Q.; Zhou, D.; Feng, J. Coordinate attention for efficient mobile network design. In Proceedings of the IEEE/CVF Conference on Computer Vision and Pattern Recognition, Nashville, TN, USA, 20–25 June 2021; pp. 13713–13722. [Google Scholar]
- Guo, S.; Li, L.; Guo, T.; Cao, Y.; Li, Y. Research on Mask-Wearing Detection Algorithm Based on Improved YOLOv5. Sensors 2022, 22, 4933. [Google Scholar] [CrossRef] [PubMed]
- Gao, R.; Zhang, S.; Wang, H.; Zhang, J.; Li, H.; Zhang, Z. The Aeroplane and Undercarriage Detection Based on Attention Mechanism and Multi-Scale Features Processing. Mob. Inf. Syst. 2022, 2022, 2582288. [Google Scholar] [CrossRef]


| Experimental Group | Precision | Recall | mAP@0.5 |
|---|---|---|---|
| 86.9% | 80.0% | 82.7% | |
| a | 86.7% | 79.5% | 82.7% |
| b | 87.7% | 80.5% | 84.8% |
| c | 86.5% | 80.3% | 84.4% |
| True | False | |
|---|---|---|
| Positive | TP | FP |
| Negative | TN | FN |
| Model | Aeroplane /AP | Undercarriage /AP | mAP@0.5 | FPS/ (Frame/s) |
|---|---|---|---|---|
| Faster R-CNN | 60.8% | 58.6% | 59.7% | 7.3 |
| SSD | 64.4% | 59.8% | 62.1% | 20.6 |
| RetinaNet | 68.1% | 60.4% | 64.3% | 25.4 |
| YOLOv4 | 76.7% | 62.3% | 69.5% | 76.3 |
| YOLOv5s | 90.4% | 75.1% | 82.7% | 100.0 |
| YOLOv5-RSC | 92.4% | 80.5% | 86.4% | 89.2 |
| Model | Aeroplane /AP | Undercarriage /AP | mAP@0.5 | FPS/ (Frame/s) |
|---|---|---|---|---|
| Gao’s model | 76.0% | 68.0% | 71.9% | 20.0 |
| Our model | 92.4% | 80.5% | 86.4% | 89.2 |
| Model | Precision | Recall | mAP@0.5 | FPS/(Frame/s) |
|---|---|---|---|---|
| YOLOv5s | 86.9% | 80.0% | 82.7% | 100.0 |
| YOLOv5 + BasicRFB | 87.7% | 80.9% | 85.0% | 93.1 |
| YOLOv5 + SIOU | 87.5% | 81.1% | 84.7% | 100.0 |
| YOLOv5 + CA | 87.7% | 80.5% | 84.8% | 94.3 |
| YOLOv5 + BasicRFB + CA | 89.2% | 80.5% | 86.1% | 90.0 |
| YOLOv5 + BasicRFB + SIOU | 88.6% | 81.5% | 86.0% | 92.8 |
| YOLOv5-RSC | 89.5% | 82.1% | 86.4% | 89.2 |
Disclaimer/Publisher’s Note: The statements, opinions and data contained in all publications are solely those of the individual author(s) and contributor(s) and not of MDPI and/or the editor(s). MDPI and/or the editor(s) disclaim responsibility for any injury to people or property resulting from any ideas, methods, instructions or products referred to in the content. |
© 2023 by the authors. Licensee MDPI, Basel, Switzerland. This article is an open access article distributed under the terms and conditions of the Creative Commons Attribution (CC BY) license (https://creativecommons.org/licenses/by/4.0/).
Share and Cite
Gao, R.; Ma, Y.; Zhao, Z.; Li, B.; Zhang, J. Real-Time Detection of an Undercarriage Based on Receptive Field Blocks and Coordinate Attention. Sensors 2023, 23, 9861. https://doi.org/10.3390/s23249861
Gao R, Ma Y, Zhao Z, Li B, Zhang J. Real-Time Detection of an Undercarriage Based on Receptive Field Blocks and Coordinate Attention. Sensors. 2023; 23(24):9861. https://doi.org/10.3390/s23249861
Chicago/Turabian StyleGao, Ruizhen, Ya’nan Ma, Ziyue Zhao, Baihua Li, and Jingjun Zhang. 2023. "Real-Time Detection of an Undercarriage Based on Receptive Field Blocks and Coordinate Attention" Sensors 23, no. 24: 9861. https://doi.org/10.3390/s23249861
APA StyleGao, R., Ma, Y., Zhao, Z., Li, B., & Zhang, J. (2023). Real-Time Detection of an Undercarriage Based on Receptive Field Blocks and Coordinate Attention. Sensors, 23(24), 9861. https://doi.org/10.3390/s23249861