
Innovative Photonic Sensors for Safety and Security, Part I: Fundamentals, Infrastructural and Ground Transportations
 , ,
, ,  , , , , ,
  , ,
, ,  , ,
, ,  , ,
, ,  ,
,  , , and
Abstract
:1. Introduction
2. Photonic and Optical Fiber Technology
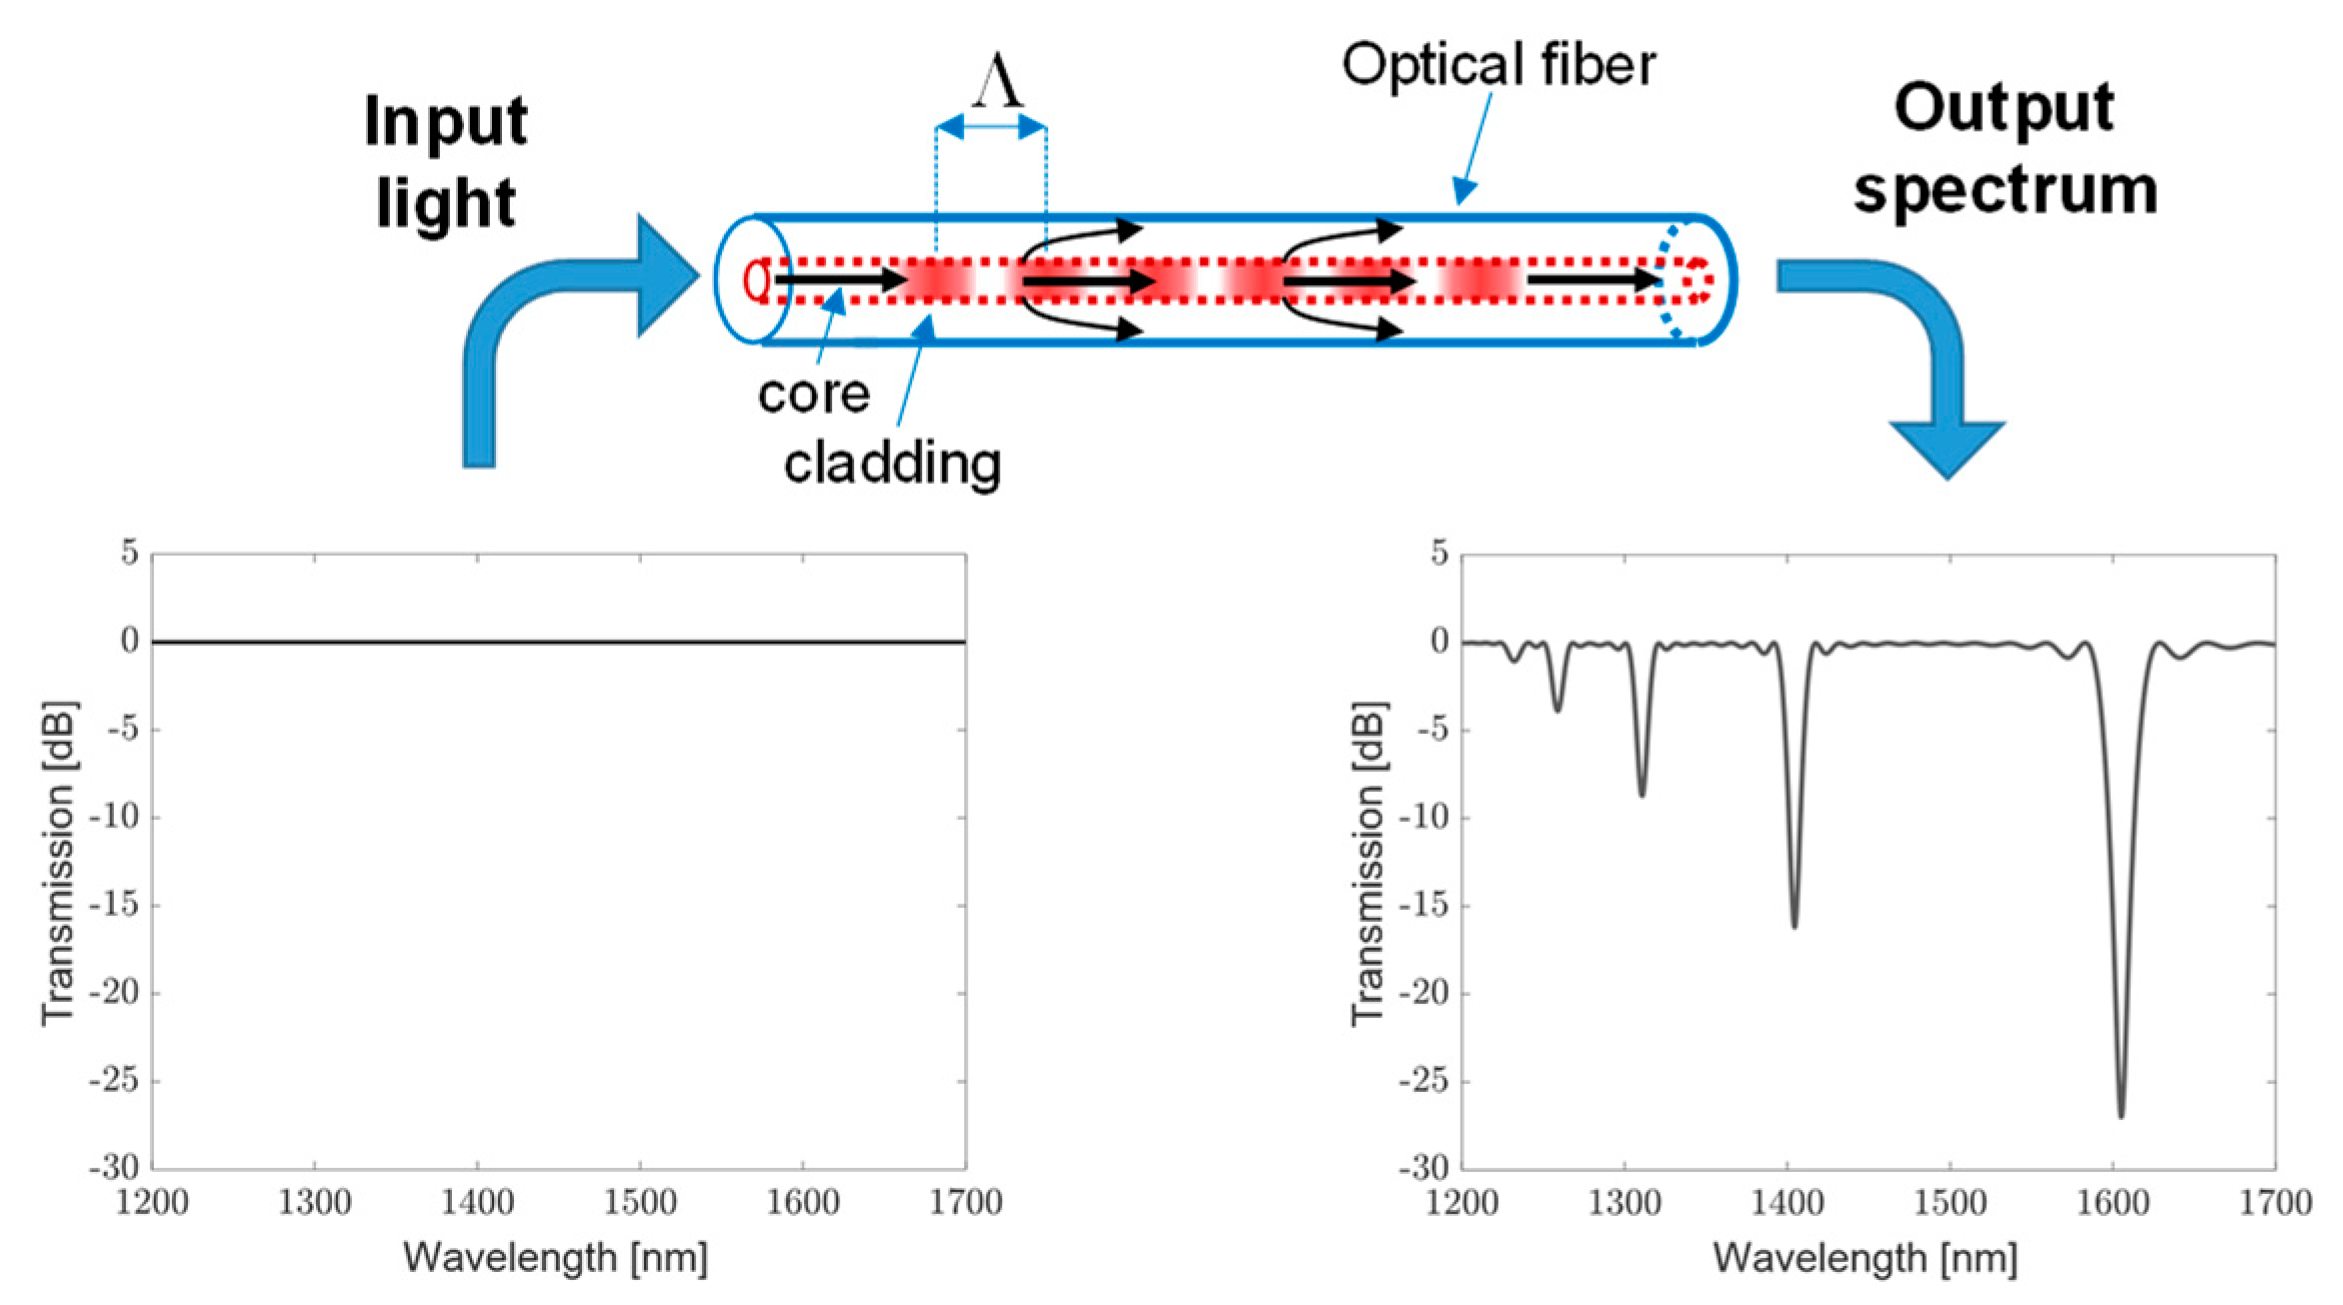
2.1. Optical Fiber Grating
2.2. Distributed Optical Fiber Sensors
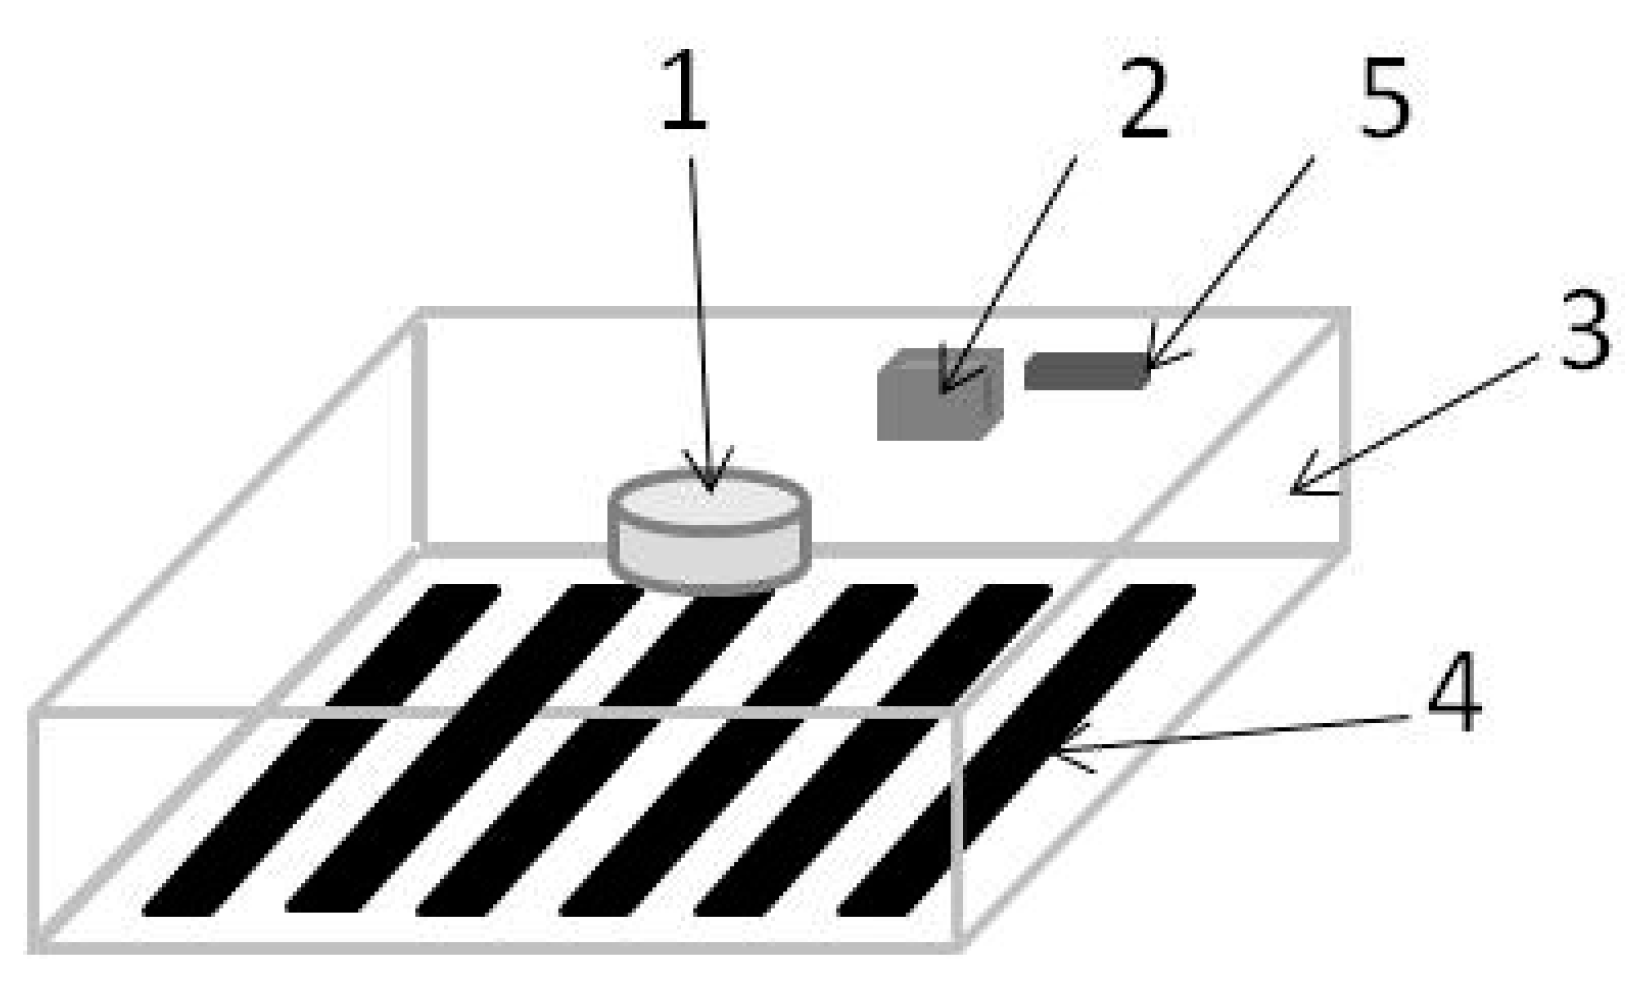
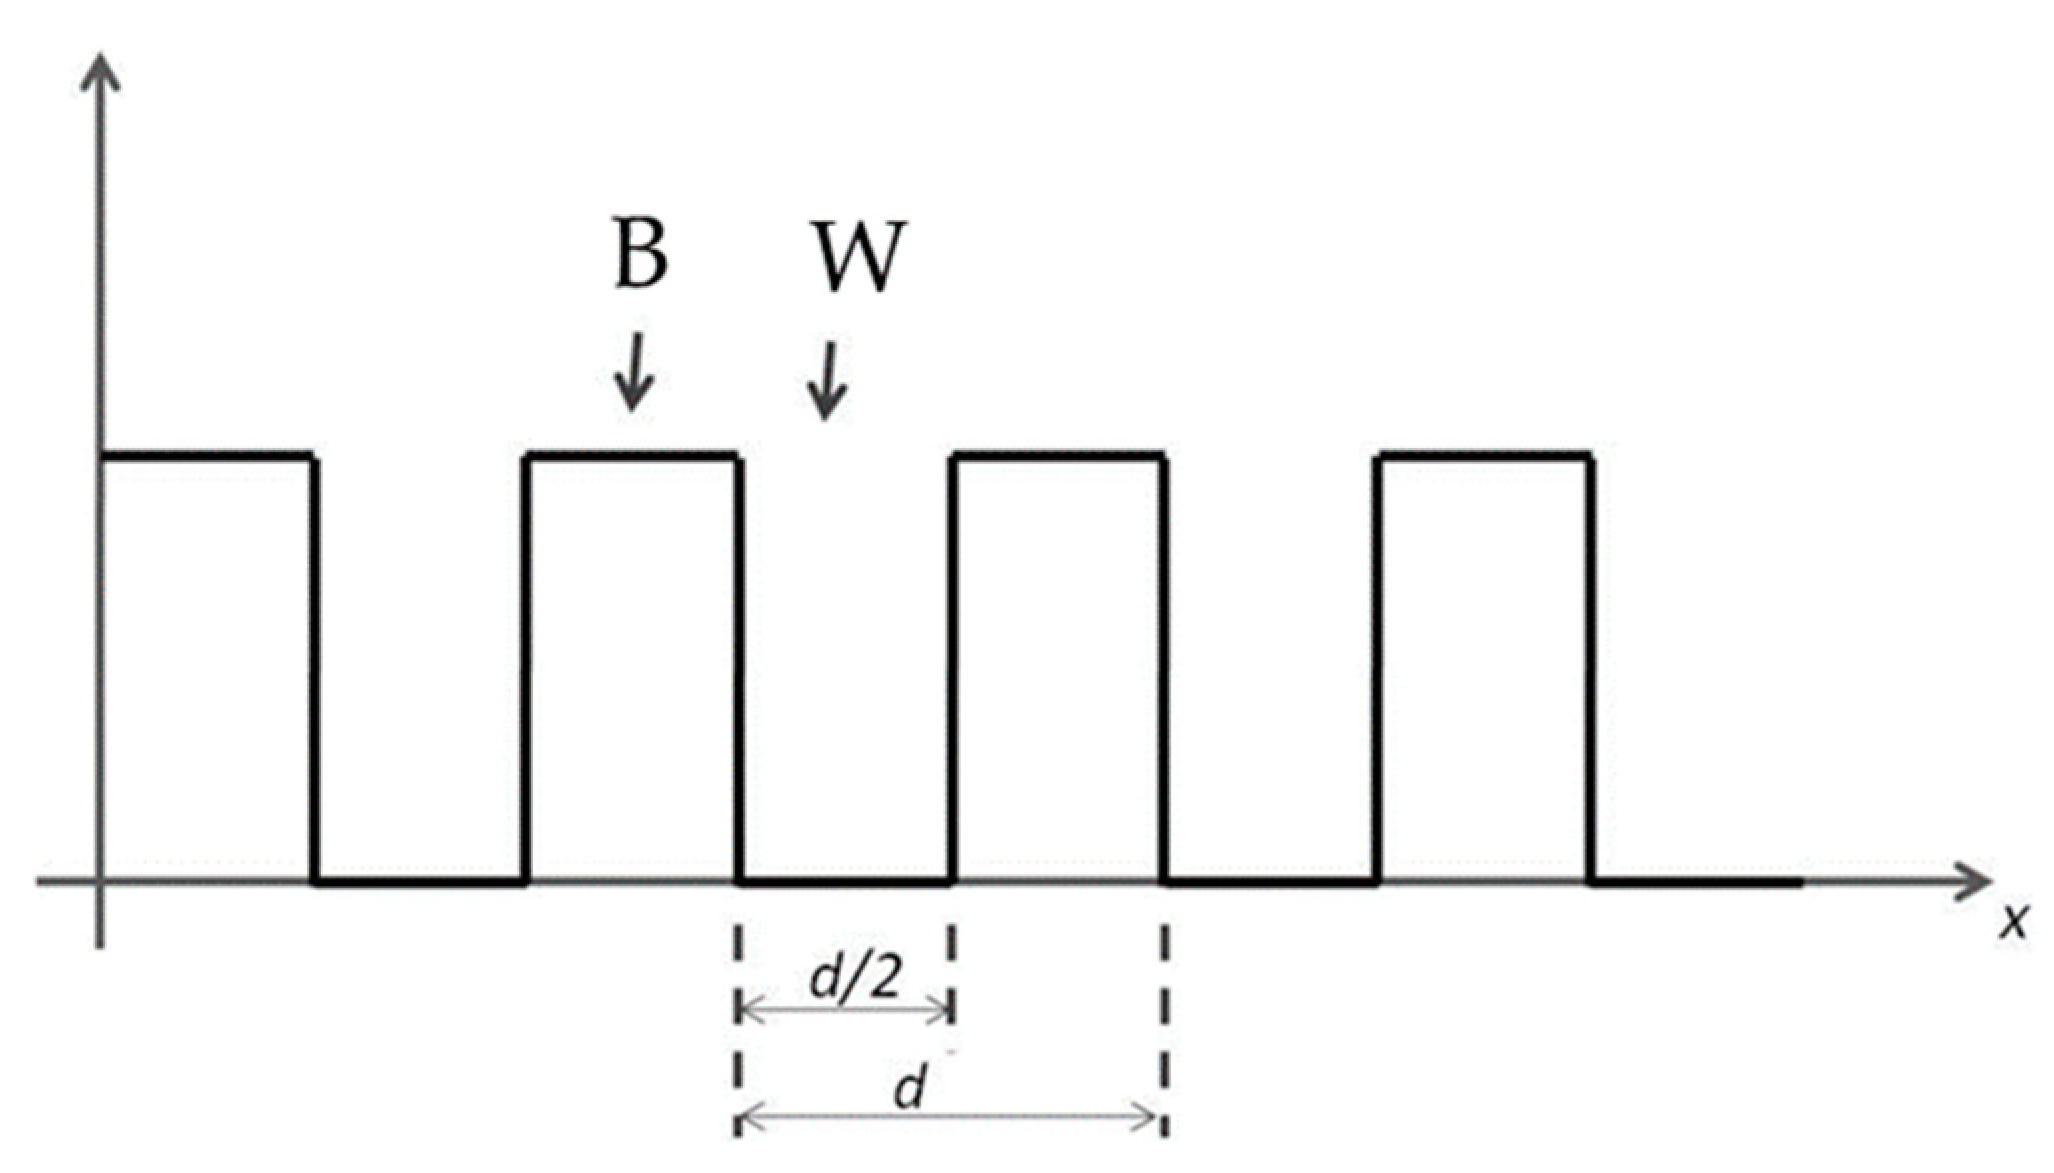
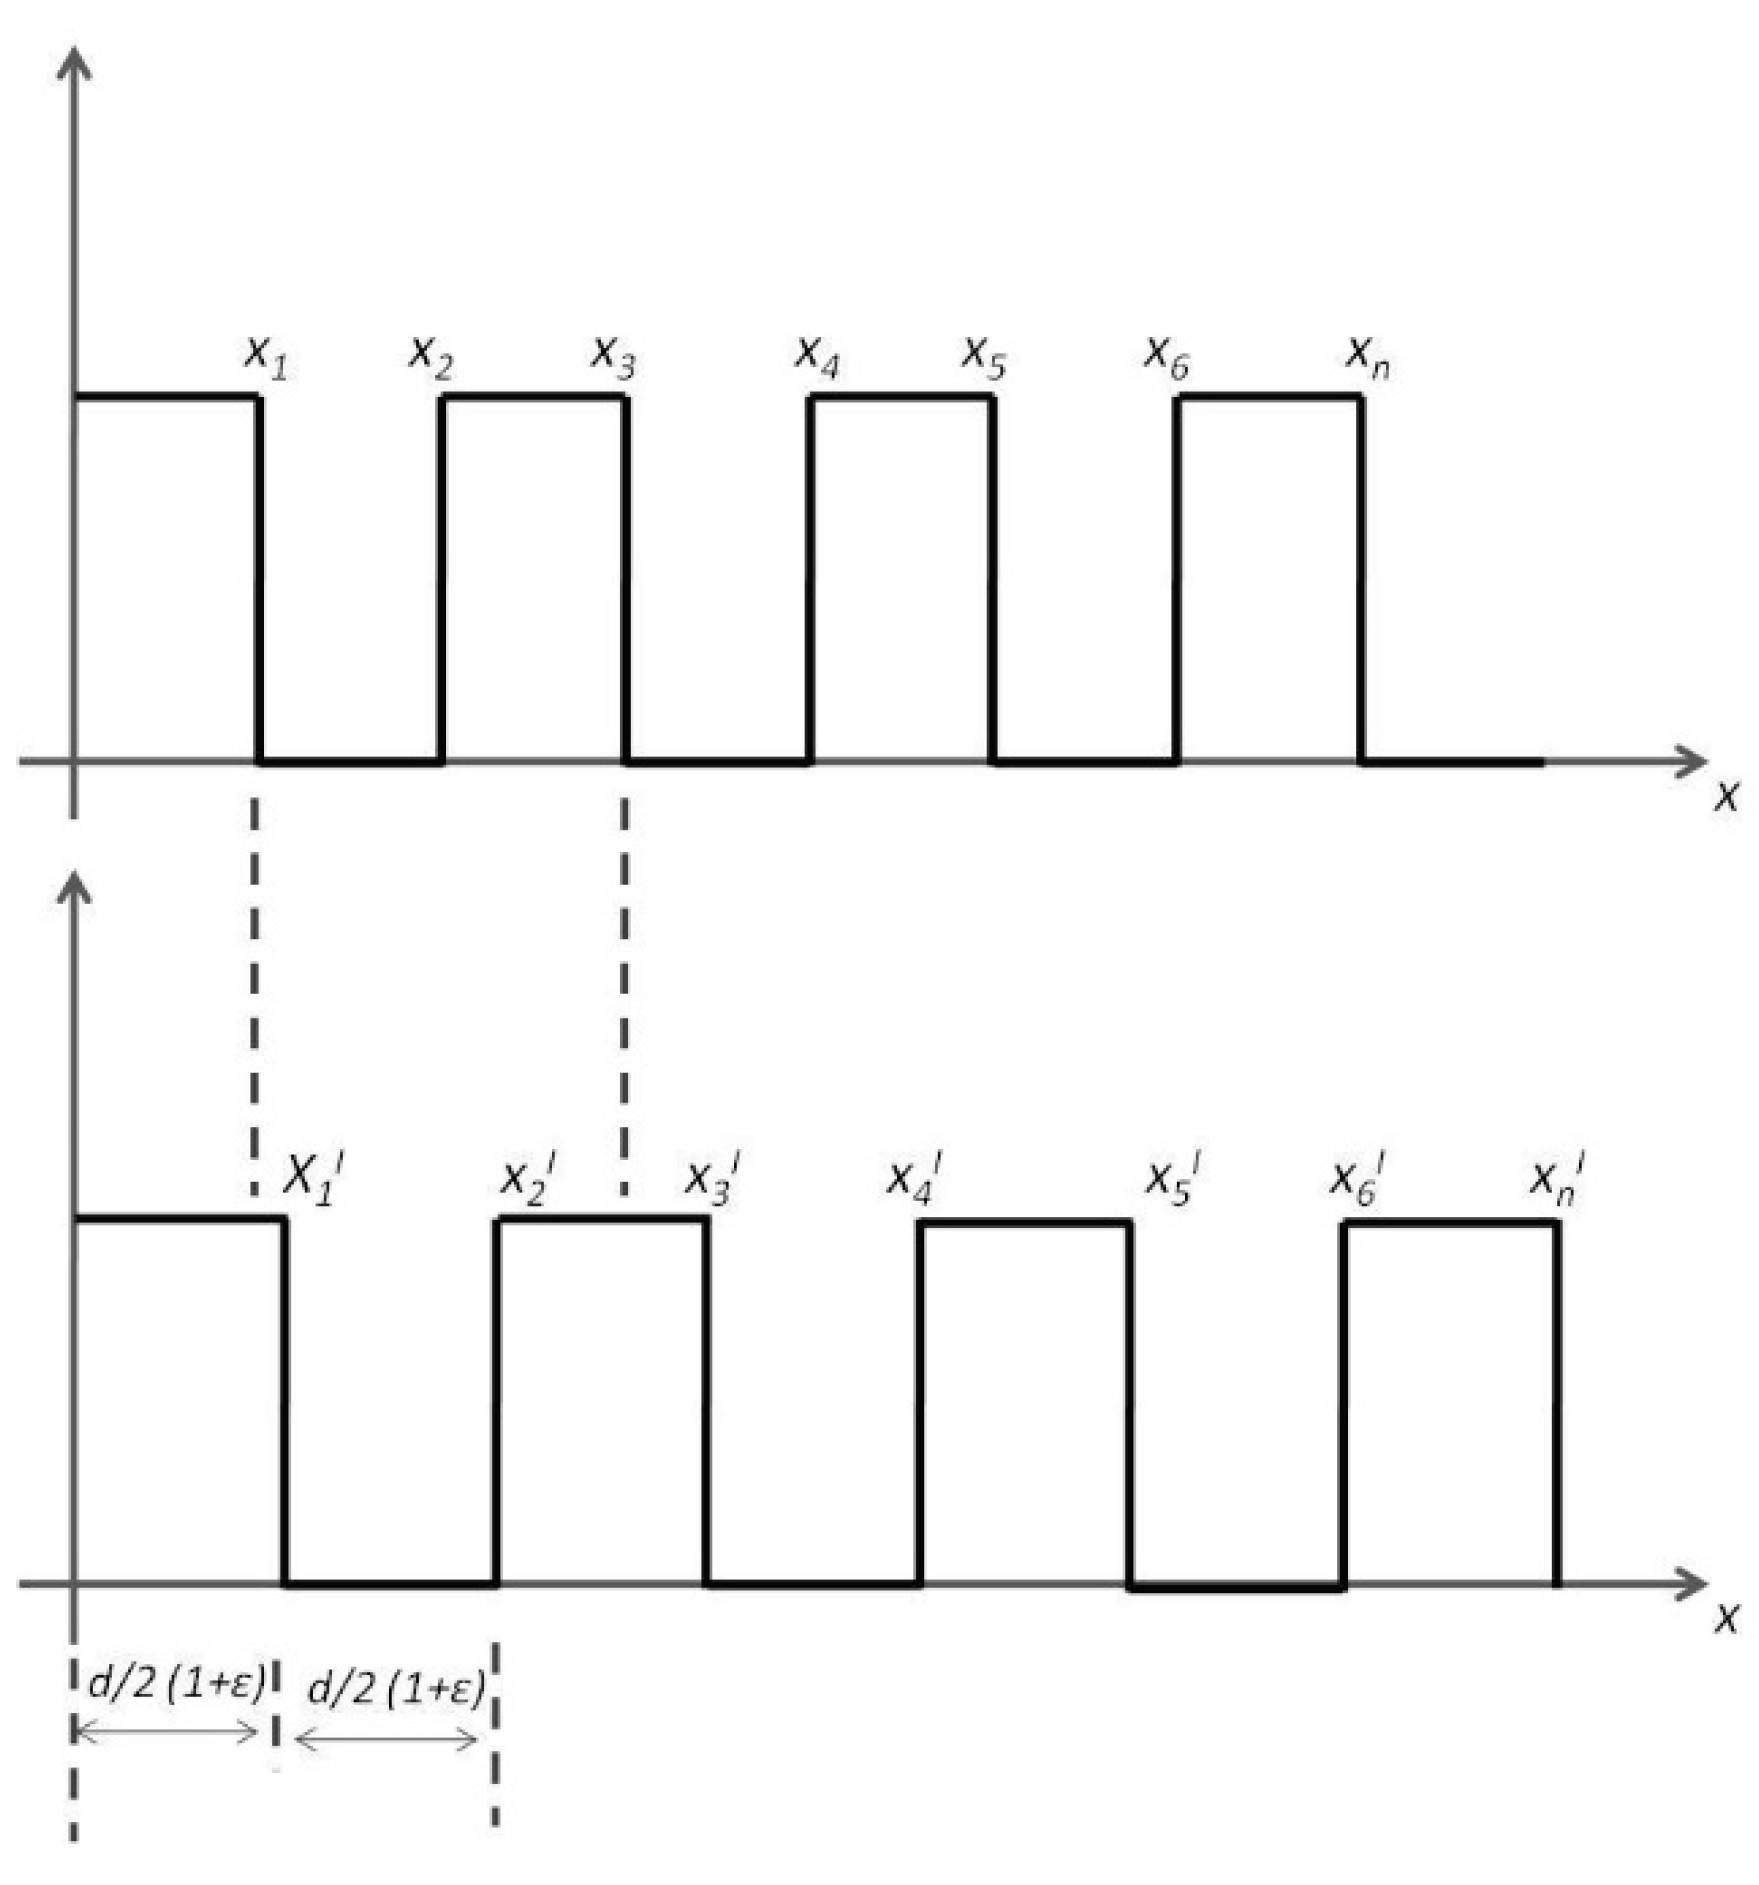
2.3. Bar and QR Code-Based Strain Sensors
3. Railway and Road Transportation
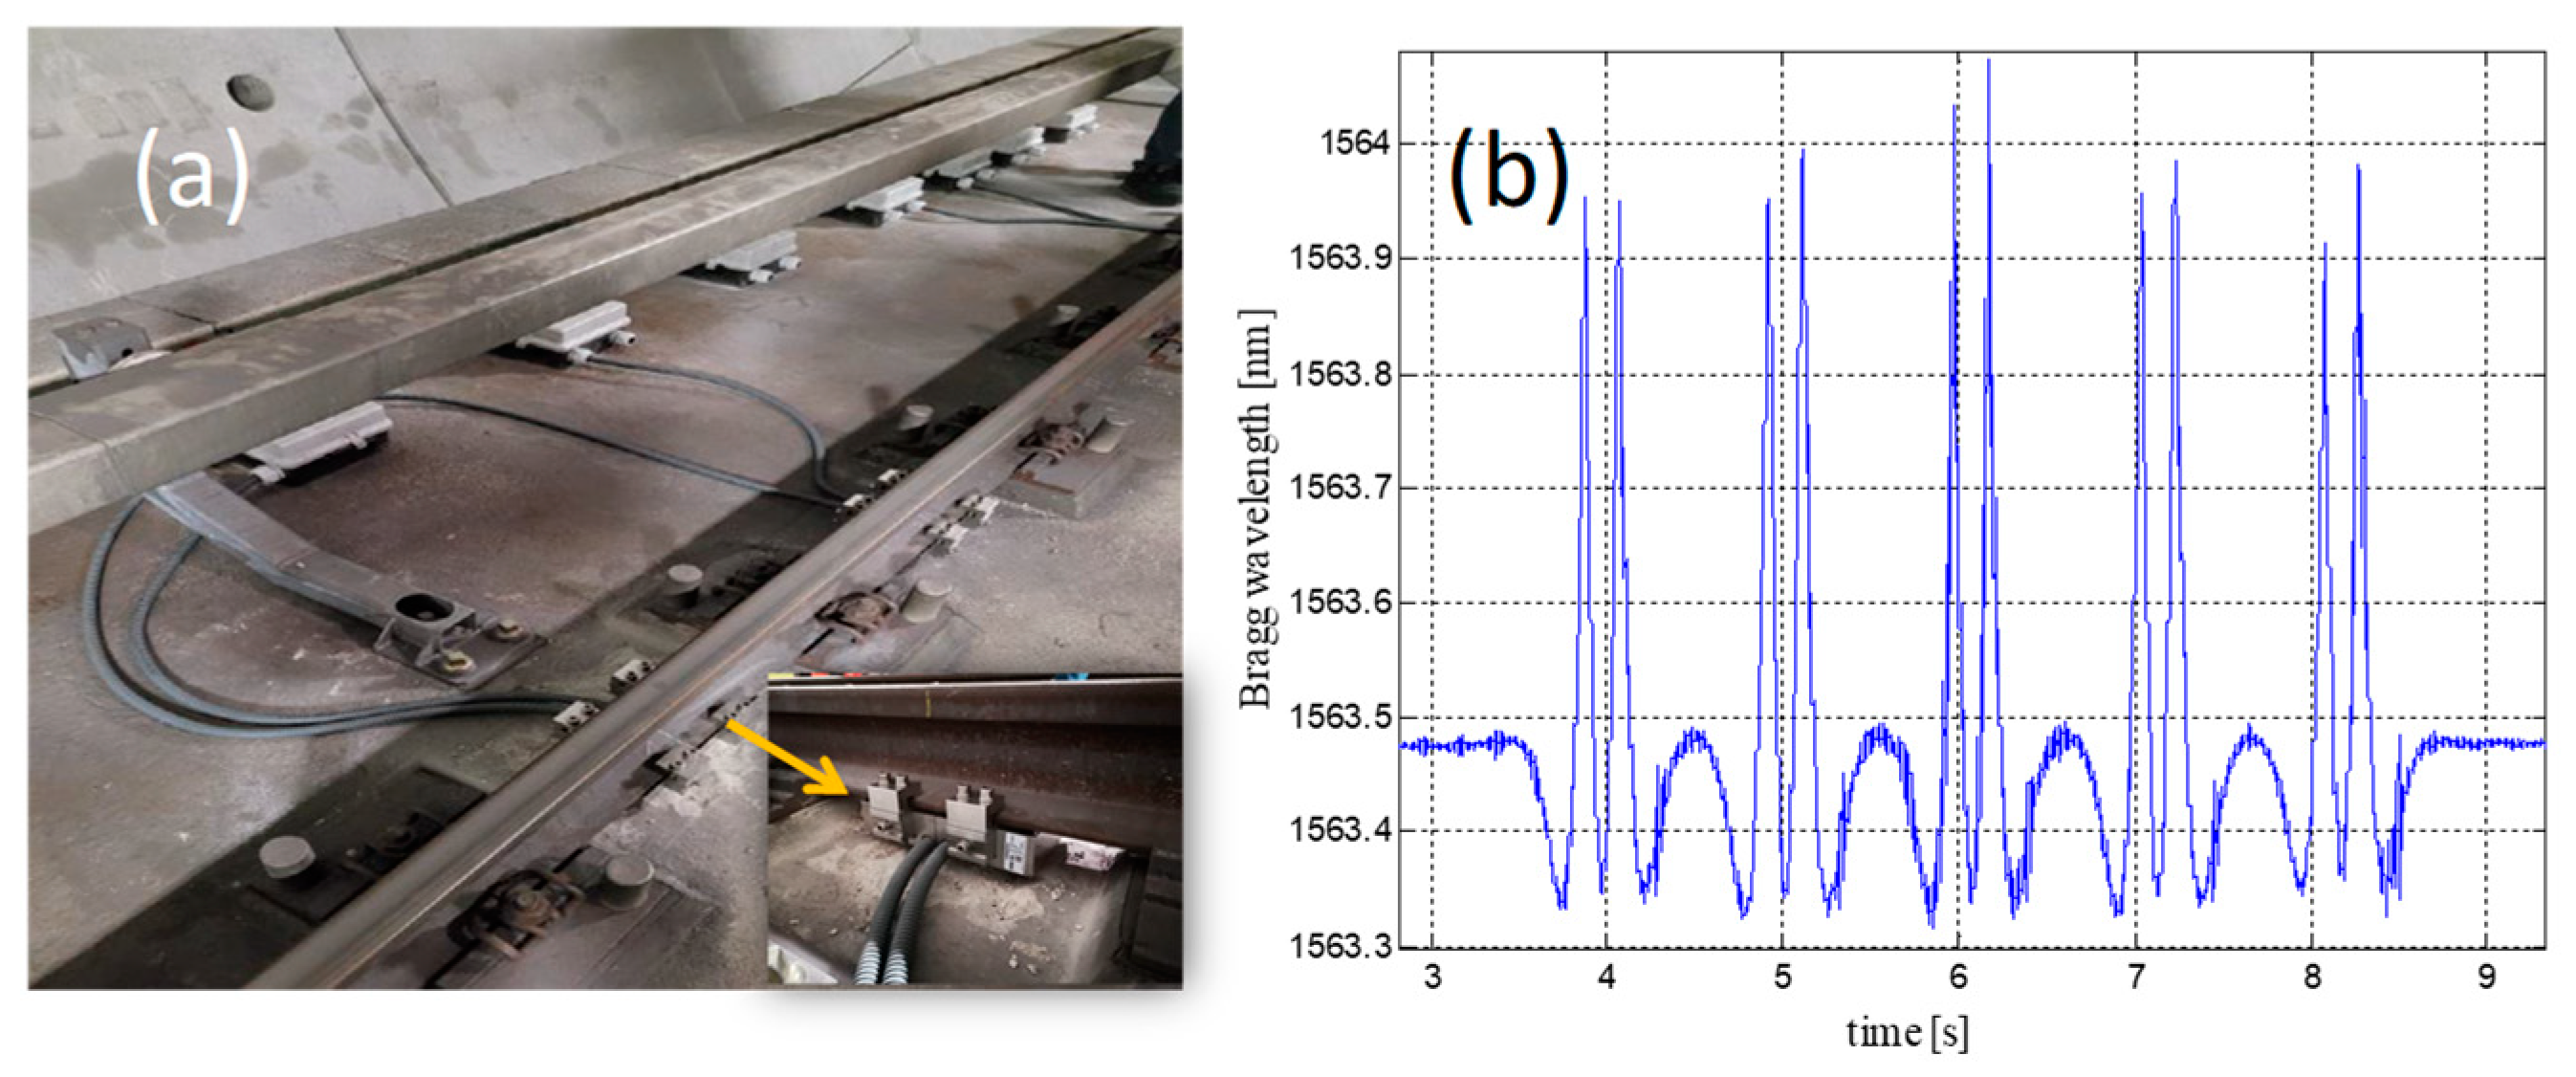
3.1. WIM and WILD System Based on FBG Sensor for Railway Safety
3.1.1. Main Characteristics of the WIM and WILD Systems
3.1.2. In-field Results
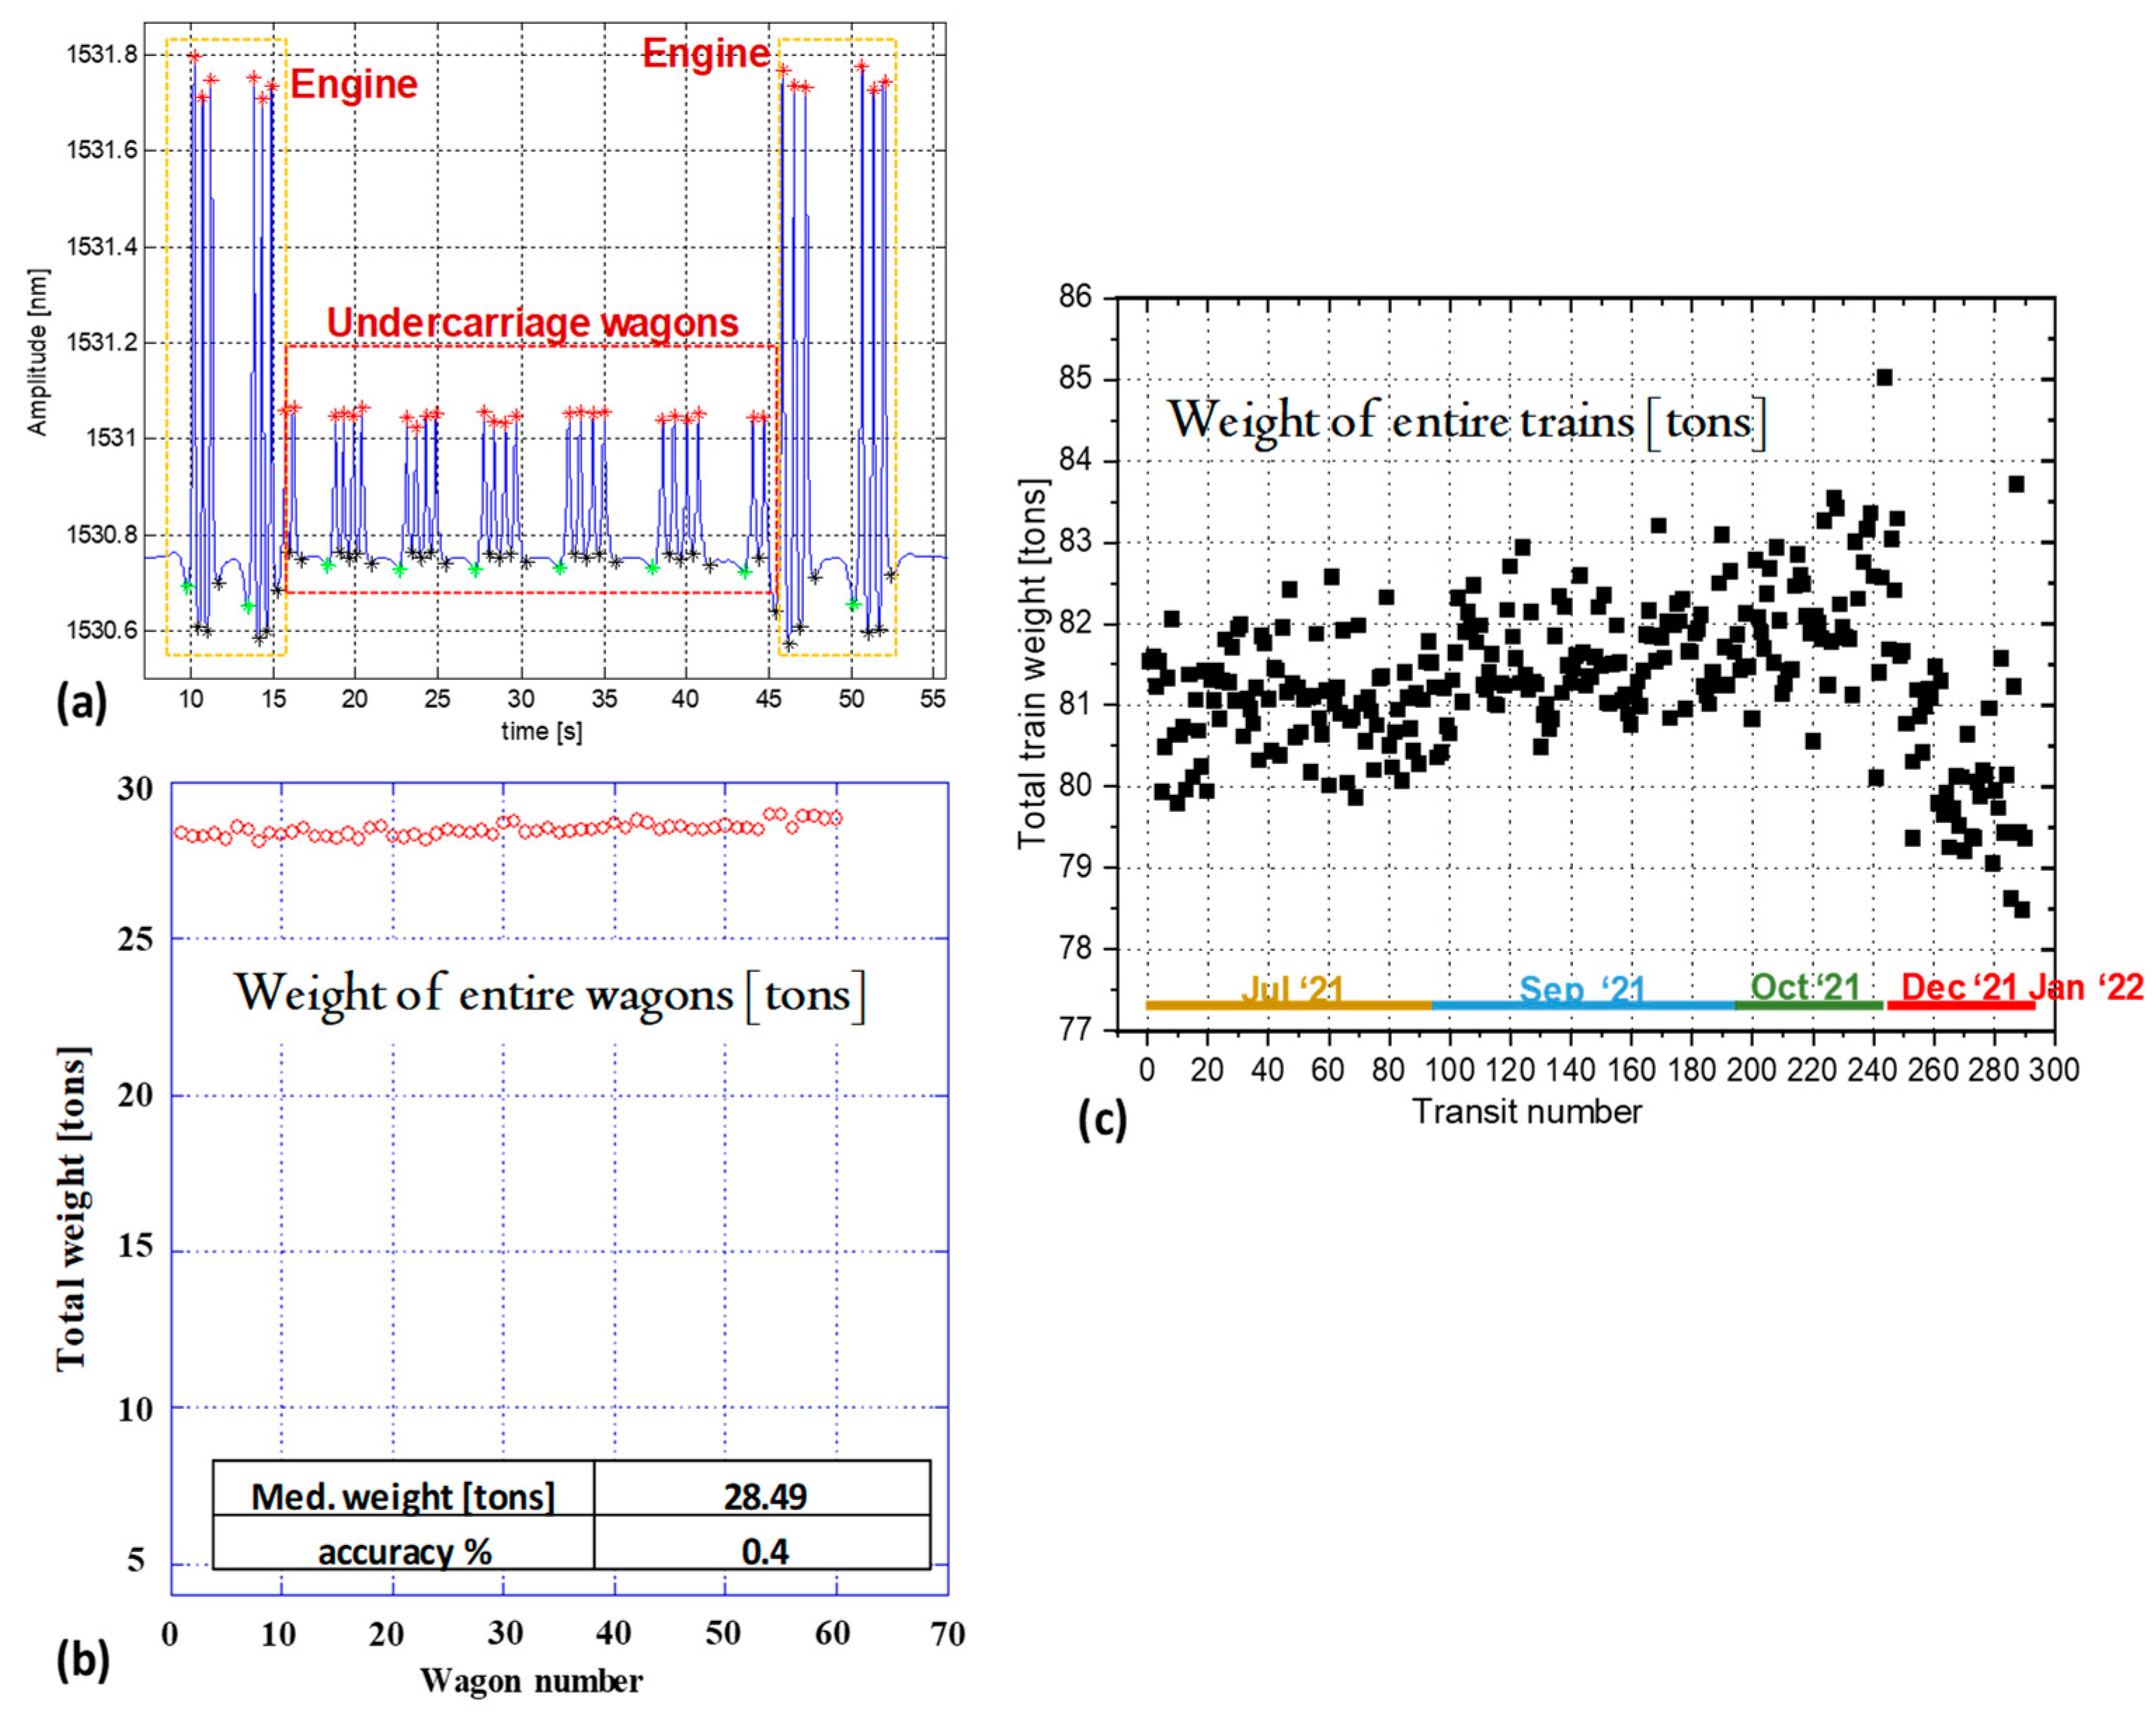
3.1.3. WIM Results
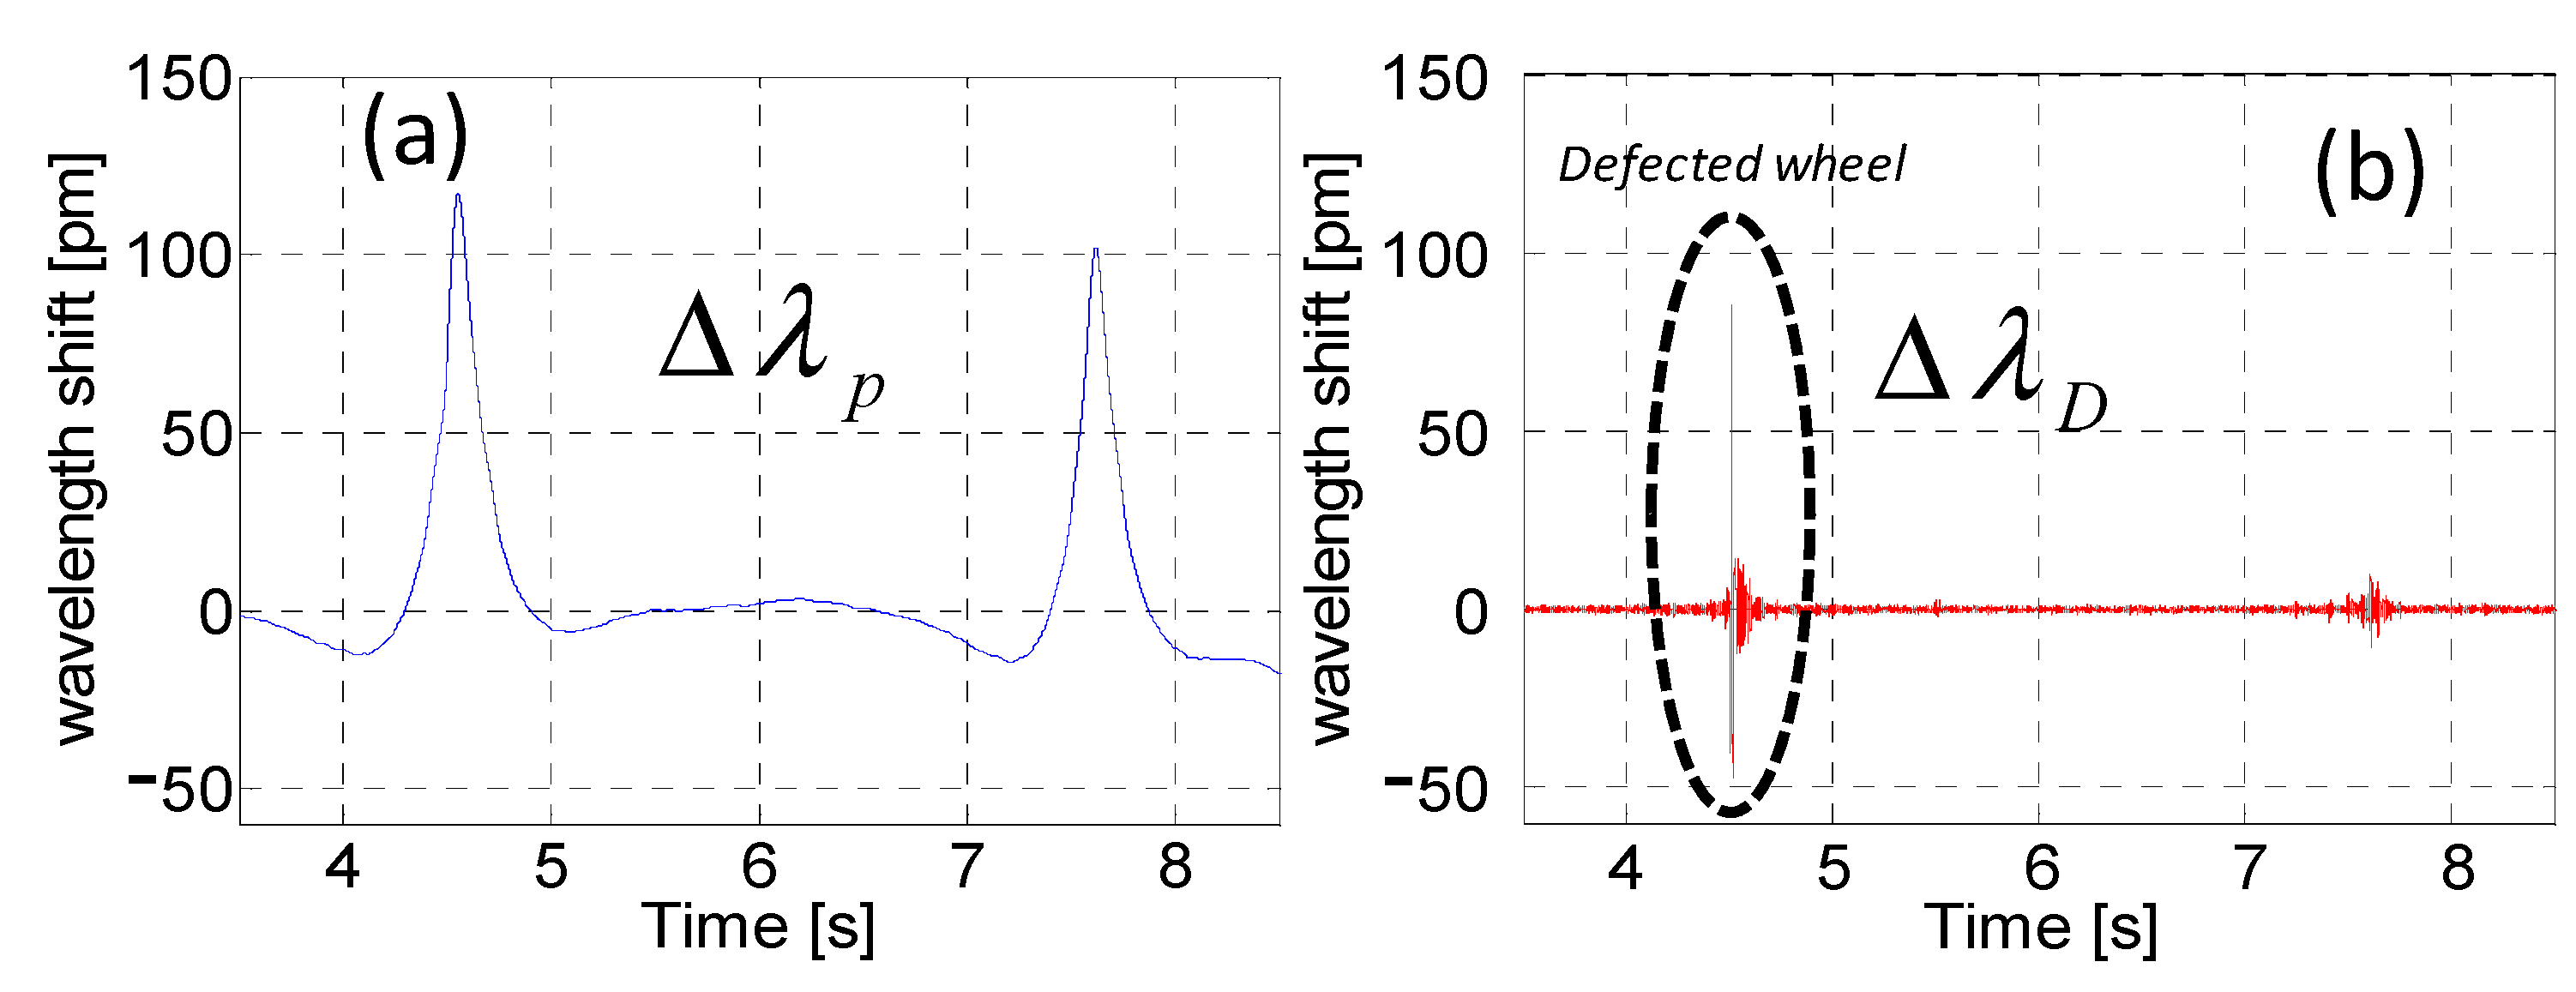
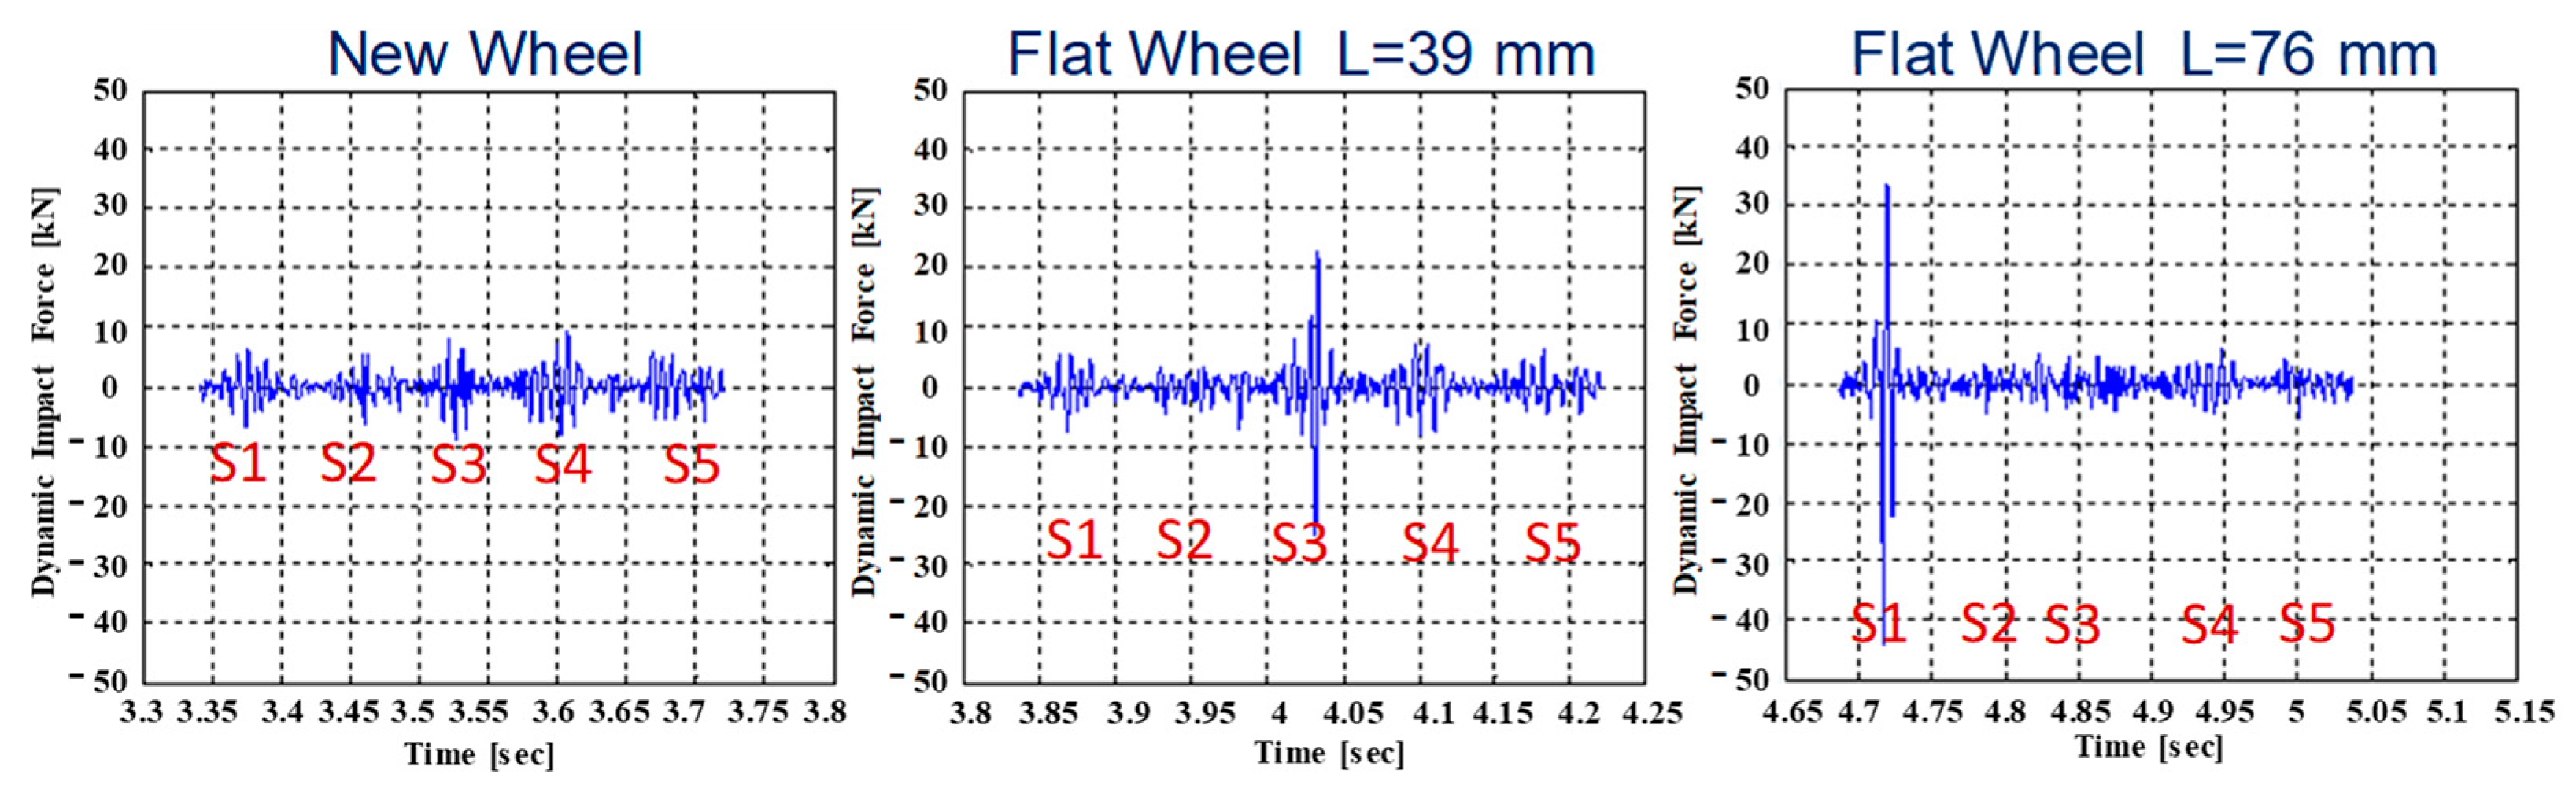
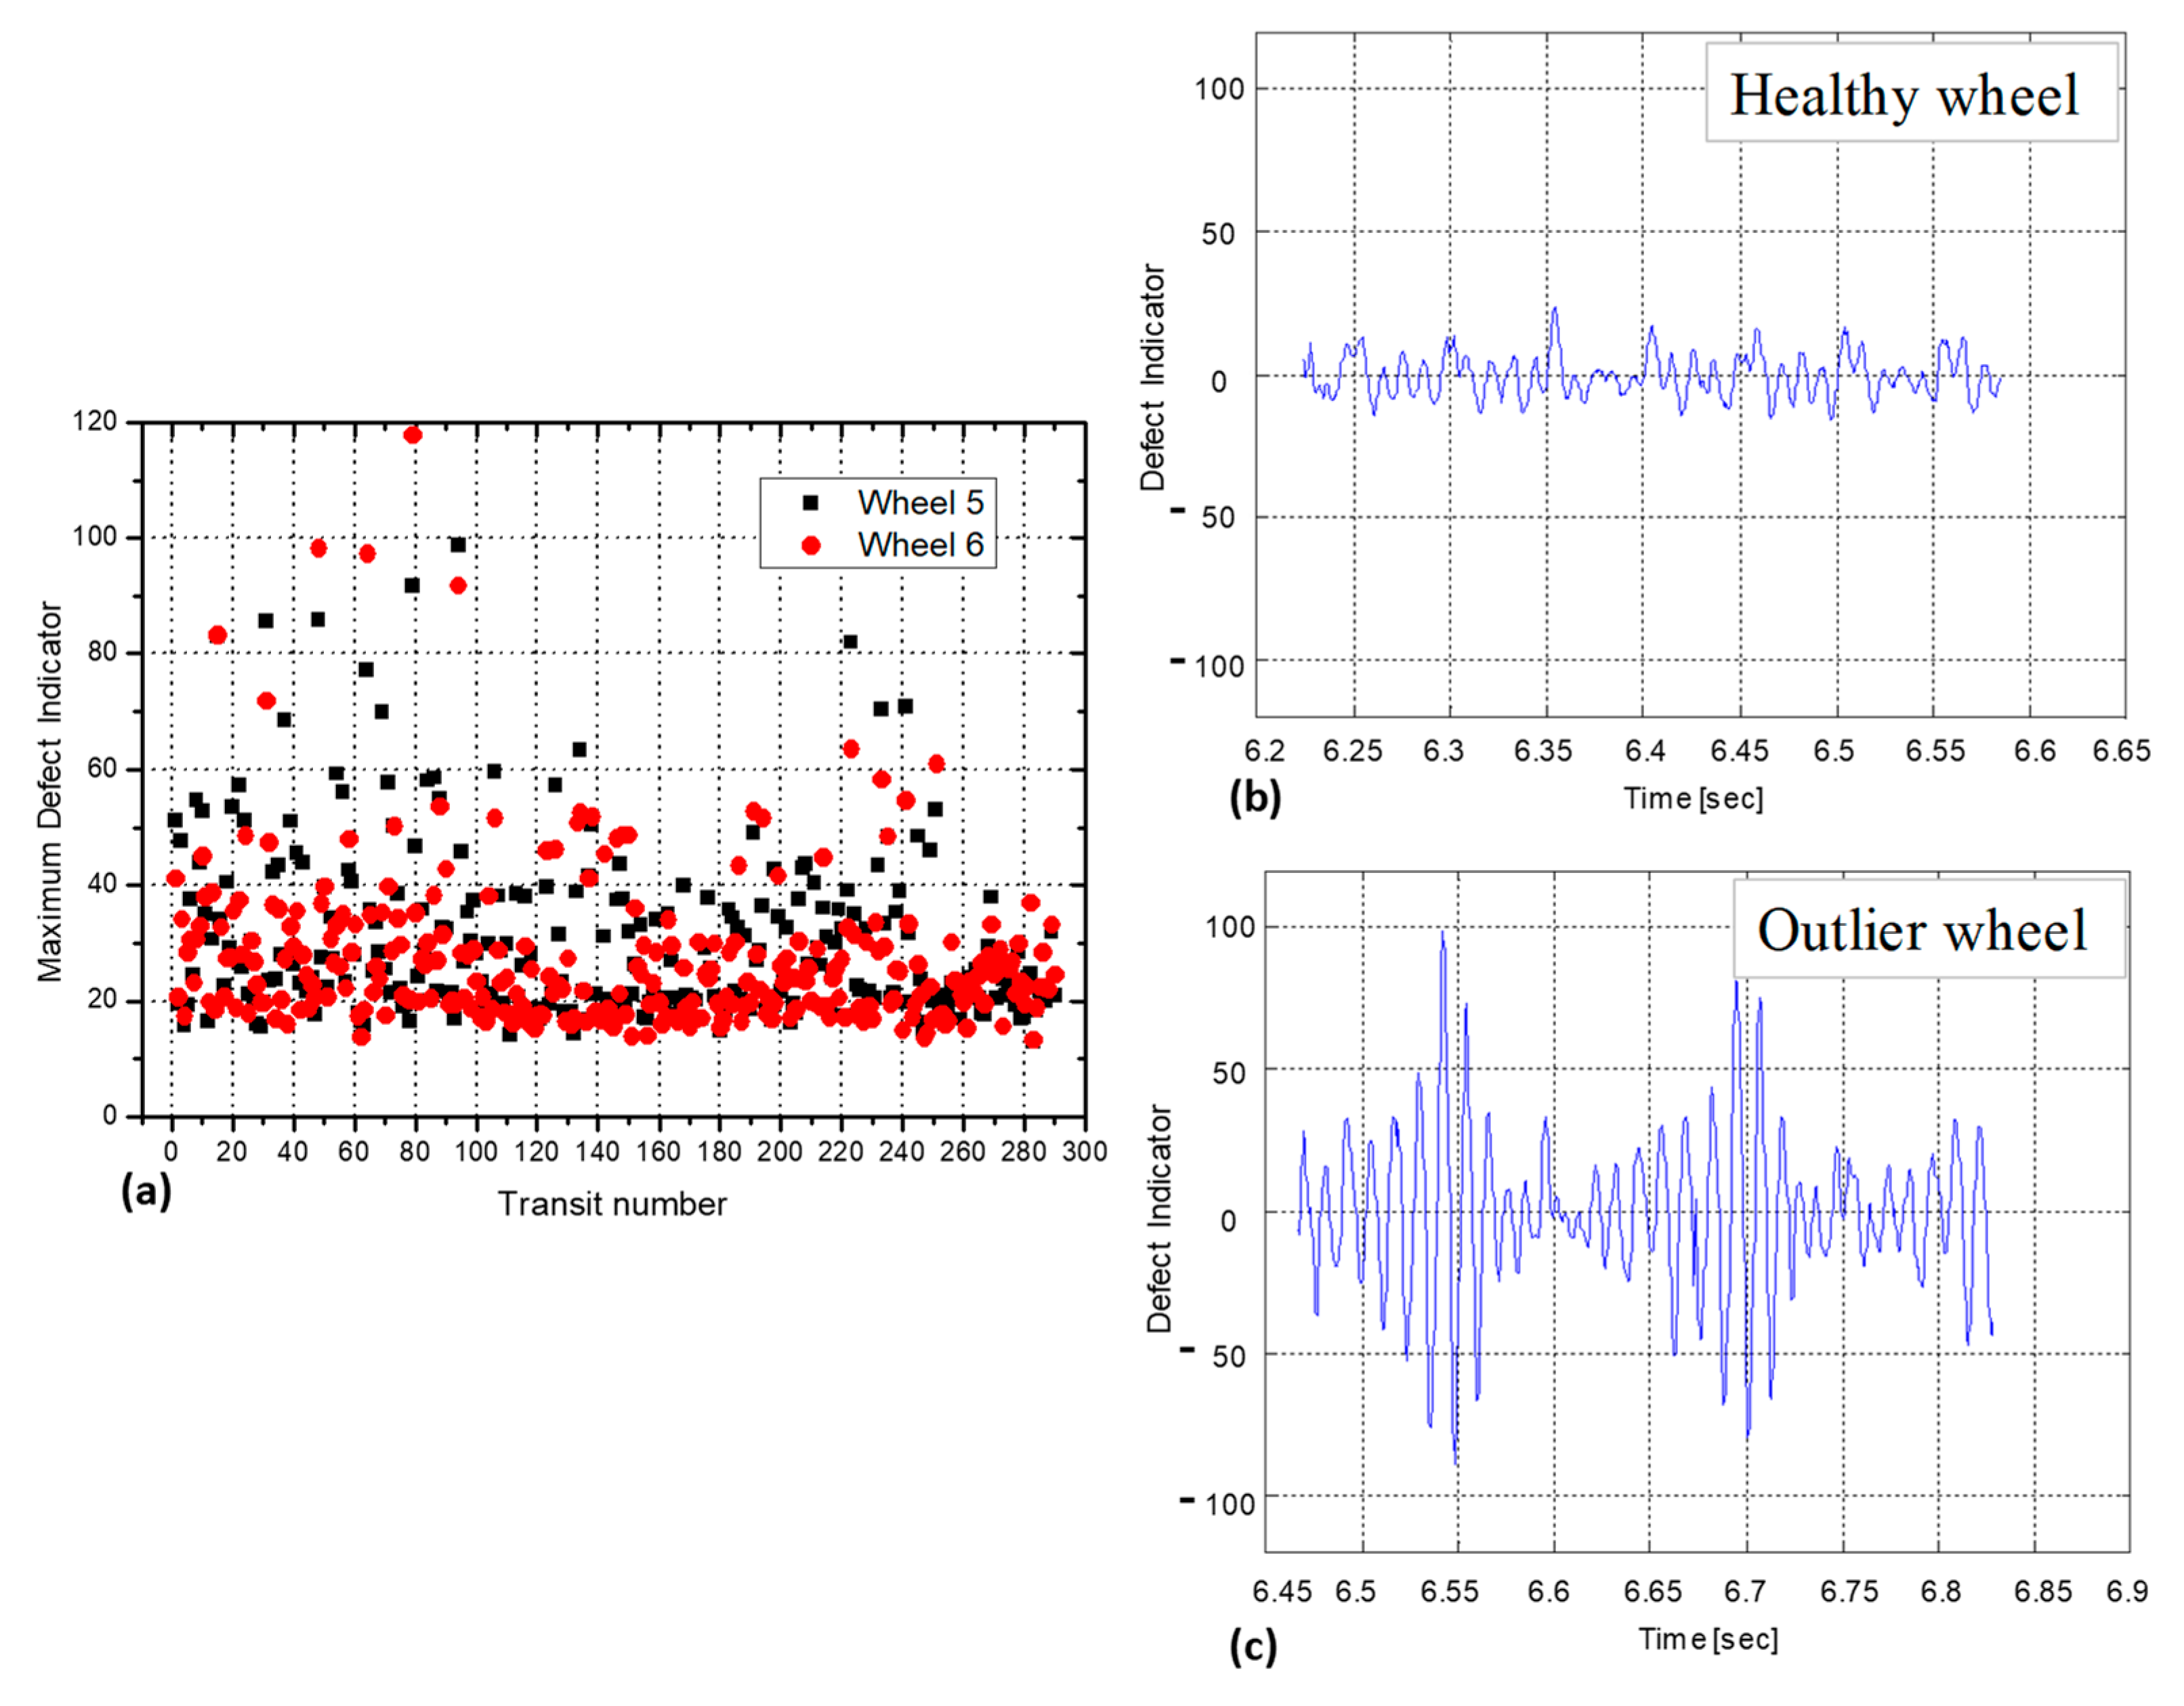
3.1.4. WILD Results
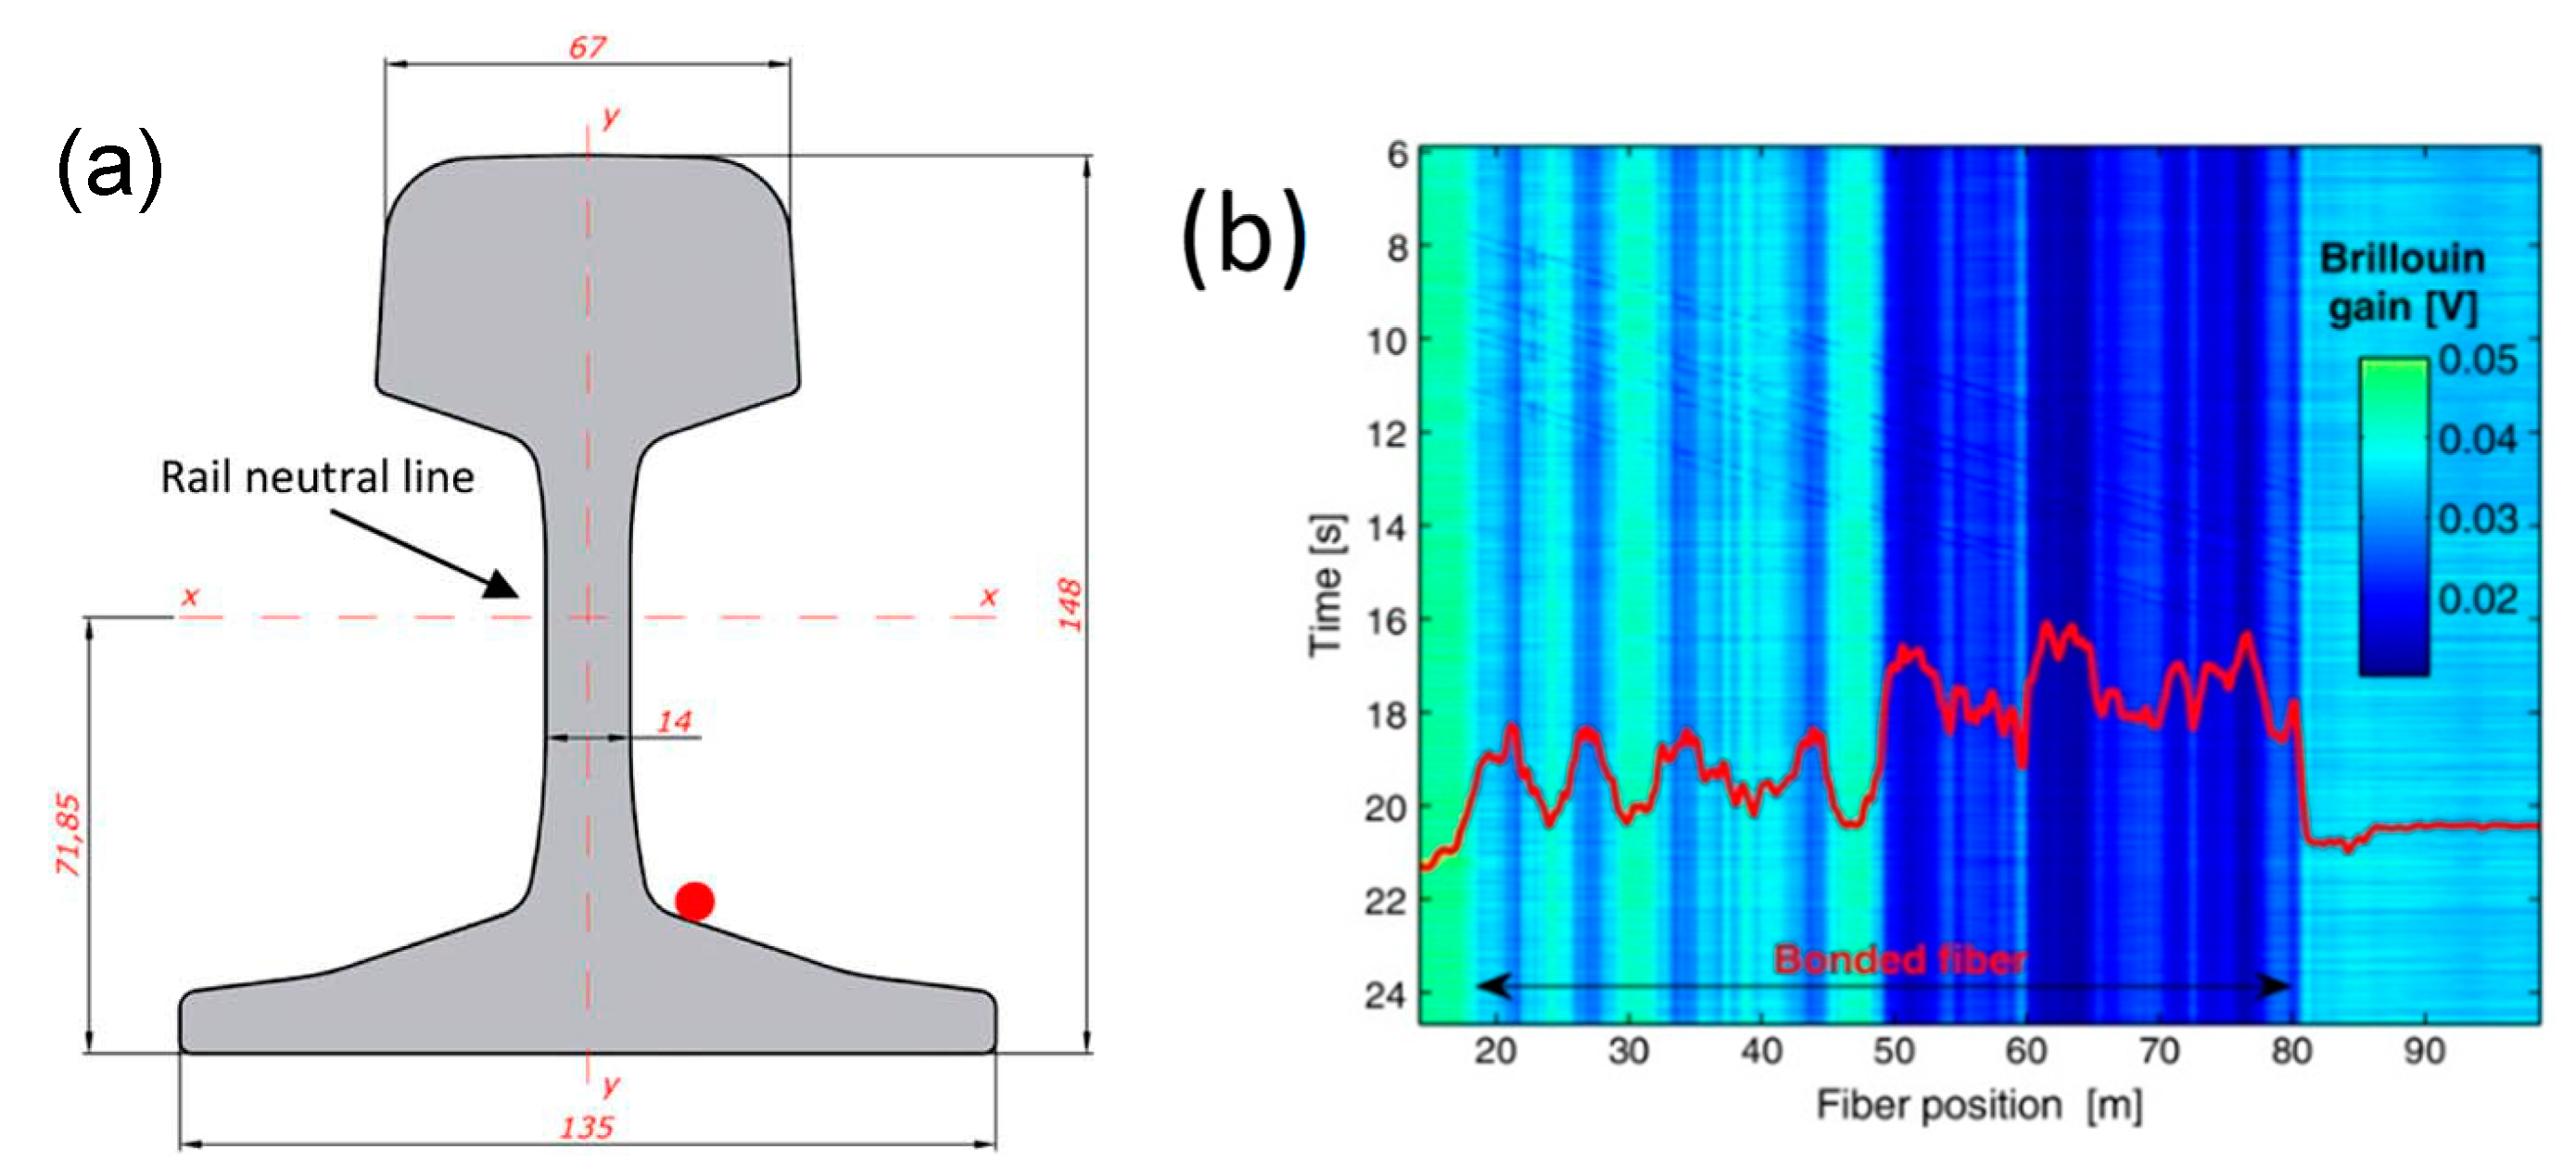
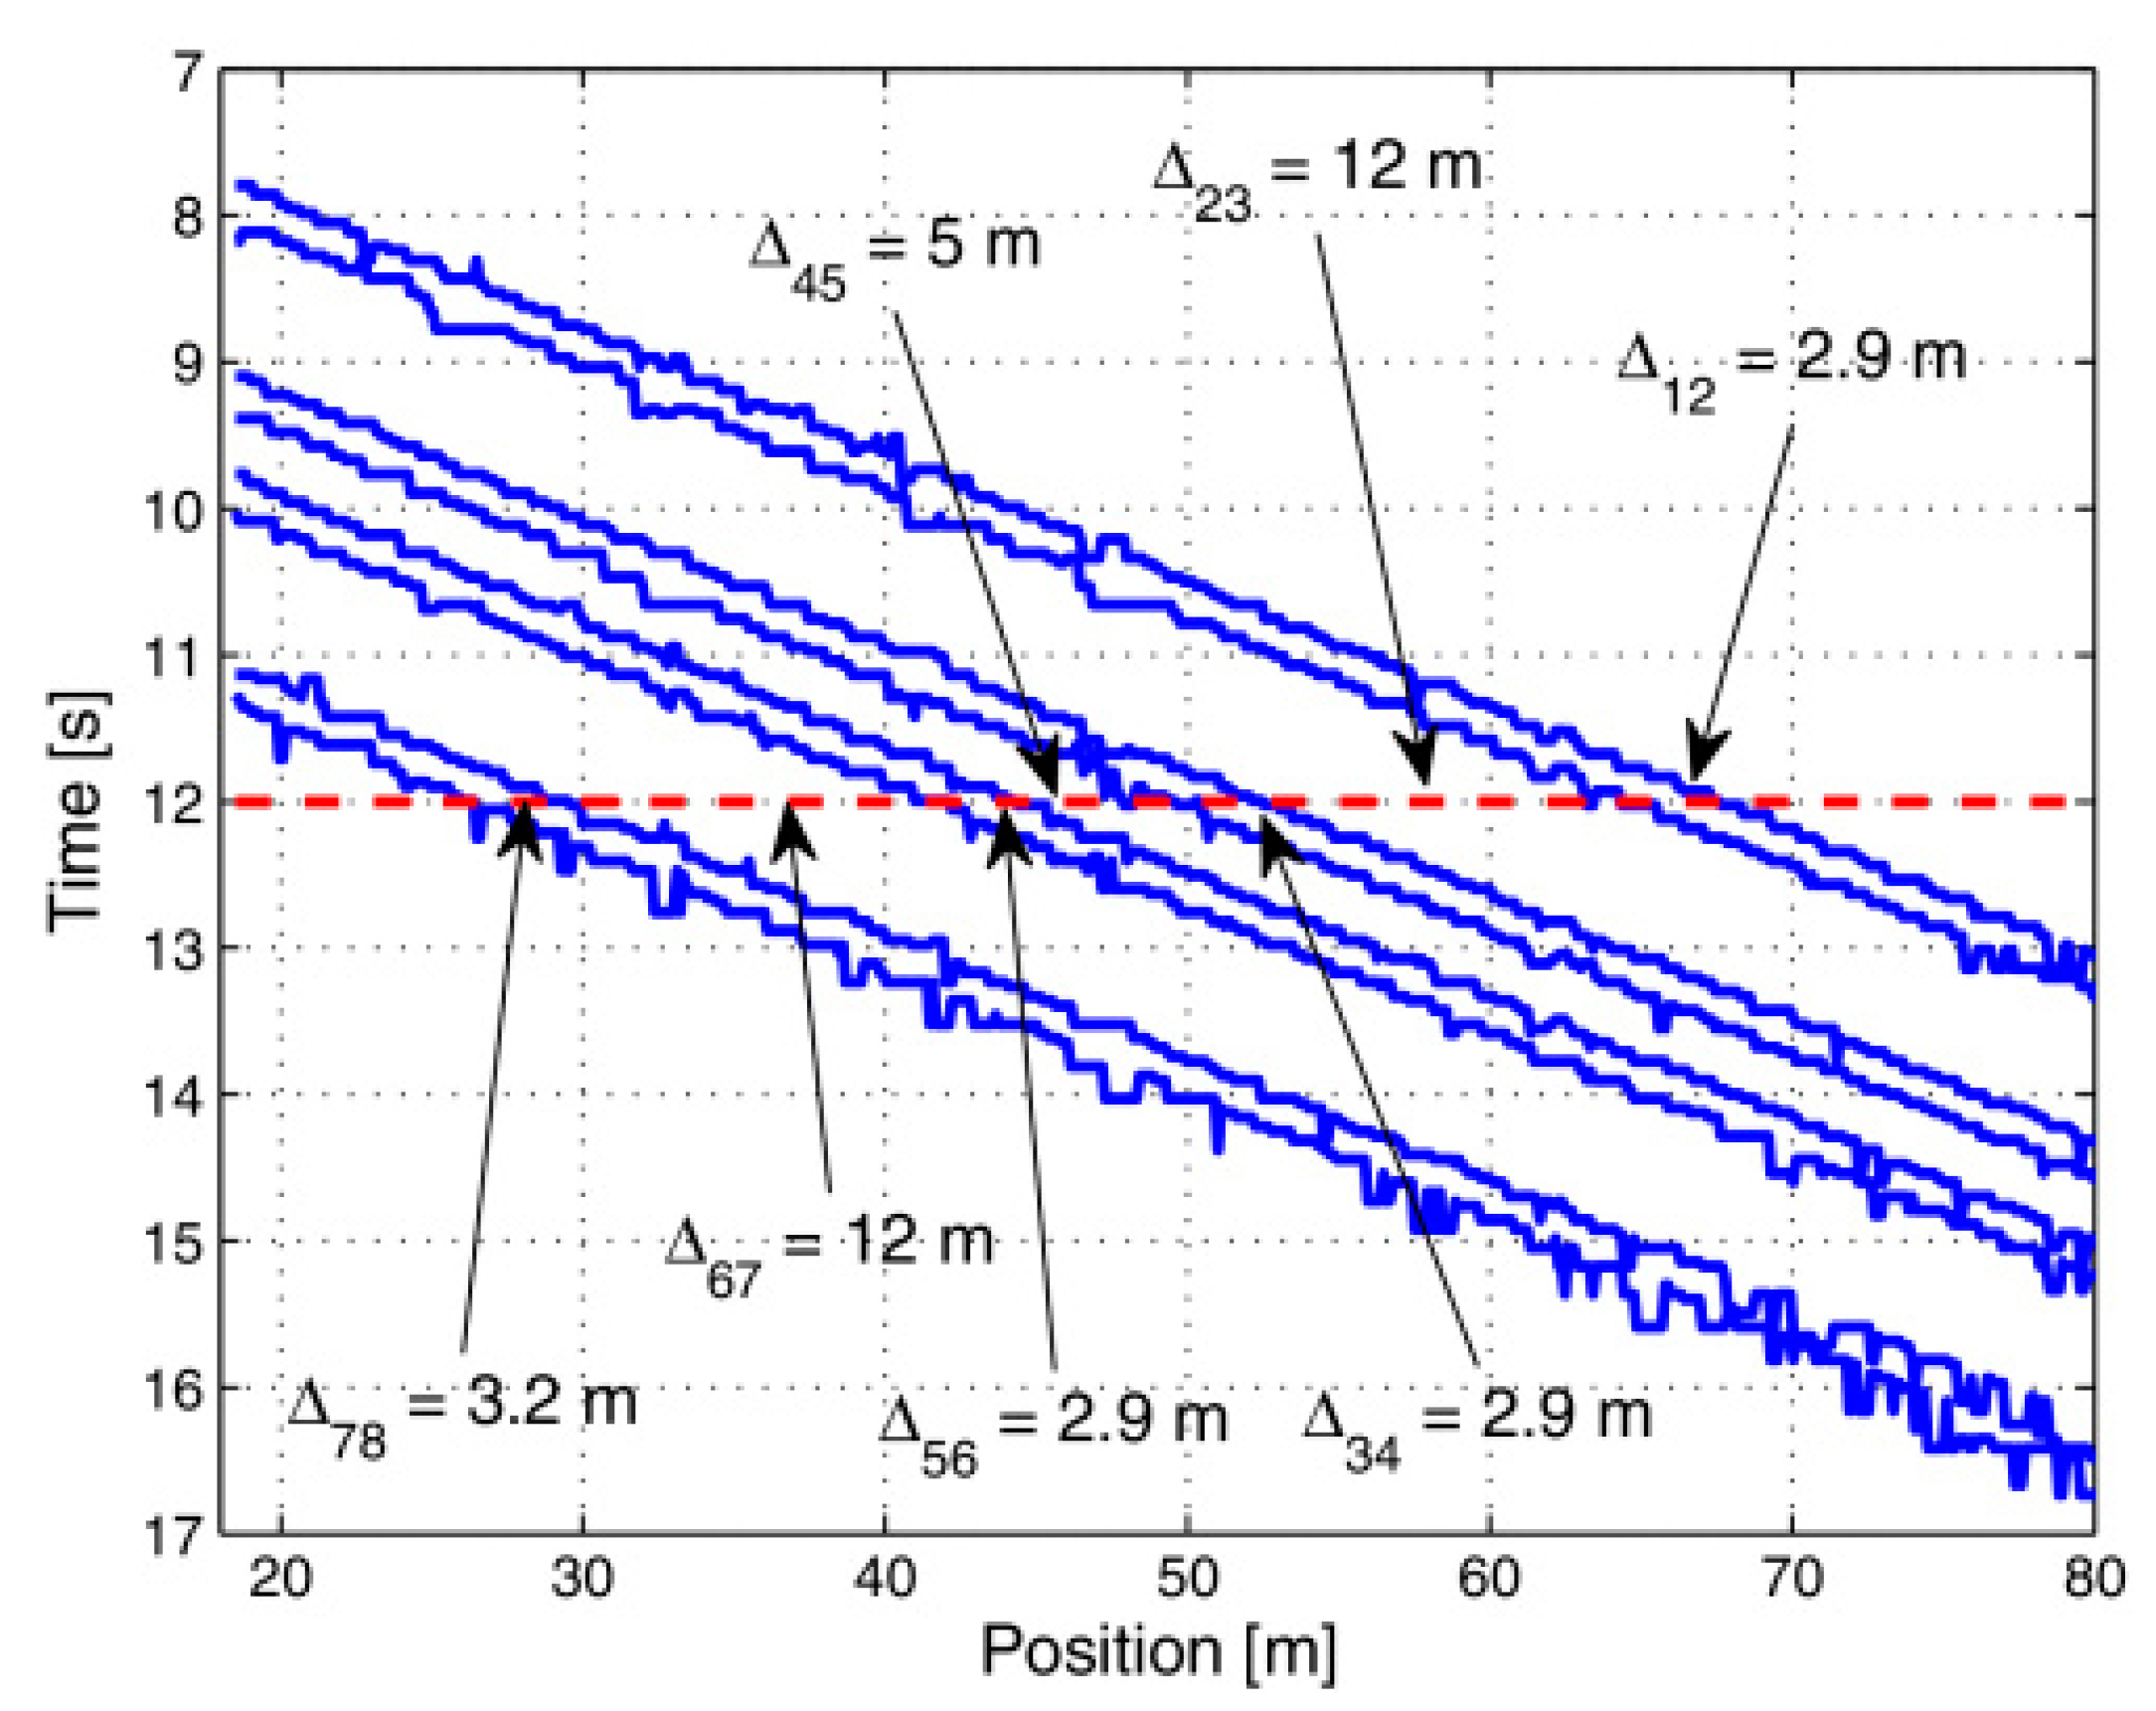
3.2. Railway Traffic Monitoring and WIM Based on Distributed Optical Fiber Sensors
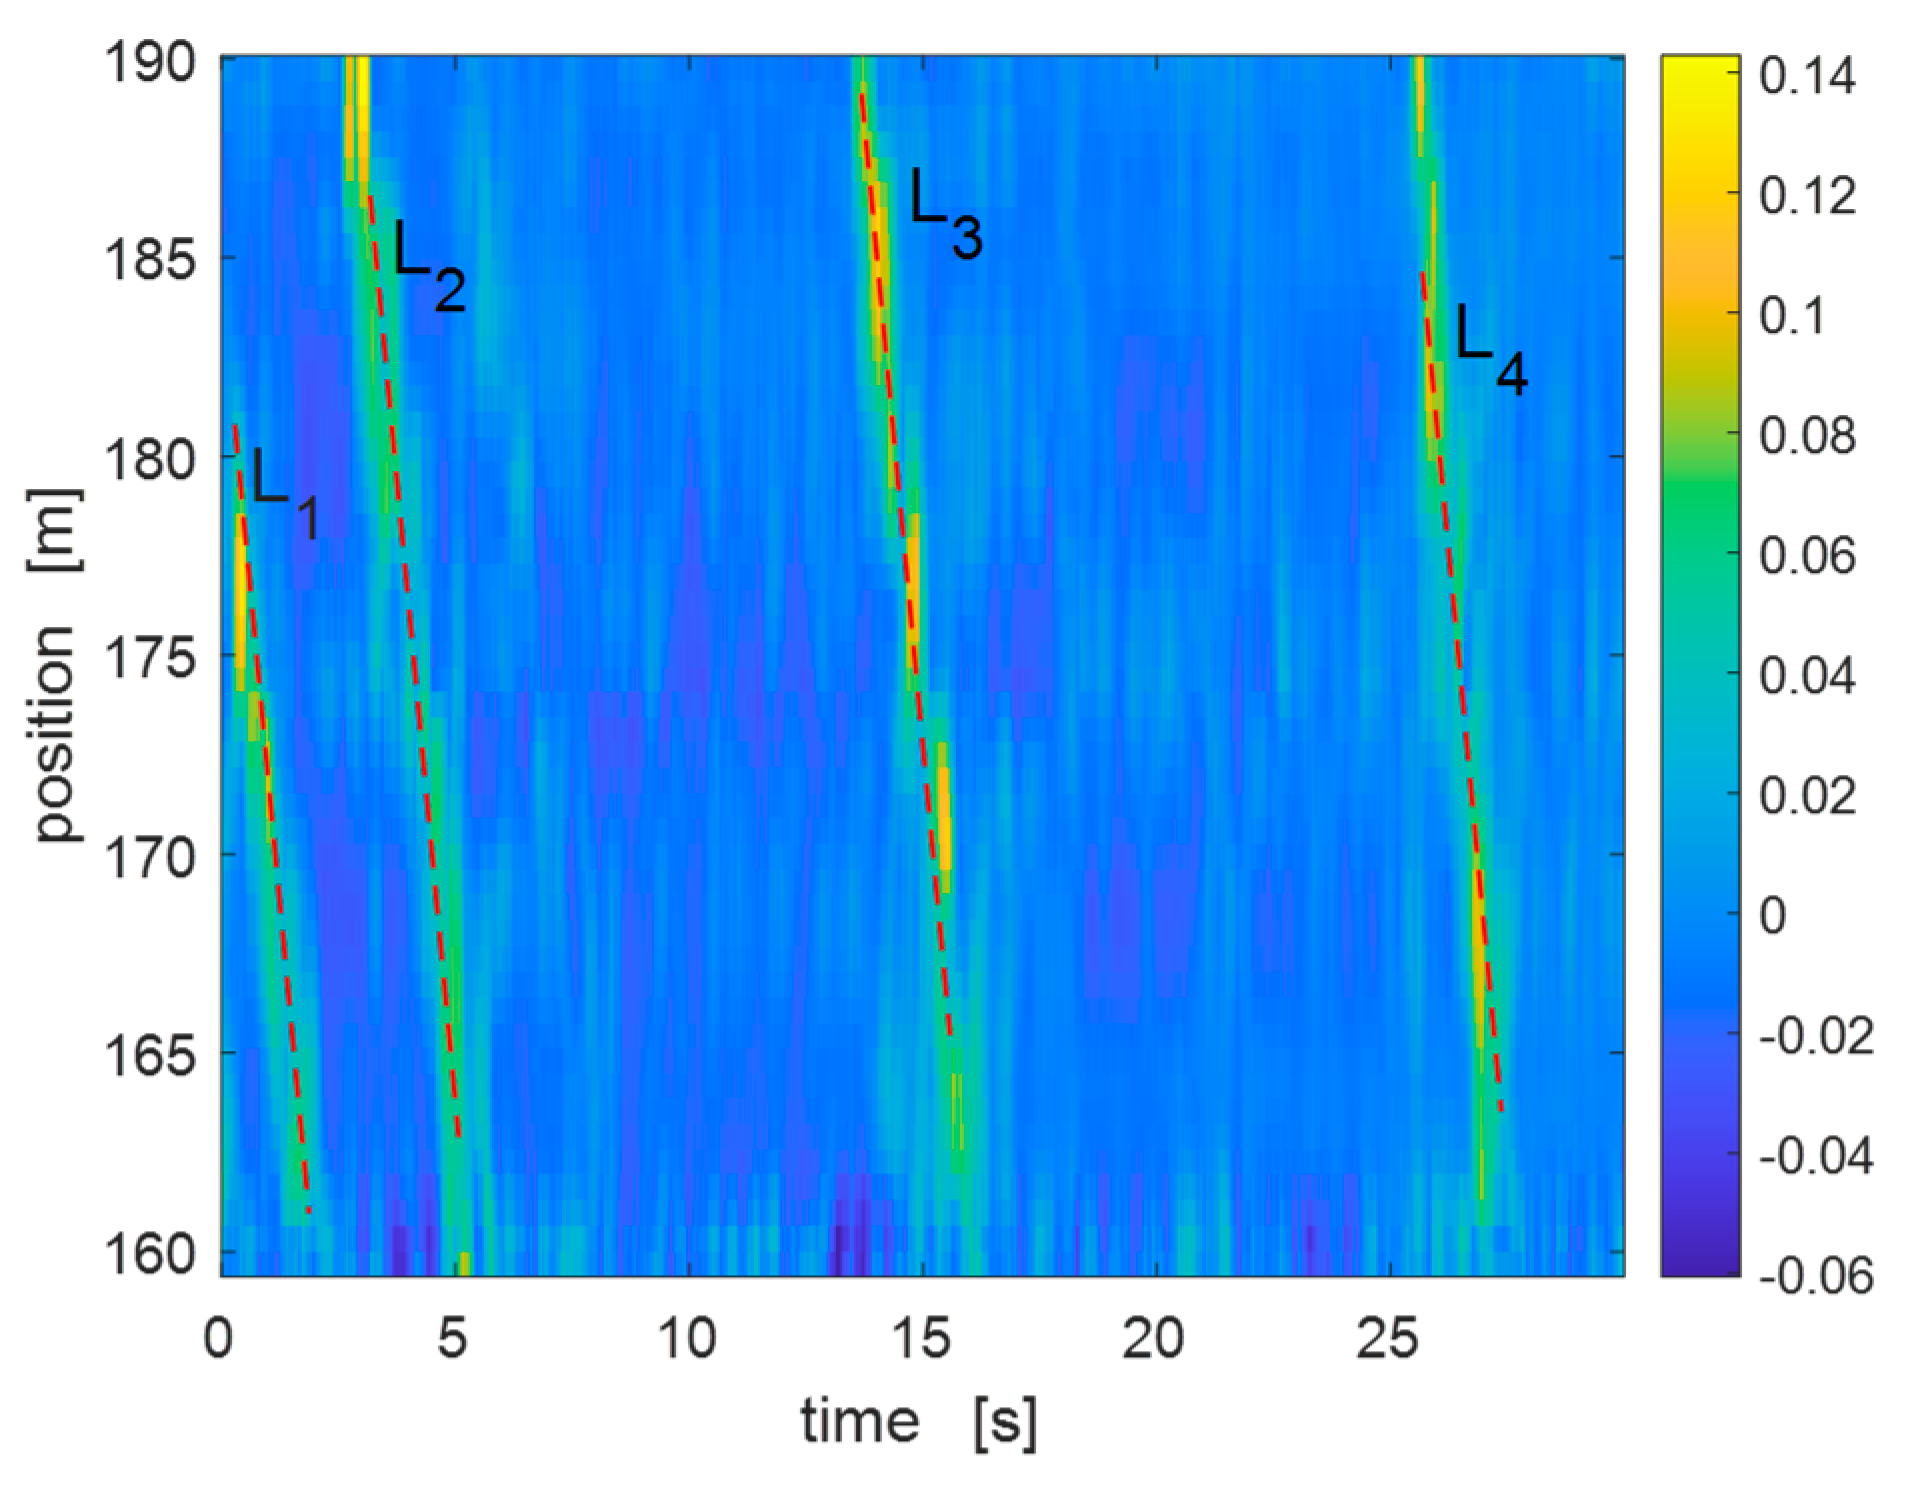
3.3. Road Traffic Monitoring Based on Distributed Optical Fiber Sensors
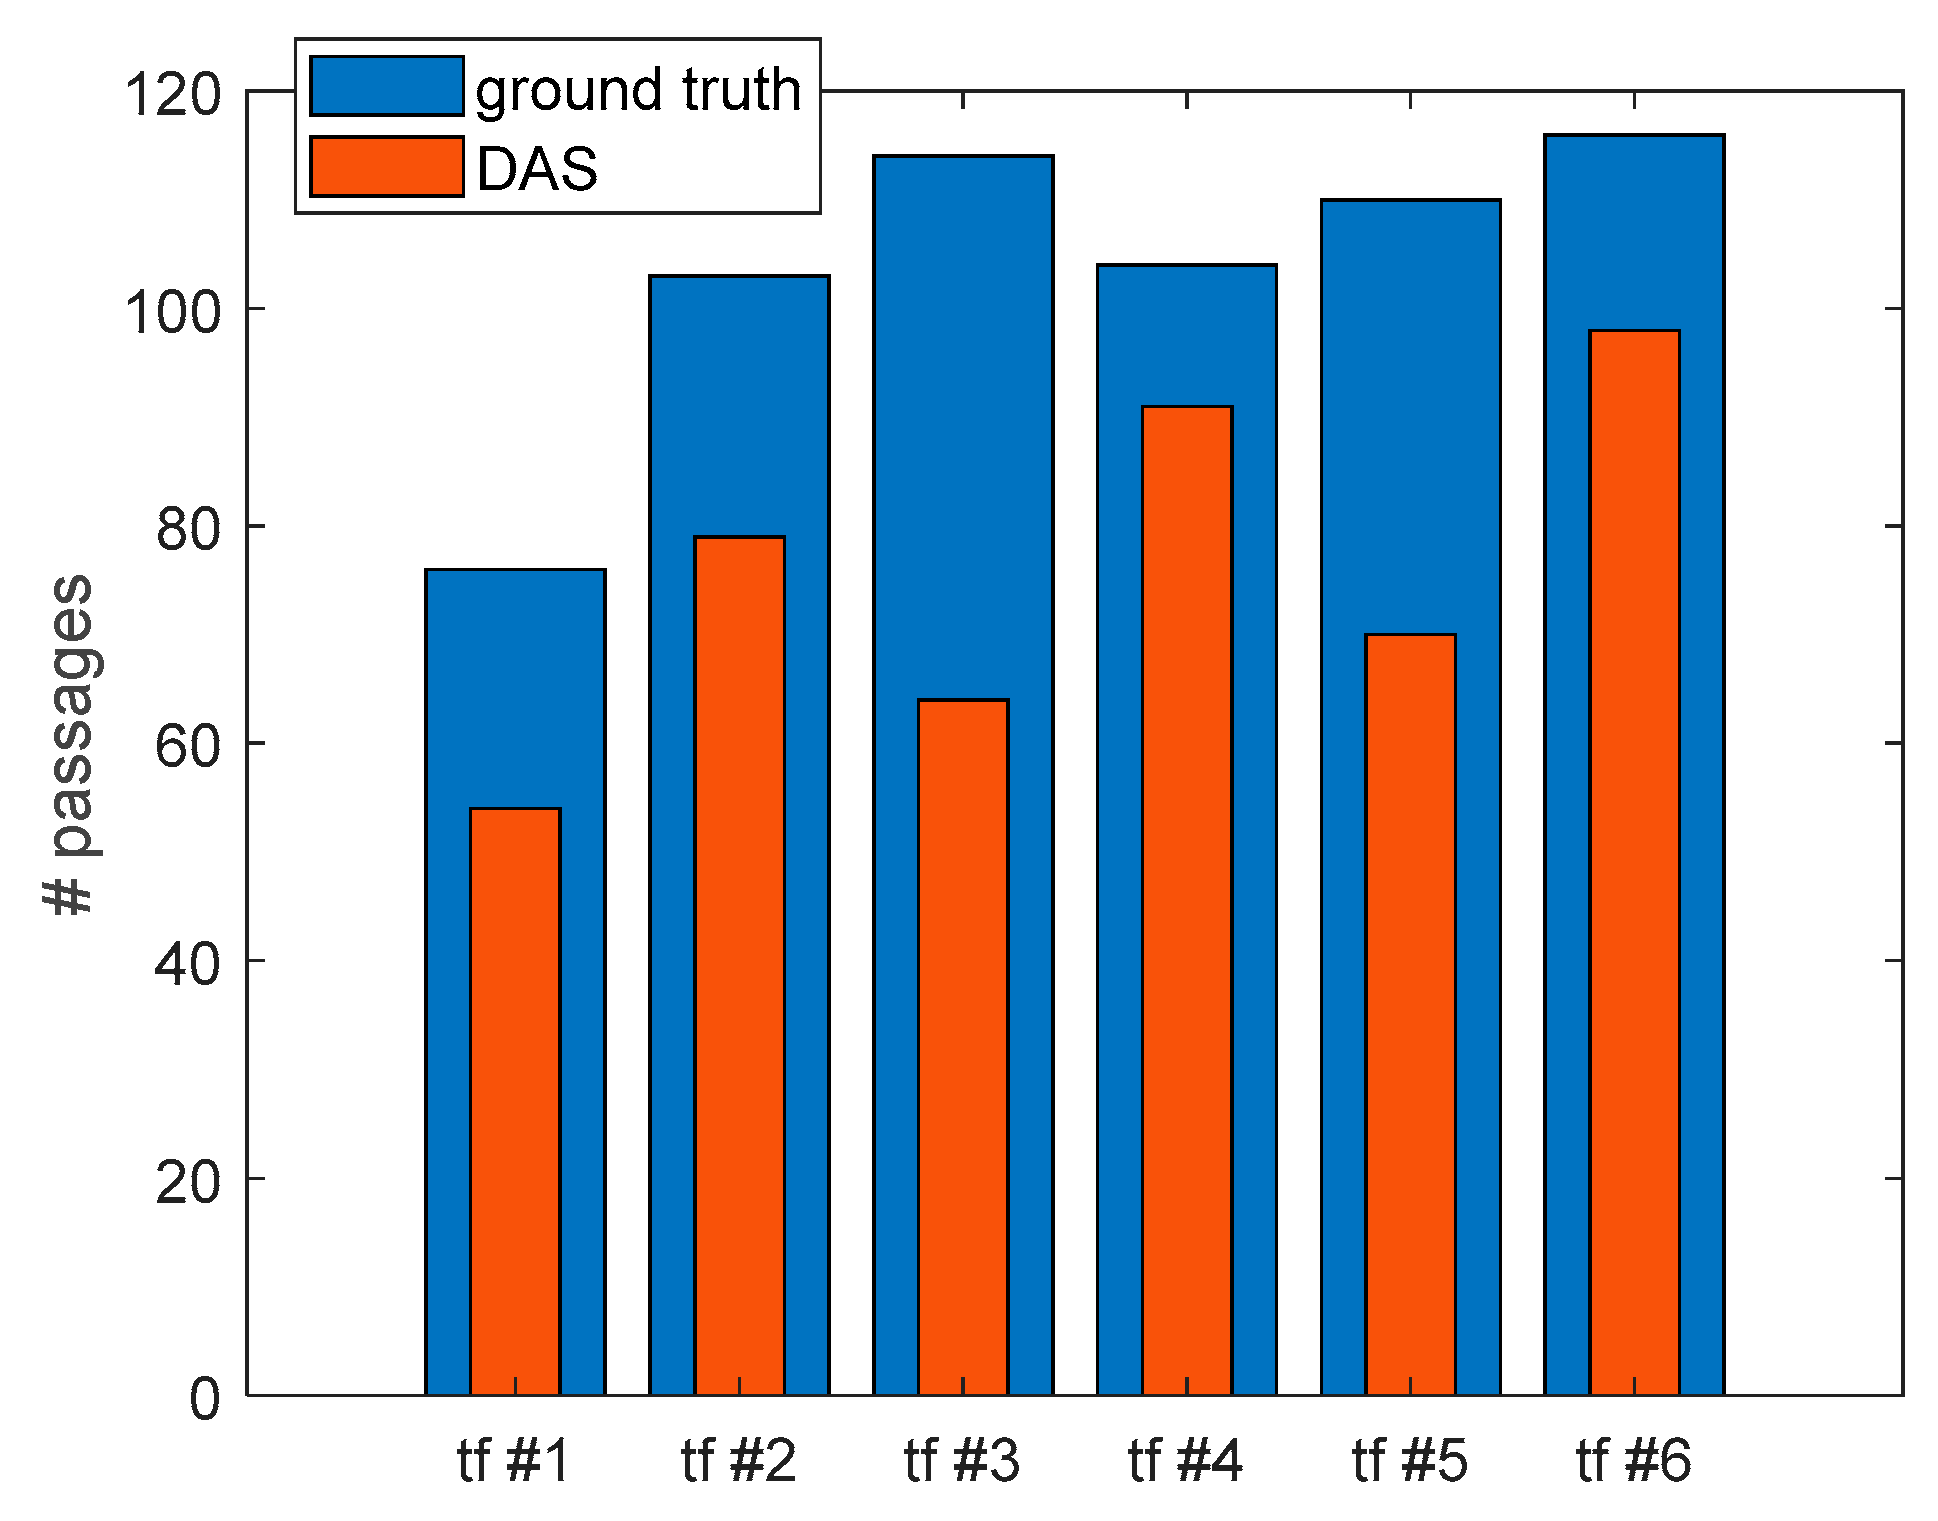
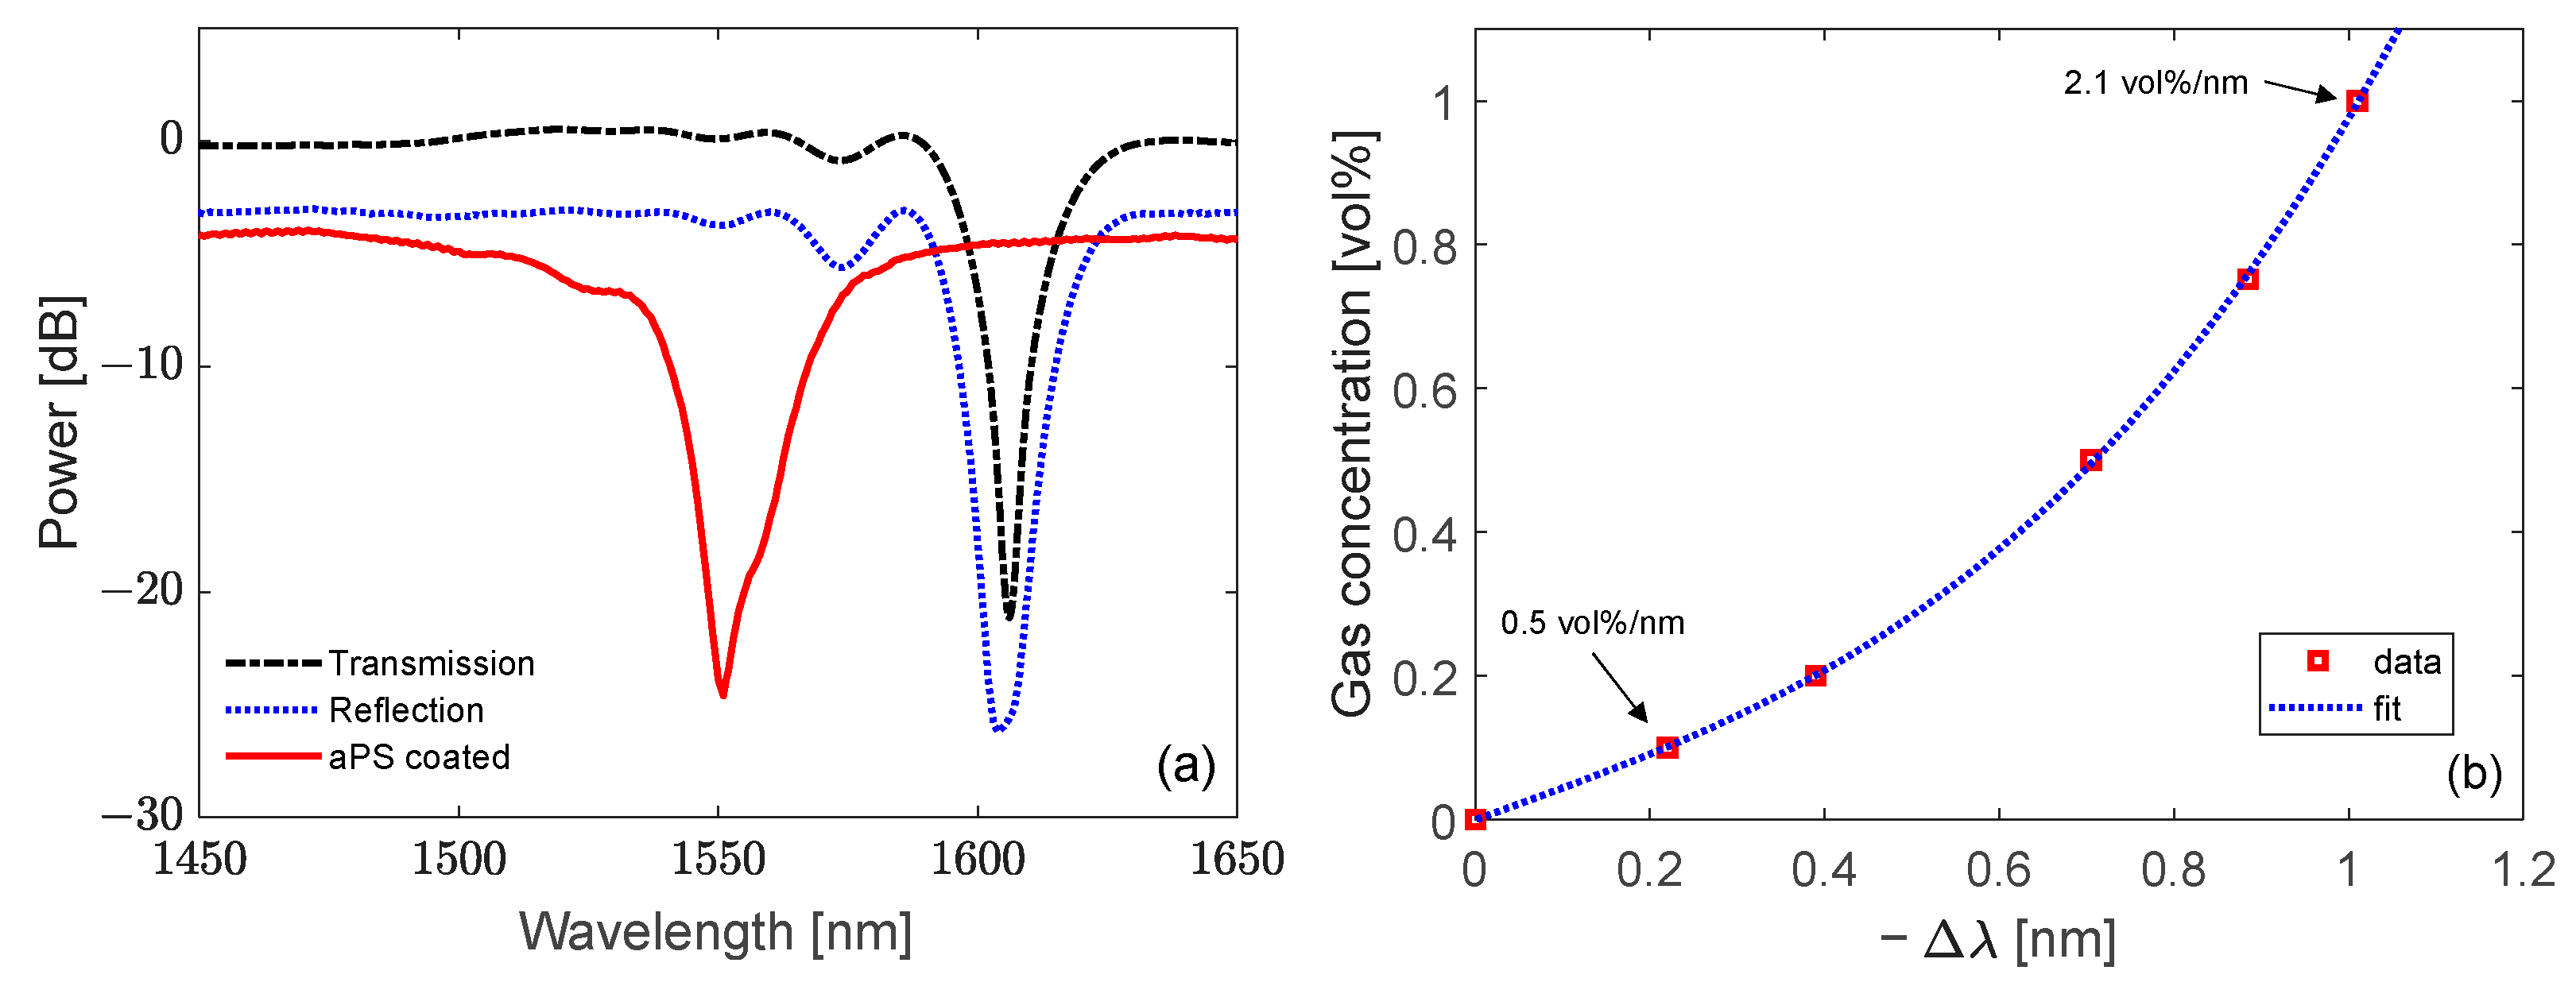
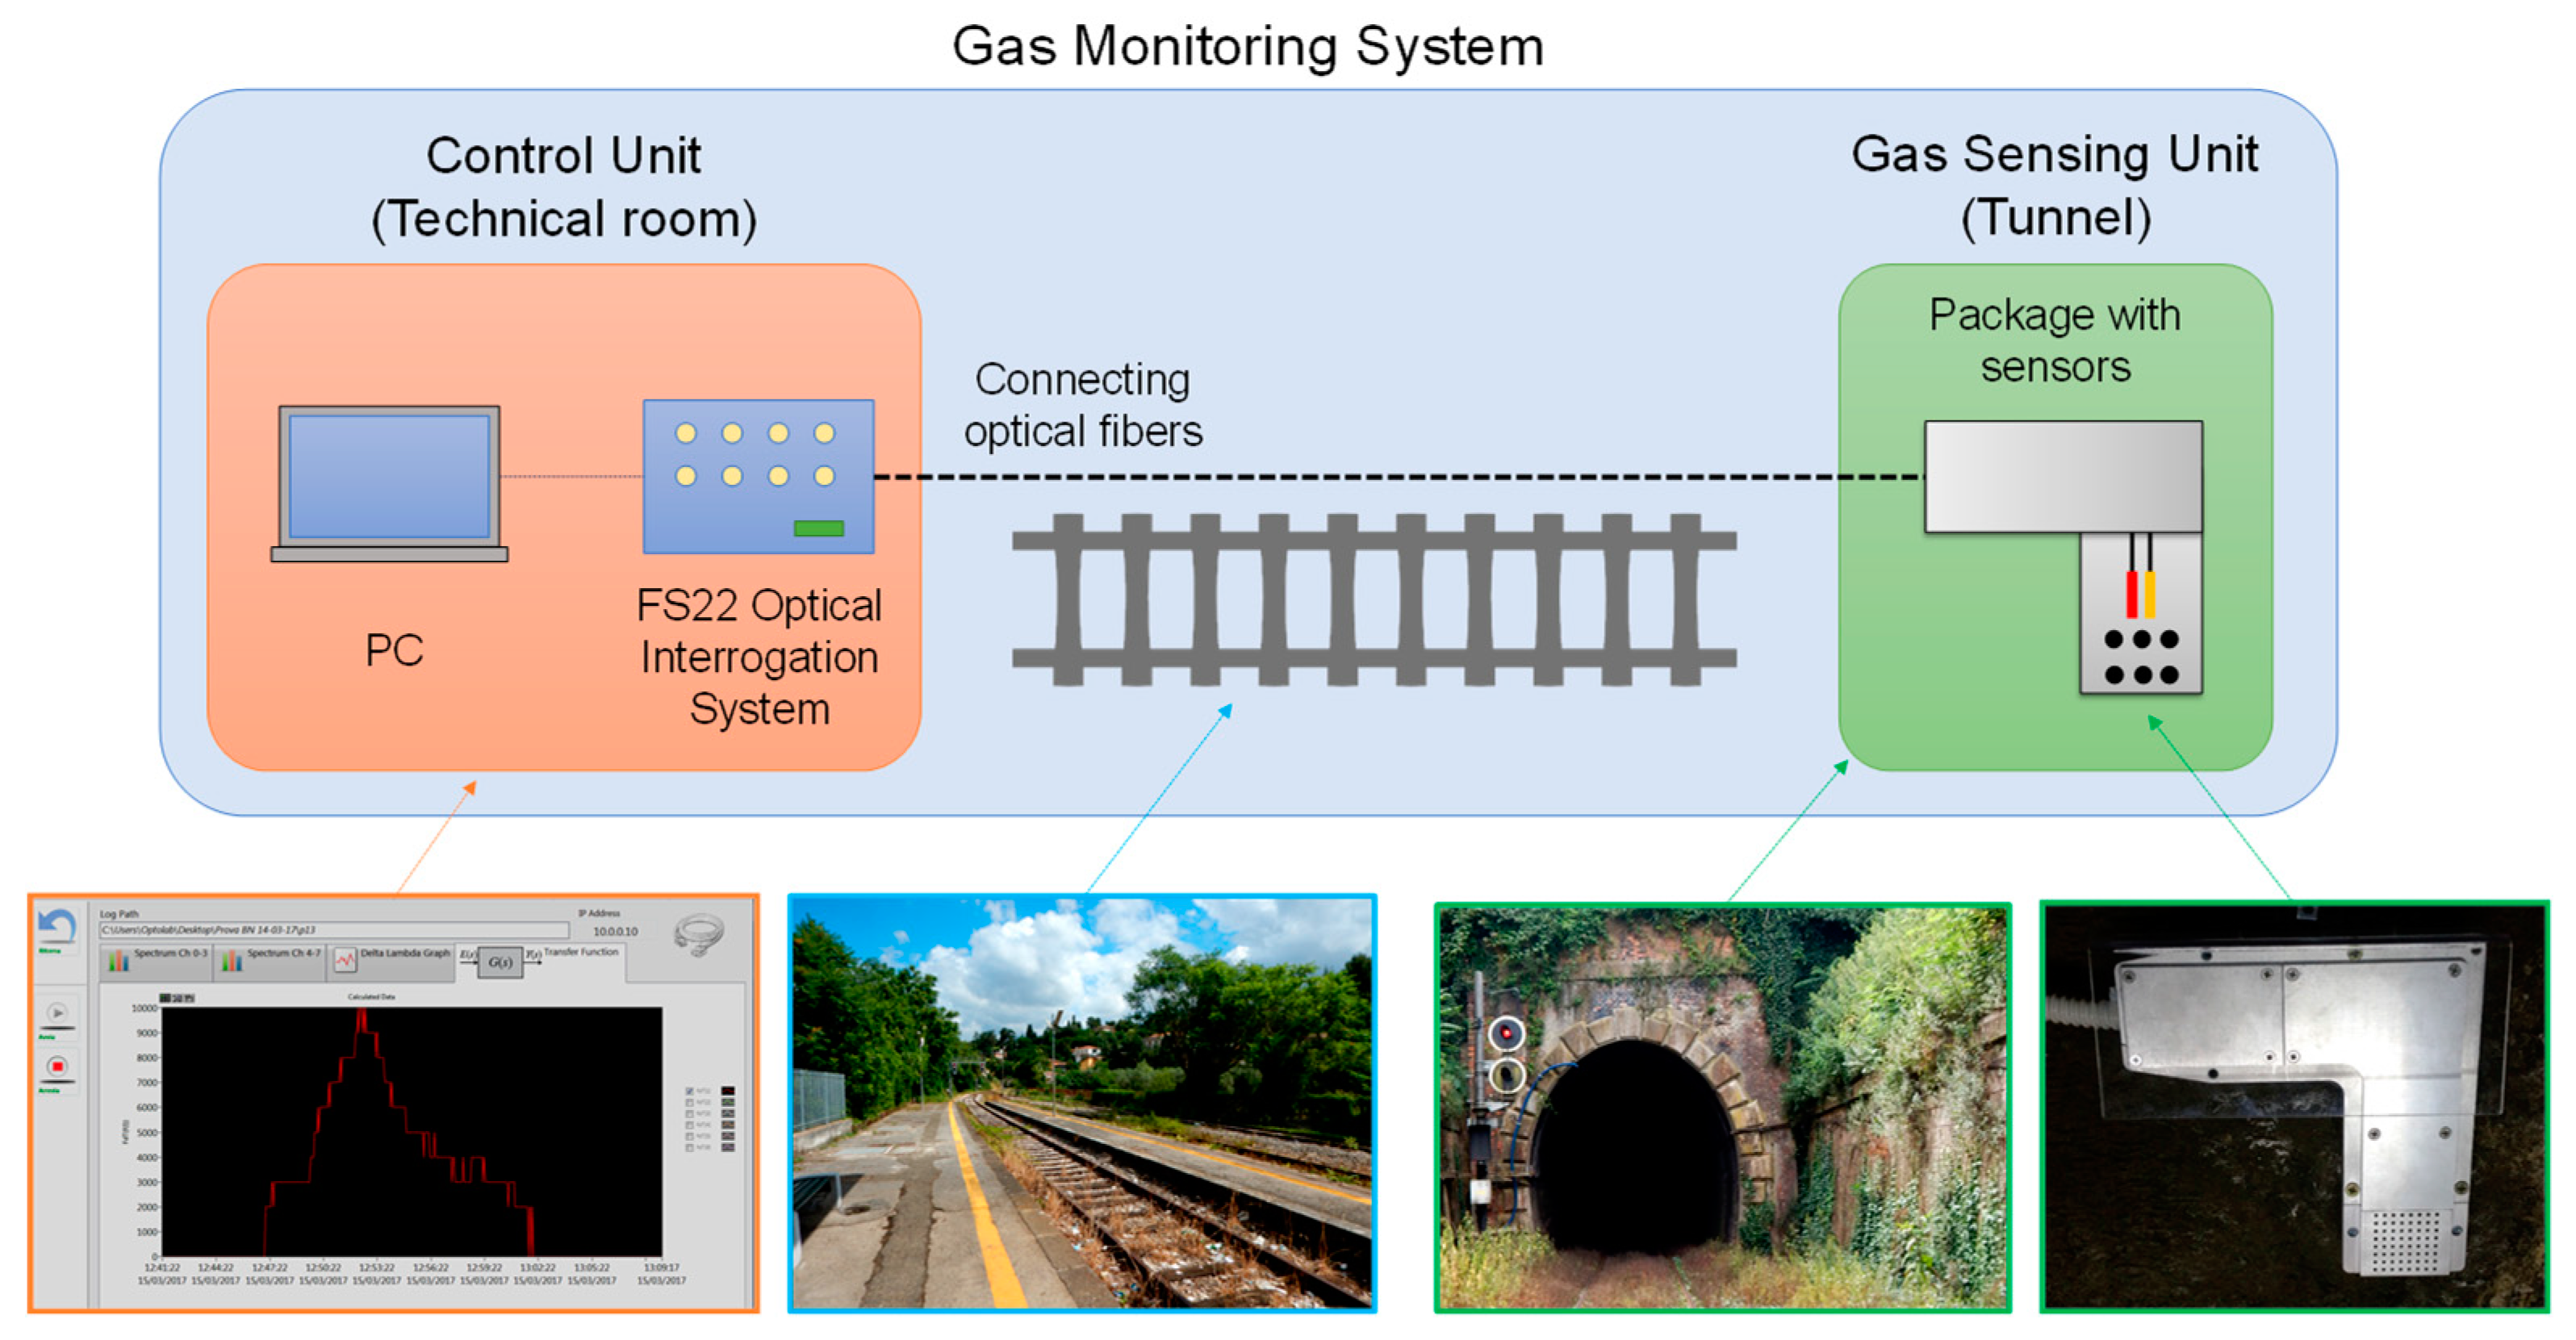
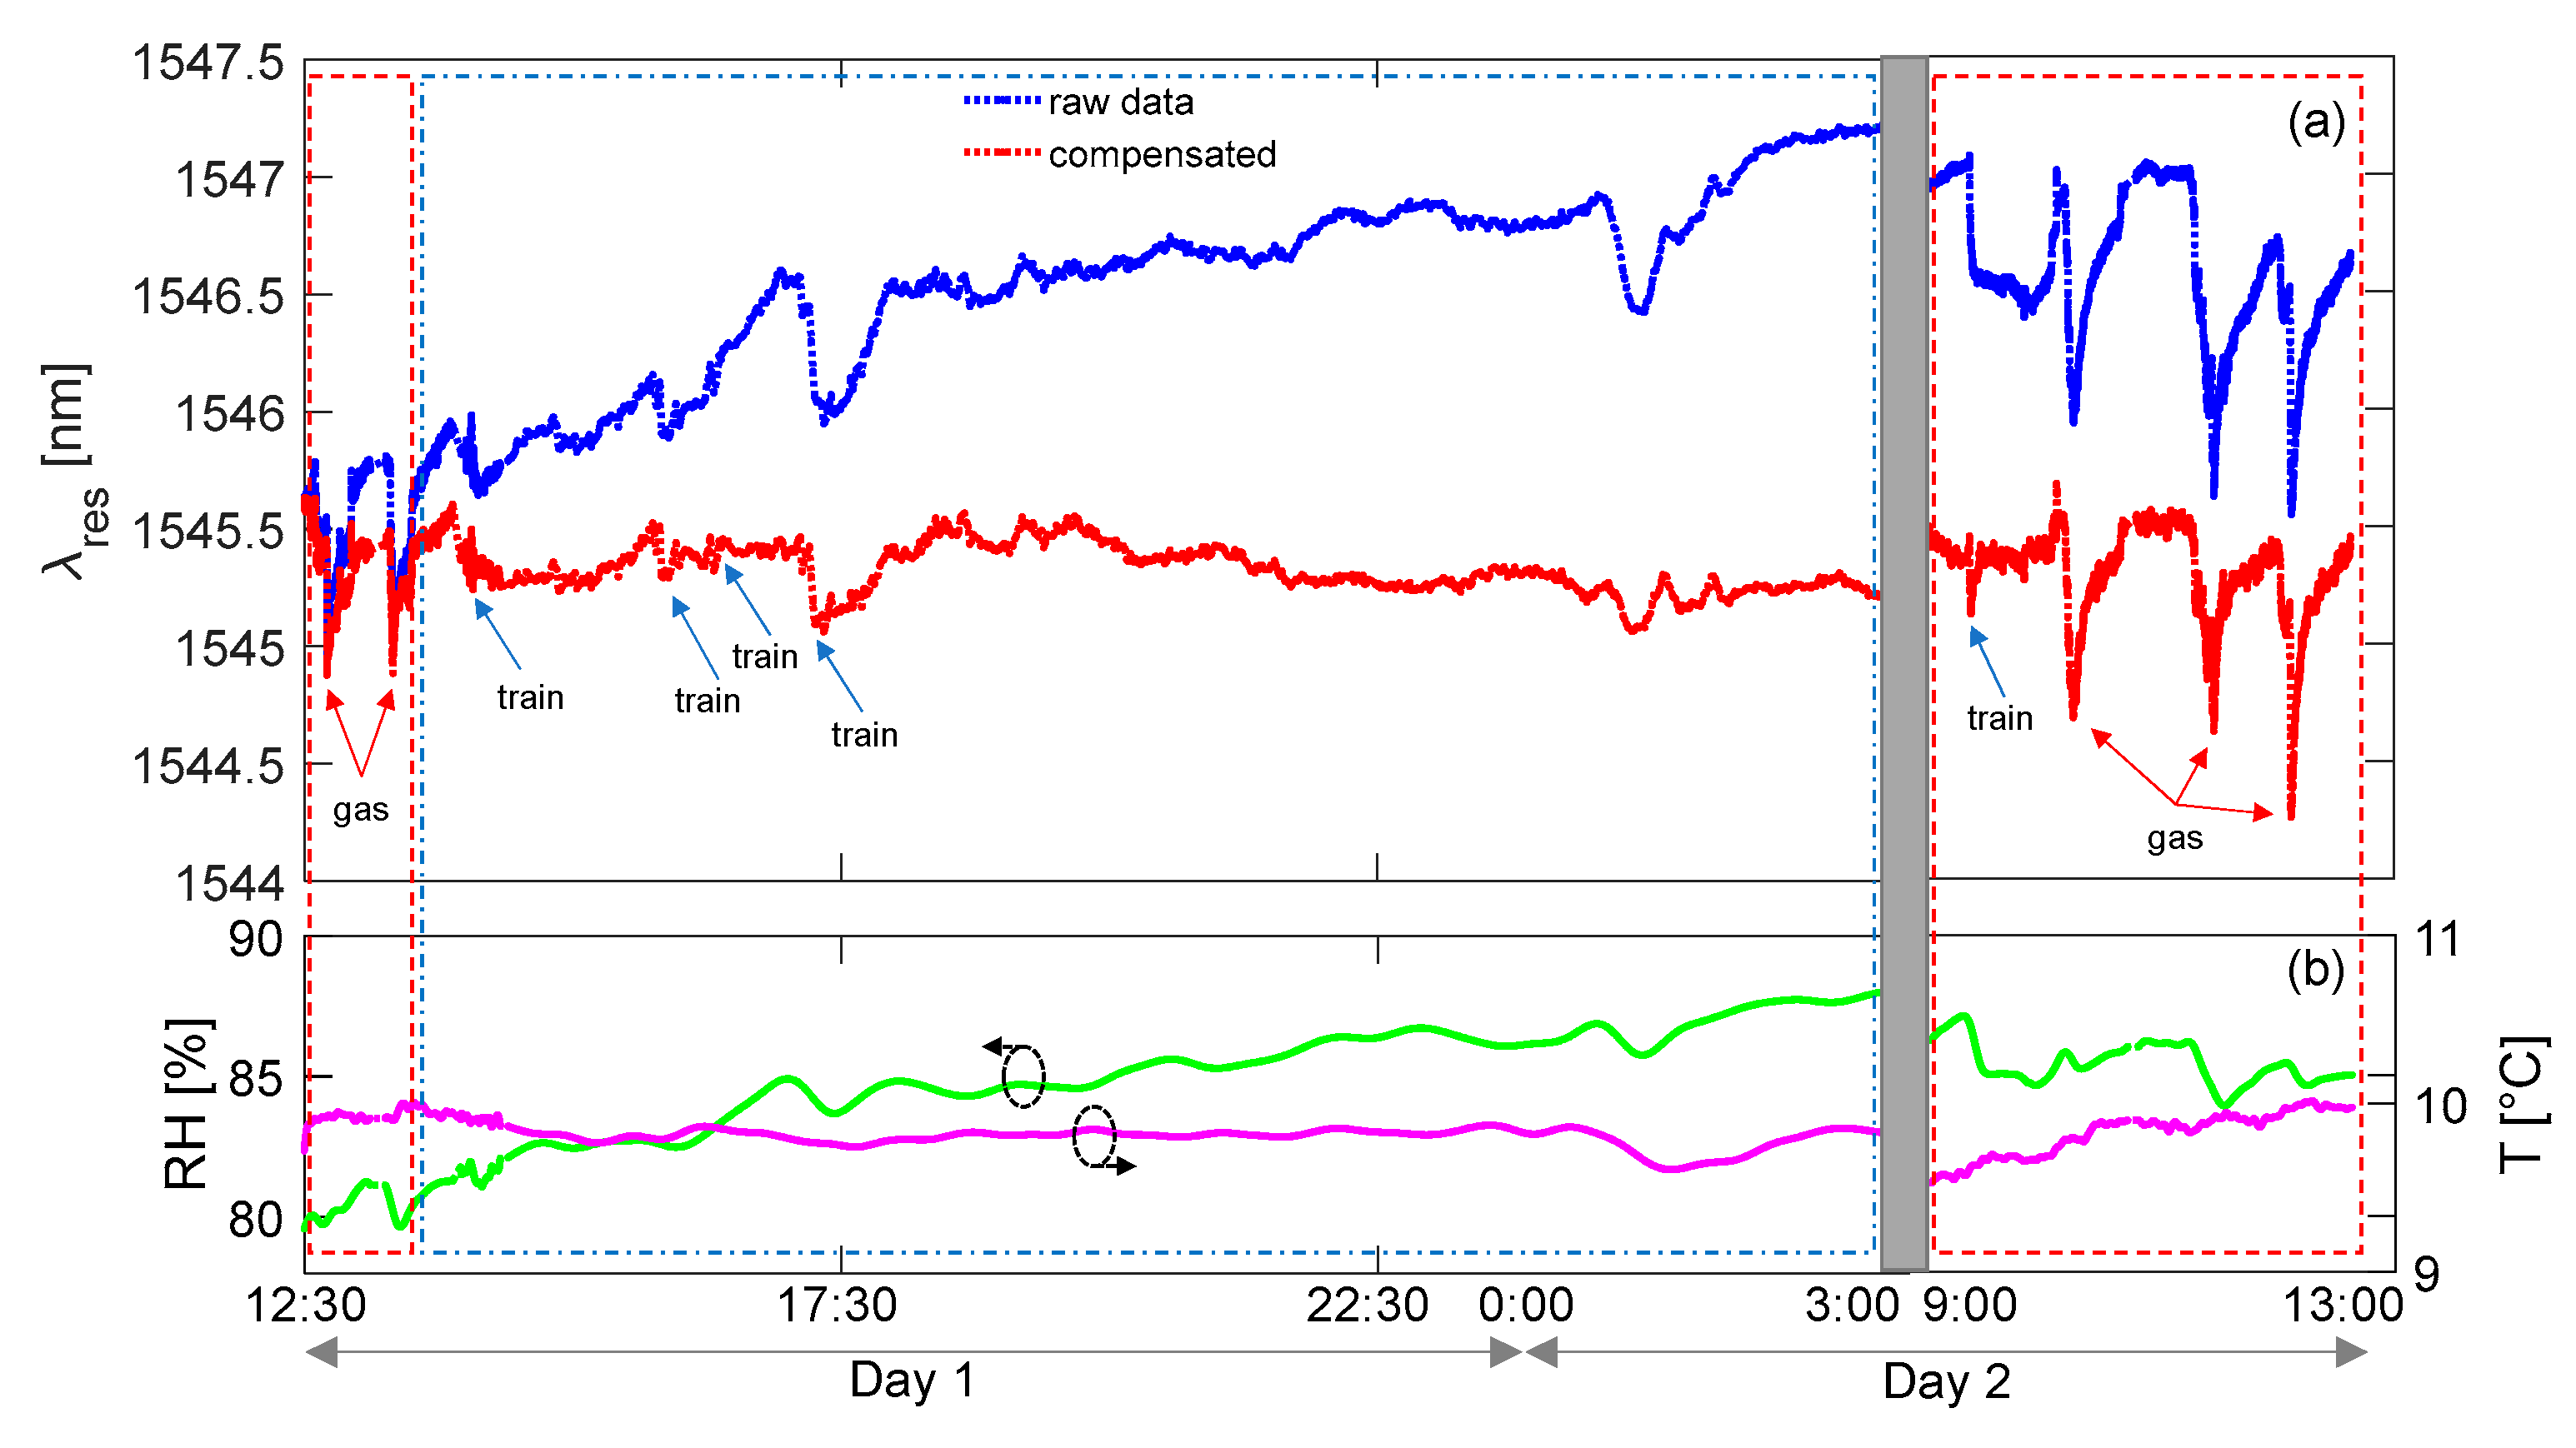
3.4. Gas Monitoring in Railway Tunnels Based on LPG Sensors
3.5. Intrusion Detection Systems for the Protection of Railway Assets
4. Conclusions
- To translate the innovative research results into other market products, thus creating new startup companies;
- To explore new applications to improve both the safety and the security in other fields, such as agrifood, anti-terrorism, biomedical and precision medicine, environment and energy saving;
- To improve the performance of our devices by increasing the use of both the nanotechnology and the nano materials.
Author Contributions
Funding
Institutional Review Board Statement
Informed Consent Statement
Data Availability Statement
Acknowledgments
Conflicts of Interest
References
- Cusano, A.; Cutolo, A.; Albert, J. (Eds.) Fiber Bragg Grating Sensors: Recent Advancements, Industrial Applications and Market Exploitation; Bentham Science Publishers: Sharjah, United Arab Emirates, 2011; ISBN 9781608050840. [Google Scholar]
- Pisco, M.; Cusano, A.; Cutolo, A. (Eds.) Photonic Bandgap Structures Novel Technological Platforms for Physical, Chemical and Biological Sensing; Bentham Science Publishers: Sharjah, United Arab Emirates, 2012; ISBN 9781608054480. [Google Scholar]
- Andreone, A.; Cusano, A.; Cutolo, A.; Galdi, V. Selected Topics in Photonic Crystals and Metamaterials; World Scientific: Singapore, 2011; ISBN 978-981-4355-18-6. [Google Scholar]
- Dobson, P.J. Optochemical Nanosensors, edited by Andrea Cusano, Francisco J. Arregui, Michele Giordano and Antonello Cutolo. Contemp. Phys. 2014, 55, 123–124. [Google Scholar] [CrossRef]
- Pisco, M. Optical Fibers: New Developments. In Lasers and Electro-Optics Research and Technology; Pisco, M., Ed.; Nova Science Pub Inc.: New York, NY, USA, 2013; ISBN 978-1-62808-425-2. [Google Scholar]
- Myridis, N.E. Lab-on-fiber technology, edited by A. Cusano, M. Consales, A. Crescitelli, and A. Ricciardi. Contemp. Phys. 2018, 59, 78–79. [Google Scholar] [CrossRef]
- Cutolo, A.; Mignani, A.G.; Tajani, A. Photonics for Safety and Security; World Scientific: Singapore, 2013; ISBN 978-981-4412-96-4. [Google Scholar]
- Righini, G.C.; Tajani, A.; Cutolo, A. An Introduction to Optoelectronic Sensors; Series in Optics and Photonics; World Scientific: Singapore, 2009; Volume 7, ISBN 978-981-283-412-6. [Google Scholar]
- Allwood, G.; Wild, G.; Hinckley, S. Optical Fiber Sensors in Physical Intrusion Detection Systems: A Review. IEEE Sens. J. 2016, 16, 5497–5509. [Google Scholar] [CrossRef] [Green Version]
- Lu, P.; Lalam, N.; Badar, M.; Liu, B.; Chorpening, B.T.; Buric, M.P.; Ohodnicki, P.R. Distributed optical fiber sensing: Review and perspective. Appl. Phys. Rev. 2019, 6, 041302. [Google Scholar] [CrossRef]
- Mariano, J.J. Undersea Fiber Optic Technology for the Offshore Community. In International Petroleum Conference and Exhibition of Mexico; OnePetro: Houston, TX, USA, 1994. [Google Scholar]
- Lang, P.D.; Tranchita, C.J. Infrared illumination systems for law enforcement and security. In Public Safety/Law Enforcement Technology; Sr., R.J.M., Mintz, R.D., Eds.; SPIE: Bellingham, WA, USA, 1995; Volume 2497, pp. 120–127. [Google Scholar]
- Wang, X.; Wolfbeis, O.S. Fiber-Optic Chemical Sensors and Biosensors (2015–2019). Anal. Chem. 2020, 92, 397–430. [Google Scholar] [CrossRef]
- Chen, C.; Wang, J. Optical biosensors: An exhaustive and comprehensive review. Analyst 2020, 145, 1605–1628. [Google Scholar] [CrossRef]
- Min, R.; Liu, Z.; Pereira, L.; Yang, C.; Sui, Q.; Marques, C. Optical fiber sensing for marine environment and marine structural health monitoring: A review. Opt. Laser Technol. 2021, 140, 107082. [Google Scholar] [CrossRef]
- Broadway, C.; Min, R.; Leal-Junior, A.G.; Marques, C.; Caucheteur, C. Toward Commercial Polymer Fiber Bragg Grating Sensors: Review and Applications. J. Light. Technol. 2019, 37, 2605–2615. [Google Scholar] [CrossRef]
- Massaroni, C.; Zaltieri, M.; Lo Presti, D.; Nicolo, A.; Tosi, D.; Schena, E. Fiber Bragg Grating Sensors for Cardiorespiratory Monitoring: A Review. IEEE Sens. J. 2021, 21, 14069–14080. [Google Scholar] [CrossRef]
- Cusano, A.; Cutolo, A.; Giordano, M.; Nicolais, L. Optoelectronic refractive index measurements: Application to smart processing. IEEE Sens. J. 2003, 3, 781–787. [Google Scholar] [CrossRef]
- Cennamo, N.; Pasquardini, L.; Arcadio, F.; Lunelli, L.; Vanzetti, L.; Carafa, V.; Altucci, L.; Zeni, L. SARS-CoV-2 spike protein detection through a plasmonic D-shaped plastic optical fiber aptasensor. Talanta 2021, 233, 122532. [Google Scholar] [CrossRef] [PubMed]
- Pasquardini, L.; Cennamo, N.; Malleo, G.; Vanzetti, L.; Zeni, L.; Bonamini, D.; Salvia, R.; Bassi, C.; Bossi, A.M. A Surface Plasmon Resonance Plastic Optical Fiber Biosensor for the Detection of Pancreatic Amylase in Surgically-Placed Drain Effluent. Sensors 2021, 21, 3443. [Google Scholar] [CrossRef] [PubMed]
- Cennamo, N.; D’agostino, G.; Perri, C.; Arcadio, F.; Chiaretti, G.; Parisio, E.M.; Camarlinghi, G.; Vettori, C.; Di Marzo, F.; Cennamo, R.; et al. Proof of concept for a quick and highly sensitive on-site detection of sars-cov-2 by plasmonic optical fibers and molecularly imprinted polymers. Sensors 2021, 21, 1681. [Google Scholar] [CrossRef] [PubMed]
- Zeni, L.; Perri, C.; Cennamo, N.; Arcadio, F.; D’Agostino, G.; Salmona, M.; Beeg, M.; Gobbi, M. A portable optical-fibre-based surface plasmon resonance biosensor for the detection of therapeutic antibodies in human serum. Sci. Rep. 2020, 10, 11154. [Google Scholar] [CrossRef]
- Cennamo, N.; Pasquardini, L.; Arcadio, F.; Vanzetti, L.E.; Bossi, A.M.; Zeni, L. D-shaped plastic optical fibre aptasensor for fast thrombin detection in nanomolar range. Sci. Rep. 2019, 9, 18740. [Google Scholar] [CrossRef] [Green Version]
- Cennamo, N.; Pesavento, M.; Lunelli, L.; Vanzetti, L.; Pederzolli, C.; Zeni, L.; Pasquardini, L. An easy way to realize SPR aptasensor: A multimode plastic optical fiber platform for cancer biomarkers detection. Talanta 2015, 140, 88–95. [Google Scholar] [CrossRef]
- De Vita, E.; De Tommasi, F.; Massaroni, C.; Iadicicco, A.; Faiella, E.; Carassiti, M.; Grasso, R.F.; Schena, E.; Campopiano, S. Investigation of the Heat Sink Effect during Microwave Ablation in Hepatic Tissue: Experimental and Numerical Analysis. IEEE Sens. J. 2021, 21, 22743–22751. [Google Scholar] [CrossRef]
- De Vita, E.; De Landro, M.; Massaroni, C.; Iadicicco, A.; Saccomandi, P.; Schena, E.; Campopiano, S. Fiber Optic Sensors-Based Thermal Analysis of Perfusion-Mediated Tissue Cooling in Liver Undergoing Laser Ablation. IEEE Trans. Biomed. Eng. 2021, 68, 1066–1073. [Google Scholar] [CrossRef]
- Esposito, F.; Sansone, L.; Srivastava, A.; Cusano, A.M.; Campopiano, S.; Giordano, M.; Iadicicco, A. Label-free detection of vitamin D by optical biosensing based on long period fiber grating. Sens. Actuators B Chem. 2021, 347, 130637. [Google Scholar] [CrossRef]
- Esposito, F.; Sansone, L.; Srivastava, A.; Baldini, F.; Campopiano, S.; Chiavaioli, F.; Giordano, M.; Giannetti, A.; Iadicicco, A. Long period grating in double cladding fiber coated with graphene oxide as high-performance optical platform for biosensing. Biosens. Bioelectron. 2021, 172, 112747. [Google Scholar] [CrossRef] [PubMed]
- Scaravilli, M.; Micco, A.; Castaldi, G.; Coppola, G.; Gioffrè, M.; Iodice, M.; La Ferrara, V.; Galdi, V.; Cusano, A. Excitation of Bloch Surface Waves on an Optical Fiber Tip. Adv. Opt. Mater. 2018, 6, 1800477. [Google Scholar] [CrossRef]
- Quero, G.; Zito, G.; Managò, S.; Galeotti, F.; Pisco, M.; De Luca, A.; Cusano, A. Nanosphere Lithography on Fiber: Towards Engineered Lab-On-Fiber SERS Optrodes. Sensors 2018, 18, 680. [Google Scholar] [CrossRef] [PubMed] [Green Version]
- Galeotti, F.; Pisco, M.; Cusano, A. Self-assembly on optical fibers: A powerful nanofabrication tool for next generation “lab-on-fiber” optrodes. Nanoscale 2018, 10, 22673–22700. [Google Scholar] [CrossRef]
- Principe, M.; Consales, M.; Castaldi, G.; Galdi, V.; Cusano, A. Evaluation of fiber-optic phase-gradient meta-tips for sensing applications. Nanomater. Nanotechnol. 2019, 9, 184798041983272. [Google Scholar] [CrossRef] [Green Version]
- Consales, M.; Quero, G.; Spaziani, S.; Principe, M.; Micco, A.; Galdi, V.; Cutolo, A.; Cusano, A. Metasurface-Enhanced Lab-on-Fiber Biosensors. Laser Photon. Rev. 2020, 14, 2000180. [Google Scholar] [CrossRef]
- Pisco, M.; Galeotti, F.; Quero, G.; Grisci, G.; Micco, A.; Mercaldo, L.V.; Veneri, P.D.; Cutolo, A.; Cusano, A. Nanosphere lithography for optical fiber tip nanoprobes. Light Sci. Appl. 2017, 6, e16229. [Google Scholar] [CrossRef] [Green Version]
- Pisco, M.; Cusano, A. Lab-On-Fiber Technology: A Roadmap toward Multifunctional Plug and Play Platforms. Sensors 2020, 20, 4705. [Google Scholar] [CrossRef] [PubMed]
- Giaquinto, M.; Aliberti, A.; Micco, A.; Gambino, F.; Ruvo, M.; Ricciardi, A.; Cusano, A. Cavity-Enhanced Lab-on-Fiber Technology: Toward Advanced Biosensors and Nano-Opto-Mechanical Active Devices. ACS Photonics 2019, 6, 3271–3280. [Google Scholar] [CrossRef]
- Caputo, T.M.; Aliberti, A.; Cusano, A.M.; Ruvo, M.; Cutolo, A.; Cusano, A. Stimuli-responsive hybrid microgels for controlled drug delivery: Sorafenib as a model drug. J. Appl. Polym. Sci. 2021, 138, 50147. [Google Scholar] [CrossRef]
- Managò, S.; Quero, G.; Zito, G.; Tullii, G.; Galeotti, F.; Pisco, M.; De Luca, A.C.; Cusano, A. Tailoring lab-on-fiber SERS optrodes towards biological targets of different sizes. Sens. Actuators B Chem. 2021, 339, 129321. [Google Scholar] [CrossRef]
- Pisco, M.; Galeotti, F. Nano- and Micropatterning on Optical Fibers by Bottom-Up Approach: The Importance of Being Ordered. Appl. Sci. 2021, 11, 3254. [Google Scholar] [CrossRef]
- Cutolo, M.A.; Cafiero, C.; Califano, L.; Giaquinto, M.; Cusano, A.; Cutolo, A. Feasibility analysis of an ultrasound on line diagnostic approach for oral and bone surgery. Sci. Rep. 2022, 12, 905. [Google Scholar] [CrossRef]
- Alessandra Cutolo, M.; Breglio, G. (INVITED) Interferometric Fabry-Perot sensors for ultrasound detection on the tip of an optical fiber. Results Opt. 2022, 6, 100209. [Google Scholar] [CrossRef]
- Cutolo, A.; Carotenuto, A.R.; Cutolo, M.A.; Cutolo, A.; Giaquinto, M.; Palumbo, S.; Cusano, A.; Fraldi, M. Ultrasound waves in tumors via needle irradiation for precise medicine. Sci. Rep. 2022, 12, 6513. [Google Scholar] [CrossRef]
- Principe, S.; Giaquinto, M.; Micco, A.; Cutolo, M.A.; Riccio, M.; Breglio, G.; Irace, A.; Ricciardi, A.; Cusano, A. Thermo-plasmonic lab-on-fiber optrodes. Opt. Laser Technol. 2020, 132, 106502. [Google Scholar] [CrossRef]
- Alessandra Cutolo, M.; Migliaccio, A.; Altucci, L.; Cutolo, A.; Cusano, A. An Innovative High Frequency Hyperthermia Approach against SARS-Cov-2 and Related Virus: Feasibility Analysis. Arch. Clin. Biomed. Res. 2021, 5, 569–580. [Google Scholar] [CrossRef]
- Carotenuto, B.; Ricciardi, A.; Micco, A.; Amorizzo, E.; Mercieri, M.; Cutolo, A.; Cusano, A. Optical fiber technology enables smart needles for epidurals: An in-vivo swine study. Biomed. Opt. Express 2019, 10, 1351. [Google Scholar] [CrossRef] [PubMed]
- Carotenuto, B.; Ricciardi, A.; Micco, A.; Amorizzo, E.; Mercieri, M.; Cutolo, A.; Cusano, A. Smart Optical Catheters for Epidurals. Sensors 2018, 18, 2101. [Google Scholar] [CrossRef] [Green Version]
- Aliberti, A.; Ricciardi, A.; Giaquinto, M.; Micco, A.; Bobeico, E.; La Ferrara, V.; Ruvo, M.; Cutolo, A.; Cusano, A. Microgel assisted Lab-on-Fiber Optrode. Sci. Rep. 2017, 7, 14459. [Google Scholar] [CrossRef] [Green Version]
- Filograno, M.L.; Pisco, M.; Catalano, A.; Forte, E.; Aiello, M.; Cavaliere, C.; Soricelli, A.; Davino, D.; Visone, C.; Cutolo, A.; et al. Triaxial Fiber Optic Magnetic Field Sensor for Magnetic Resonance Imaging. J. Light. Technol. 2017, 35, 3924–3933. [Google Scholar] [CrossRef]
- Zuppolini, S.; Quero, G.; Consales, M.; Diodato, L.; Vaiano, P.; Venturelli, A.; Santucci, M.; Spyrakis, F.; Costi, M.P.; Giordano, M.; et al. Label-free fiber optic optrode for the detection of class C β-lactamases expressed by drug resistant bacteria. Biomed. Opt. Express 2017, 8, 5191–5205. [Google Scholar] [CrossRef] [Green Version]
- Berruti, G.M.; Vaiano, P.; Boniello, A.; Principe, S.; Quero, G.; Persiano, G.V.; Consales, M.; Cusano, A. Highly Efficient Fiber Optic Thermal Heating Device Based on Turn-Around-Point Long Period Gratings. J. Light. Technol. 2022, 40, 797–804. [Google Scholar] [CrossRef]
- Giaquinto, M.; Ricciardi, A.; Cutolo, A.; Cusano, A. Lab-on-Fiber Plasmonic Probes for Ultrasound Detection: A Comparative Study. J. Light. Technol. 2016, 34, 5189–5198. [Google Scholar] [CrossRef]
- Quero, G.; Consales, M.; Severino, R.; Vaiano, P.; Boniello, A.; Sandomenico, A.; Ruvo, M.; Borriello, A.; Diodato, L.; Zuppolini, S.; et al. Long period fiber grating nano-optrode for cancer biomarker detection. Biosens. Bioelectron. 2016, 80, 590–600. [Google Scholar] [CrossRef]
- Cutolo, M.A.; Migliaccio, A.; Altucci, C.; Cutolo, A.; Cusano, A. On the Possibility of a Microwave Approach for Rooms and Objects Sterilization. J. Clin. Case Stud. 2021, 6, 5–16. [Google Scholar]
- Rossi, B.; Cutolo, M.A.; Giaquinto, M. Advanced Lab-on-Tip ultrasound detectors: A numerical analysis. Results Opt. 2022, 9, 100312. [Google Scholar] [CrossRef]
- Andreozzi, E.; Sabbadini, R.; Centracchio, J.; Bifulco, P.; Irace, A.; Breglio, G.; Riccio, M. Multimodal Finger Pulse Wave Sensing: Comparison of Forcecardiography and Photoplethysmography Sensors. Sensors 2022, 22, 7566. [Google Scholar] [CrossRef] [PubMed]
- Sabbadini, R.; Riccio, M.; Maresca, L.; Irace, A.; Breglio, G. Atrial Fibrillation Detection by Means of Edge Computing on Wearable Device: A Feasibility Assessment. In Proceedings of the 2022 IEEE International Symposium on Medical Measurements and Applications (MeMeA), Messina, Italy, 22–24 June 2022; IEEE: Piscataway, NJ, USA, 2022; pp. 1–6. [Google Scholar]
- Gasparro, R.; Leonetti, G.; Riccio, M.; Irace, A.; Sammartino, G.; Blasi, A.; Scandurra, C.; Maldonato, N.M.; Sammartino, P.; Marenzi, G. Thermography as a Method to Detect Dental Anxiety in Oral Surgery. Appl. Sci. 2021, 11, 5421. [Google Scholar] [CrossRef]
- Cafiero, C.; Riccitelli, D.; Ricchio, M.; Irace, A.; Cioffi, C.; Palaia, G.; Romeo, U. Evaluation of thermal damage in dental implants after irradiation with 980nm diode laser. Senses Sci. 2016, 3, 289–296. [Google Scholar]
- Esposito, M.; Buontempo, S.; Petriccione, A.; Zarrelli, M.; Breglio, G.; Saccomanno, A.; Szillasi, Z.; Makovec, A.; Cusano, A.; Chiuchiolo, A.; et al. Fiber Bragg Grating sensors to measure the coefficient of thermal expansion of polymers at cryogenic temperatures. Sens. Actuators A Phys. 2013, 189, 195–203. [Google Scholar] [CrossRef]
- Scherino, L.; Schioppa, E.J.; Arapova, A.; Berruti, G.M.; Bock, W.J.; Boniello, A.; Borriello, A.; Campopiano, S.; Consales, M.; Cusano, A.; et al. Fiber optic sensors in the ATLAS Inner Detector. Nucl. Instrum. Methods Phys. Res. Sect. A Accel. Spectrometers Detect. Assoc. Equip. 2022, 1029, 166470. [Google Scholar] [CrossRef]
- Berruti, G.M.; Vaiano, P.; Quero, G.; Pimentel Das Neves, T.F.; Boniello, A.; Consales, M.; Petagna, P.; Cusano, A. Analysis of uncoated LPGs written in B-Ge doped fiber under proton irradiation for sensing applications at CERN. Sci. Rep. 2020, 10, 1344. [Google Scholar] [CrossRef] [PubMed] [Green Version]
- Berruti, G.M.; Pimentel Das Neves, T.F.; Consales, M.; Vaiano, P.; Quero, G.; Petagna, P.; Cusano, A. Radiation Sensitivity of Long Period Gratings written in B-Ge doped fiber under proton irradiation at CERN. In Proceedings of the 26th International Conference on Optical Fiber Sensors, Lausanne, Switzerland, 24–28 September 2018; OSA: Washington, DC, USA, 2018; p. WF57. [Google Scholar]
- Berruti, G.M.; Petagna, P.; Buontempo, S.; Makovec, A.; Szillasi, Z.; Beni, N.; Consales, M.; Cusano, A. One year of FBG-based thermo-hygrometers in operation in the CMS experiment at CERN. J. Instrum. 2016, 11, P03007. [Google Scholar] [CrossRef] [Green Version]
- Cutolo, A.; Bernini, R.; Berruti, G.M.; Breglio, G.; Bruno, F.A.; Buontempo, S.; Catalano, E.; Consales, M.; Coscetta, A.; Cusano, A.; et al. Innovative photonic sensors for safety and security. Part II: Aerospace and submarine applications. Sensors 2023, 23, 2417. [Google Scholar] [CrossRef]
- Breglio, G.; Bernini, R.; Berruti, G.M.; Bruno, F.A.; Buontempo, S.; Campopiano, S.; Catalano, E.; Consales, M.; Coscetta, A.; Cutolo, A.; et al. Innovative photonic sensors for safety and security. Part III: Environment Applications. Sensors 2023. under review. [Google Scholar]
- Hill, K.O.; Meltz, G. Fiber Bragg grating technology fundamentals and overview. J. Light. Technol. 1997, 15, 1263–1276. [Google Scholar] [CrossRef] [Green Version]
- Erdogan, T. Fiber grating spectra. J. Light. Technol. 1997, 15, 1277–1294. [Google Scholar] [CrossRef] [Green Version]
- Albert, J.; Shao, L.-Y.; Caucheteur, C. Tilted fiber Bragg grating sensors. Laser Photon. Rev. 2013, 7, 83–108. [Google Scholar] [CrossRef]
- Kersey, A.D.; Davis, M.A.; Patrick, H.J.; LeBlanc, M.; Koo, K.P.; Askins, C.G.; Putnam, M.A.; Friebele, E.J. Fiber grating sensors. J. Light. Technol. 1997, 15, 1442–1463. [Google Scholar] [CrossRef] [Green Version]
- Baldwin, C.S. Multi-Parameter Sensing Using Fiber Bragg Grating Sensors. In Fiber Optic Sensor Technology and Applications IV; Marcus, M.A., Culshaw, B., Dakin, J.P., Eds.; SPIE: Bellingham, WA, USA, 2005; pp. 74–83. [Google Scholar]
- Miller, J.W.; Mendez, A. Fiber Bragg Grating Sensors: Market Overview and New Perspectives. In Fiber Bragg Grating Sensors: Recent Advancements, Industrial Applications and Market Exploitation; Bentham Science Publishers: Sharjah, United Arab Emirates, 2011; pp. 313–320. [Google Scholar]
- Chen, J.; Liu, B.; Zhang, H. Review of fiber Bragg grating sensor technology. Front. Optoelectron. China 2011, 4, 204–212. [Google Scholar] [CrossRef]
- Morey, W.W.; Dunphy, J.R.; Meltz, G. Multiplexing fiber bragg grating sensors. Fiber Integr. Opt. 1991, 10, 351–360. [Google Scholar] [CrossRef]
- Vengsarkar, A.M.; Lemaire, P.J.; Judkins, J.B.; Bhatia, V.; Erdogan, T.; Sipe, J.E. Long-period fiber gratings as band-rejection filters. J. Light. Technol. 1996, 14, 58–64. [Google Scholar] [CrossRef]
- Bhatia, V.; Vengsarkar, A.M. Optical fiber long-period grating sensors. Opt. Lett. 1996, 21, 692–694. [Google Scholar] [CrossRef]
- James, S.W.; Tatam, R.P. Optical fibre long-period grating sensors: Characteristics and application. Meas. Sci. Technol. 2003, 14, R49–R61. [Google Scholar] [CrossRef] [Green Version]
- Wang, Y. Review of long period fiber gratings written by CO2 laser. J. Appl. Phys. 2010, 108, 081101. [Google Scholar] [CrossRef]
- Kondo, Y.; Nouchi, K.; Mitsuyu, T.; Watanabe, M.; Kazansky, P.G.; Hirao, K. Fabrication of long-period fiber gratings by focused irradiation of infrared femtosecond laser pulses. Opt. Lett. 1999, 24, 646–648. [Google Scholar] [CrossRef]
- Rego, G. Arc-Induced Long Period Fiber Gratings. J. Sens. 2016, 2016, 3598634. [Google Scholar] [CrossRef] [Green Version]
- Iadicicco, A.; Campopiano, S.; Cusano, A. Long-Period Gratings in Hollow Core Fibers by Pressure-Assisted Arc Discharge Technique. IEEE Photonics Technol. Lett. 2011, 23, 1567–1569. [Google Scholar] [CrossRef]
- Ranjan, R.; Esposito, F.; Iadicicco, A.; Campopiano, S. Arc-Induced Long Period Gratings in Phosphorus-Doped Fiber. IEEE Photonics Technol. Lett. 2017, 29, 611–614. [Google Scholar] [CrossRef]
- Shu, X.; Zhang, L.; Bennion, I. Sensitivity characteristics of long-period fiber gratings. J. Light. Technol. 2002, 20, 255–266. [Google Scholar]
- Bhatia, V. Applications of long-period gratings to single and multi-parameter sensing. Opt. Express 1999, 4, 457–466. [Google Scholar] [CrossRef]
- Esposito, F. (INVITED) Chemical sensors based on long period fiber gratings: A review. Results Opt. 2021, 5, 100196. [Google Scholar] [CrossRef]
- Esposito, F.; Srivastava, A.; Sansone, L.; Giordano, M.; Campopiano, S.; Iadicicco, A. Label-Free Biosensors Based on Long Period Fiber Gratings: A Review. IEEE Sens. J. 2021, 21, 12692–12705. [Google Scholar] [CrossRef]
- Hartog, A.H. An Introduction to Distributed Optical Fibre Sensors; CRC Press: Boca Raton, FL, USA, 2017; ISBN 9781315119014. [Google Scholar]
- Bao, X.; Chen, L. Recent Progress in Distributed Fiber Optic Sensors. Sensors 2012, 12, 8601–8639. [Google Scholar] [CrossRef] [Green Version]
- Chow, D.M.; Yang, Z.; Soto, M.A.; Thévenaz, L. Distributed forward Brillouin sensor based on local light phase recovery. Nat. Commun. 2018, 9, 2990. [Google Scholar] [CrossRef] [Green Version]
- Barnoski, M.K.; Jensen, S.M. Fiber waveguides: A novel technique for investigating attenuation characteristics. Appl. Opt. 1976, 15, 2112. [Google Scholar] [CrossRef] [PubMed]
- Froggatt, M.; Moore, J. High-spatial-resolution distributed strain measurement in optical fiber with Rayleigh scatter. Appl. Opt. 1998, 37, 1735. [Google Scholar] [CrossRef] [PubMed]
- Masoudi, A.; Belal, M.; Newson, T.P. A distributed optical fibre dynamic strain sensor based on phase-OTDR. Meas. Sci. Technol. 2013, 24, 085204. [Google Scholar] [CrossRef]
- Kim, Y.H.; Lee, K.; Song, K.Y. Brillouin optical correlation domain analysis with more than 1 million effective sensing points based on differential measurement. Opt. Express 2015, 23, 33241. [Google Scholar] [CrossRef] [PubMed]
- Bernini, R.; Minardo, A.; Zeni, L. Distributed Sensing at Centimeter-Scale Spatial Resolution by BOFDA: Measurements and Signal Processing. IEEE Photonics J. 2012, 4, 48–56. [Google Scholar] [CrossRef]
- Bernini, R.; Minardo, A.; Zeni, L. Dynamic strain measurement in optical fibers by stimulated Brillouin scattering. Opt. Lett. 2009, 34, 2613. [Google Scholar] [CrossRef] [PubMed]
- Urricelqui, J.; Zornoza, A.; Sagues, M.; Loayssa, A. Dynamic BOTDA measurements based on Brillouin phase-shift and RF demodulation. Opt. Express 2012, 20, 26942. [Google Scholar] [CrossRef] [PubMed]
- Mizuno, Y.; Hayashi, N.; Fukuda, H.; Song, K.Y.; Nakamura, K. Ultrahigh-speed distributed Brillouin reflectometry. Light Sci. Appl. 2016, 5, e16184. [Google Scholar] [CrossRef] [Green Version]
- Daley, T.M.; Freifeld, B.M.; Ajo-Franklin, J.; Dou, S.; Pevzner, R.; Shulakova, V.; Kashikar, S.; Miller, D.E.; Goetz, J.; Henninges, J.; et al. Field testing of fiber-optic distributed acoustic sensing (DAS) for subsurface seismic monitoring. Lead. Edge 2013, 32, 699–706. [Google Scholar] [CrossRef] [Green Version]
- Walter, F.; Gräff, D.; Lindner, F.; Paitz, P.; Köpfli, M.; Chmiel, M.; Fichtner, A. Distributed acoustic sensing of microseismic sources and wave propagation in glaciated terrain. Nat. Commun. 2020, 11, 2436. [Google Scholar] [CrossRef]
- Küntz, M.; Jolin, M.; Bastien, J.; Perez, F.; Hild, F. Digital image correlation analysis of crack behavior in a reinforced concrete beam during a load test. Can. J. Civ. Eng. 2006, 33, 1418–1425. [Google Scholar] [CrossRef]
- Sony, S.; Laventure, S.; Sadhu, A. A literature review of next-generation smart sensing technology in structural health monitoring. Struct. Control Heal. Monit. 2019, 26, e2321. [Google Scholar] [CrossRef]
- Chen, B.; Basaran, C. Far-field modeling of Moiré interferometry using scalar diffraction theory. Opt. Lasers Eng. 2012, 50, 1168–1176. [Google Scholar] [CrossRef]
- Chan, H.M.; Yen, K.S.; Ratnam, M.M. Crack displacement sensing and measurement in concrete using circular grating moire fringes and pattern matching. In Ninth International Symposium on Laser Metrology; Quan, C., Asundi, A., Eds.; SPIE: Bellingham, WA, USA, 2008; p. 715529. [Google Scholar]
- Mahal, M.; Blanksvärd, T.; Täljsten, B.; Sas, G. Using digital image correlation to evaluate fatigue behavior of strengthened reinforced concrete beams. Eng. Struct. 2015, 105, 277–288. [Google Scholar] [CrossRef]
- Hild, F.; Roux, S. Digital Image Correlation: From Displacement Measurement to Identification of Elastic Properties—A Review. Strain 2006, 42, 69–80. [Google Scholar] [CrossRef] [Green Version]
- Mohan, A.; Poobal, S. Crack detection using image processing: A critical review and analysis. Alex. Eng. J. 2018, 57, 787–798. [Google Scholar] [CrossRef]
- Cutolo, A.; Cusano, A.; Iele, A.; Bruno, F.M.; Cutolo, M.A. Codici a Barre e QRcodes per un Sensore Wireless a Basso Costo per Monitoraggio Strutturale. Pending Patent 2020. [Google Scholar]
- Brownjohn, J.; Tjin, S.C.; Tan, G.H.; Tan, B.L.; Chakraboorty, S. A structural health monitoring paradigm for civil infrastructure. In Proceedings of the 1st FIG International Symposium on Engineering Surveys for Construction Works and Structural Engineering, Nottingham, UK, 28 June 2004; Volume 28. [Google Scholar]
- Rytter, A. Vibrational Based Inspection of Civil Engineering Structures. Ph.D. Thesis, Aalborg University, Aalborg, Denmark, 1993. [Google Scholar]
- Catbas, F.N.; Brown, D.L.; Aktan, A.E. Parameter Estimation for Multiple-Input Multiple-Output Modal Analysis of Large Structures. J. Eng. Mech. 2004, 130, 921–930. [Google Scholar] [CrossRef]
- Omenzetter, P.; Brownjohn, J.M.W. Application of time series analysis for bridge monitoring. Smart Mater. Struct. 2006, 15, 129–138. [Google Scholar] [CrossRef] [Green Version]
- Farinholt, K.M.; Miller, N.; Sifuentes, W.; MacDonald, J.; Park, G.; Farrar, C.R. Energy Harvesting and Wireless Energy Transmission for Embedded SHM Sensor Nodes. Struct. Heal. Monit. 2010, 9, 269–280. [Google Scholar] [CrossRef]
- Sohn, H.; Czarnecki, J.A.; Farrar, C.R. Structural Health Monitoring Using Statistical Process Control. J. Struct. Eng. 2000, 126, 1356–1363. [Google Scholar] [CrossRef]
- Tanner, N.A.; Wait, J.R.; Farrar, C.R.; Sohn, H. Structural Health Monitoring Using Modular Wireless Sensors. J. Intell. Mater. Syst. Struct. 2003, 14, 43–56. [Google Scholar] [CrossRef]
- Farrar, C.R.; Worden, K. An introduction to structural health monitoring. Philos. Trans. R. Soc. A Math. Phys. Eng. Sci. 2007, 365, 303–315. [Google Scholar] [CrossRef]
- Lynch, J.P. An overview of wireless structural health monitoring for civil structures. Philos. Trans. R. Soc. A Math. Phys. Eng. Sci. 2007, 365, 345–372. [Google Scholar] [CrossRef]
- Mosleh, A.; Costa, P.A.; Caçada, R. Development of a Low-Cost Trackside System for Weighing in Motion and Wheel Defects Detection. Int. J. Railw. Res. 2020, 7, 1–9. [Google Scholar]
- Alemi, A.; Corman, F.; Lodewijks, G. Condition monitoring approaches for the detection of railway wheel defects. Proc. Inst. Mech. Eng. Part F J. Rail Rapid Transit 2017, 231, 961–981. [Google Scholar] [CrossRef] [Green Version]
- Barke, D.; Chiu, W.K. Structural Health Monitoring in the Railway Industry: A Review. Struct. Heal. Monit. 2005, 4, 81–93. [Google Scholar] [CrossRef]
- Pintão, B.; Mosleh, A.; Vale, C.; Montenegro, P.; Costa, P. Development and Validation of a Weigh-in-Motion Methodology for Railway Tracks. Sensors 2022, 22, 1976. [Google Scholar] [CrossRef]
- Costa, B.J.A.; Martins, R.; Santos, M.; Felgueiras, C.; Calçada, R. Weighing-in-motion wireless system for sustainable railway transport. Energy Procedia 2017, 136, 408–413. [Google Scholar] [CrossRef]
- Sekuła, K.; Kołakowski, P. Piezo-based weigh-in-motion system for the railway transport. Struct. Control Heal. Monit. 2012, 19, 199–215. [Google Scholar] [CrossRef]
- Kouroussis, G.; Caucheteur, C.; Kinet, D.; Alexandrou, G.; Verlinden, O.; Moeyaert, V. Review of Trackside Monitoring Solutions: From Strain Gages to Optical Fibre Sensors. Sensors 2015, 15, 20115–20139. [Google Scholar] [CrossRef] [PubMed] [Green Version]
- Filograno, M.L.; Corredera Guillen, P.; Rodriguez-Barrios, A.; Martin-Lopez, S.; Rodriguez-Plaza, M.; Andres-Alguacil, Á.; Gonzalez-Herraez, M. Real-Time Monitoring of Railway Traffic Using Fiber Bragg Grating Sensors. IEEE Sens. J. 2012, 12, 85–92. [Google Scholar] [CrossRef]
- Laudat, A.; Lanza, G.; Cusano, A.; Cutolo, A.; Giordano, M.; Breglio, G.; Antonelli, A. Railway monitoring and train tracking by fiber Bragg grating sensors: A case study in Italy. In Proceedings of the 4th European Workshop on Structural Health Monitoring EWSHM2008, Cracow, Poland, 2–4 July 2008. [Google Scholar]
- Du, C.; Dutta, S.; Kurup, P.; Yu, T.; Wang, X. A review of railway infrastructure monitoring using fiber optic sensors. Sensors Actuators A Phys. 2020, 303, 111728. [Google Scholar] [CrossRef]
- Wei, C.; Lai, C.; Liu, S.; Chung, W.H.; Ho, T.K.; Tam, H.-Y.; Ho, S.L.; McCusker, A.; Kam, J.; Lee, K.Y. A Fiber Bragg Grating Sensor System for Train Axle Counting. IEEE Sens. J. 2010, 10, 1905–1912. [Google Scholar]
- Filograno, M.L.; Corredera, P.; Rodriguez-Plaza, M.; Andres-Alguacil, A.; Gonzalez-Herraez, M. Wheel Flat Detection in High-Speed Railway Systems Using Fiber Bragg Gratings. IEEE Sens. J. 2013, 13, 4808–4816. [Google Scholar] [CrossRef] [Green Version]
- Mi, Q.; Gao, X.; Zhu, H.; Wang, Z.; Zhao, Q. Composite railway health monitoring system based on fiber optic bragg grating sensing array. In Proceedings of the 2014 IEEE Far East Forum on Nondestructive Evaluation/Testing, Chengdu, China, 20–23 June 2014; IEEE: Piscataway, NJ, USA, 2014; pp. 259–264. [Google Scholar]
- Allotta, B.; D’Adamio, P.; Meli, E.; Pugi, L. Development of a new time domain-based algorithm for train detection and axle counting. Veh. Syst. Dyn. 2015, 53, 1850–1875. [Google Scholar] [CrossRef]
- Taheri, S.; Moslehi, B.; Sotoudeh, V.; Hopkins, B.M. Rail Defect Detection Using Fiber Optic Sensors and Wavelet Algorithms. In Proceedings of the 2018 Joint Rail Conference, Pittsburgh, PA, USA, 18–20 April 2018; American Society of Mechanical Engineers: New York, NY, USA, 2018. [Google Scholar]
- Liu, X.-Z.; Xu, C.; Ni, Y.-Q. Wayside Detection of Wheel Minor Defects in High-Speed Trains by a Bayesian Blind Source Separation Method. Sensors 2019, 19, 3981. [Google Scholar] [CrossRef] [PubMed] [Green Version]
- Mennella, F.; Laudati, A.; Esposito, M.; Cusano, A.; Cutolo, A.; Giordano, M.; Campopiano, S.; Breglio, G. Railway monitoring and train tracking by fiber Bragg grating sensors. In Proceedings of the Third European Workshop on Optical Fibre Sensors, Napoli, Italy, 4–6 July 2007; Volume 6619, p. 66193H. [Google Scholar]
- Iele, A.; Lopez, V.; Laudati, A.; Mazzino, N.; Bocchetti, G.; Cutolo, A.; Cusano, A. Fiber optic sensing system for weighing in motion (WIM) and wheel flat detection (WFD) in railways assets: The TWBCS system. In Proceedings of the 8th European Workshop On Structural Health Monitoring (EWSHM 2016), Bilbao, Spain, 5–8 July 2016; pp. 5–8. [Google Scholar]
- Cusano, A.; Lopez-Higuera, J.M.; Matias, I.R.; Culshaw, B. Editorial Optical Fiber Sensor Technology and Applications. IEEE Sens. J. 2008, 8, 1052–1054. [Google Scholar] [CrossRef]
- Iele, A.; Leone, M.; Consales, M.; Persiano, G.V.; Brindisi, A.; Ameduri, S.; Concilio, A.; Ciminello, M.; Apicella, A.; Bocchetto, F.; et al. Load monitoring of aircraft landing gears using fiber optic sensors. Sens. Actuators A Phys. 2018, 281, 31–41. [Google Scholar] [CrossRef]
- Iele, A.; Leone, M.; Consales, M.; Persiano, G.V.; Brindisi, A.; Ameduri, S.; Concilio, A.; Ciminello, M.; Apicella, A.; Bocchetto, F.; et al. A fiber optic sensors system for load monitoring on aircraft landing gears. In Seventh European Workshop on Optical Fibre Sensors; Kalli, K., Brambilla, G., O’Keeffe, S.O., Eds.; SPIE: Bellingham, WA, USA, 2019; p. 105. [Google Scholar]
- Administration, F.R. An Implementation Guide for Wayside Detector Systems. Available online: https://railroads.dot.gov/sites/fra.dot.gov/files/fra_net/18667/Wayside Detector Implementation Guide.pdf (accessed on 10 January 2023).
- Tam, H.Y.; Liu, S.Y.; Guan, B.O.; Chung, W.H.; Chan, T.H.; Cheng, L.K. Fiber Bragg grating sensors for structural and railway applications. In Advanced Sensor Systems and Applications II; Rao, Y.-J., Kwon, O.Y., Peng, G.-D., Eds.; SPIE: Bellingham, WA, USA, 2005; p. 85. [Google Scholar]
- Minardo, A.; Porcaro, G.; Giannetta, D.; Bernini, R.; Zeni, L. Real-time monitoring of railway traffic using slope-assisted Brillouin distributed sensors. Appl. Opt. 2013, 52, 3770. [Google Scholar] [CrossRef] [PubMed]
- Boresi, A.P.; Schmidt, R.J.; Sidebottom, O.M. Advanced Mechanics of Materials, 5th ed.; John Wiley & Sons, Inc.: New York, NY, USA, 1993. [Google Scholar]
- Khordehbinan, M.W. Investigation on the effect of railway track support system characteristics on the values of track modulus. In Proceedings of the AREMA 2010 Annual Conference & Exposition, Orlando, FL, USA, 29 August–1 September 2010. [Google Scholar]
- Liu, H.; Ma, J.; Yan, W.; Liu, W.; Zhang, X.; Li, C. Traffic Flow Detection Using Distributed Fiber Optic Acoustic Sensing. IEEE Access 2018, 6, 68968–68980. [Google Scholar] [CrossRef]
- Zhou, J.; Gao, D.; Zhang, D. Moving Vehicle Detection for Automatic Traffic Monitoring. IEEE Trans. Veh. Technol. 2007, 56, 51–59. [Google Scholar] [CrossRef] [Green Version]
- Catalano, E.; Coscetta, A.; Cerri, E.; Cennamo, N.; Zeni, L.; Minardo, A. Automatic traffic monitoring by ϕ-OTDR data and Hough transform in a real-field environment. Appl. Opt. 2021, 60, 3579. [Google Scholar] [CrossRef]
- Wellbrock, G.A.; Xia, T.J.; Huang, M.-F.; Chen, Y.; Salemi, M.; Huang, Y.-K.; Ji, P.; Ip, E.; Wang, T. First Field Trial of Sensing Vehicle Speed, Density, and Road Conditions by using Fiber Carrying High Speed Data. In Proceedings of the 2019 Optical Fiber Communications Conference and Exhibition (OFC), San Diego, CA, USA, 3–7 March 2019; pp. 1–3. [Google Scholar]
- Liu, X.; Cheng, S.; Liu, H.; Hu, S.; Zhang, D.; Ning, H. A Survey on Gas Sensing Technology. Sensors 2012, 12, 9635–9665. [Google Scholar] [CrossRef] [Green Version]
- Esposito, F.; Zotti, A.; Palumbo, G.; Zuppolini, S.; Consales, M.; Cutolo, A.; Borriello, A.; Campopiano, S.; Zarrelli, M.; Iadicicco, A. Liquefied Petroleum Gas Monitoring System Based on Polystyrene Coated Long Period Grating. Sensors 2018, 18, 1435. [Google Scholar] [CrossRef] [Green Version]
- Esposito, F.; Campopiano, S.; Iadicicco, A. Miniaturized Strain-Free Fiber Bragg Grating Temperature Sensors. IEEE Sens. J. 2022, 22, 16898–16903. [Google Scholar] [CrossRef]
- Esposito, F.; Sansone, L.; Taddei, C.; Campopiano, S.; Giordano, M.; Iadicicco, A. Ultrasensitive biosensor based on long period grating coated with polycarbonate-graphene oxide multilayer. Sens. Actuators B Chem. 2018, 274, 517–526. [Google Scholar] [CrossRef]
- Cusano, A.; Iadicicco, A.; Pilla, P.; Contessa, L.; Campopiano, S.; Cutolo, A.; Giordano, M. Mode transition in high refractive index coated long period gratings. Opt. Express 2006, 14, 19–34. [Google Scholar] [CrossRef]
- Esposito, F.; Srivastava, A.; Sansone, L.; Giordano, M.; Campopiano, S.; Iadicicco, A. Sensitivity Enhancement in Long Period Gratings by Mode Transition in Uncoated Double Cladding Fibers. IEEE Sens. J. 2020, 20, 234–241. [Google Scholar] [CrossRef]
- Esposito, F.; Zotti, A.; Ranjan, R.; Zuppolini, S.; Borriello, A.; Campopiano, S.; Zarrelli, M.; Iadicicco, A. Single-Ended Long Period Fiber Grating Coated with Polystyrene Thin Film for Butane Gas Sensing. J. Light. Technol. 2018, 36, 825–832. [Google Scholar] [CrossRef]
- Castro, J.L.; Delgado, M.; Medina, J.; Ruiz-Lozano, M.D. Intelligent surveillance system with integration of heterogeneous information for intrusion detection. Expert Syst. Appl. 2011, 38, 11182–11192. [Google Scholar] [CrossRef]
- Moccia, M.; Pisco, M.; Cutolo, A.; Galdi, V.; Bevilacqua, P.; Cusano, A. Opto-acoustic behavior of coated fiber Bragg gratings. Opt. Express 2011, 19, 18842. [Google Scholar] [CrossRef] [PubMed]
- Dhall, A.; Chhabra, J.K.; Aulakh, N.S. Intrusion Detection System Based on Speckle Pattern Analysis. Exp. Tech. 2005, 29, 25–31. [Google Scholar] [CrossRef]
- Rodriguez-Cobo, L.; Lomer, M.; Lopez-Higuera, J.-M. Fiber Specklegram-Multiplexed Sensor. J. Light. Technol. 2015, 33, 2591–2597. [Google Scholar] [CrossRef]
- Liu, X.; Jin, B.; Bai, Q.; Wang, Y.; Wang, D.; Wang, Y. Distributed Fiber-Optic Sensors for Vibration Detection. Sensors 2016, 16, 1164. [Google Scholar] [CrossRef] [Green Version]
- Allwood, G.; Hinckley, S.; Wild, G. Optical Fiber Bragg grating based intrusion detection systems for homeland security. In Proceedings of the 2013 IEEE Sensors Applications Symposium Proceedings, Galveston, TX, USA, 19–21 February 2013; IEEE: Piscataway, NJ, USA, 2013; pp. 66–70. [Google Scholar]
- Allwood, G.A.; Wild, G.; Hinckley, S. Fibre optic acoustic sensing for intrusion detection systems. In Proceedings of the ACOUSTICS 2011, Gold Coast, Australia, 2–4 November 2011. [Google Scholar]
- Chan, T.S.K.; Chung, K.S.M. Applications and selections of intelligent surveillance system in railway industry. In Proceedings of the 2008 International Conference on Railway Engineering—Challenges for Railway Transportation in Information Age, Hong Kong, China, 25–28 March 2008; pp. 1–6. [Google Scholar]
- Catalano, A.; Bruno, F.A.; Galliano, C.; Pisco, M.; Persiano, G.V.; Cutolo, A.; Cusano, A. An optical fiber intrusion detection system for railway security. Sens. Actuators A Phys. 2017, 253, 91–100. [Google Scholar] [CrossRef]
- Catalano, A.; Bruno, F.; Pisco, M.; Cutolo, A.; Cusano, A. An Intrusion Detection System for the Protection of Railway Assets Using Fiber Bragg Grating Sensors. Sensors 2014, 14, 18268–18285. [Google Scholar] [CrossRef] [PubMed]


| Nanophotonic laboratory | Chemistry laboratory | Prototyping and smart devices |
| Biotechnology laboratory | Characterization and test laboratory | Informatic laboratory |
Disclaimer/Publisher’s Note: The statements, opinions and data contained in all publications are solely those of the individual author(s) and contributor(s) and not of MDPI and/or the editor(s). MDPI and/or the editor(s) disclaim responsibility for any injury to people or property resulting from any ideas, methods, instructions or products referred to in the content. |
© 2023 by the authors. Licensee MDPI, Basel, Switzerland. This article is an open access article distributed under the terms and conditions of the Creative Commons Attribution (CC BY) license (https://creativecommons.org/licenses/by/4.0/).
Share and Cite
Minardo, A.; Bernini, R.; Berruti, G.M.; Breglio, G.; Bruno, F.A.; Buontempo, S.; Campopiano, S.; Catalano, E.; Consales, M.; Coscetta, A.; et al. Innovative Photonic Sensors for Safety and Security, Part I: Fundamentals, Infrastructural and Ground Transportations. Sensors 2023, 23, 2558. https://doi.org/10.3390/s23052558
Minardo A, Bernini R, Berruti GM, Breglio G, Bruno FA, Buontempo S, Campopiano S, Catalano E, Consales M, Coscetta A, et al. Innovative Photonic Sensors for Safety and Security, Part I: Fundamentals, Infrastructural and Ground Transportations. Sensors. 2023; 23(5):2558. https://doi.org/10.3390/s23052558
Chicago/Turabian StyleMinardo, Aldo, Romeo Bernini, Gaia Maria Berruti, Giovanni Breglio, Francesco Antonio Bruno, Salvatore Buontempo, Stefania Campopiano, Ester Catalano, Marco Consales, Agnese Coscetta, and et al. 2023. "Innovative Photonic Sensors for Safety and Security, Part I: Fundamentals, Infrastructural and Ground Transportations" Sensors 23, no. 5: 2558. https://doi.org/10.3390/s23052558