
Near-Ultrasonic Transfer Function and SNR of Differential MEMS Microphones Suitable for Photoacoustics

Abstract
:1. Introduction
2. Materials and Methods
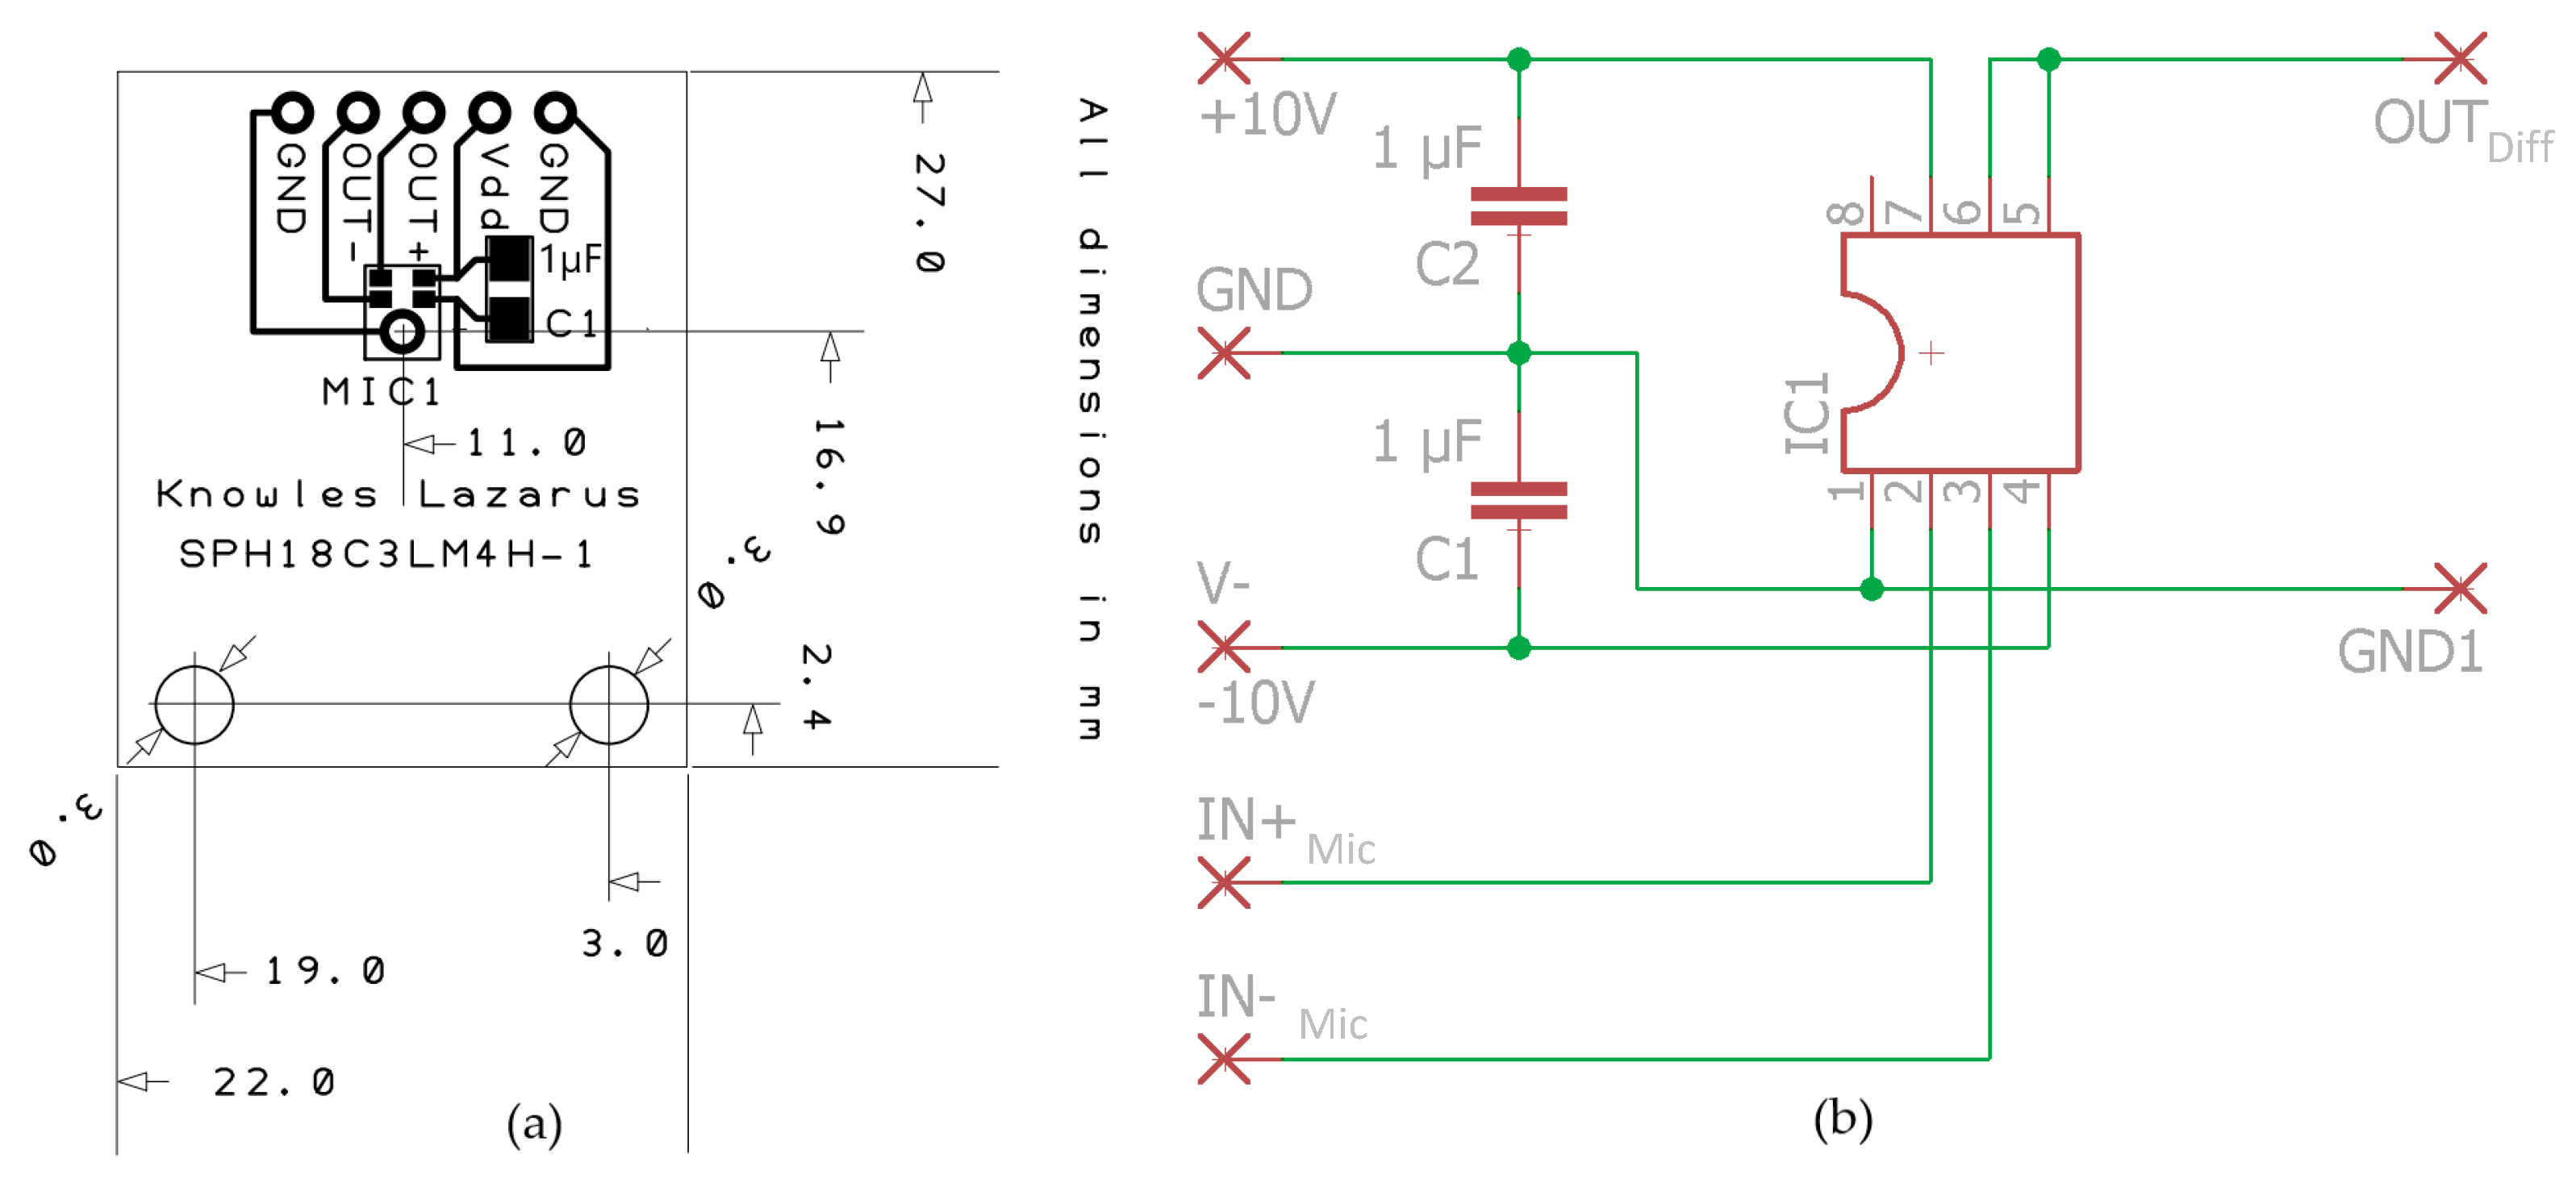
2.1. Materials
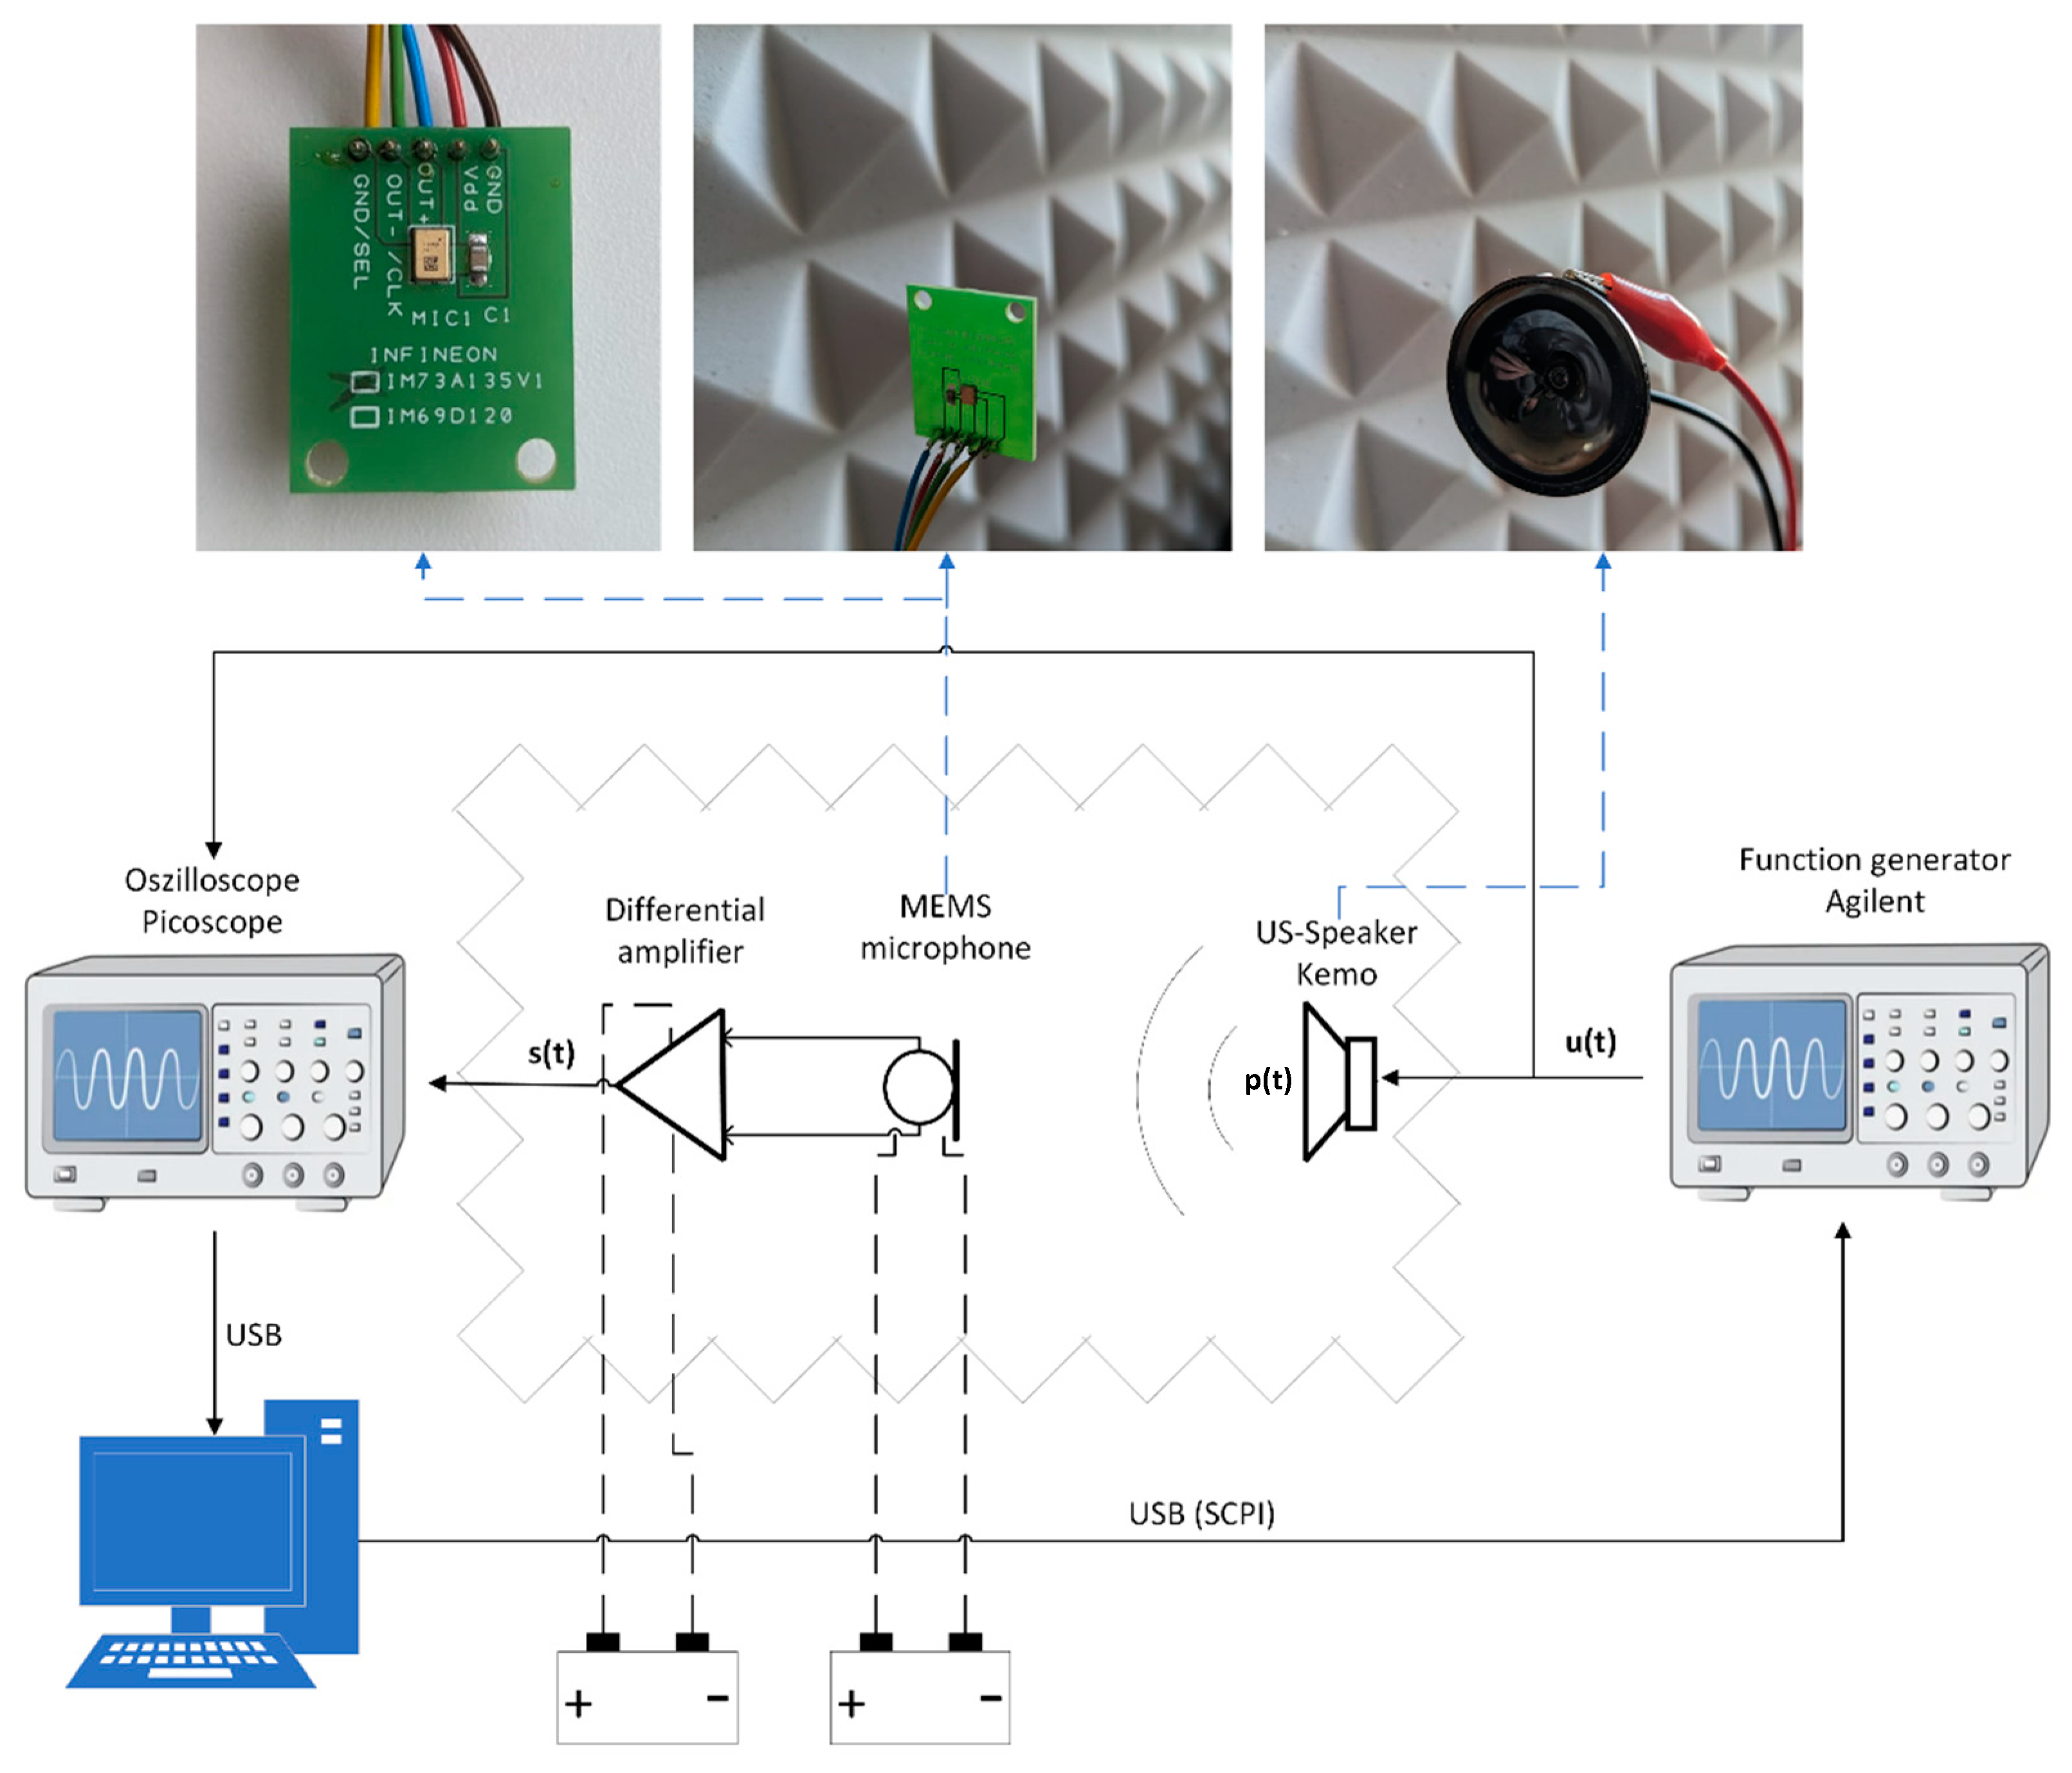
2.2. Methods
3. Results
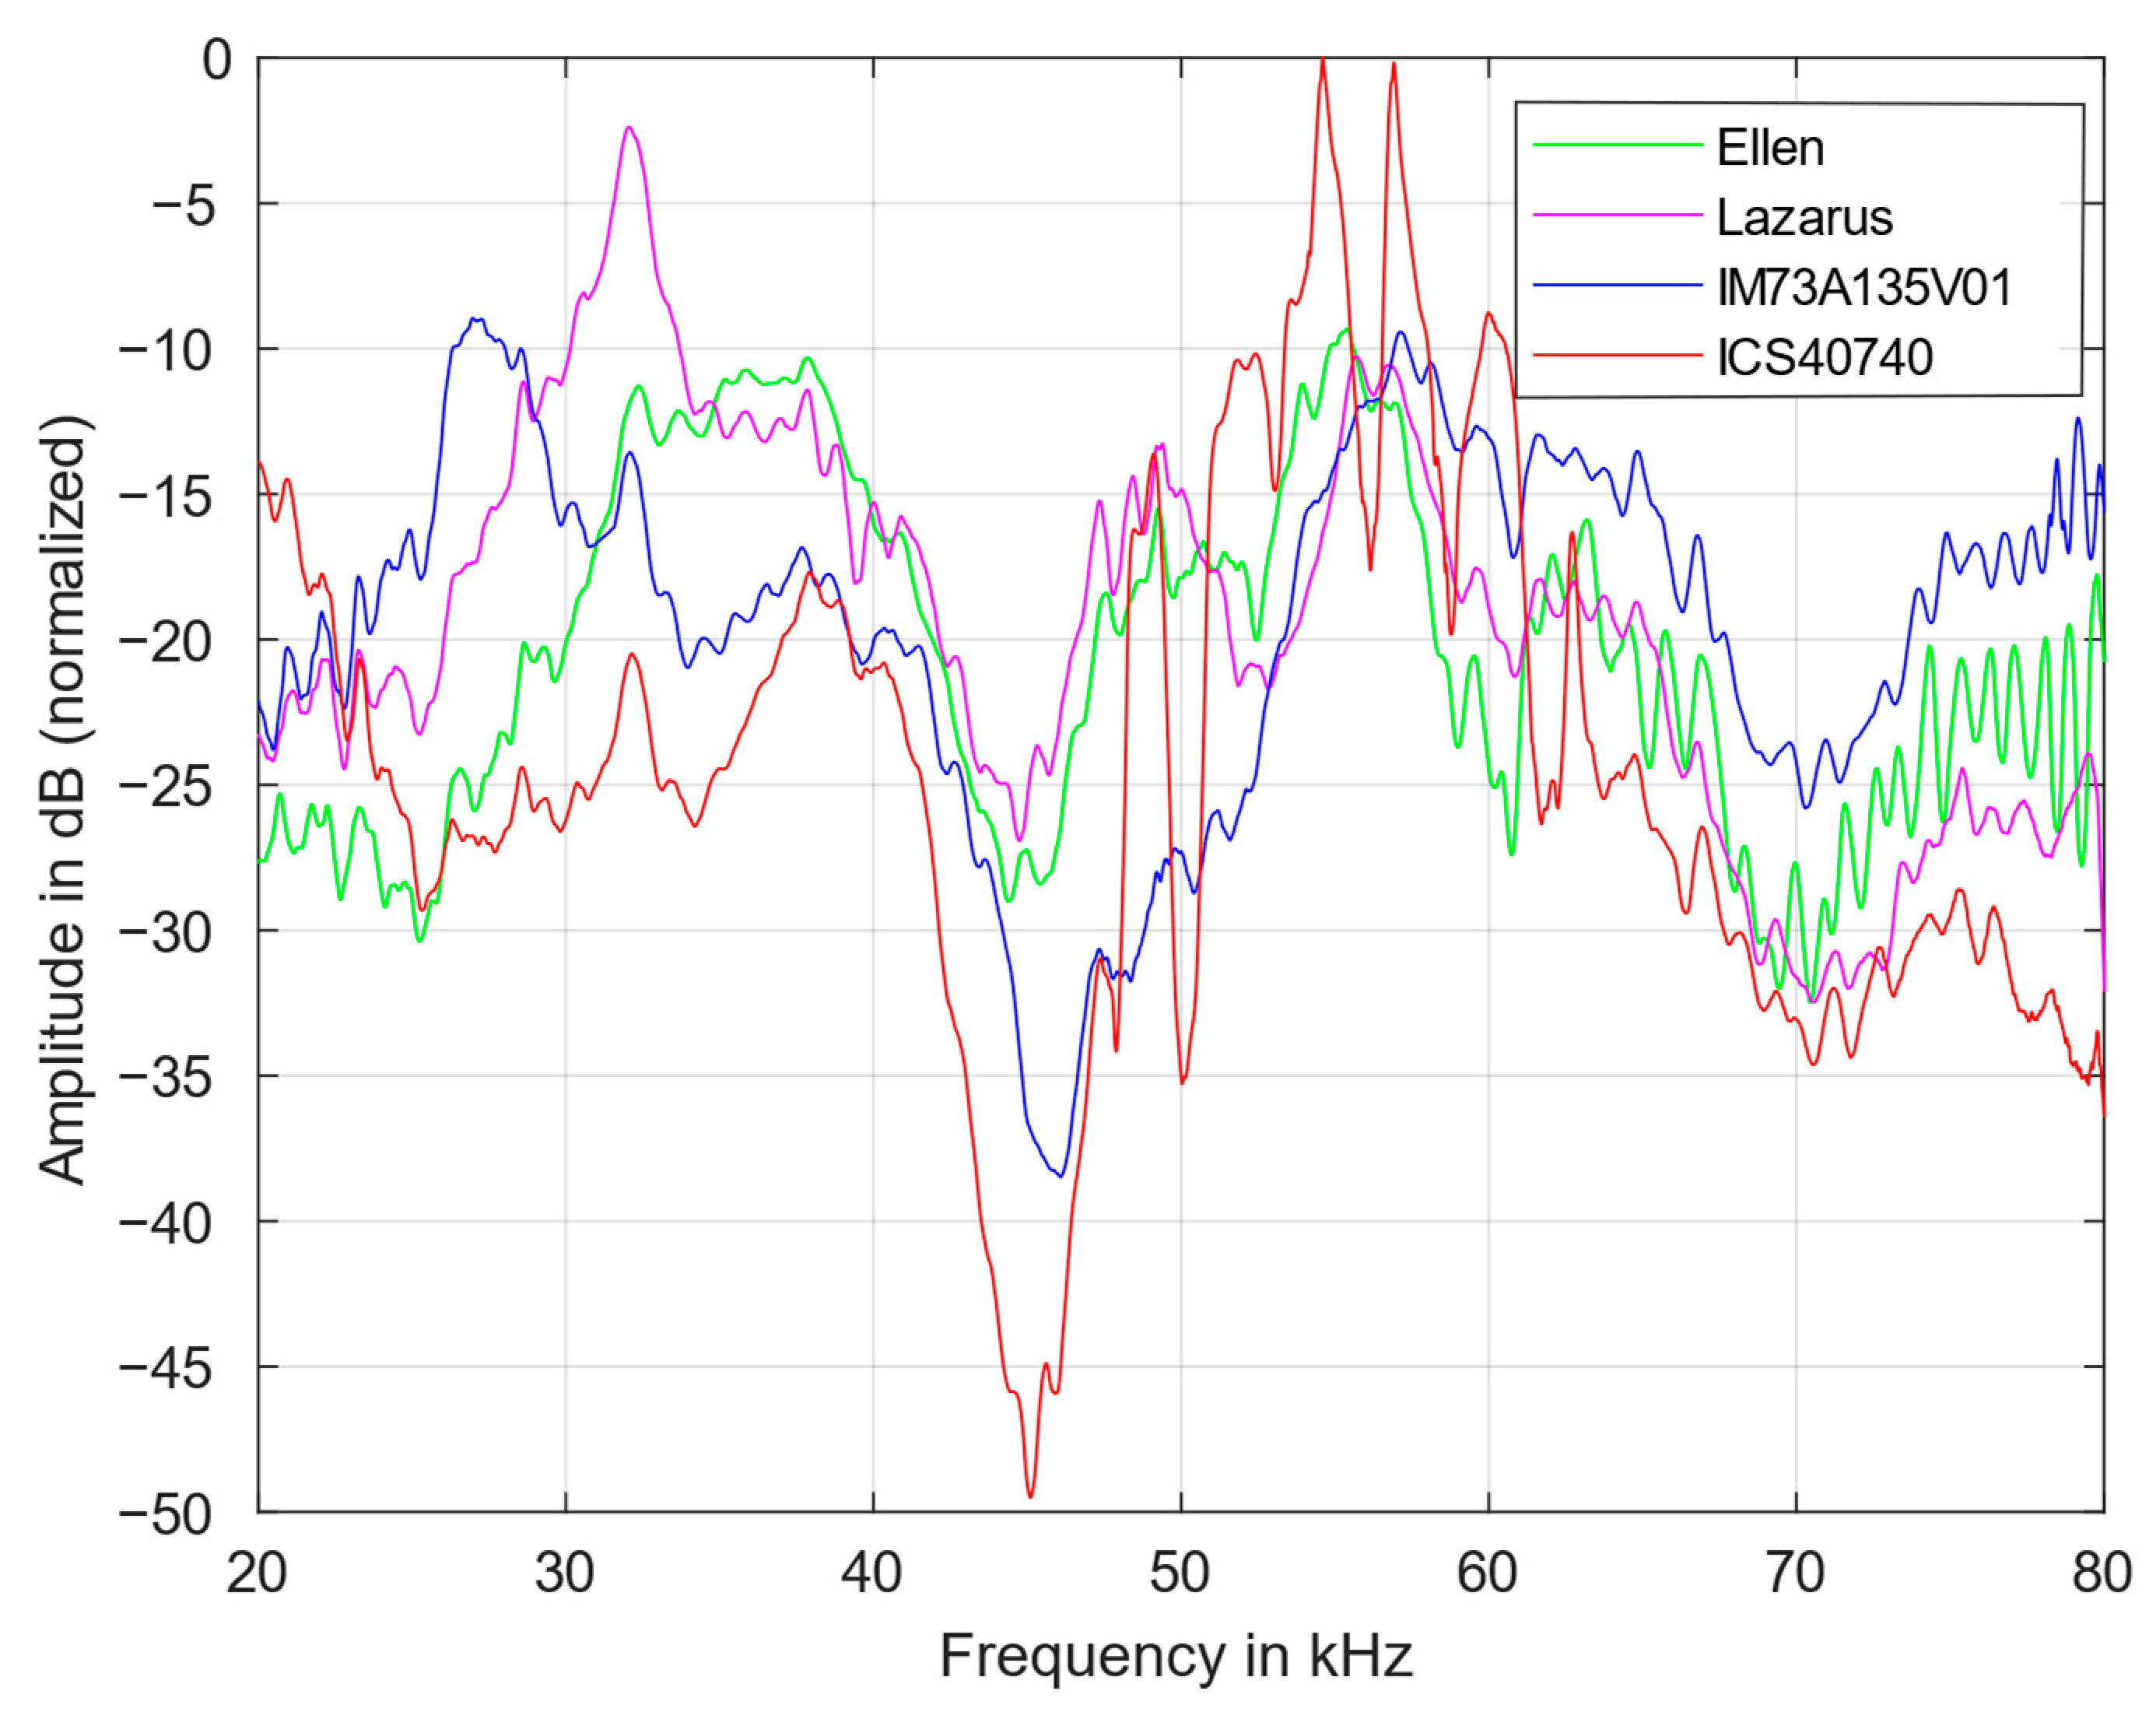
3.1. Transfer Function
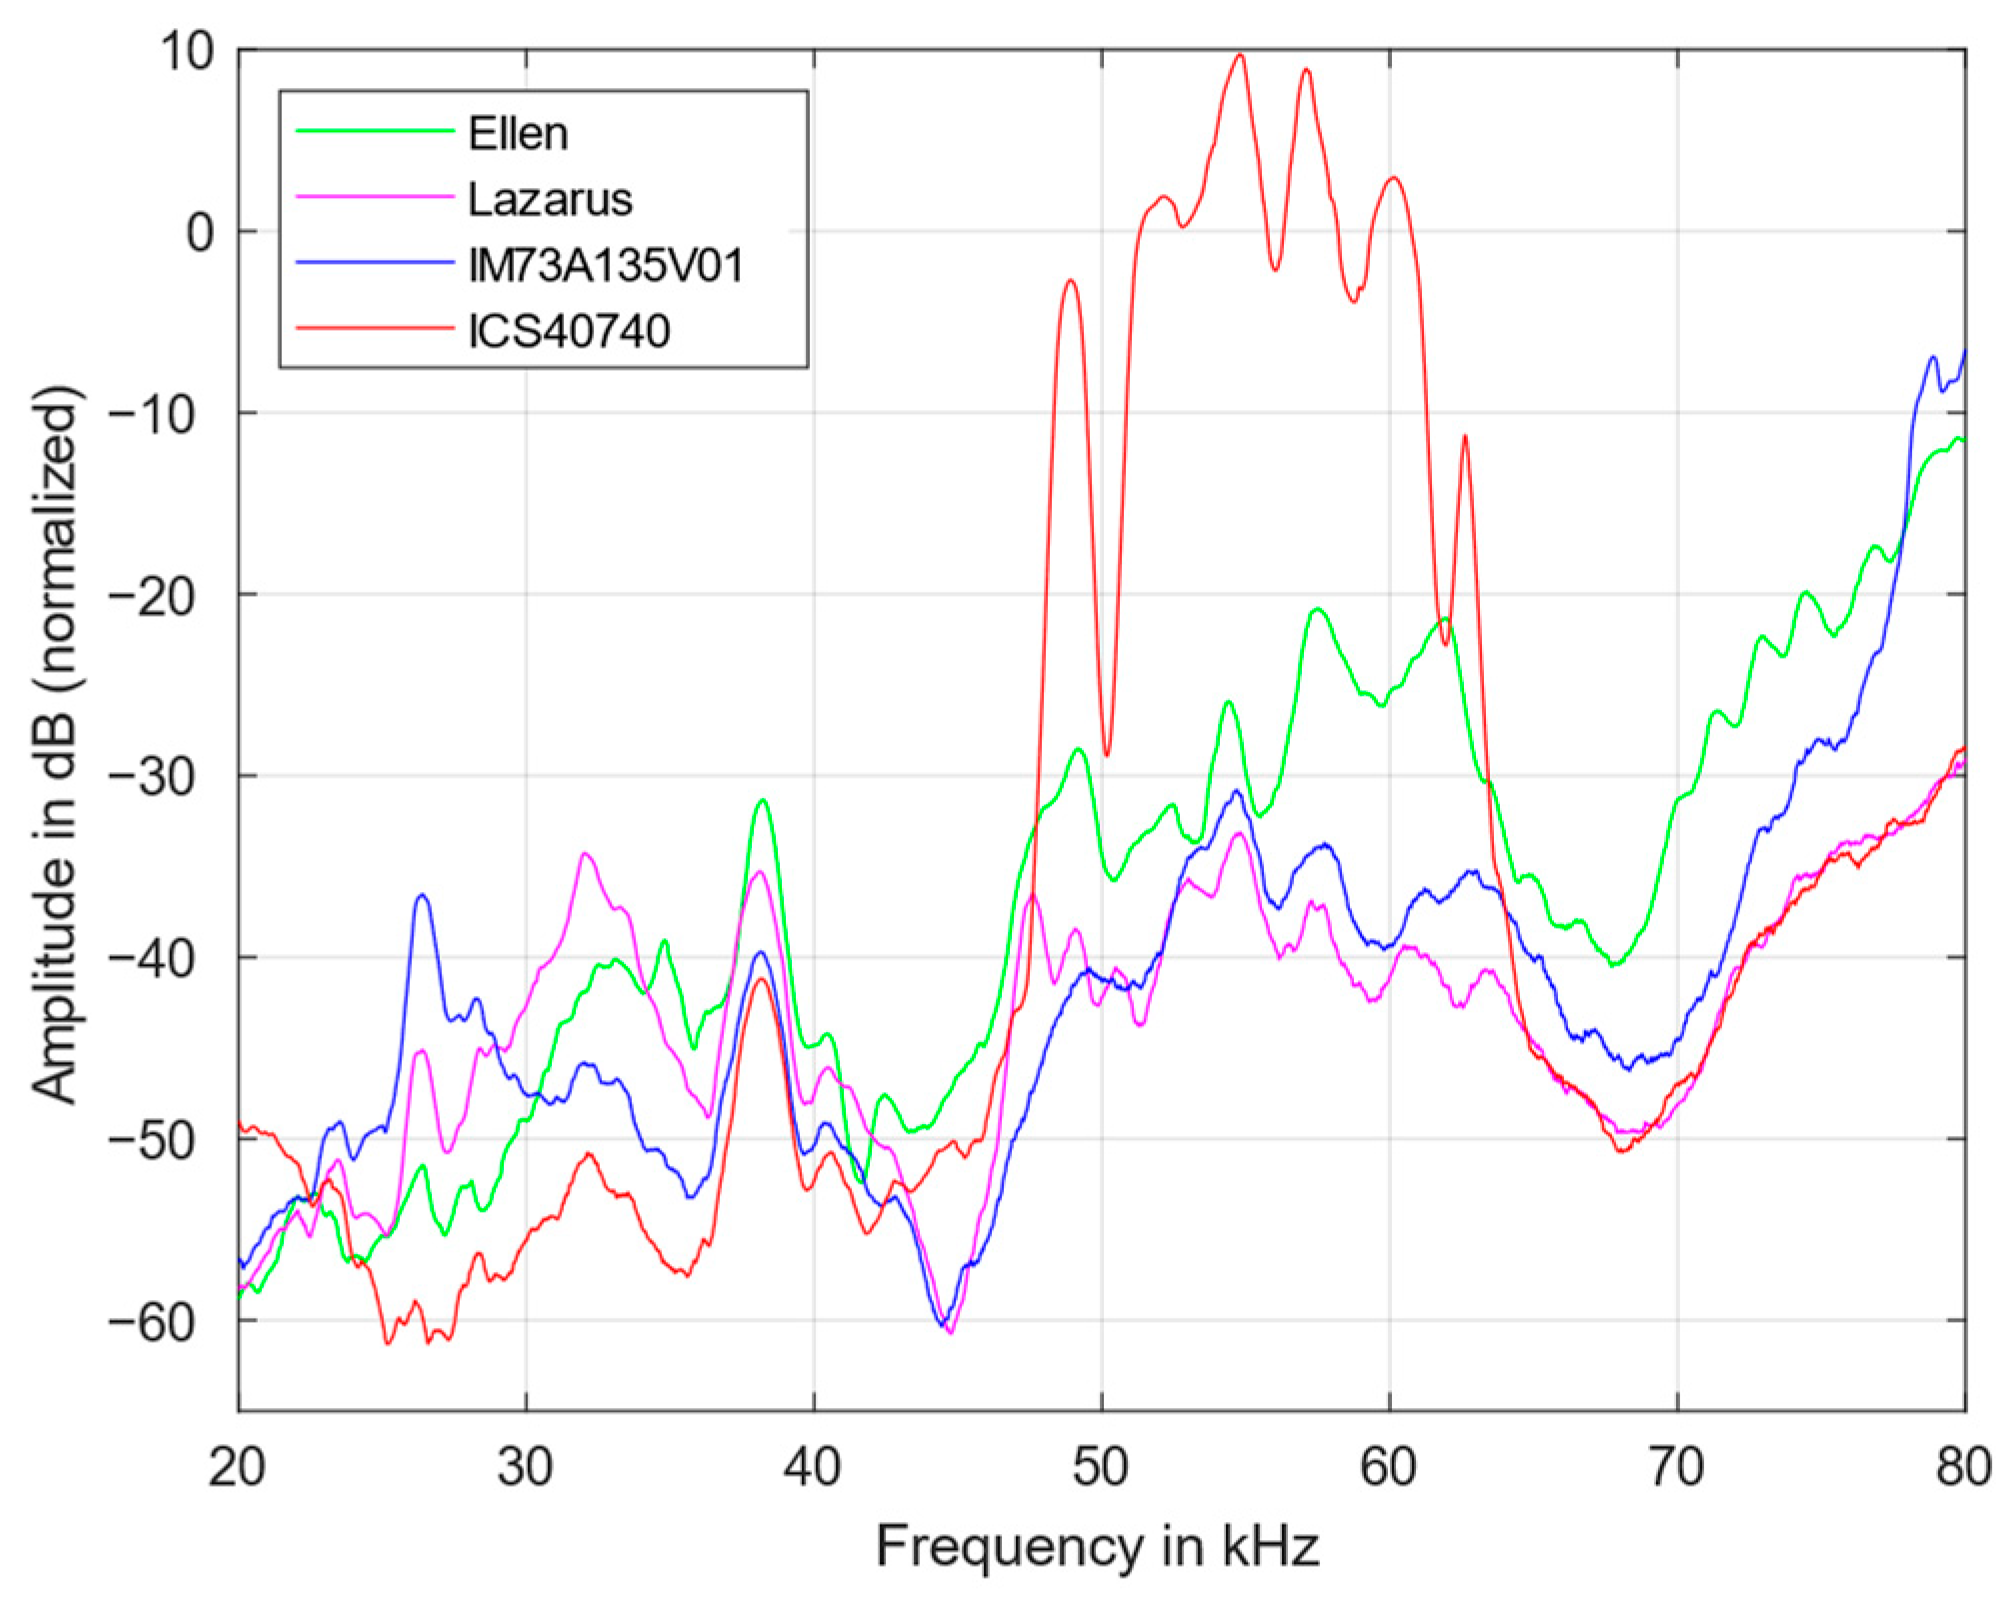
3.2. Signal-to-Noise Ratio
4. Conclusions
Author Contributions
Funding
Institutional Review Board Statement
Informed Consent Statement
Data Availability Statement
Conflicts of Interest
References
- Palzer, S. Photoacoustic-based gas sensing: A review. Sensors 2020, 20, 2745. [Google Scholar] [CrossRef] [PubMed]
- Walser, S. Programmierbare Kapazitive MEMS-Mikrofone. Ph.D. Thesis, University of the German Federal Armed Forces, Munich, Germany, 2017. [Google Scholar]
- Hermawanto, D.; Ishikawa, K.; Yatabe, K.; Oikawa, Y. Determination of frequency response of MEMS microphone from sound field measurements using optical phase-shifting interferometry method. Elsevier Sci. Direct Appl. Acoust. 2020, 170, 107523. [Google Scholar] [CrossRef]
- Zawaw, S.A.; Hamzah, A.A.; Majlis, B.Y.; Mohd-Yasin, F. A Review of MEMS Capacitive Microphones. Mircomachines 2020, 11, 484. [Google Scholar] [CrossRef] [PubMed]
- Wang, H.; Ma, Y.; Yang, H.; Jiang, H.; Ding, Y.; Xie, H. Review MEMS Ultrasound Transducers for Endoscopic Photoacoustic Imaging Applications. Mircomachines 2020, 11, 928. [Google Scholar]
- Falkhofen, J.; Bezwerk, J.; Bahr, M.-S.; El-Busaidy, S.; Baumann, B.; Wolff, M. First photoacoustic glucose measurements using an optimized open resonator. In 64th Course: Progress in Photoacoustic and Photothermal Phenomena; International School of Quantum Electronics: Erice, Italy, 2021. [Google Scholar]
- El-Busaidy, S.; Baumann, B.; Wolff, M.; Duggen, L. Shape Optimization of an Open Photoacoustic Resonator. Appl. Sci. 2021, 11, 2571. [Google Scholar] [CrossRef]
- Capineri, L.; Bulletti, A. Ultrasonic Guided-Waves Sensors and Integrated Structural Health Monitoring Systems for Impact Detection and Localization: A Review. Sensors 2021, 21, 2929. [Google Scholar] [CrossRef]
- Erfanzadeh, M.; Zhu, Q. Photoacoustic imaging with low-cost sources: A review. Photoacoustics 2019, 14, 1–11. [Google Scholar] [CrossRef]
- Burr-Brown Corporation. Precision Unity Gain Differential Amplifier INA105; Burr-Brown Corporation: Tucson, AZ, USA, 1985. [Google Scholar]
- Heilmann, R. Rauschen in der Sensorik; Springer: Berlin/Heidelberg, Germany, 2020. [Google Scholar]
- Knowles Corporation. The Ultrasonic Signal-to-Noise Ratio (SNR); Application Note AN30 1151; Knowles Corporation: Itasca, IL, USA, 2022. [Google Scholar]
- Novak, A.; Simon, L.; Lotton, P. Synchronized Swept-Sine: Theory, Application and Implementation. J. Audio Eng. Soc. 2015, 63, 786–798. [Google Scholar] [CrossRef]
- Müller, S.; Massarani, P. Transfer-Function Measurement with Sweeps. J. Audio Eng. Soc. 2001, 6, 29. [Google Scholar]
- Albuquerque, D.F. Ultrasonic Location System. Ph.D. Thesis, Universidade de Aveiro, Aveiro, Portugal, 2013. [Google Scholar]
- Infineon Technologies. MEMS Microphone Mechanical Acoustical Implementation Application Note AN557; Infineon Technologies: Munich, Germany, 2008. [Google Scholar]


| Manufacturer | Model | Sensitivity in dBV | SNR in dBV/Pa |
|---|---|---|---|
| Infineon | IM73A135V01 | −38.0 | 73.0 |
| TDK Invensense | ICS40740 | −37.5 | 70.0 |
| Knowles | Lazarus PH18C3LM4H-1 | −38.0 | 68.5 |
| Knowles | Ellen SPW0878LR5H-1 | −38.0 | 65.0 |
| Microphone | Frequency in kHz | |
|---|---|---|
| First Resonance | Higher Resonances | |
| IM73A135V01 | 28 | 40/57 |
| ICS40740 | 20 | 40/55 |
| Lazarus | 33 | 48/55 |
| Ellen | 37 | 48/55 |
| Microphone | 20 kHz | 40 kHz | 75 kHz | |||
|---|---|---|---|---|---|---|
| IM73A135V01 | −16.34 | −25.35 | −17.94 | −23.31 | −10.16 | −19.97 |
| ICS40740 | −19.88 | −17.12 | −16.14 | −24.28 | −24.64 | −32.72 |
| Ellen | −25.72 | −30.94 | −15.14 | −19.33 | −15.03 | −26.67 |
| Lazarus | −16.90 | −26.50 | −12.03 | −18.53 | −18.47 | −29.40 |
Disclaimer/Publisher’s Note: The statements, opinions and data contained in all publications are solely those of the individual author(s) and contributor(s) and not of MDPI and/or the editor(s). MDPI and/or the editor(s) disclaim responsibility for any injury to people or property resulting from any ideas, methods, instructions or products referred to in the content. |
© 2023 by the authors. Licensee MDPI, Basel, Switzerland. This article is an open access article distributed under the terms and conditions of the Creative Commons Attribution (CC BY) license (https://creativecommons.org/licenses/by/4.0/).
Share and Cite
Falkhofen, J.; Wolff, M. Near-Ultrasonic Transfer Function and SNR of Differential MEMS Microphones Suitable for Photoacoustics. Sensors 2023, 23, 2774. https://doi.org/10.3390/s23052774
Falkhofen J, Wolff M. Near-Ultrasonic Transfer Function and SNR of Differential MEMS Microphones Suitable for Photoacoustics. Sensors. 2023; 23(5):2774. https://doi.org/10.3390/s23052774
Chicago/Turabian StyleFalkhofen, Judith, and Marcus Wolff. 2023. "Near-Ultrasonic Transfer Function and SNR of Differential MEMS Microphones Suitable for Photoacoustics" Sensors 23, no. 5: 2774. https://doi.org/10.3390/s23052774
APA StyleFalkhofen, J., & Wolff, M. (2023). Near-Ultrasonic Transfer Function and SNR of Differential MEMS Microphones Suitable for Photoacoustics. Sensors, 23(5), 2774. https://doi.org/10.3390/s23052774