1. Introduction
Due to the rapid advancement of the Internet of things (IoT) technology in various fields, ref. [
1] IoT devices, IoT services, and IoT applications, IoT-enabled wireless body area network (WBAN) has gained popularity as well as new opportunities for its development [
2,
3,
4]. In the IoT-enabled WBAN systems, IoT-connected devices, for example, audio recording devices and intelligent sensors, generate a huge amount of signals, such as multimodal health data. As a result of the big data generated by the IoT devices, effective data analysis, data processing, and prediction becomes very difficult. Consequently, incorporating machine learning methods with IoT-enabled WBAN becomes a necessity for effective analysis, processing and prediction of the health data. In this study, we proposed the integration of machine learning algorithms with IoT-enabled WBAN systems to predict patients’ emotions from their speech. The developed system would assist medical professionals to identify patients with mental health related issues such as depression, anxiety disorder, and bipolar disorder for early medication and therapy.
Speech can be described as an information-rich signal which contains linguistic and paralinguistic information. Emotion is one of the key instance of paralinguistic information which in part is conveyed by speech. As a consequence, it is important to develop machines that understand paralinguistic information, for example, emotion, to facilitate the monitoring of patients emotion from their speech. Emotions are mental states caused by neurophysiological shifts associated with different thoughts, feelings, behavioural responses, and a degree of pleasure or displeasure. The advent of IoT technology has made speech signals an excellent source to recognize the emotional state of humans either during human-to-human communication, human-to-machine communication or based on recorded human speech. At the same time, the emotional state of someone’s mind is also a critical factor in finding a correlation influencing channel of interactions between people, such as facial expressions, speech characteristics, and also the linguistic content of verbal communications [
5,
6]. In practice, emotions are economically more straightforward to obtain than other corporal signals like implantable data [
7], electromyography (EMG) [
8], and electroencephalogram (EEG) [
9], which makes speech emotion recognition (SER) research very attractive.
SER research has recently been helpful in improving the health and well-being of humans, developing a healthy society or social behaviour, and addressing psychological issues to enhance humans’ productivity. Emotions have repercussions both on voice characteristics and the linguistic content of speech. Typically, a machine-learning algorithm is used to harvest language features with random mutations to categorize emotional responses into different class. The features that one may pick to train the machine learning model is one of the most important tools for developing effective SER systems that recognizes a patient’s emotions. To understand the relevance of the raw signal in the speech data, it is essential to increase the diversity of the conversation and response appropriately [
10,
11,
12].
The features extracted from the speech signal greatly influence the reliability of human–computer interaction. The speech signals have discrete feature representations that suffer from data sparsity and do not consider semantic relatedness between features to enhance the personification of machines or improve recognition efficiency when converting speech into a feature representation that can represent human emotions. Thus, selecting an optimal set of features that is less time consuming, efficient and generalized with unseen raw signals becomes a challenge because it is quite challenging to find the features that perfectly represent each emotional state [
12,
13,
14,
15,
16]. In literature, the prediction accuracy as well as the computational complexity of the existing SER system still requires more improvement, especially in the healthcare domain, to achieve a viable SER solution. Another challenge in SER is the ability to capture the changes in the emotion of patients in a real-time manner before and after treatment. As a consequence, we propose an emotion-aware IoT-enabled WBAN system within the healthcare framework by investigating the effectiveness of different machine learning and deep learning algorithms, feature extraction methods, and normalization methods. Additionally, we propose a hybrid deep learning model combined with different optimization strategies to improve the prediction accuracy as well as to minimize the computational complexity of the SER system in terms of computational time, power, and space. The main contributions of this study are summarized as follows:
The integration of machine learning methods with IoT-enabled WBAN systems for patients’ speech emotion detection;
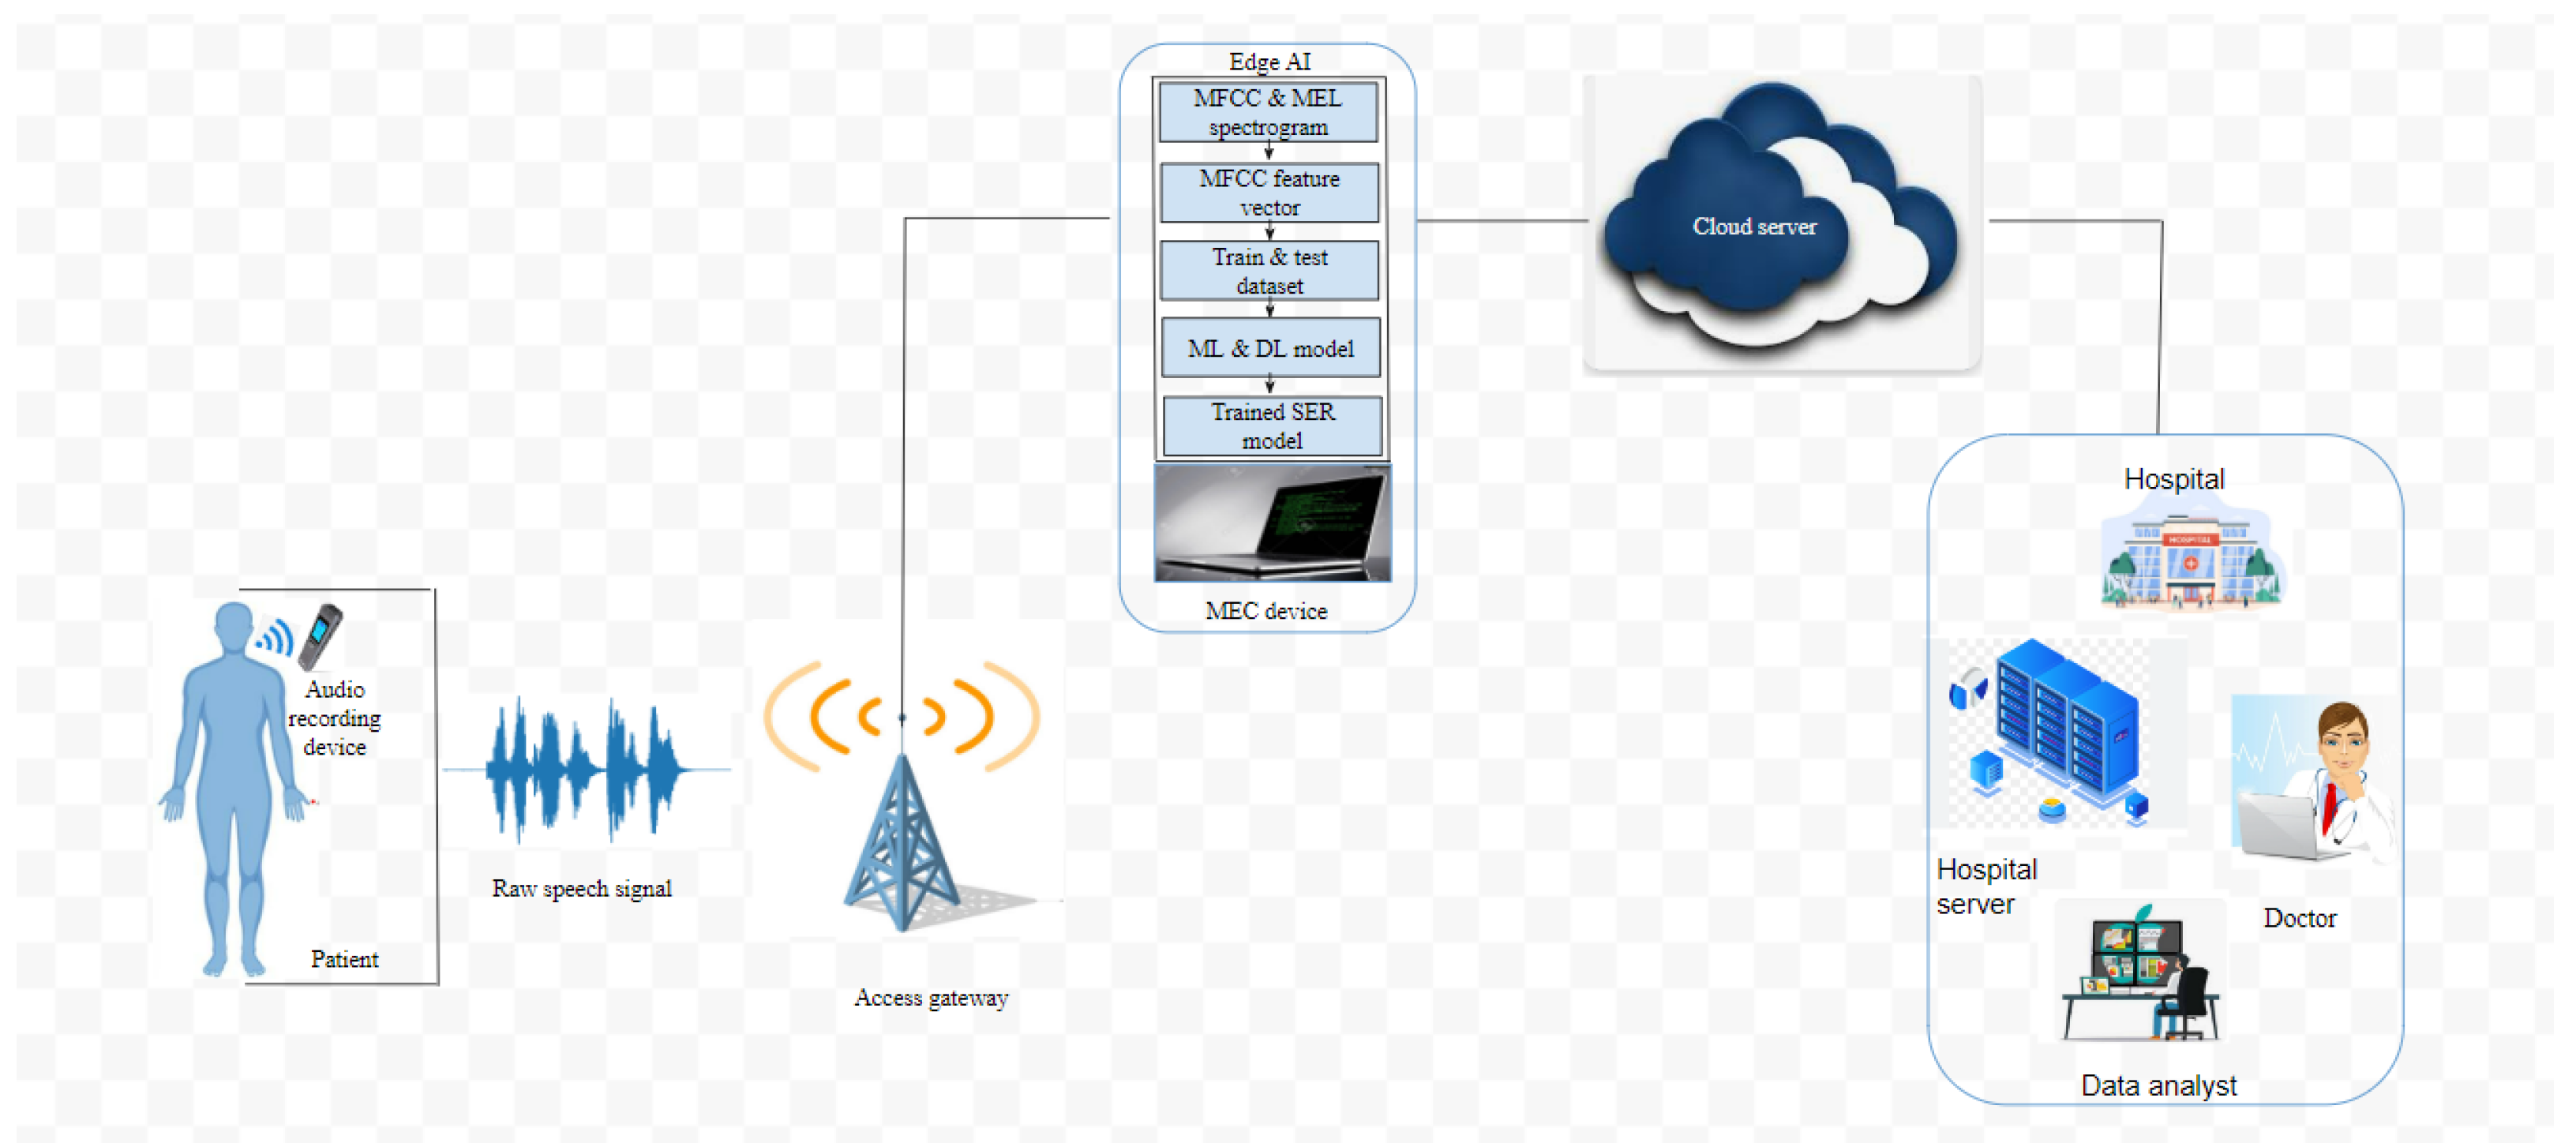
The development of an emotion-aware IoT-enabled WBAN system with edge AI for real-time predictions and to capture the changes in patients’ emotions before and after treatment;
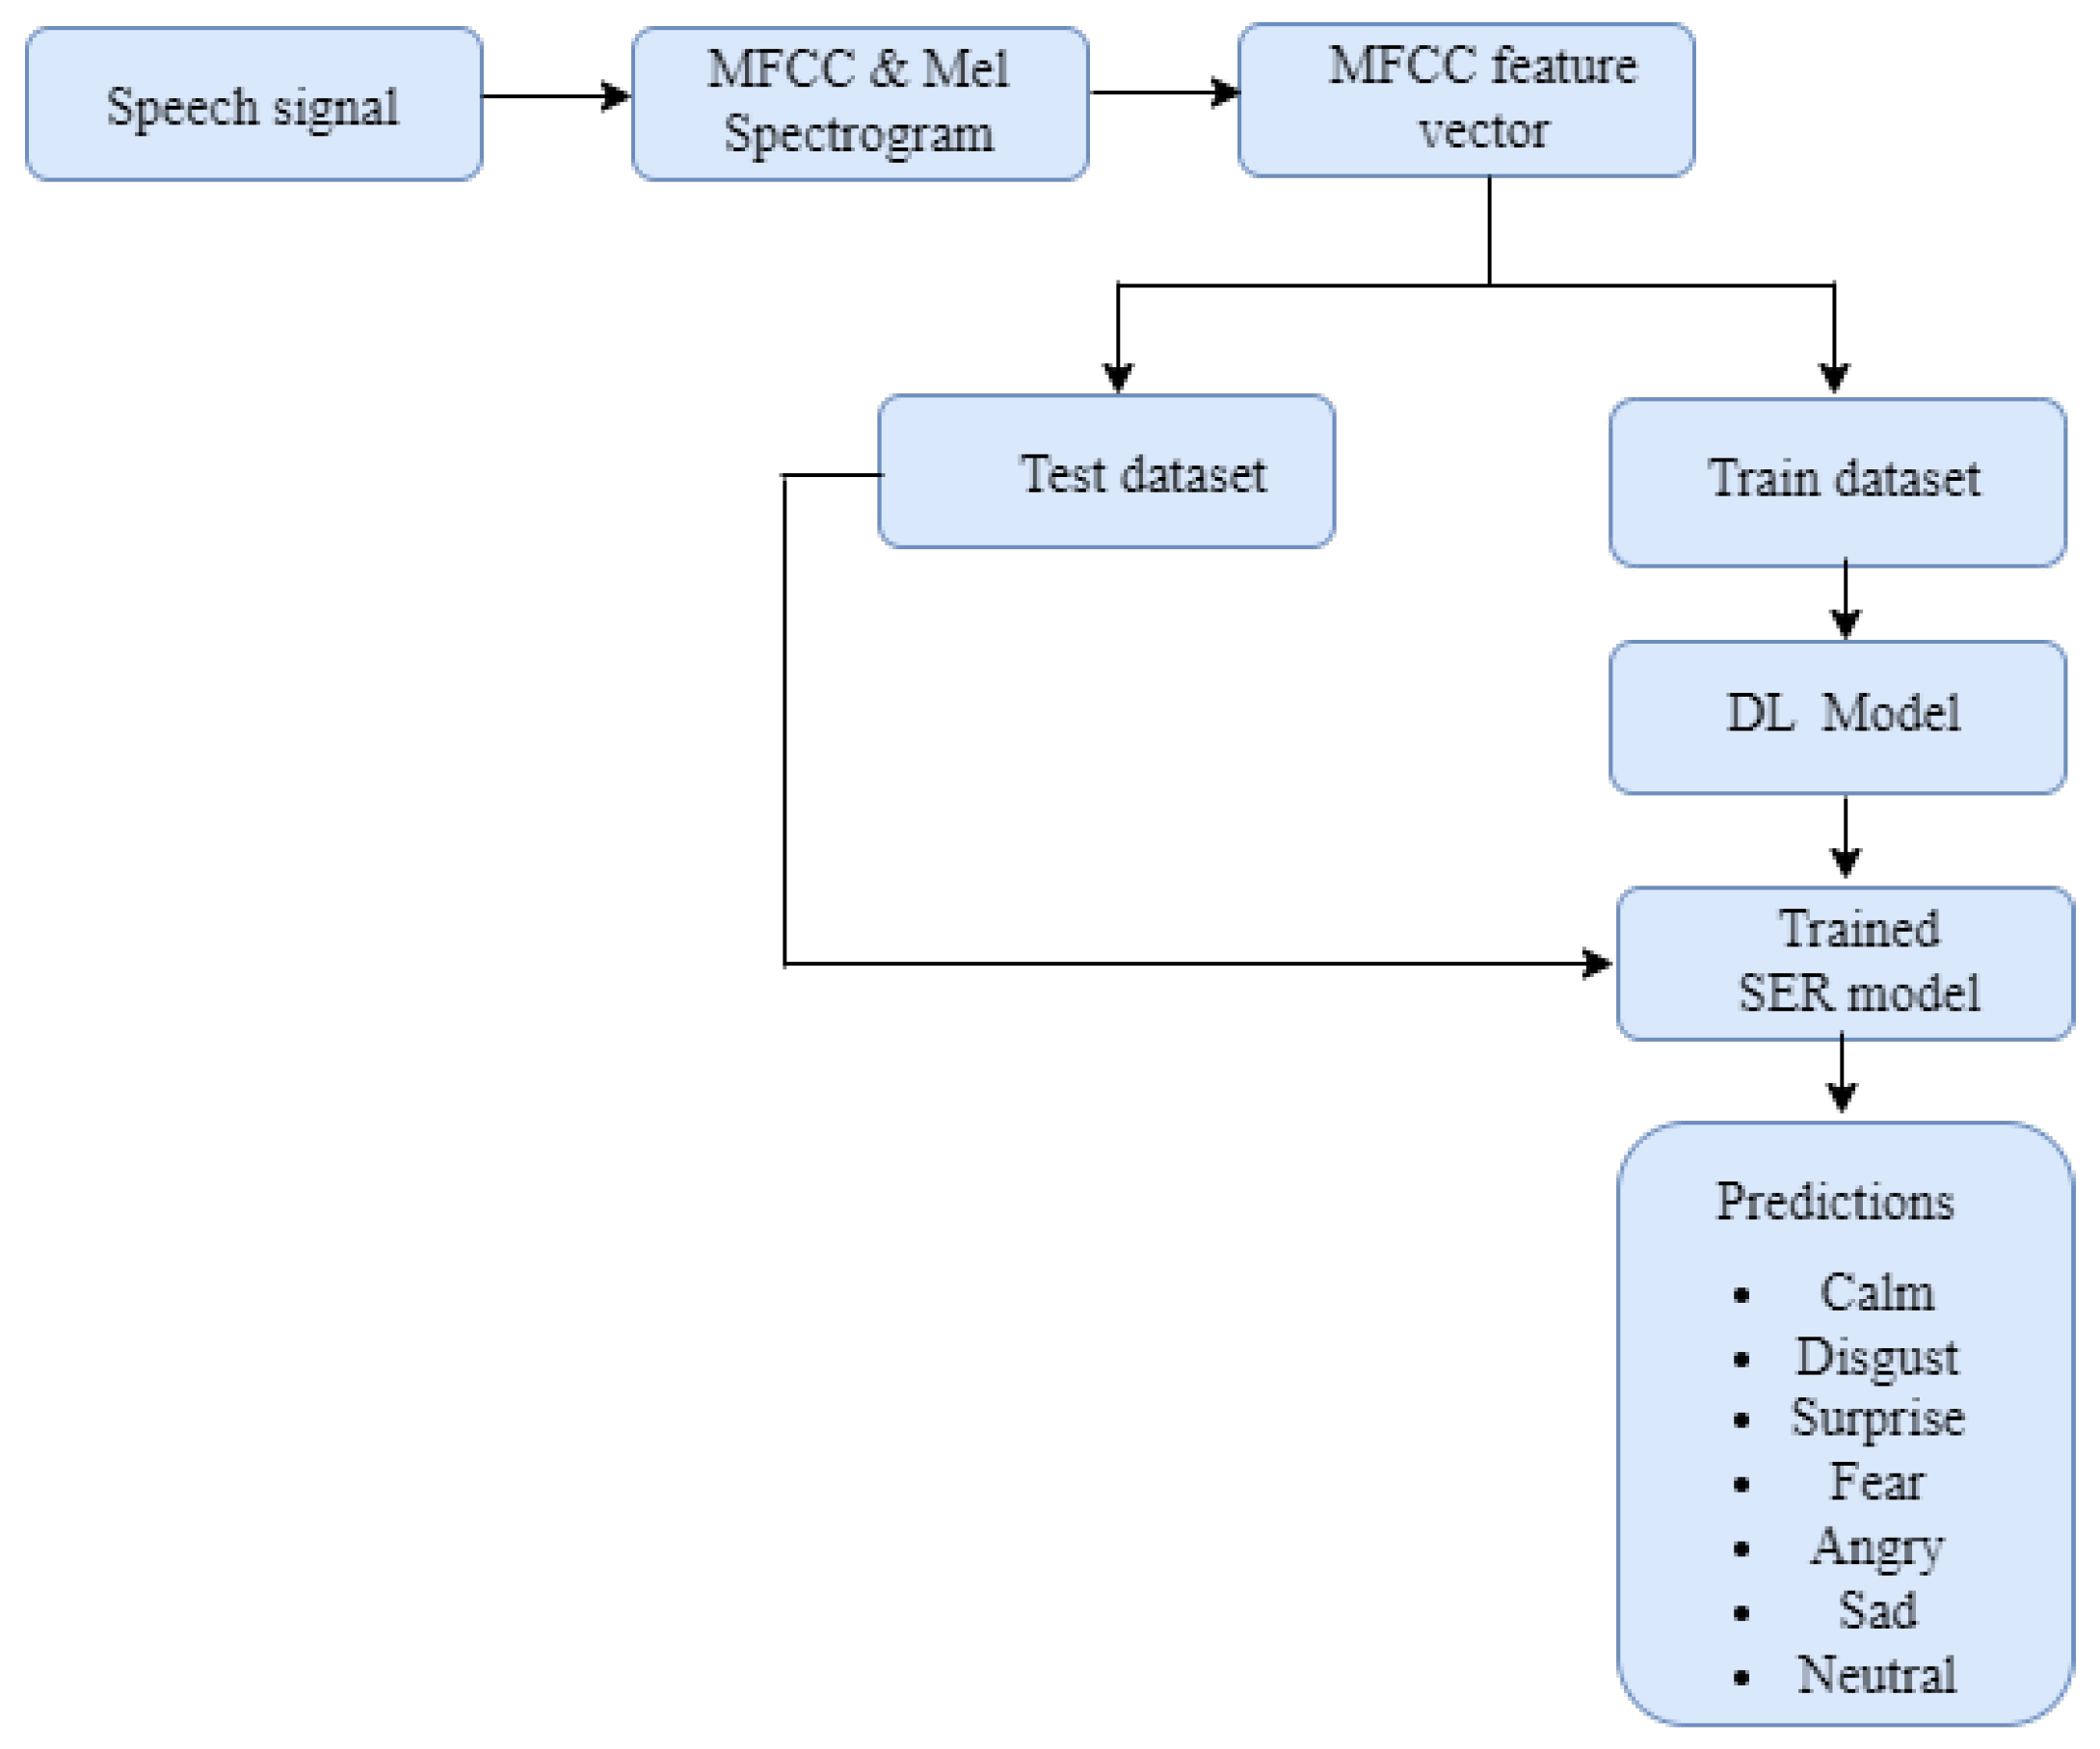
The combination of signal processing techniques and deep learning methods for extracting speech emotion features;
The development of a hybrid deep learning model, i.e., convolutional neural network (CNN) and bidirectional long short-term memory (BiLSTM), and a regularized CNN model combined with different optimization strategies and regularization techniques to improve the prediction accuracy as well as to minimize the computational complexity of the SER system in terms of computational time, power, and space;
The effect of feature normalization methods and their impact on the classification performance of the SER models were investigated;
The comparison and evaluation of the proposed SER models with a related existing model for the sake of validation were carried out.
The content of this paper is organized as follows,
Section 1 presents the introduction, including motivation, objective, and the contribution summary of the study.
Section 2 discusses a short literature review of the machine and deep learning-related studies for SER in chronological order.
Section 3 describes the proposed methods.
Section 4 discusses the performance metrics used for evaluating the models.
Section 5 presents the experimental results and discussions, while
Section 6 concludes the work.
2. Related Works
For a long time, SER research has been thrilling and several research papers have provided various methods for emotion recognition from speech expressions, body gesture, and audio-visual expressions [
17,
18,
19]. In SER, one of the central research issues is how to mine non-discriminating relevant features from speech signals to improve information diversity. In recent years, several researchers in the health domain have proposed different methods for extracting features to construct emotion recognition systems, for example, ref. [
20] developed an emotion detection system towards IoT big data from patients’ speech using features with four multiple directions and from video using a local ternary pattern. The authors of [
21] proposed a systematic and qualitative analysis of EEG features using multiple feature selection methods. It was concluded that multivariate feature selection techniques outperformed the univariate techniques, for instance, advanced feature selection methods such as higher-order crossings, higher-order spectra, and Hilbert–Huang spectrum were compared with spectral power bands. Additionally, ref. [
22] employed machine learning methods such as support vector machine (SVM) and artificial neural networks to develop emotion recognition systems using EEG signals of 15 participants. A wavelet analysis feature extraction technique was employed and features such as Hjorth parameters, statistical features, symmetric electrodes, differential entropy were extracted.
Likewise, different methods have been proposed in the literature for detecting relevant features directly from raw audio samples to recognize human emotions. In this direction, ref. [
10] presented characteristics derived from prosody, spectral envelope, and voice quality, as well as their capability to distinguish emotions from speech. They employed 324 spectral and 54 prosody features integrated with five voice quality features to test their proposed method on the Surrey Audio-Visual Expressed Emotion (SAVEE) database [
23] after involving minimal redundancy maximal relevance (mRMR) to reduce less discriminating features.
The authors of [
24] utilized SVM to classify male speech samples from the RAVDESS dataset. They used a continuous wavelet transform (CWT) when choosing features and fed them to different SVM classifiers. The authors of [
25] presented a multimodal emotion recognition technology that employs both the speech and facial data to recognize emotions in RAVDESS datasets. A pre-trained CNN-14 as a transfer model stack on Bi-LSTM with attention was used to distinguish acoustic features.
In [
26,
27,
28,
29], authors used a CNN model to understand the thoughts and emotions in people’s conversations by extracting the audio file and stacking the generated matrix in a one-dimensional cluster and summing the mean values along the time axis. However, the raw signal information quality is degraded and not efficient for large corpora.
In [
30], authors presented a majority voting technique (MVT) for detecting speech emotion using a fast correlation-based feature (FCBF) and Fisher score algorithms for feature selection. They extracted 16 low-level features and different experiments were performed using several ML algorithms, including neural network (NN) with one hidden layer, classification and regression tree (CART), SVM and K-nearest neighbour (KNN) on the Berlin Emotion Speech Database (EMO-DB) [
31].
Authors of [
32] used Mel Frequency Cepstral coefficients (MFCCs) produced from 520 samples taken from the EMO-DB dataset to develop a speech emotion detection system. The framework was implemented using a feature reduction fuzzy C-means clustering. They employed several classifiers such as NN, SVM and KNN. Additionally, ref. [
33] used the MFCC, chromatogram, zero-crossing rate, log mel-scale spectrogram, and the statistical root means square to extract emotion feature representation from relevant signals in audio files. The feature representations were used as inputs into the CNN model to outline local features stack on both LSTM and GRU architectures so as to understand the long-term contextual sequence in a sentence.
The exploration of acoustic features, semantic primitives, and emotion dimensions to map raw audio files into emotional expression was considered in [
15]. They categorized the continuous emotion dimensional importance into basic classes using the logistic model trees for multilingual speech emotion recognition on Fujitsu, EMO-DB [
31], and SAVEE databases. The highest weighted average precision was obtained after performing speaker normalization and feature selection.
In [
34], the authors used the channel attention module in a multilayer perceptron (MLP) model to extract the channel features or locations in the RAVDESS [
35], EMO-DB, and IEMOCAP speech emotion spectrograms. They used spatial attention in the CNN to extract the spatial features from the training dataset. The channel and spatial features were merged as a self-attention module and used CNN as a classifier.
The author of [
36] proposed a speech emotion detection system for healthcare using the RAVDESS dataset. Audio IoT devices are employed to record human voices and predict their emotions through deep learning, i.e., 2D-CNN. Furthermore, the study employed data normalization and augmentation techniques to improve the performance of the system. It is important to emphasize that emotion recognition is still a tremendous challenge for several reasons, as mentioned in
Section 1. These reasons include the existence of a gap between acoustic feature selection and human emotions, and the non-existence of a solid theoretical foundation relating the characteristics of voice to a human’s emotions [
11]. Therefore, more studies are still required to investigate the design of new models.
Different from the above papers, we proposed the integration of machine learning methods with IoT-enabled WBAN systems to identify patients’ emotion from their speech. In this system, data transmission and data processing are performed using edge AI for real-time prediction and as well capture the changes in patients’ emotions before and after treatment. Also, we proposed two deep learning models—the first model is a hybrid CNN and BiLSTM combined with different optimization strategies and the second model is a regularized CNN model using dropout, L1, and L2 techniques. The hybrid deep learning and the regularized CNN models are constructed to improve the prediction accuracy as well as to minimize the computational complexity of the SER system in terms of computational time, power, and space. Additionally, since speech data are generally composed of different emotions, we used the MFFCs signal processing techniques to extract feature vectors from the speech emotion signals. We applied different feature normalization methods to investigate their impacts on the classification performance.
4. Evaluation
The performance of the proposed models was evaluated by using performance evaluation metrics that included classification report (prediction accuracy, precision, recall, and F1 score) and confusion matrix. The performance parameters are discussed next.
4.1. Prediction Accuracy
The prediction accuracy
is an example of a classification report used to determine the percentage of the correctly predicted samples from the given samples and is expressed in (9) as:
4.2. Recall
Recall
is used to measure how efficient the model is at predicting the number of positive samples from the given positive samples in the dataset and is expressed in (10) as:
4.3. Precision
The precision metric denoted as
℘ is used to determine the total number of relevant predicted positive samples and is expressed in (11) as:
4.4. F1-Score
The F1-score measure denoted as
is determined by the harmonic mean of recall and precision and is expressed in (12) as:
In (7)–(11), , and denote true positive, true negative, false positive, and false negative, respectively.
4.5. Confusion Matrix
Confusion matrix was used as a performance evaluation tool to summarize the performance of the classification model. It helps to understand the performance of the classification model and the type of errors that a model produced. It also provides a summary of the correct and incorrect predictions, while evaluating the performance of a classification model, under the followinf four categories:
4.5.1. True Positives (TP)
True positives occur when the predicted observation belongs to a certain class and the observation actually belongs to that class.
4.5.2. True Negatives (TN)
True negatives occur when the predicted observation does not belong to a certain class and the observation actually does not belong to that class.
4.5.3. False Positives (FP)
False positives occur when the predicted observation belongs to a certain class but the observation actually does not belong to that class. FP error is called a Type I error.
4.5.4. False Negatives (FN)
False negatives occur when the predicted observation does not belong to a certain class but the observation actually belongs to that class. FN error is called a Type II error.
5. Results and Discussion
In this section, we present the experimental results of the proposed SER systems. The performance of the developed machine learning and deep learning approaches, such as KNN, DT, and CNN, was compared based on the considered normalization methods using standard performance metrics such as accuracy, precision, recall, F1-score, and confusion matrix.
5.1. Experiment Settings
In the proposed system, we employed Adam optimization, random search hyperparameter optimization, and regularization techniques to optimize the computational resources such as computational time, computational power, and computational space of the system.
The parameters used for the experiments are shown in
Table 1. The proposed models were tested on 10% of the data and the classification reports, i.e., accuracy, precision, recall, and F1-score, of the models are presented in
Table 2,
Table 3 and
Table 4. The proposed deep learning models are compared with the most relevant existing work in the literature for the purpose of evaluation and validation. These reports were averaged based on the weights of each class.
5.2. Performance Comparison of the Proposed Models and the Existing Model
This section presents the performance comparison of the proposed models, i.e., regularized CNN and CNN-BiLSTM and the most closely related existing model [
36] in the context of accuracy, precision, recall, and F1 score, as shown in
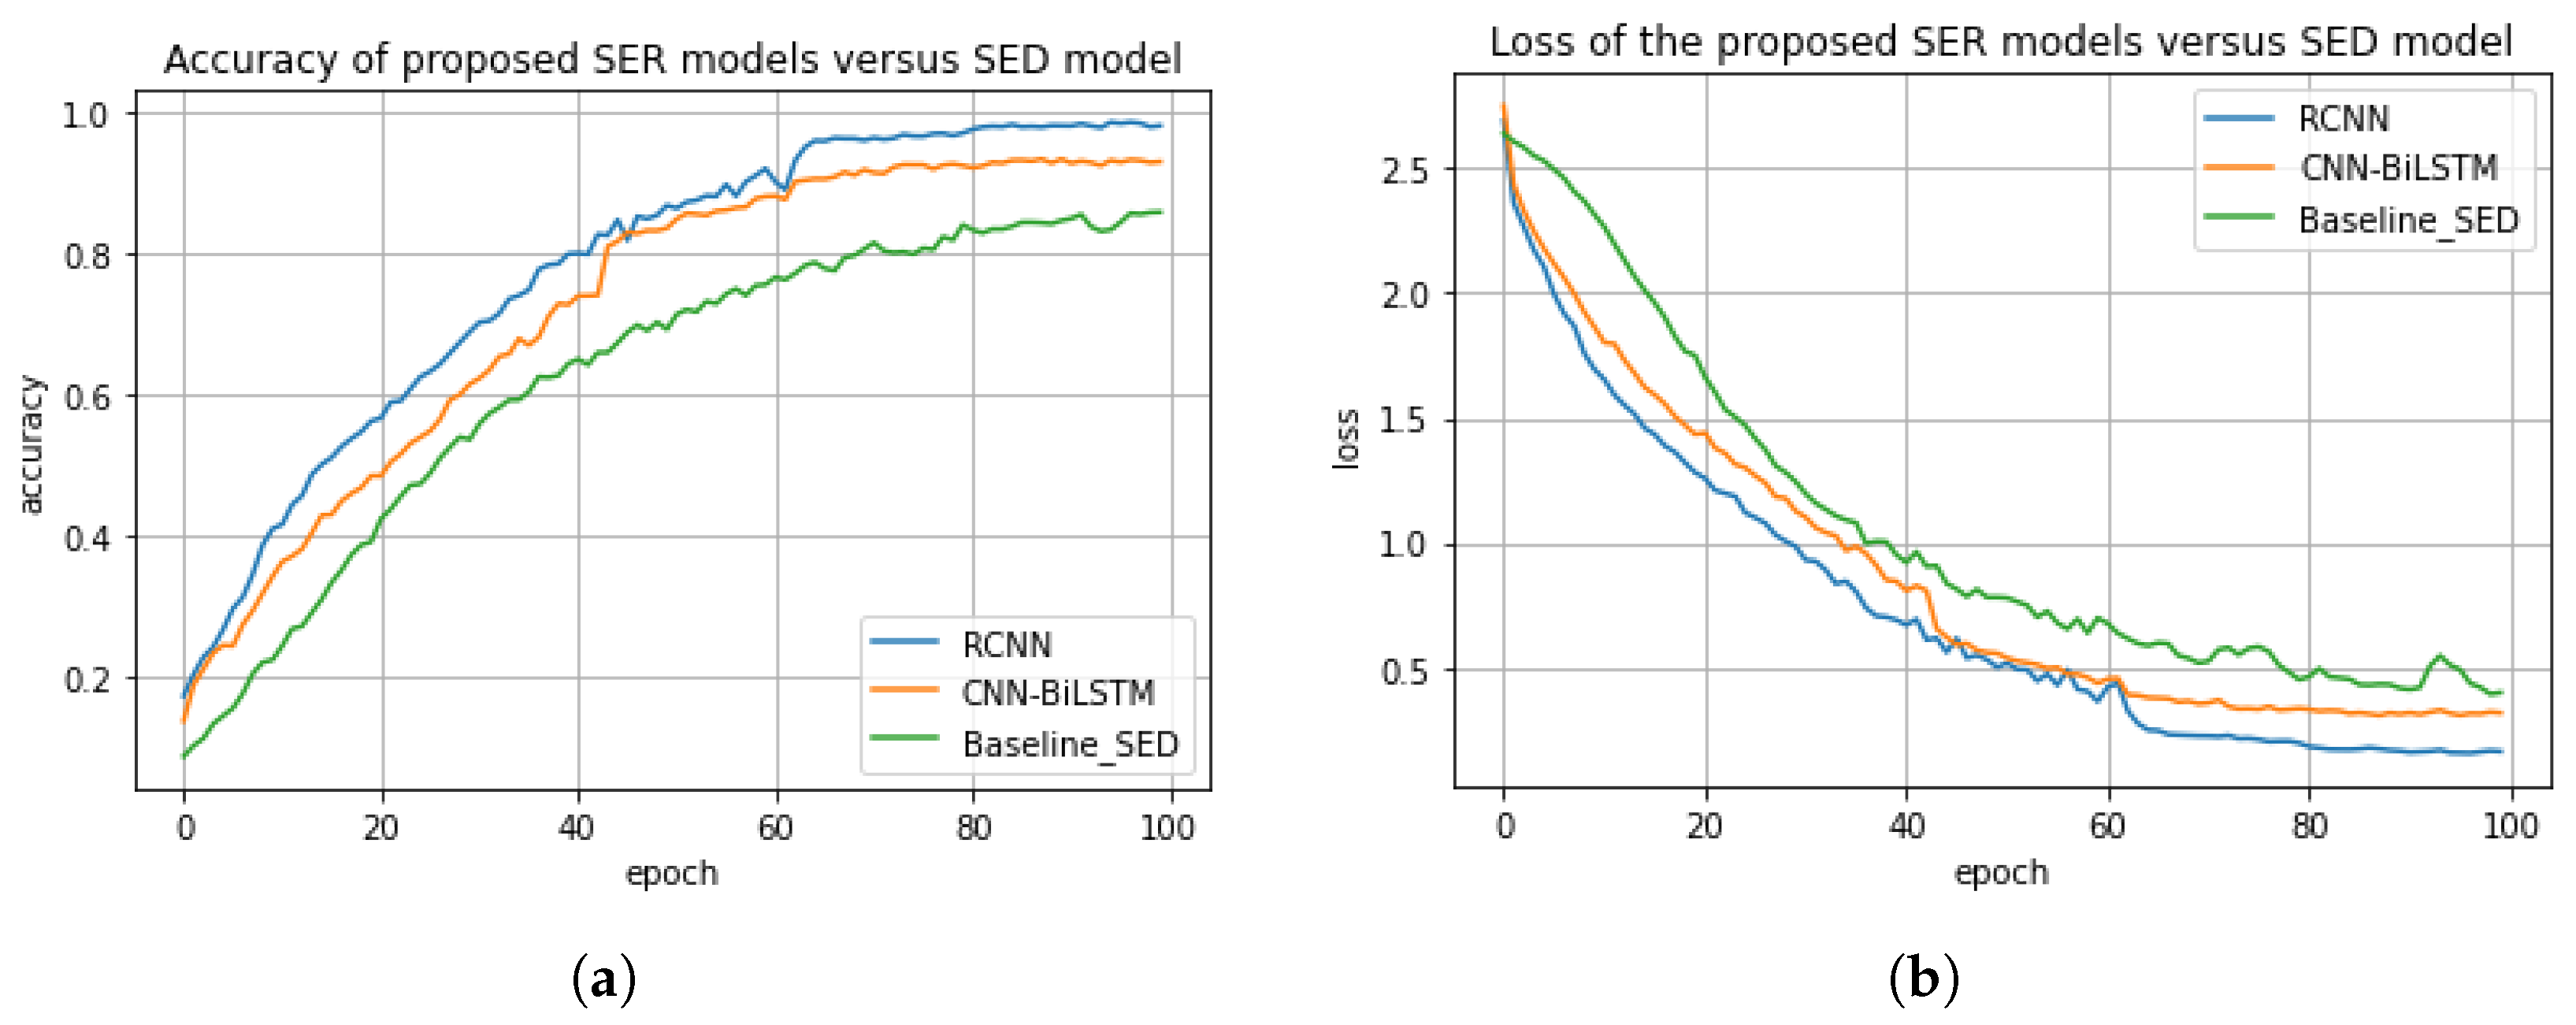
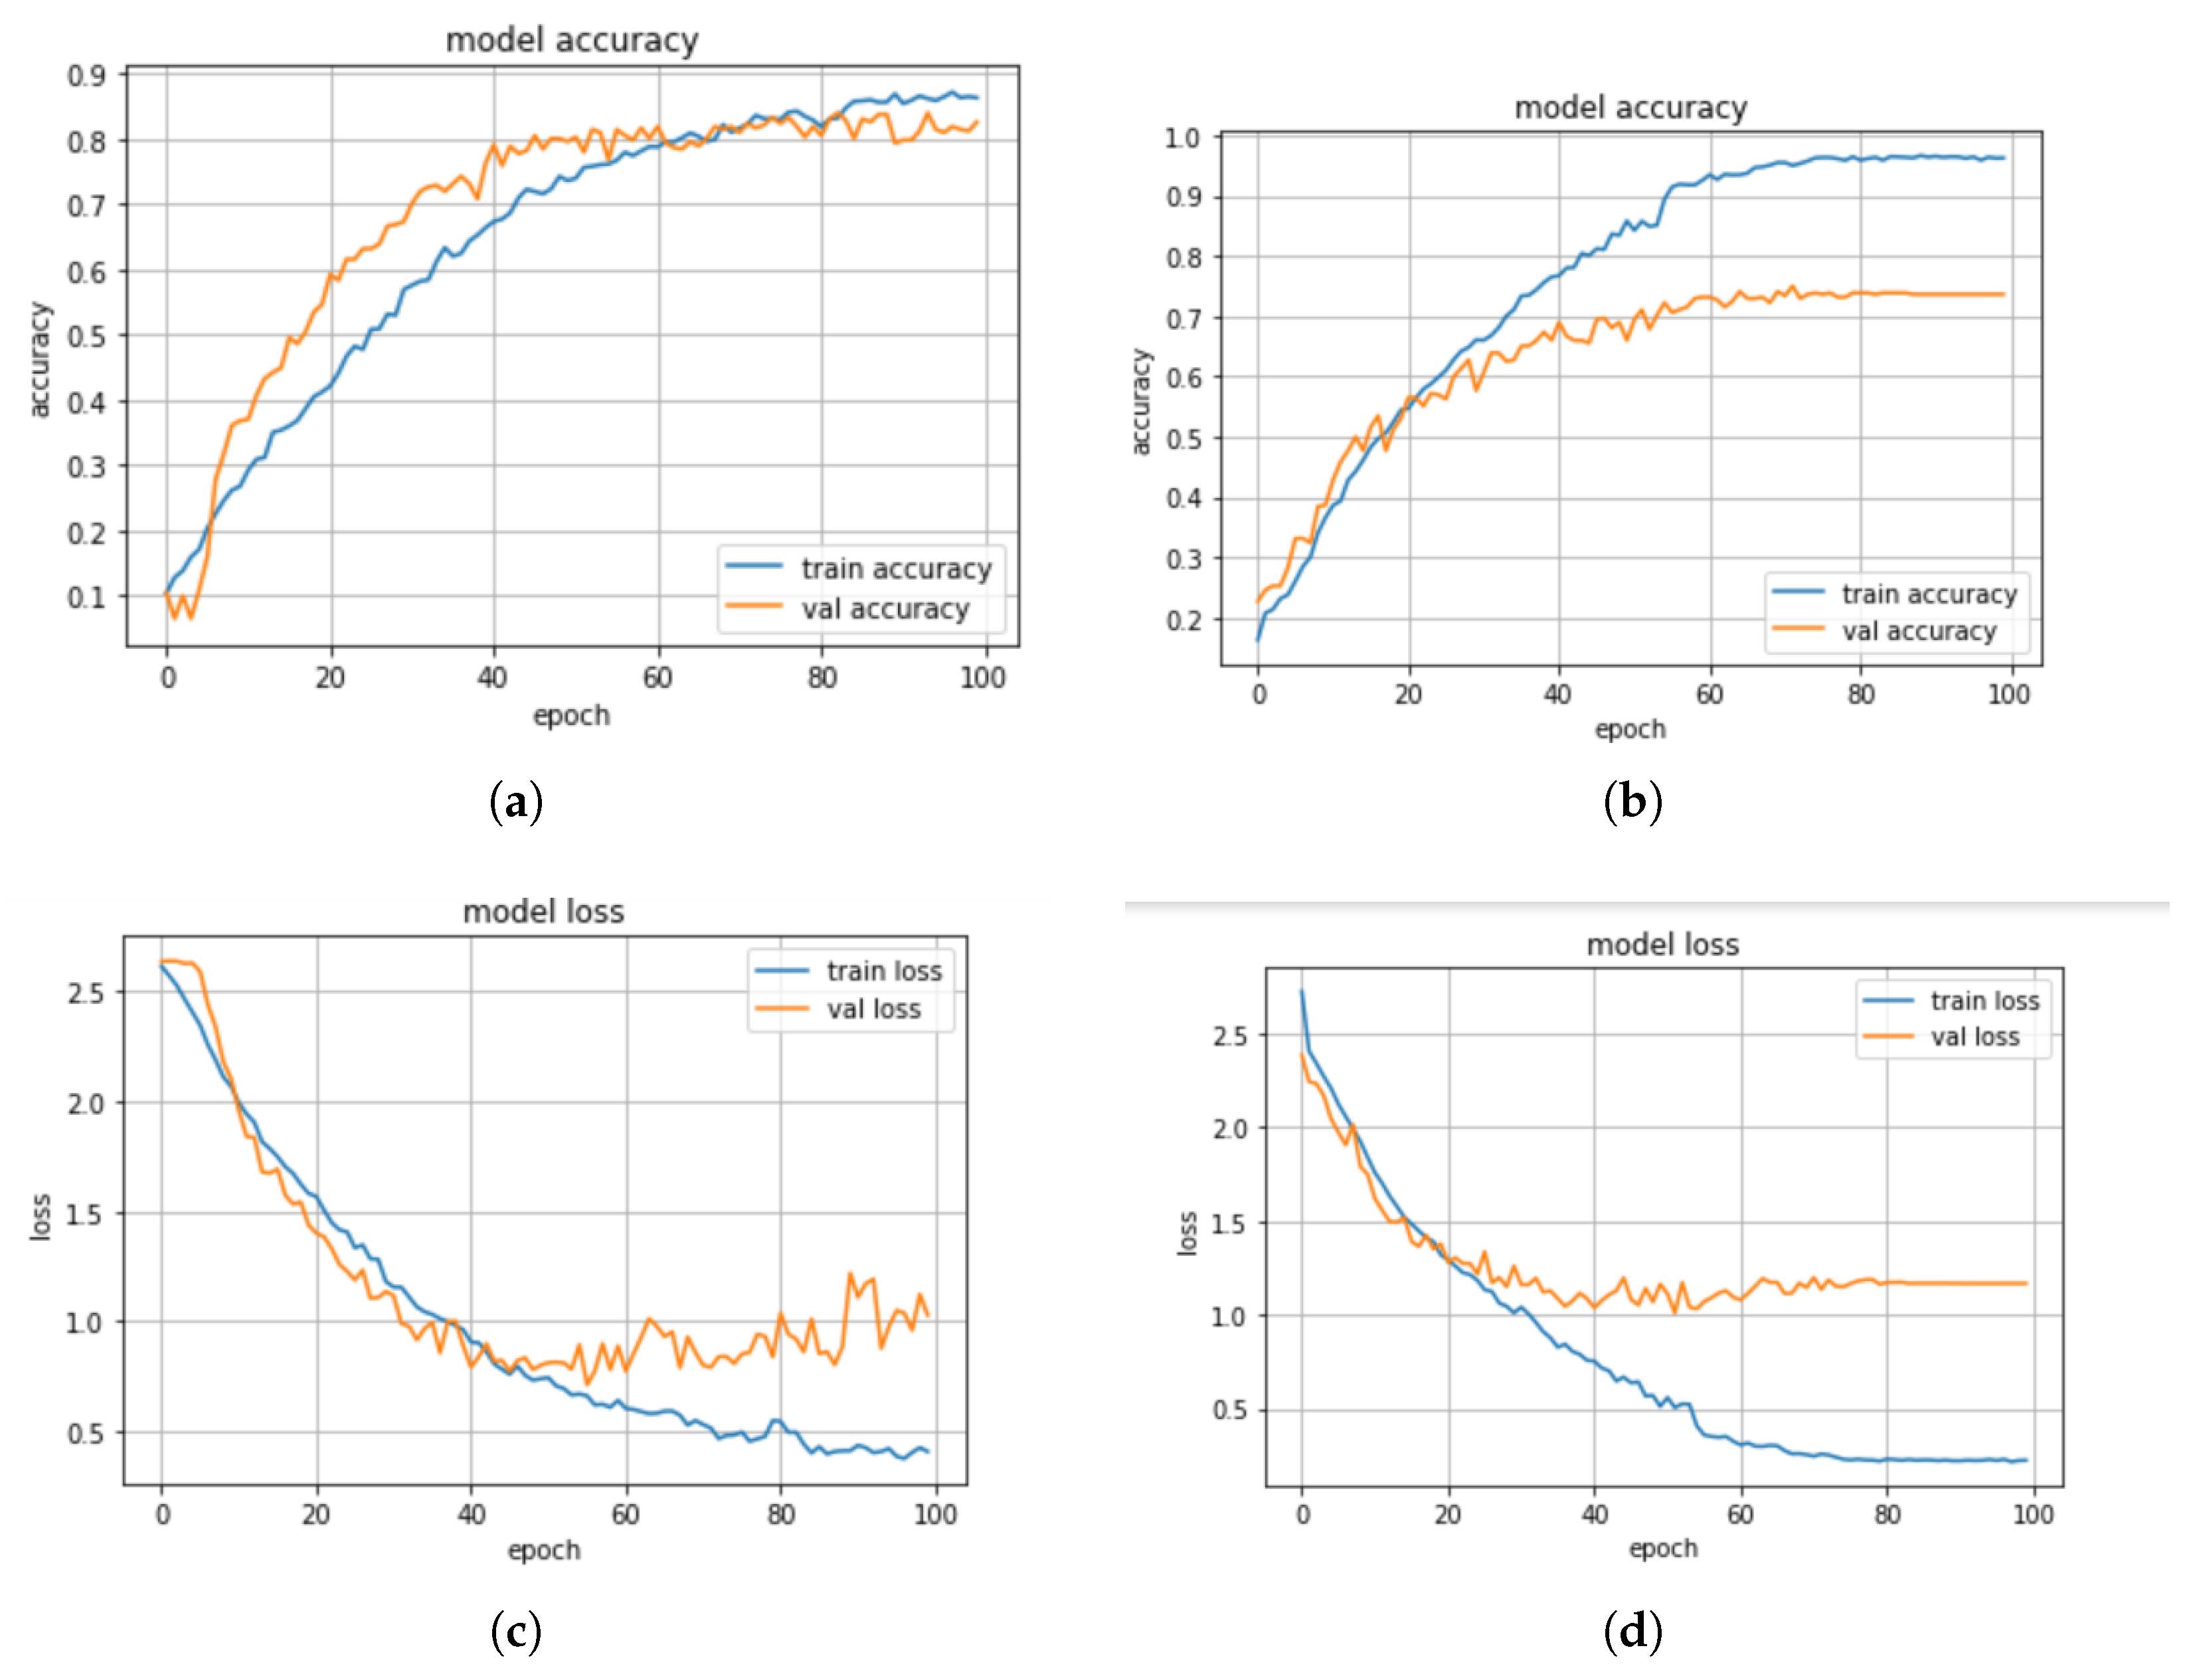
Table 2. In this experiment, the proposed regularized CNN model achieved an accuracy score of about 98%, a precision score of 95%, a recall score of 93%, and an F1 score of 92%. Whereas, the proposed CNN-BiLSTM model achieved an accuracy score of 85%, a precision score of 82%, a recall score of 80%, and a F1 score of 81%. The baseline model [
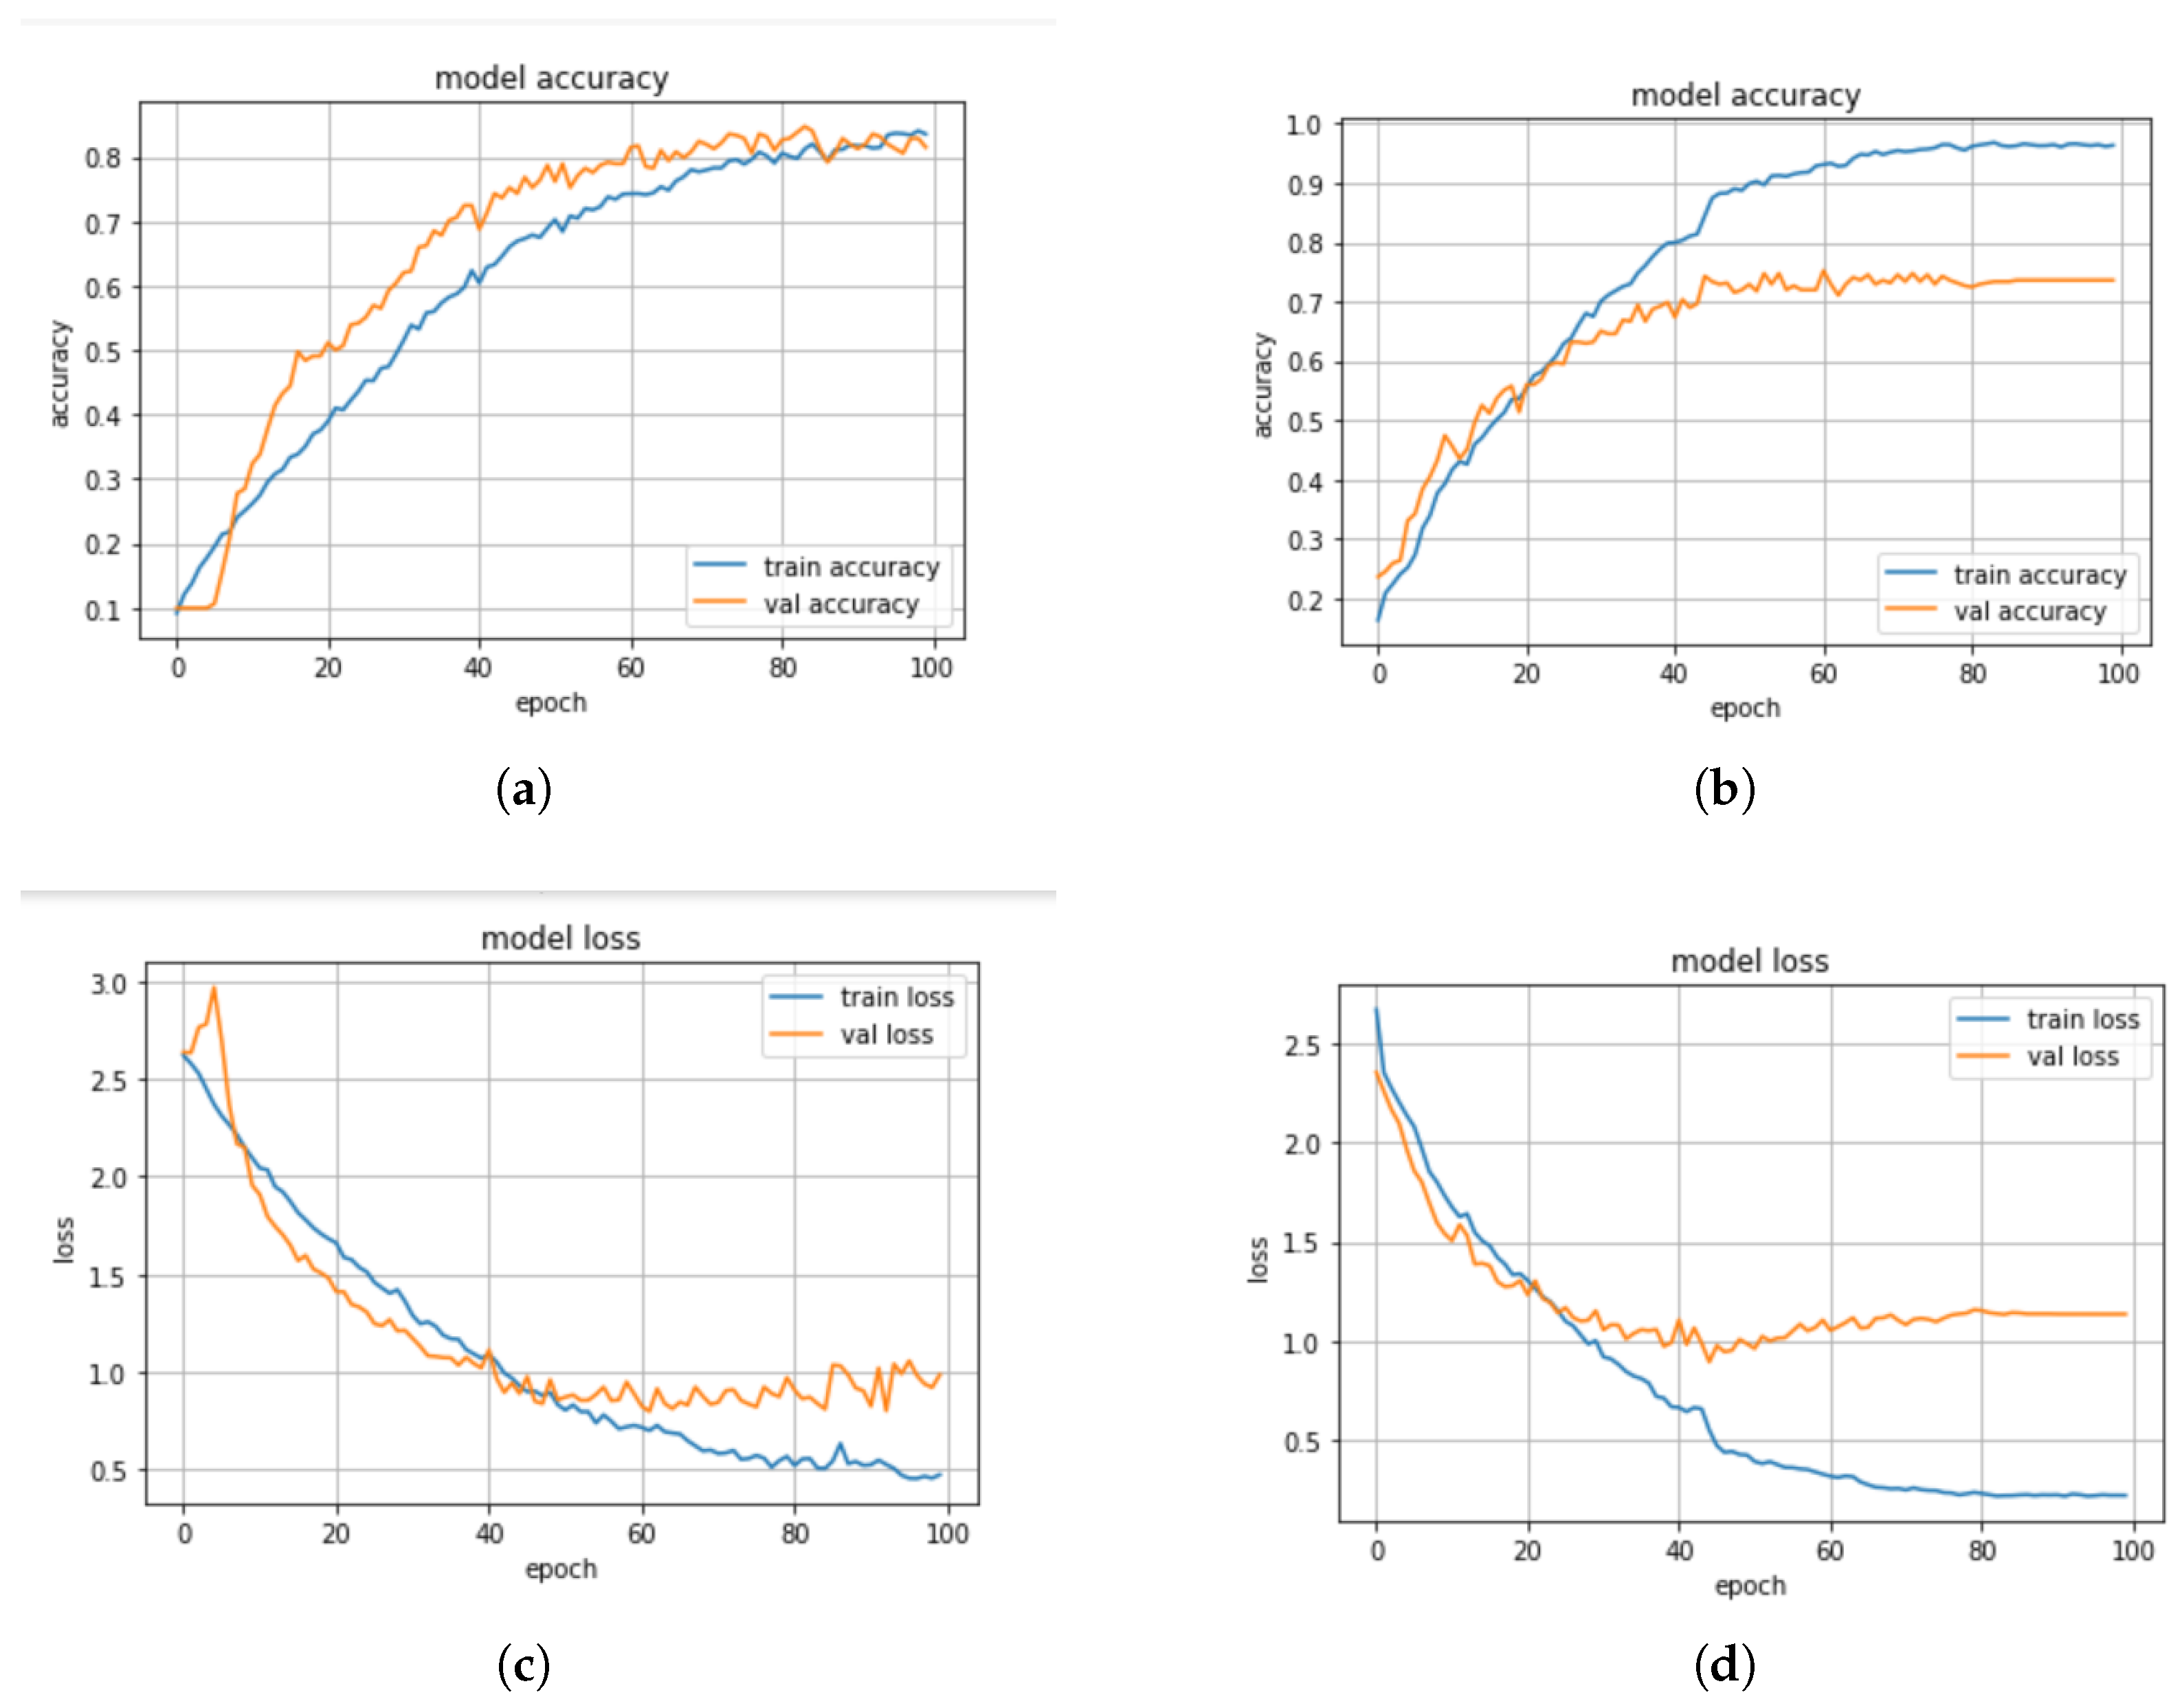
36] achieved an accuracy score of 95%, a precision score of 92%, a recall score of 92%, and a F1 score of 90%. The accuracy and the loss plots of the models are shown in
Figure 7a,b. We also compared the three models based on the difference between their actual values and their predicted values. For the proposed models, i.e., regularized CNN and CNN-BiLSTM, the difference between the actual value and the predicted value are about 10.5% and 22%, respectively. The difference between the actual value and the predicted value for the baseline model is about 10.5%. As a consequence, the regularized CNN outperformed both the CNN-BiLSTM and the existing model with a significant improvement of about 13.2% and 3%, respectively. This significant improvement could be attributed to the regularized techniques, i.e., L1, L2, and dropout, we employed. This is due to the fact that the regularized techniques were able to minimize computational complexity, minimize generalization error, and enhance the performance accuracy of the model.
5.3. Impact of Standard Scaler on the Performance of the Models
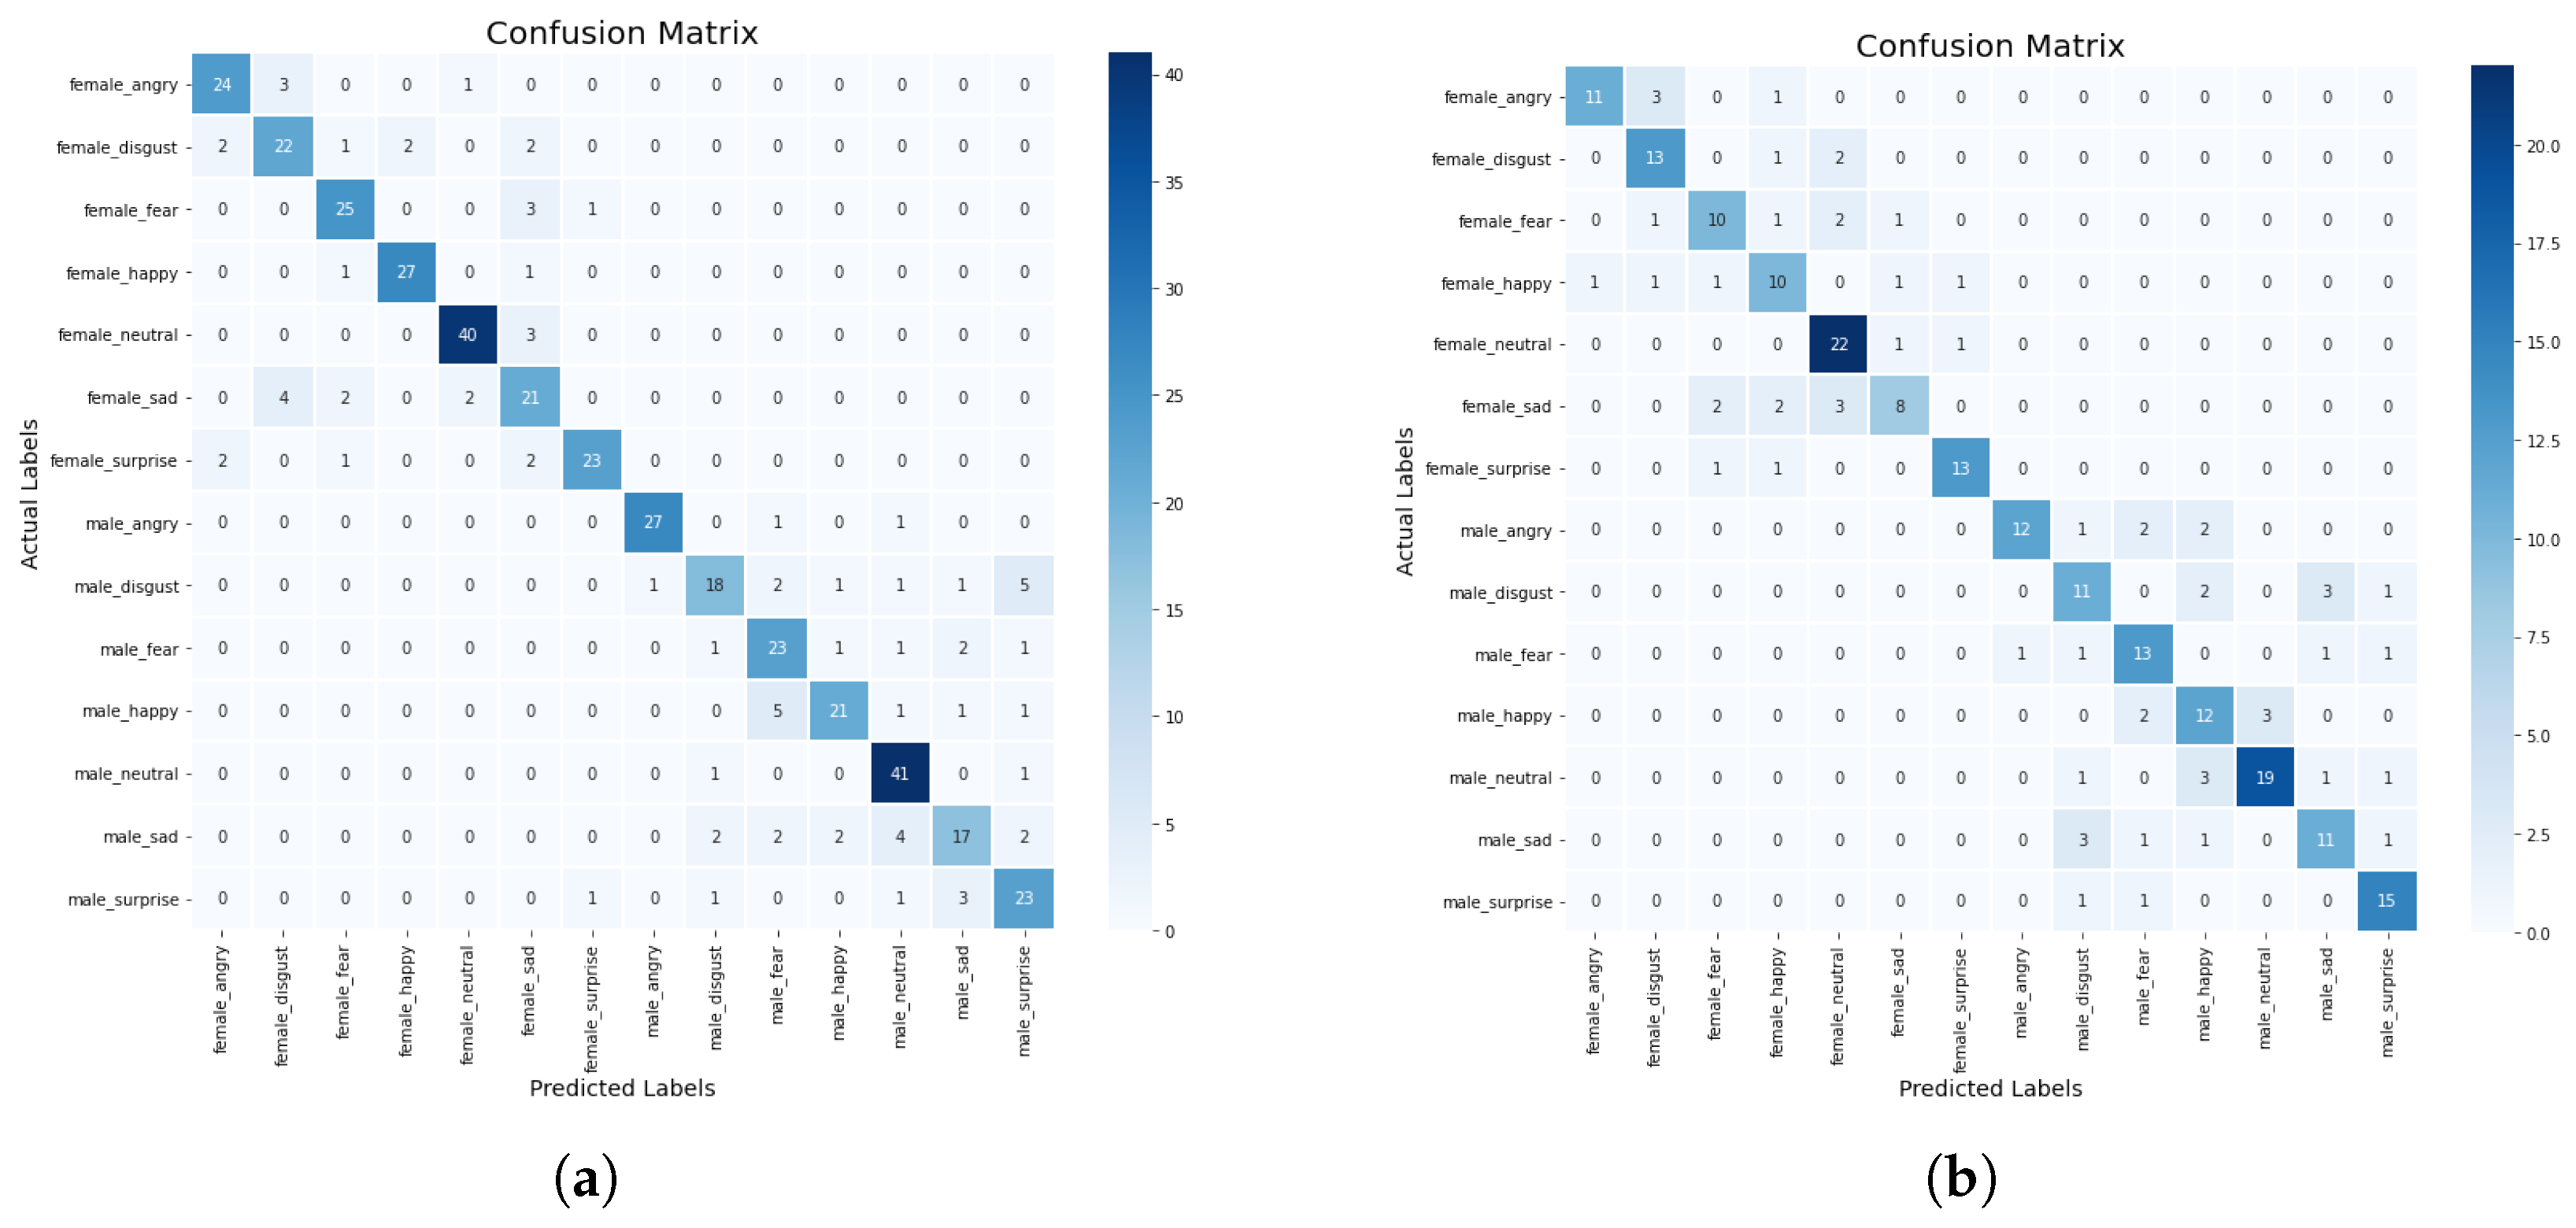
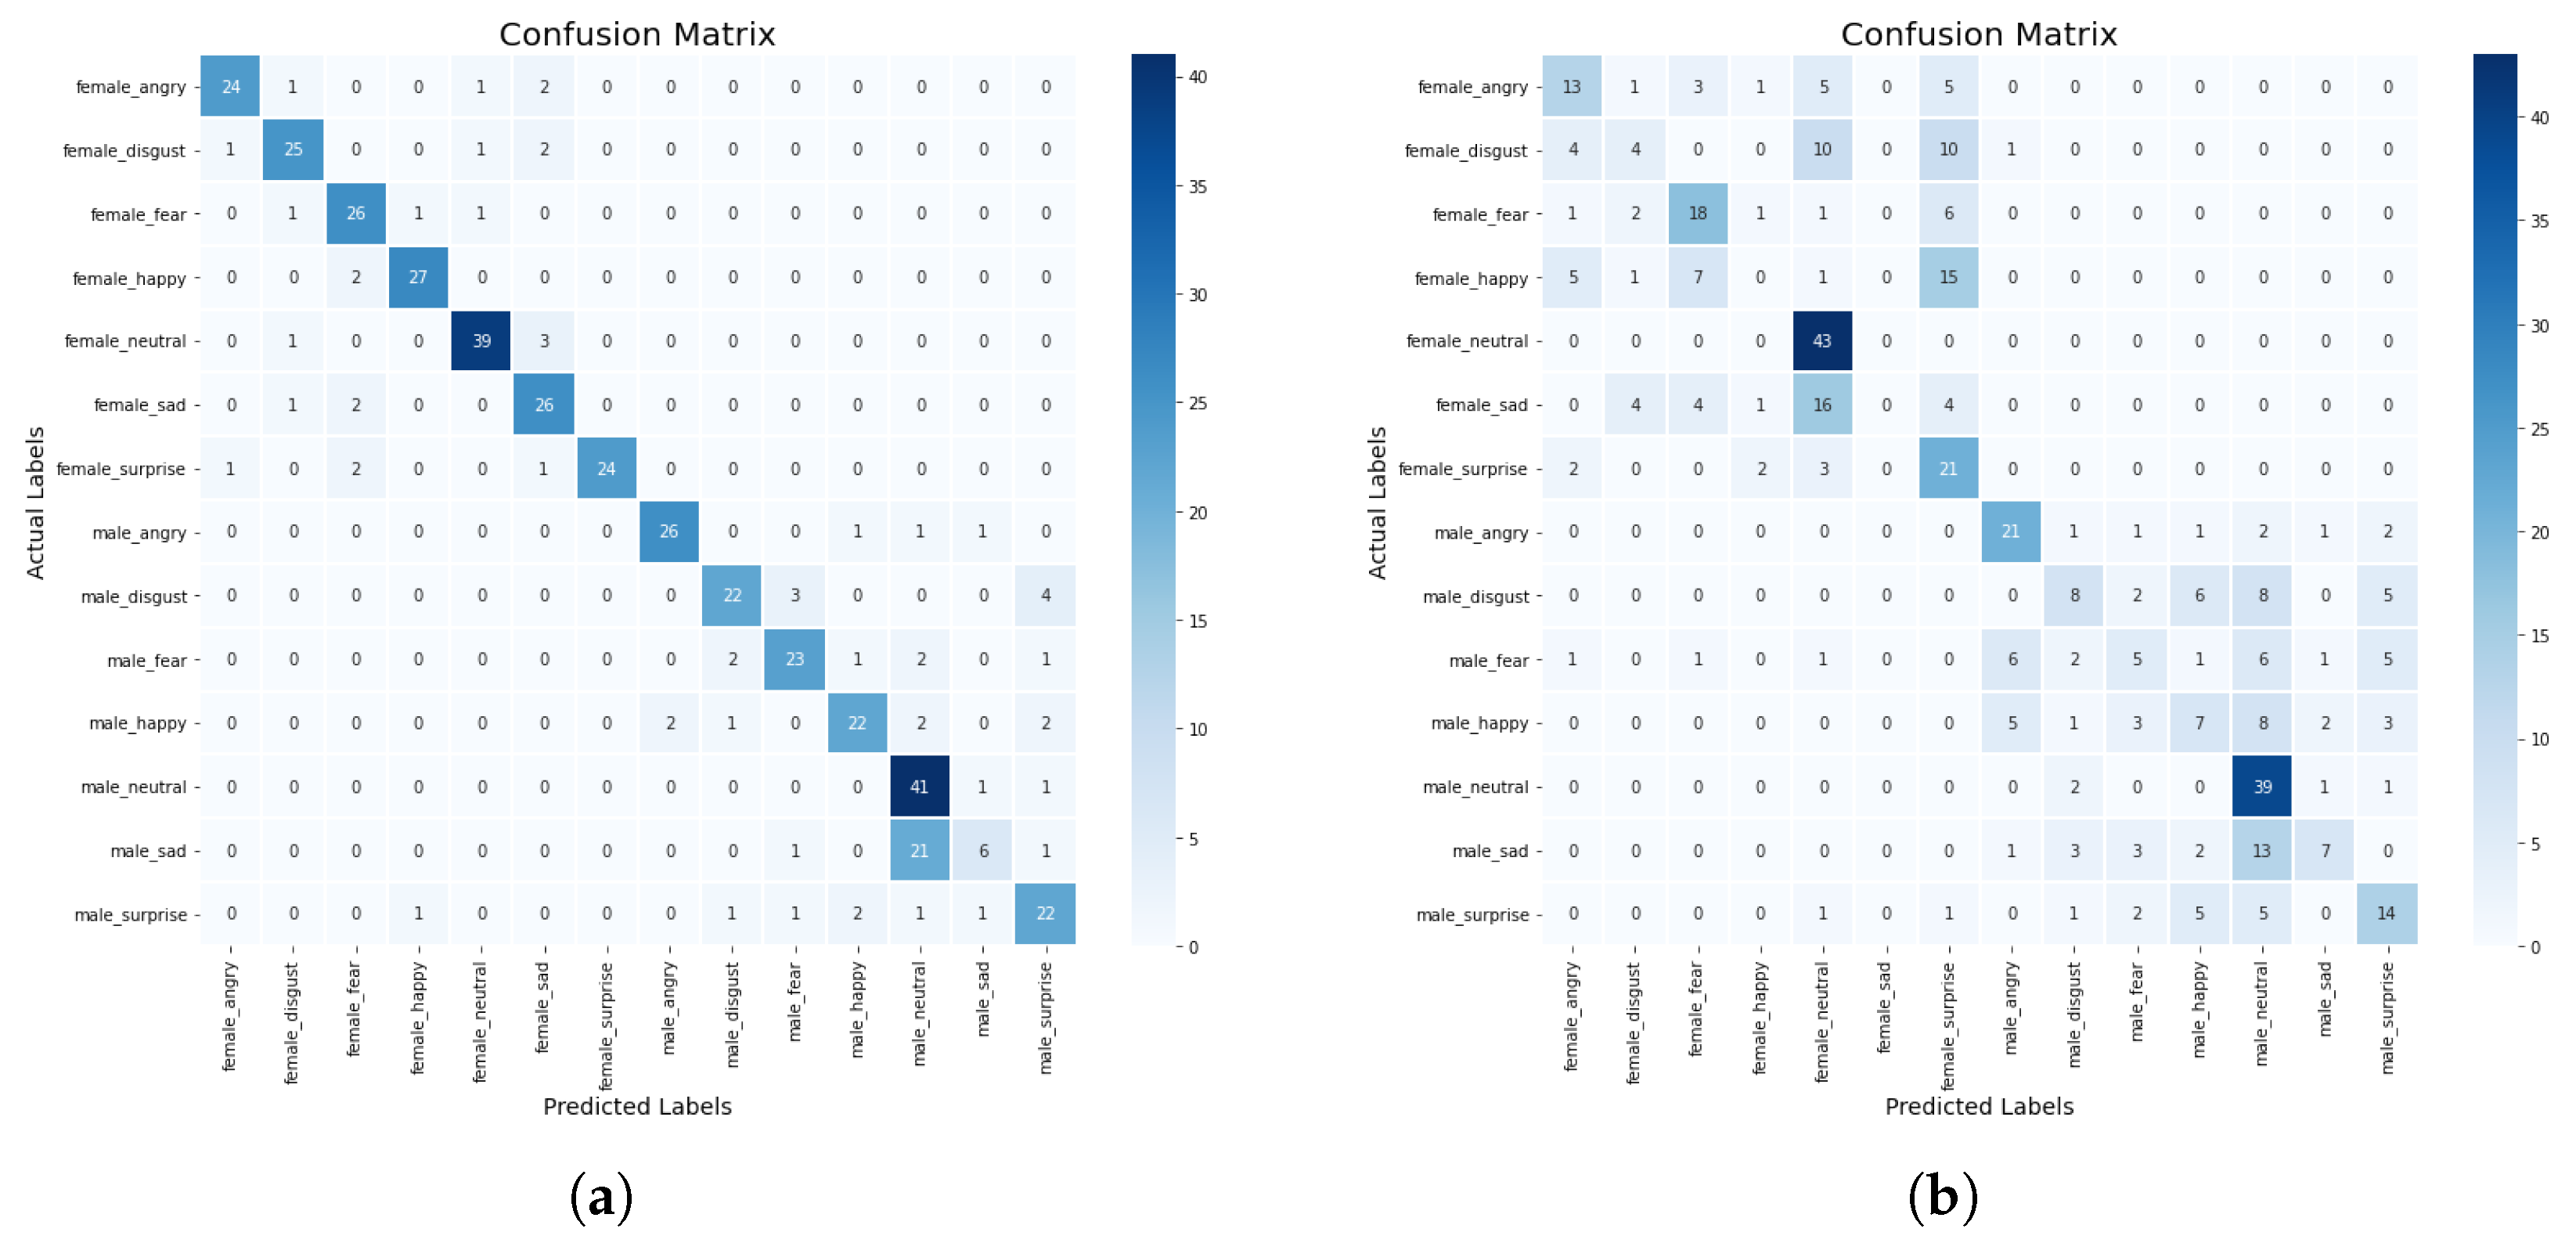
In this section, we discuss some experiments conducted to compare the performance of the machine learning and deep learning models based on the standard scaler method. The confusion matrix of the CNN-BiLSTM and the regularized CNN models, which are the best models, are presented in
Figure 8a,b, respectively, while their accuracy and loss plots are shown in
Figure 9a–d, respectively.
From the results presented in
Table 3, it can be observed that the KNN model achieved an accuracy score of 52%, a precision score of 91%, a recall score of 52%, and an F1-score of 64%, while the DT model obtained an accuracy score of 45%, a precision score of 42%, a recall score of 41%, and an F1-score of 41%. The CNN-BiLSTM model achieved an accuracy score of 85%, a precision score of 82%, a recall score of 80%, and an F1-score of 81%. In this experiment, the regularized CNN model performed better than the other models as it achieved an accuracy score of 98%, a precision score of 95%, a recall score of 93%, and an F1-score of 92%.
In addition, we compared the actual value and the predicted value of the CNN-BiLSTM and the regularized CNN models to investigate their performance. For the CNN-BiLSTM model, the difference between the actual value and the predicted value is about 22% while for the regularized CNN model, it is about 10.5%. Thus, it was observed that the two models performed well when the standard scaler method was applied. However, the regularized CNN performed better with a significant improvement of about 13.3%. The significant performance could be attributed to the optimization strategies that were employed to optimize the network parameters in order to find the optimum parameter. Moreover, different regularization techniques such as dropout, L1, and L2 are employed and this helped to reduce the computational complexity of the model in terms of computational time, power, and space.
5.4. Impact of Min–Max Scaler on the Performance of the Models
When the min–max scaler method was applied on the models, we observed from the results in
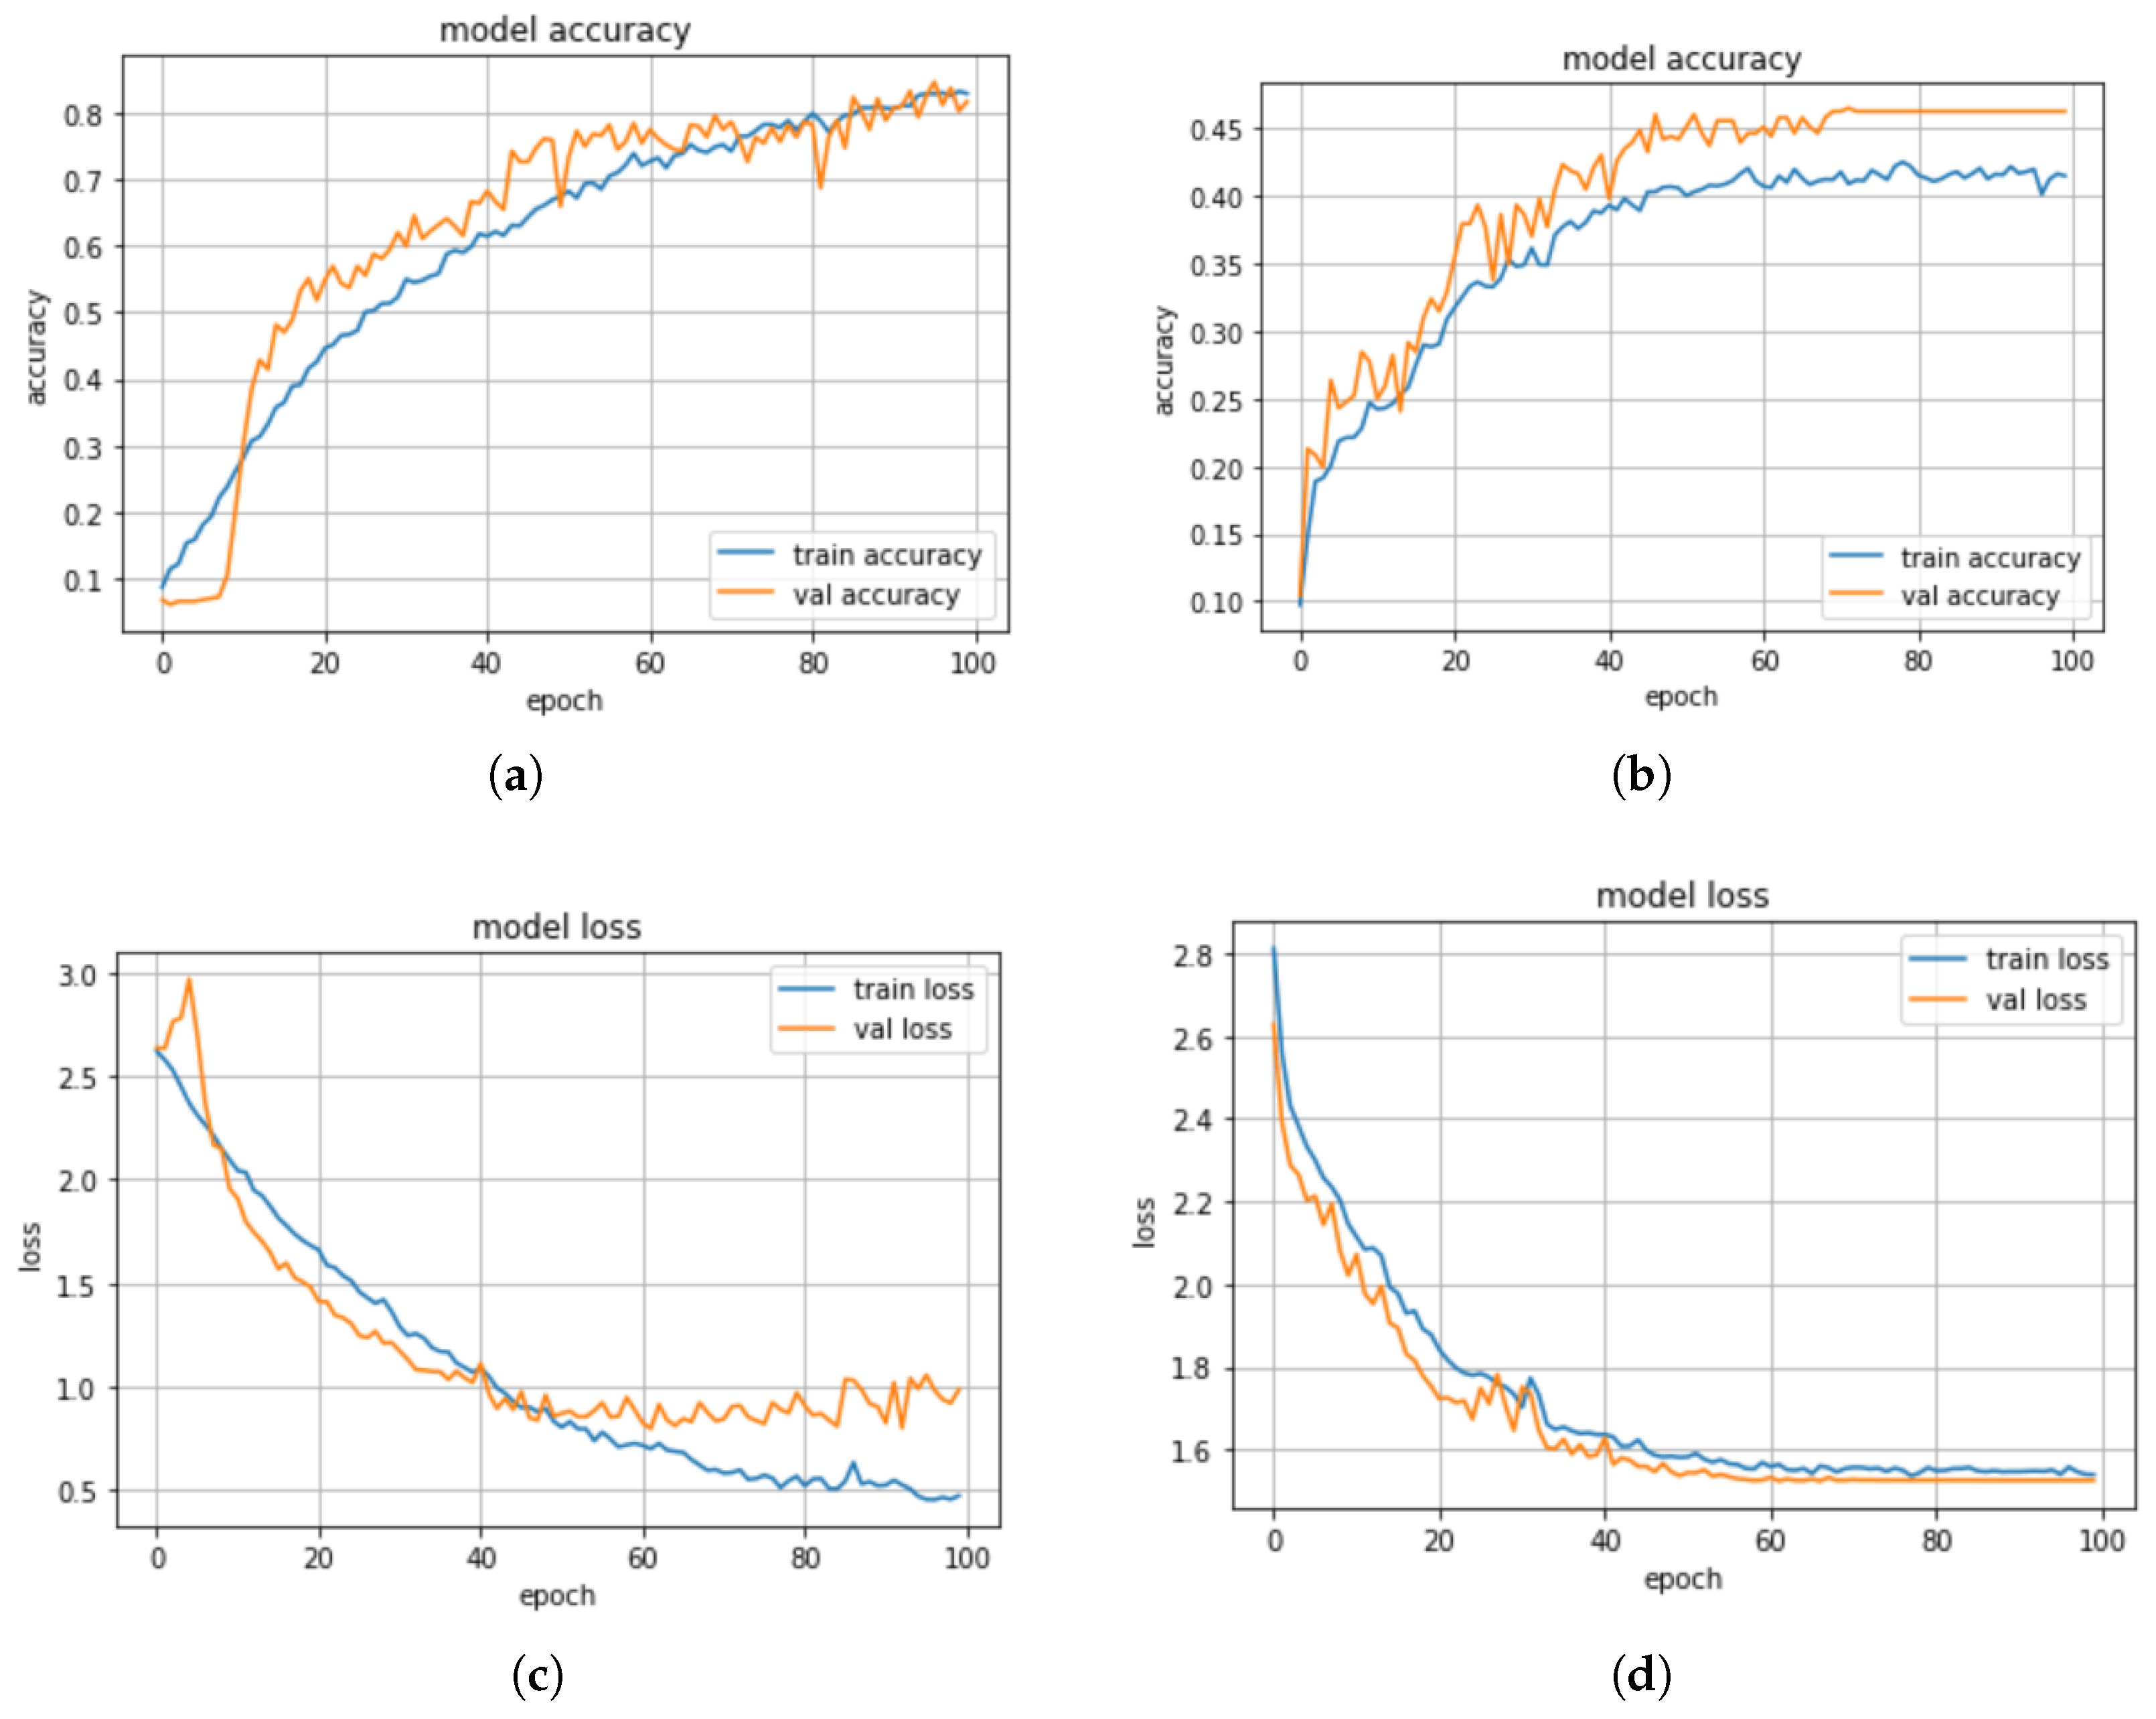
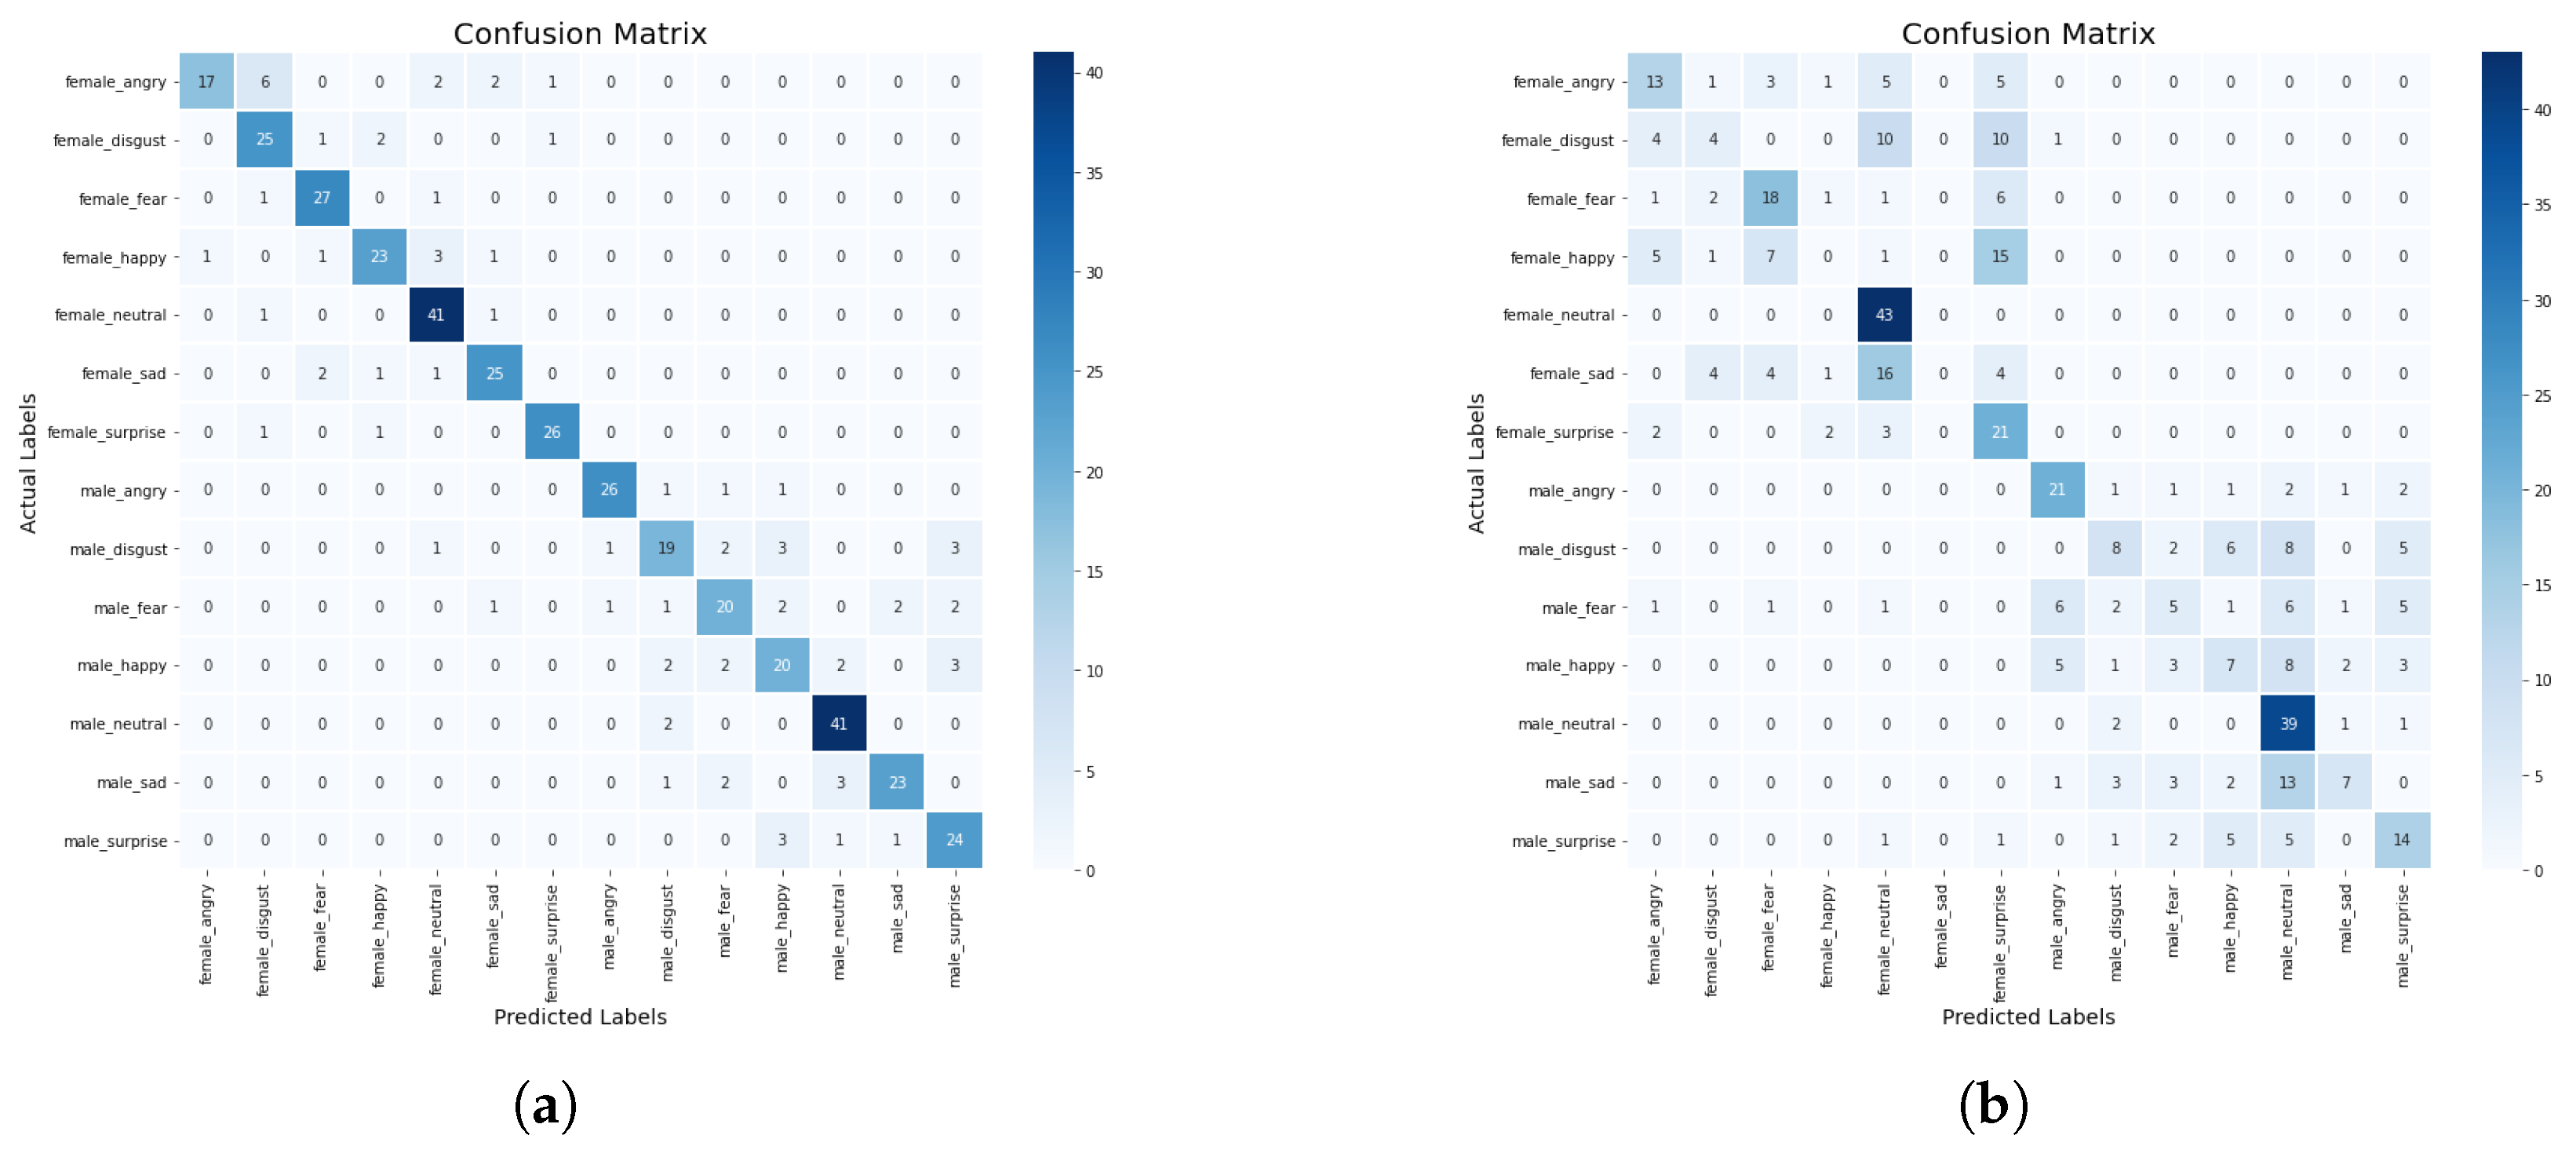
Table 4 that the KNN model has a higher precision score of 93% compared with DT with a precision score of 40%. Whereas, the CNN-BiLSTM achieved a 80% precision score, and the regularized CNN has a precision score of 40%. The CNN-BiLSTM outperformed the other models with an accuracy of 83%, a recall of 81%, and an F1-score of 80%. The regularized CNN model achieved an accuracy score of 47%, a recall score of 68%, an F1-score of 68%, while the KNN model achieved an accuracy score of 53%, a recall score of 52%, a F1-score of 65%, the DT model achieved an accuracy score of 44%, a recall score of 42%, an F1-score of 41%. The CNN-BiLSTM model performed better than the machine learning models and the regularized CNN model. The confusion matrix of the CNN-BiLSTM and the regularized CNN models are presented in
Figure 10a,b. The accuracy and loss plots for the CNN-BiLSTM and regularized CNN models are shown in
Figure 11a–d, respectively.
Additionally, the actual and the predicted values of the CNN-BiLSTM and regularized CNN models were compared. We observed that the difference between the actual and predicted values for the CNN-BiLSTM model is about 10.5%, while the difference between the actual and predicted values for the regularized CNN model is about 50%. In this experiment, the CNN-BiLSTM has the highest performance in terms of accuracy, precision, recall, and F1 score. The CNN-BiLSTM has a significant improvement of about 43% over the regularized CNN. The significant improvement is a result of the different optimization strategies that were employed to optimize the network parameters to find an optimum parameter.
5.5. Impact of Robust Scaler on the Performance of the Models
Just like the standard scaler, the regularized CNN outperformed all the other models when the robust scaler method was applied. The regularized CNN model has an accuracy of 95%, a precision score of 92%, a recall score of 92%, and an F1 score of 91%. It was followed by the CNN-BiLSTM which achieved an accuracy score of 86%, precision score of 83%, a recall score of 82%, and an F1-score of 74%. The KNN model achieved an accuracy score of 52%, a precision score of 91%, a recall score of 52%, and an F1-score of 66%, whereas the DT model achieved an accuracy score of 45%, a precision score of 43%, a recall score of 43%, and an F1-score of 43%. The results are presented below in
Table 5.
The confusion matrix of the CNN-BiLSTM model and the regularized CNN model are presented in
Figure 12a,b. Additionally, the accuracy and loss plots for the CNN-BiLSTM and the regularized CNN models are presented in
Figure 13a–d, respectively. Furthermore, we compared the CNN-BiLSTM and the regularized CNN in terms of the difference between their actual values and their predicted values. For the CNN-BiLSTM model, the difference between the actual value and the predicted value is about 22%, while the regularized CNN model is about 10.5%. In this experiment, the two proposed models performed well. As a consequence, the performance improvement of the two models could be attributed to the optimization strategies that was employed to optimize the network parameters to find an optimum parameter. Moreover, to reduce the computational complexity in terms of computational time and space, we used techniques such as dropout, L1, and L2.
5.6. Performance Comparison of the Normalization Methods Based on the Proposed Deep Learning Models
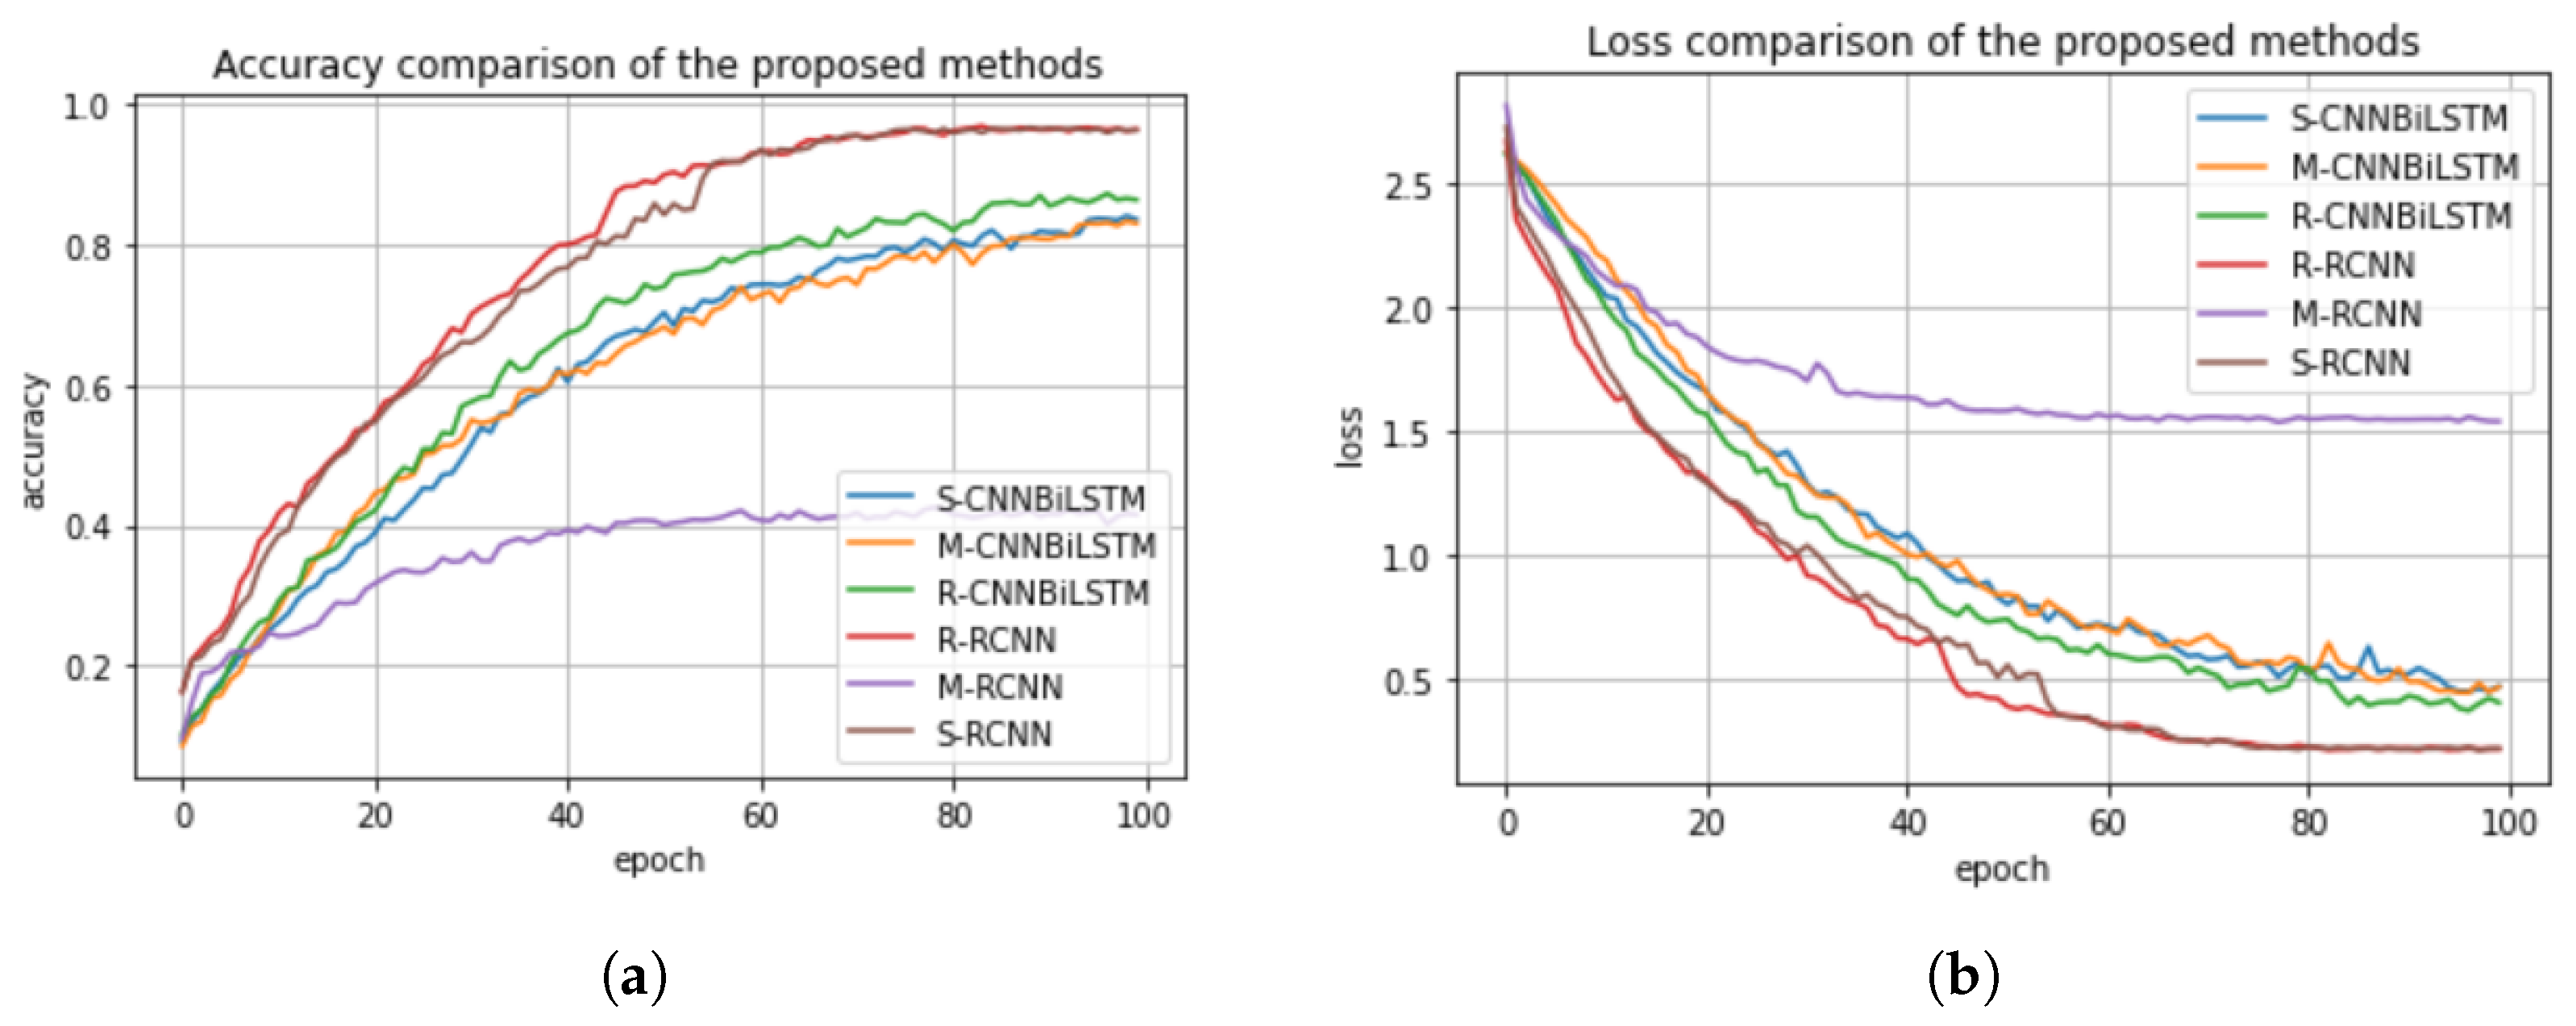
In this section, we compare the normalization methods considered in this work, (i.e., standard scaler, min–max scaler, and the robust scaler) based on the classification performance of the proposed deep learning models. We present their accuracy and loss plots in
Figure 14a,b. In
Figure 14a,b, the standard, min–max, and robust scalers for the CNN-BiLSTM and the regularized CNN models are denoted as S-CNNBiLSTM, M-CNNBiLSTM, R-CNNBiLSTM and R-RCNN, M-RCNN, and S-RCNN, respectively. We can infer from the figures that the standard scaler and robust scaler performed well in the regularized CNN and in the CNN-BiLSTM, which achieved accuracy scores of 98% and 95%, respectively. Meanwhile, the min–max method performed poorly in the regularized CNN model which achieved an accuracy score of 47%, but then, it performed better in the CNN-BiLSTM with an accuracy score of 85%. Therefore, we conclude that the standard scaler has a great impact on the classification performance of the deep learning models.
6. Conclusions and Future Work
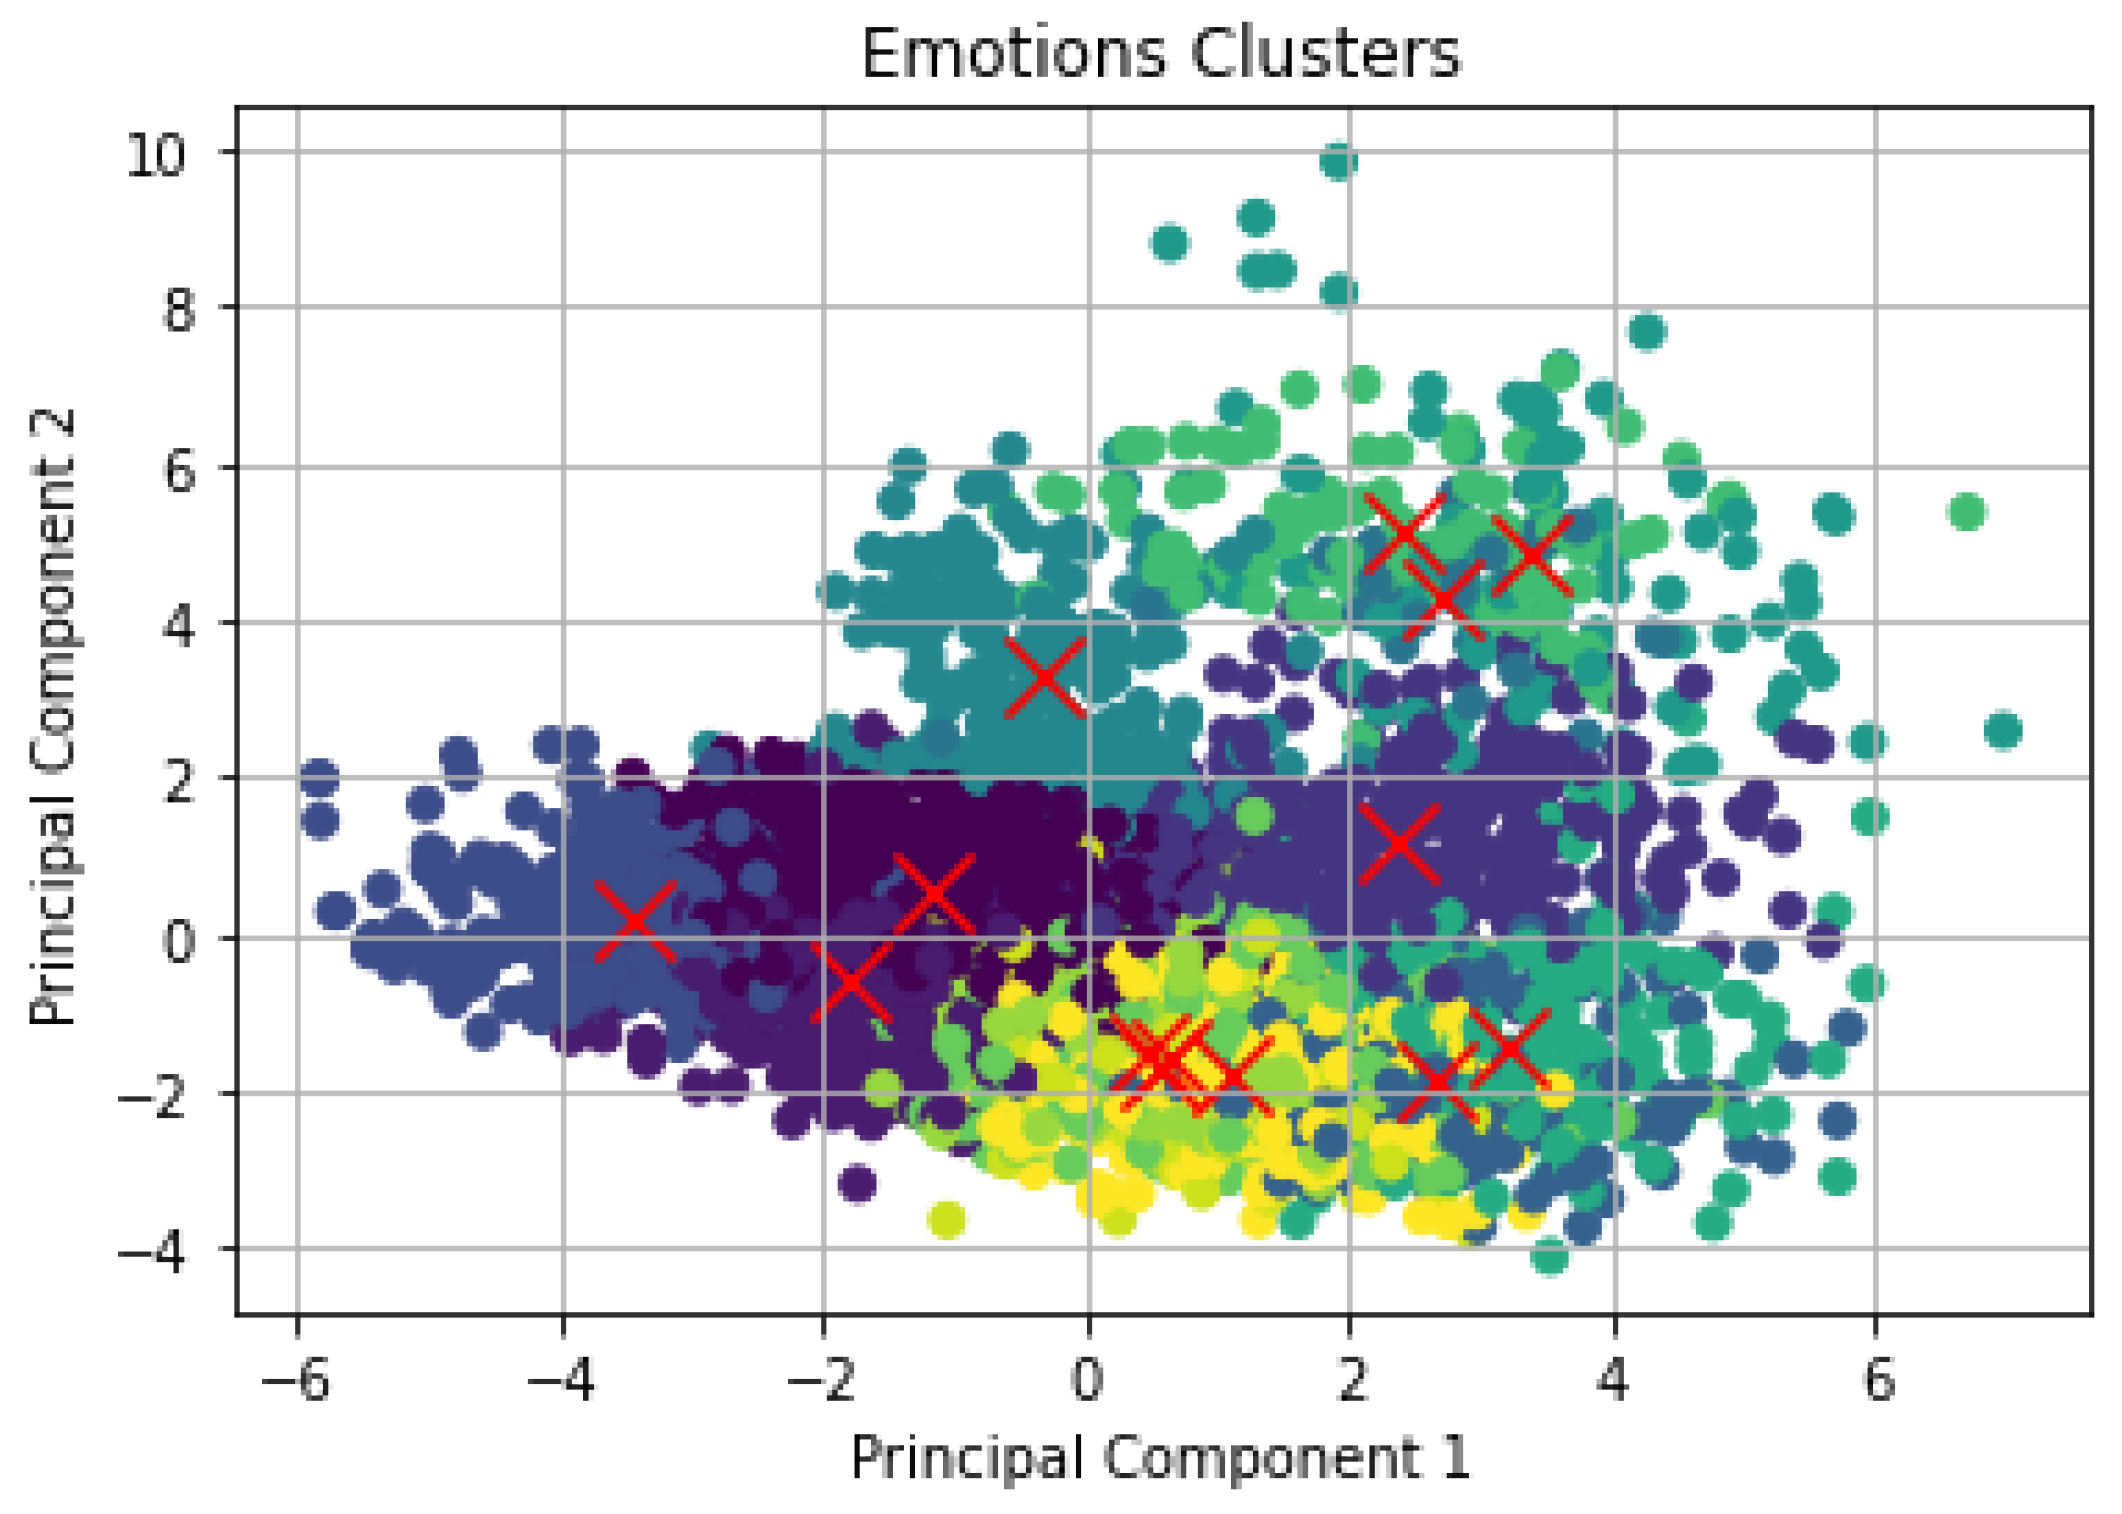
In this research work, we developed different machine and deep learning models to predict speech emotions in an IoT-enabled WBAN system. We described all the stages involved in the training and testing of the developed models, which covers different topics such as the data collection and review, data preparation, i.e., EDA and data processing, model building and evaluation. The dataset was reviewed based on the 5 V’s (i.e., volume, variety, velocity, veracity, value) of big data. For data preparation, we explored the dataset by visualizing it for better understanding and to check whether the dataset is balanced. For the data processing stage, we augmented the dataset, performed feature extraction, feature normalization, and addressed categorical data in the dataset. For the model building stage, we employed both supervised and unsupervised machine learning methods to construct the SER models. For instance, we developed a cluster method such as k-means with PCA, as well as developing different classification methods, such as KNN, DT, regularized CNN, and CNN-BiLSTM. We applied different feature normalisation methods on the developed models to investigate their impact on the classification performance.
For the purpose of evaluation and validation, the best models in our work (i.e., regularized CNN and CNN-BiLSTM) were compared with the most related state-of-the-art work in the literature using different performance metrics such as prediction accuracy, precision, recall, F1 score, confusion matrix, and differences between the actual and predicted values. From the results, it was observed that one of the proposed models (RCNN) outperformed the existing model. Additionally, the three normalization methods were compared in terms of accuracy and it was concluded that the standard scaler has a great impact on improving the accuracy of the models. In conclusion, future work linked to this study will focus on investigating more important speech features using deep learning algorithms.


