Performance Evaluation of MEMS-Based Automotive LiDAR Sensor and Its Simulation Model as per ASTM E3125-17 Standard
Abstract
1. Introduction
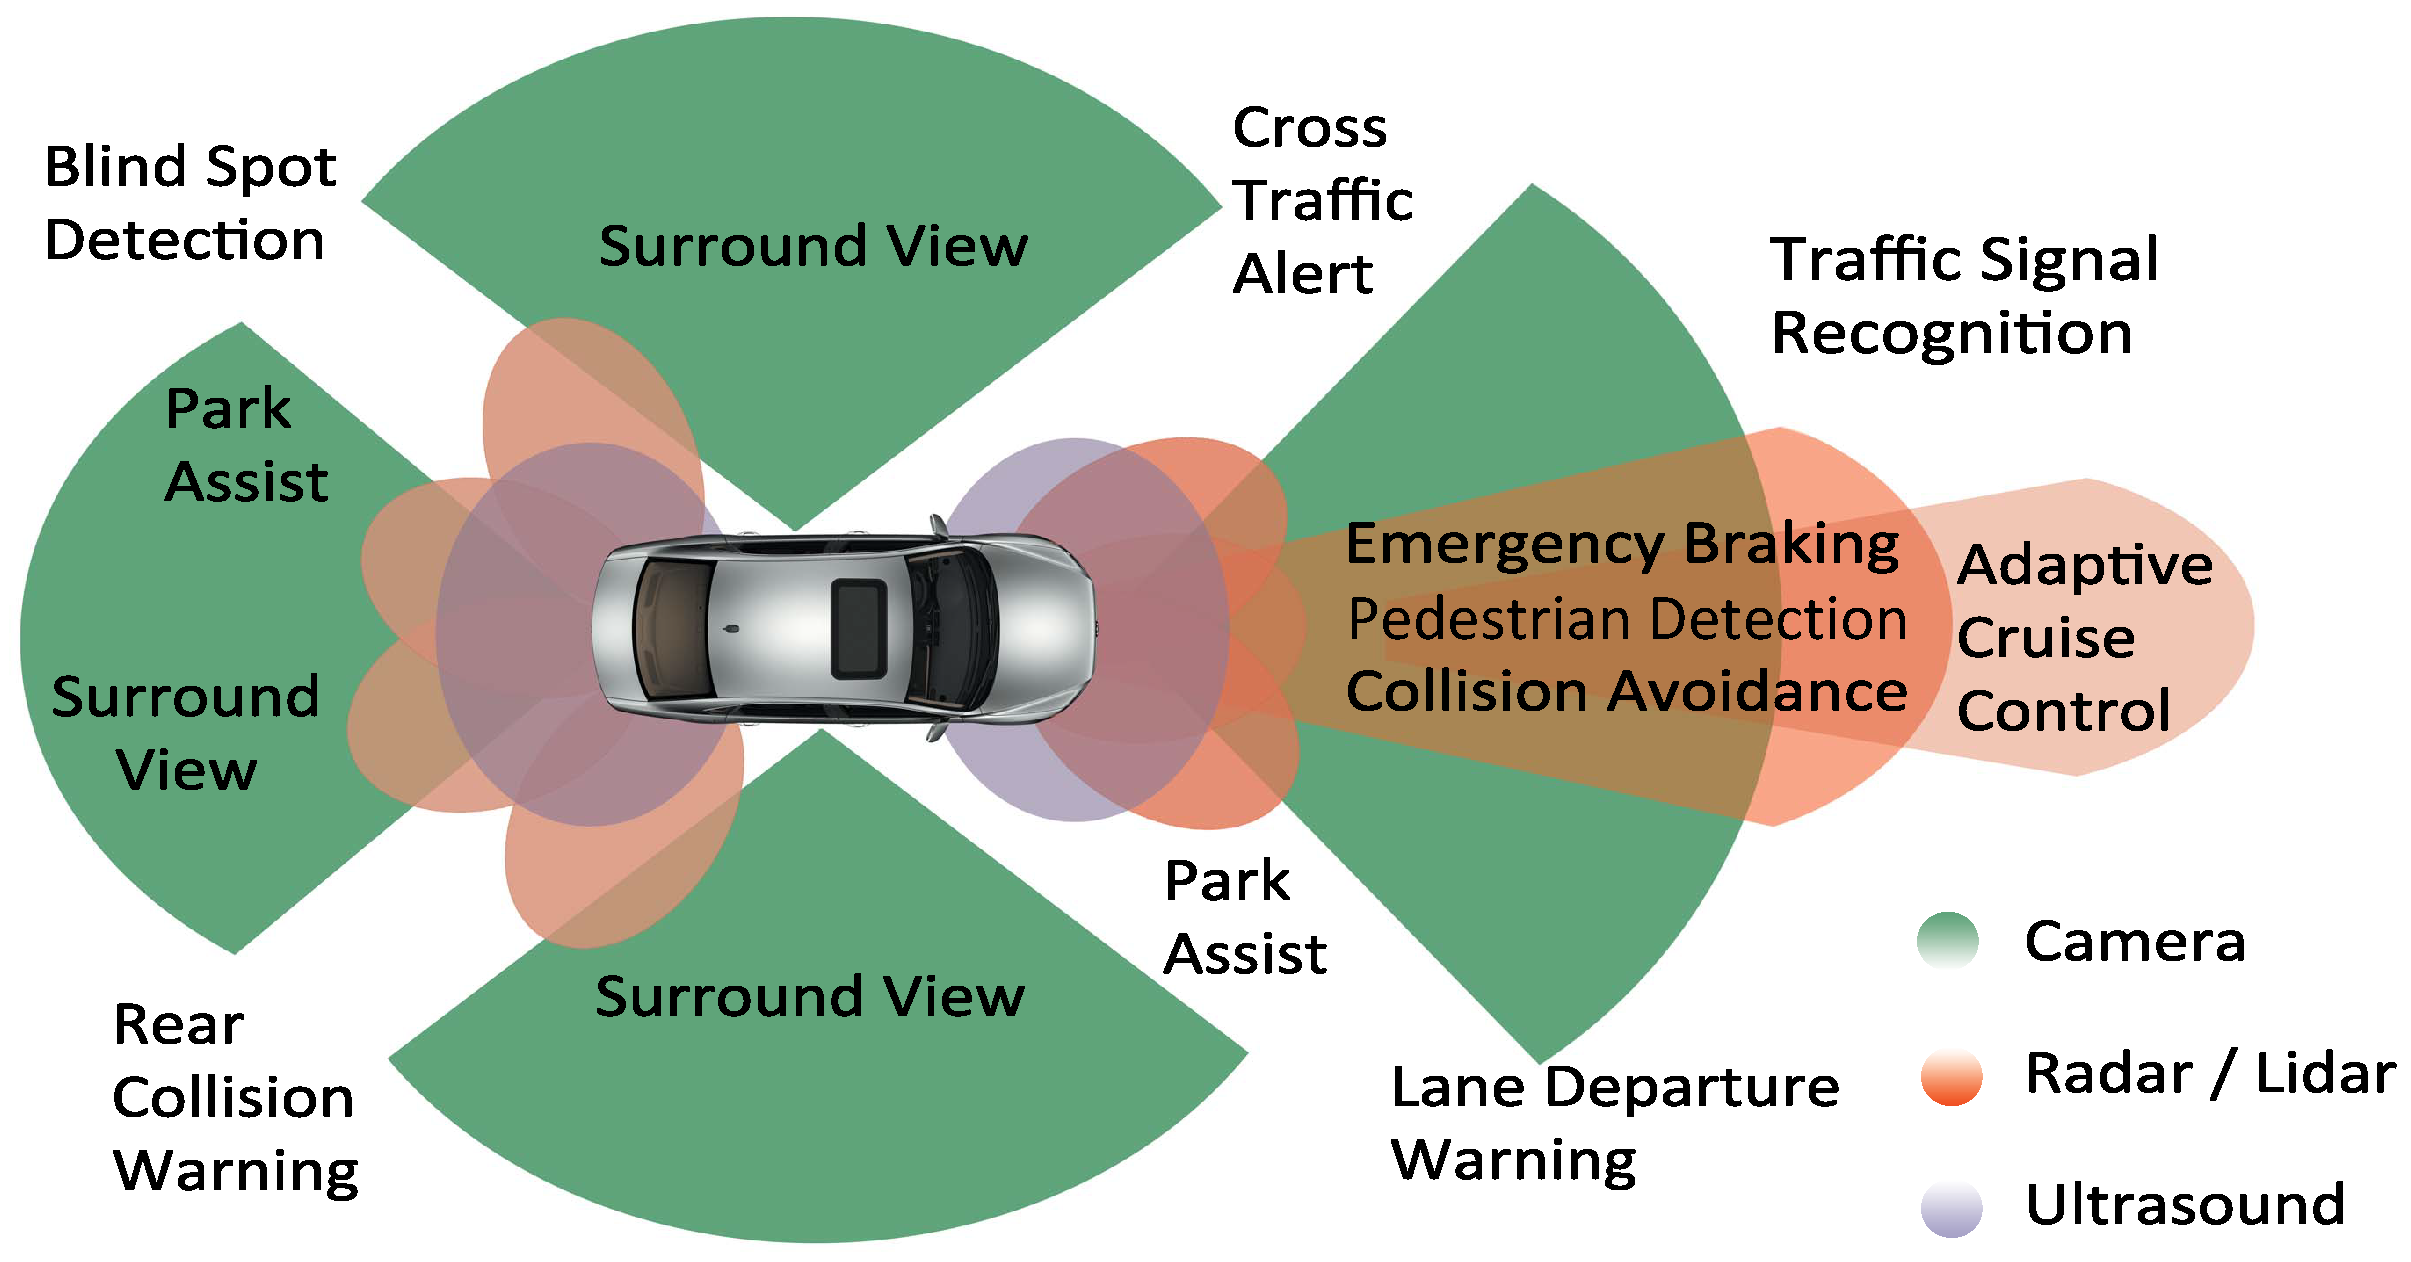
2. Background
Working Principle of MEMS LiDAR Sensor
3. Devices Under Test
LiDAR FMU Model
4. ASTM E3125-17
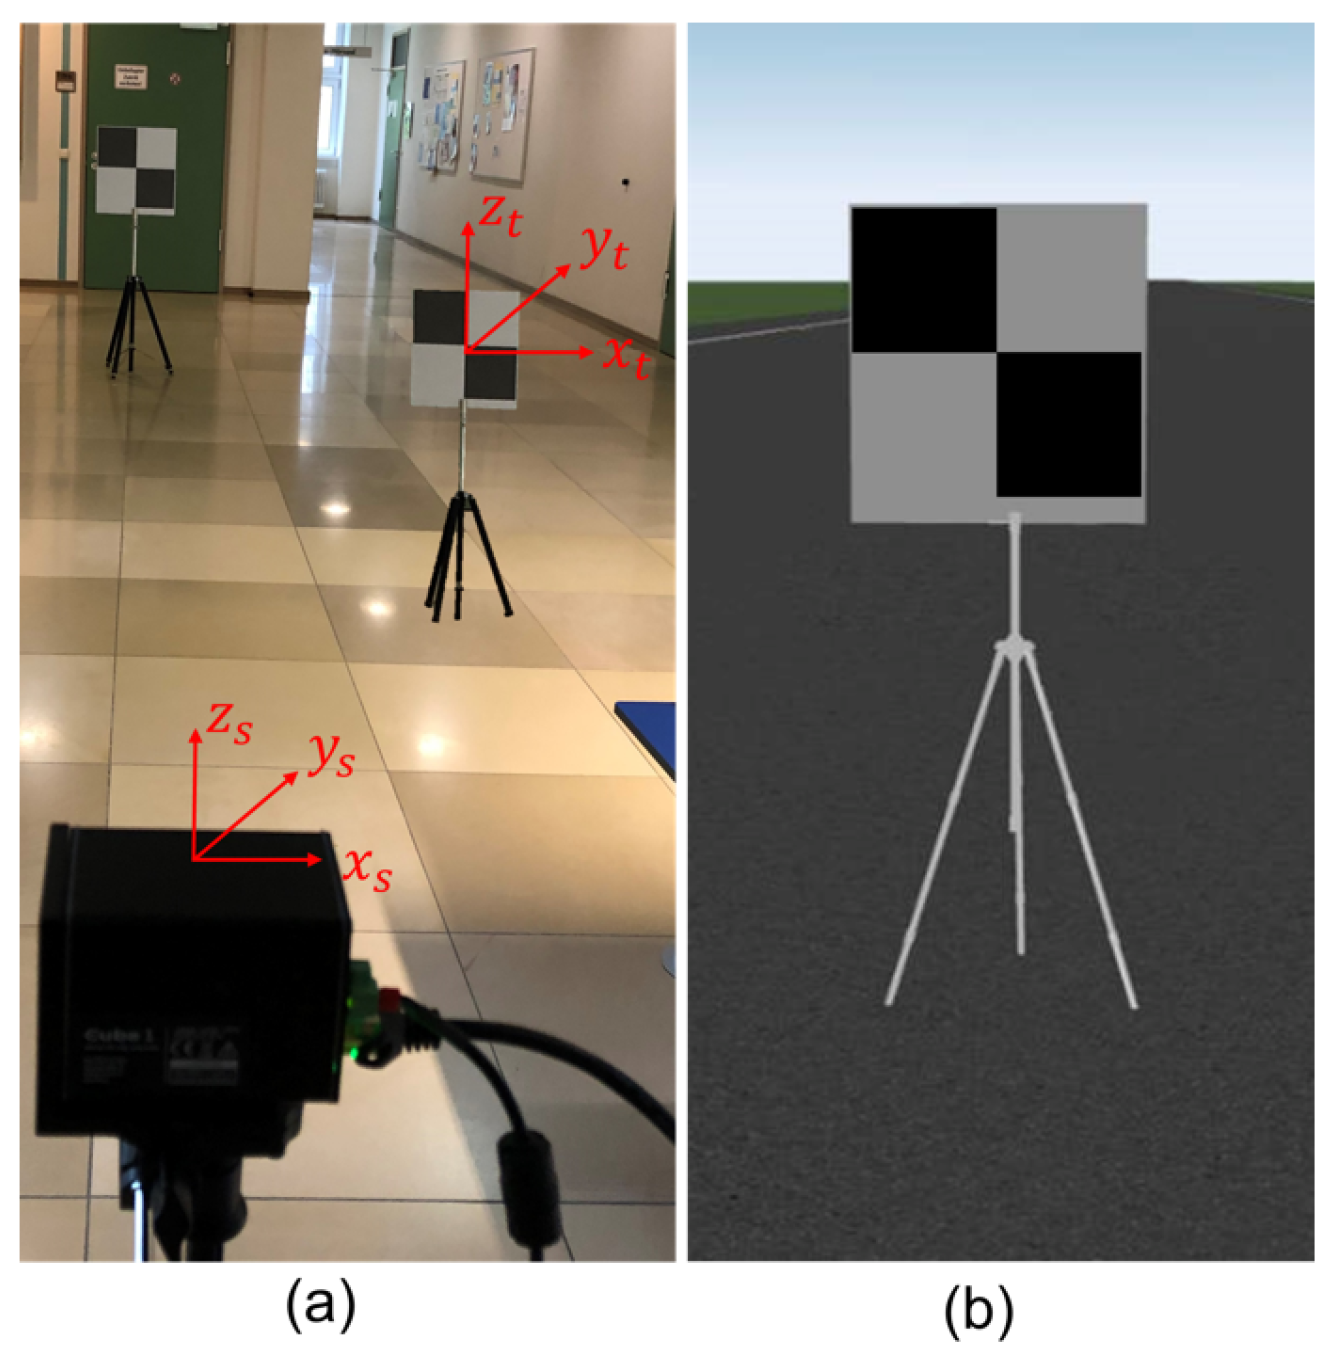
4.1. Specification of Targets
4.2. Inside Test
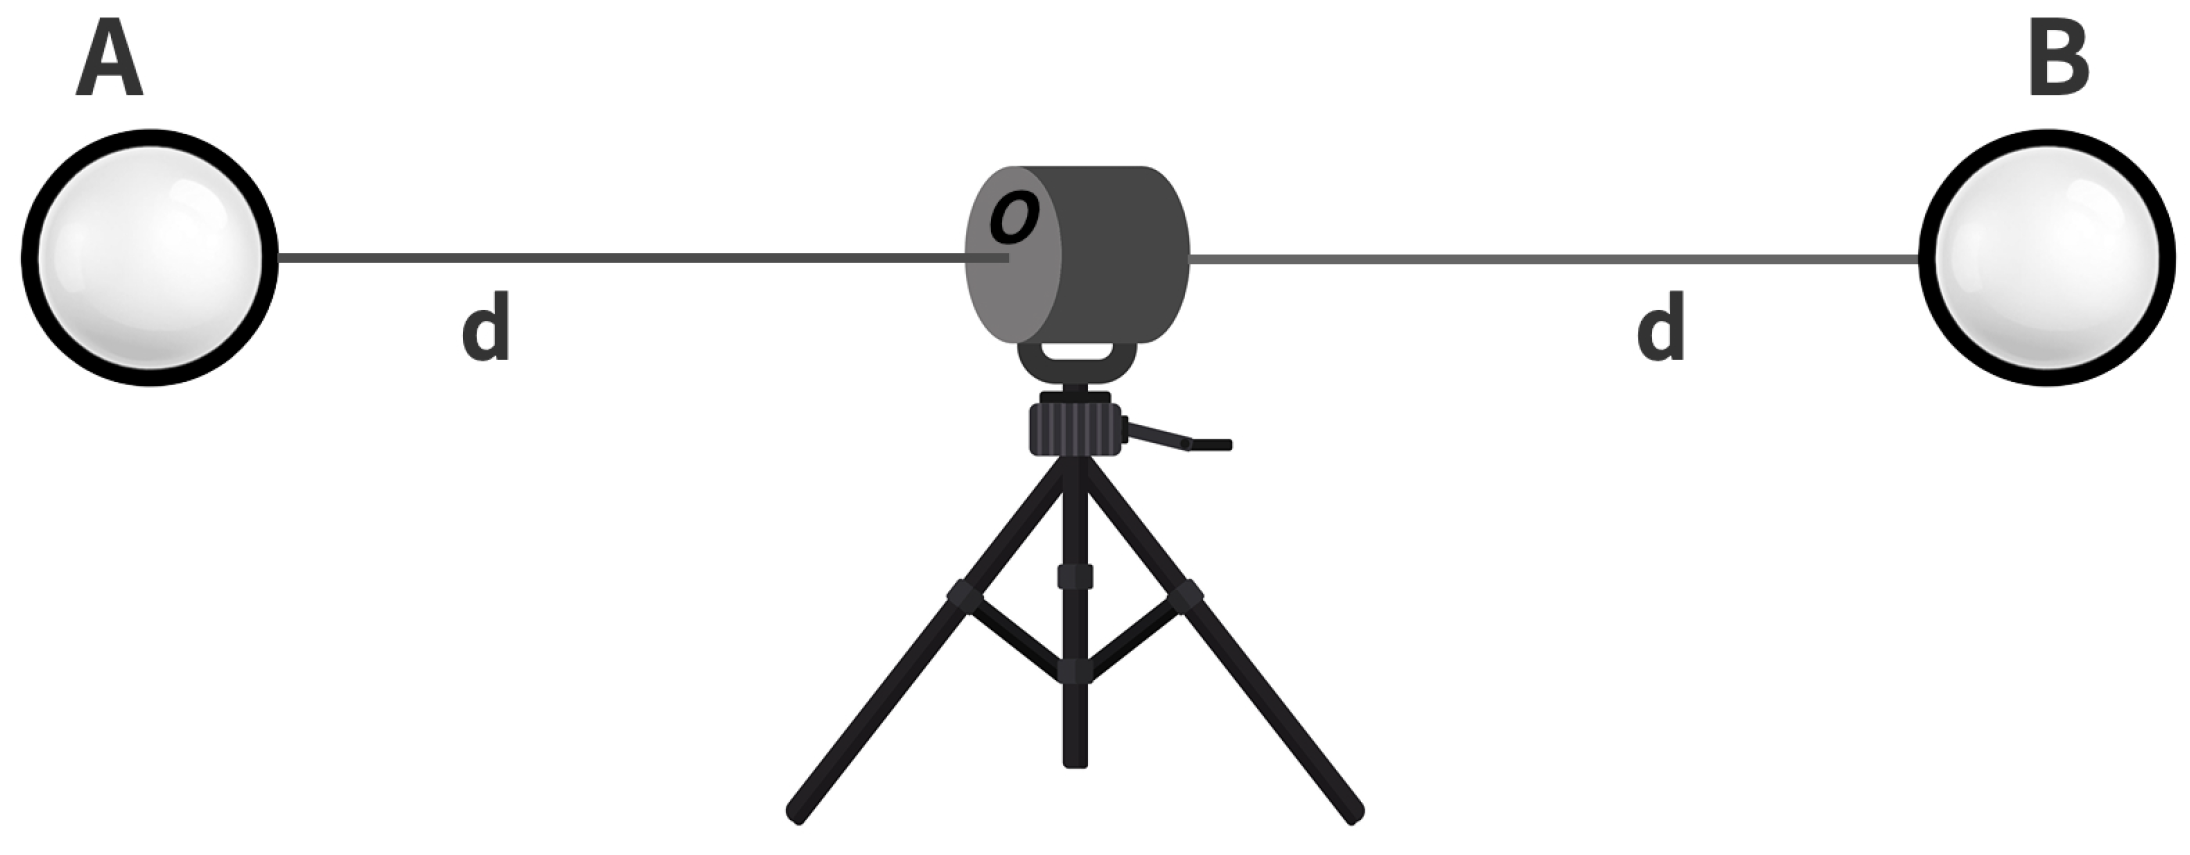
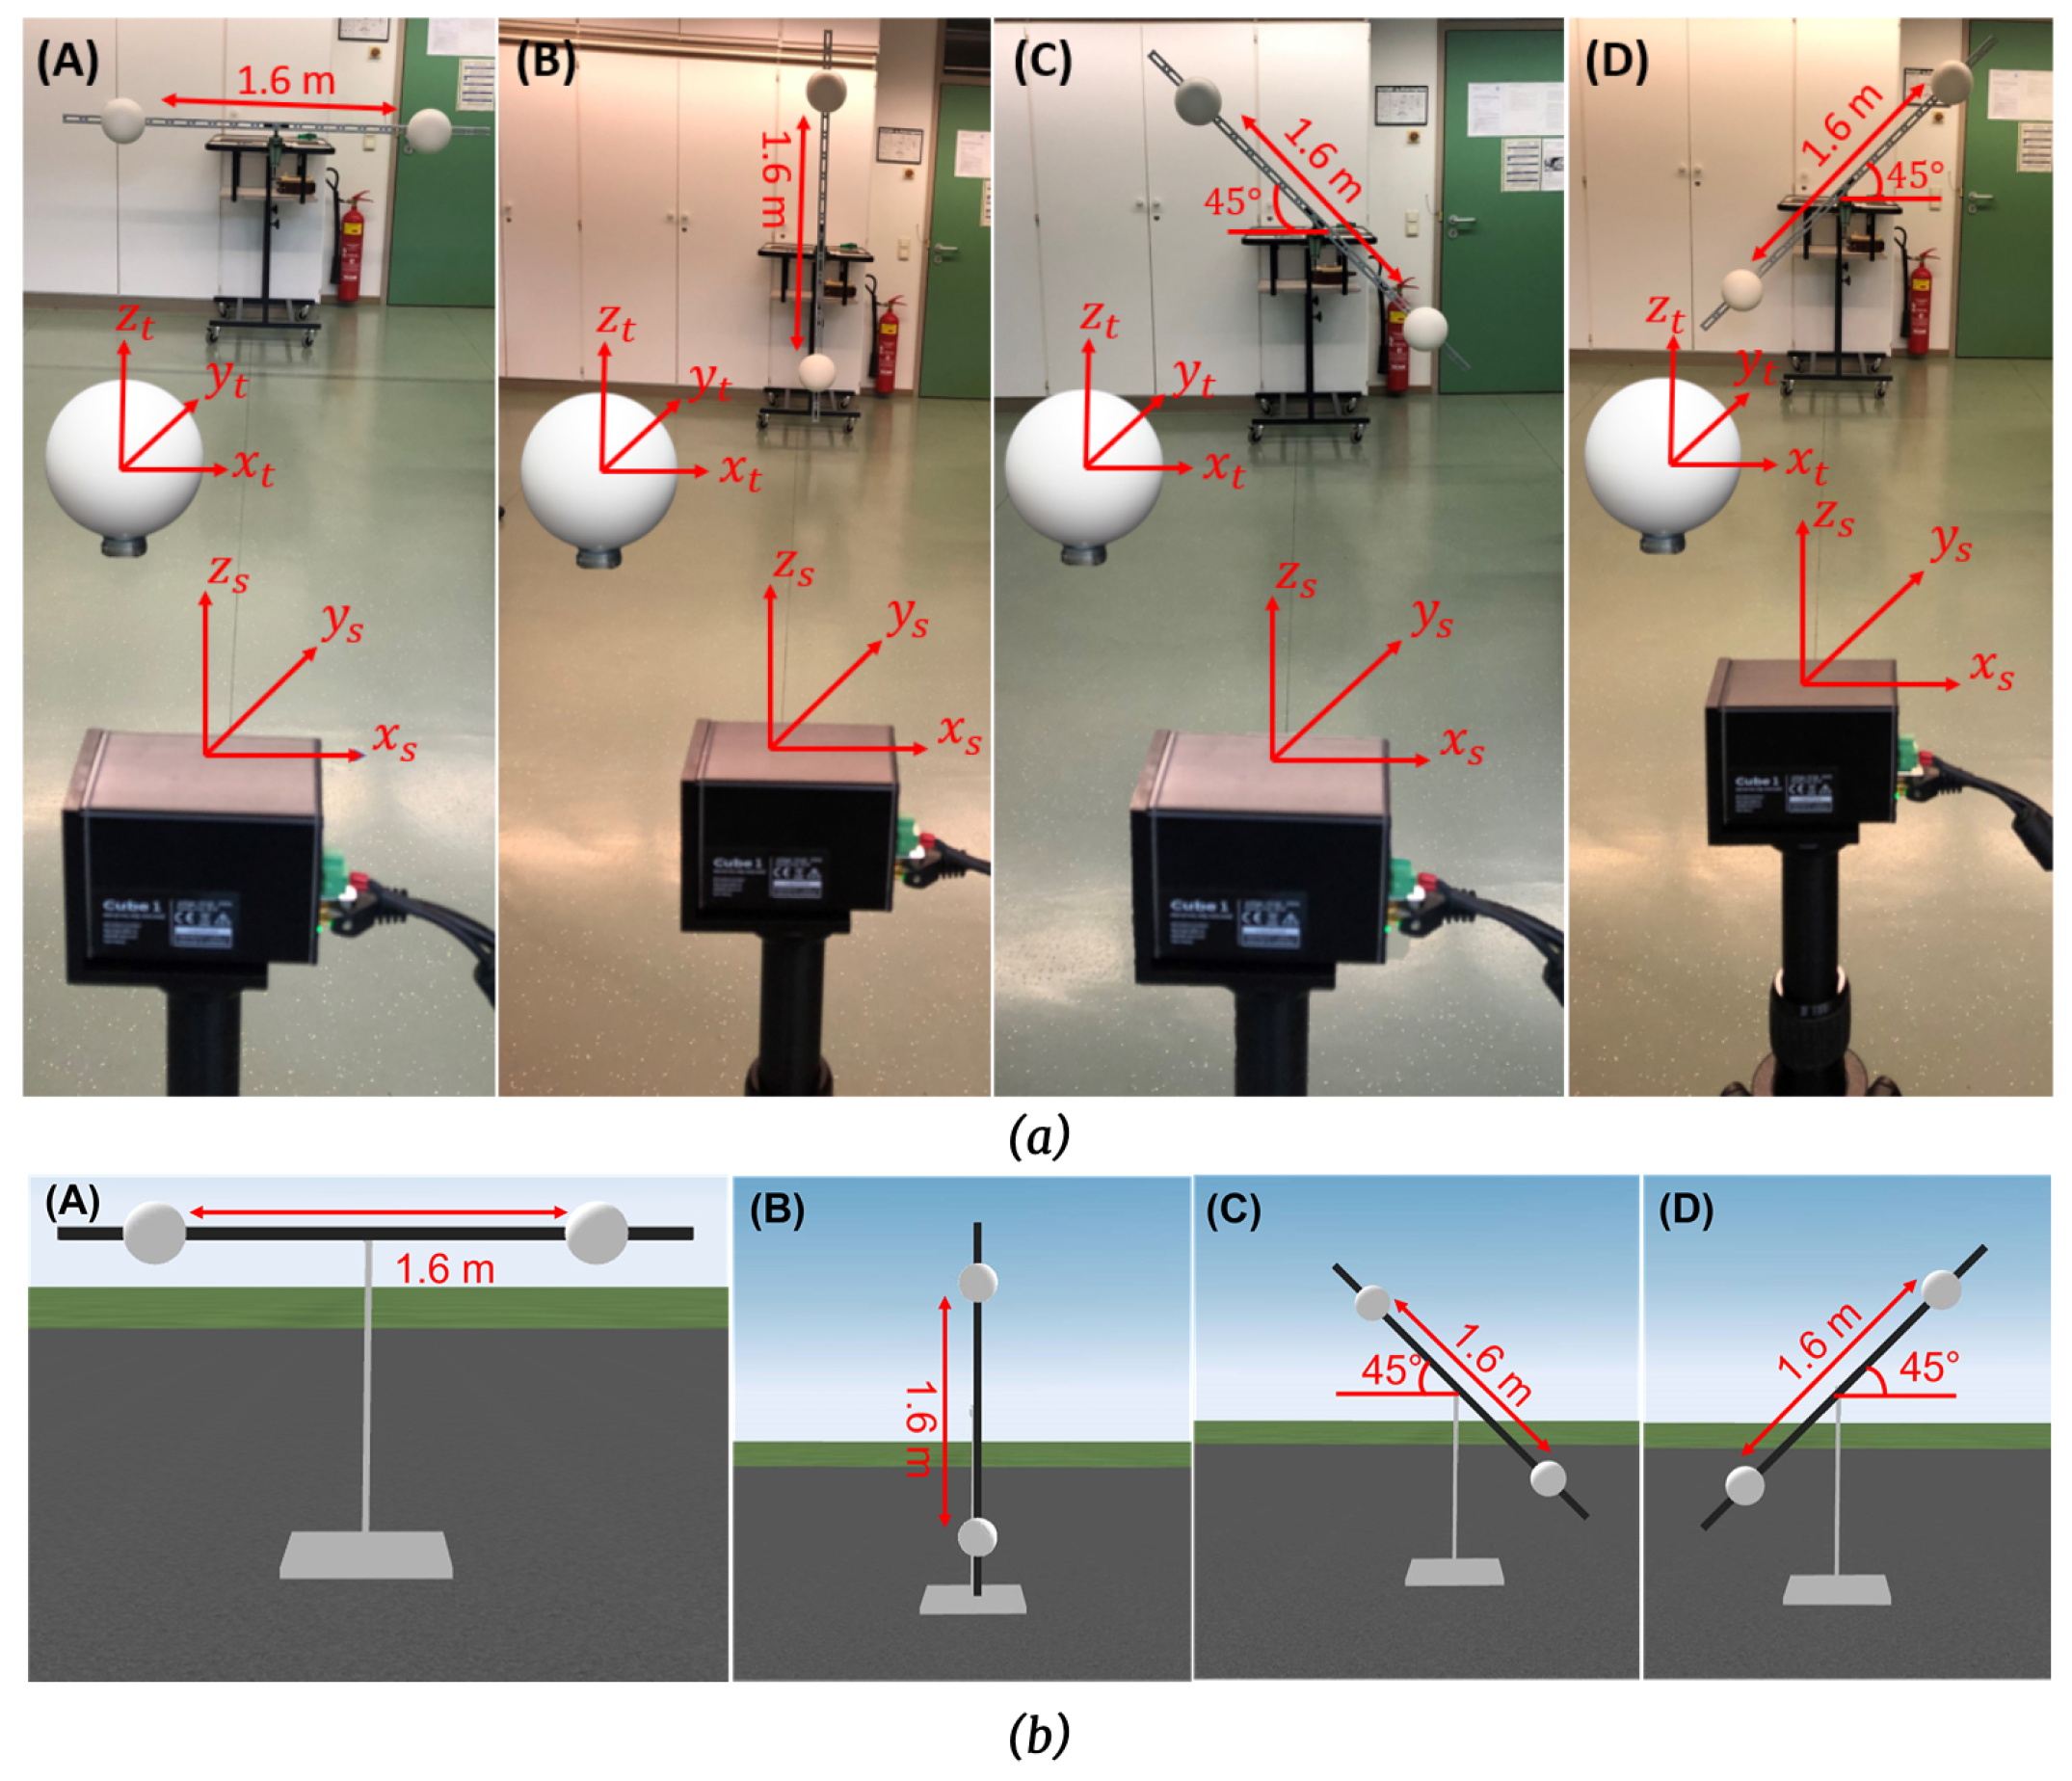
4.3. Symmetric Test
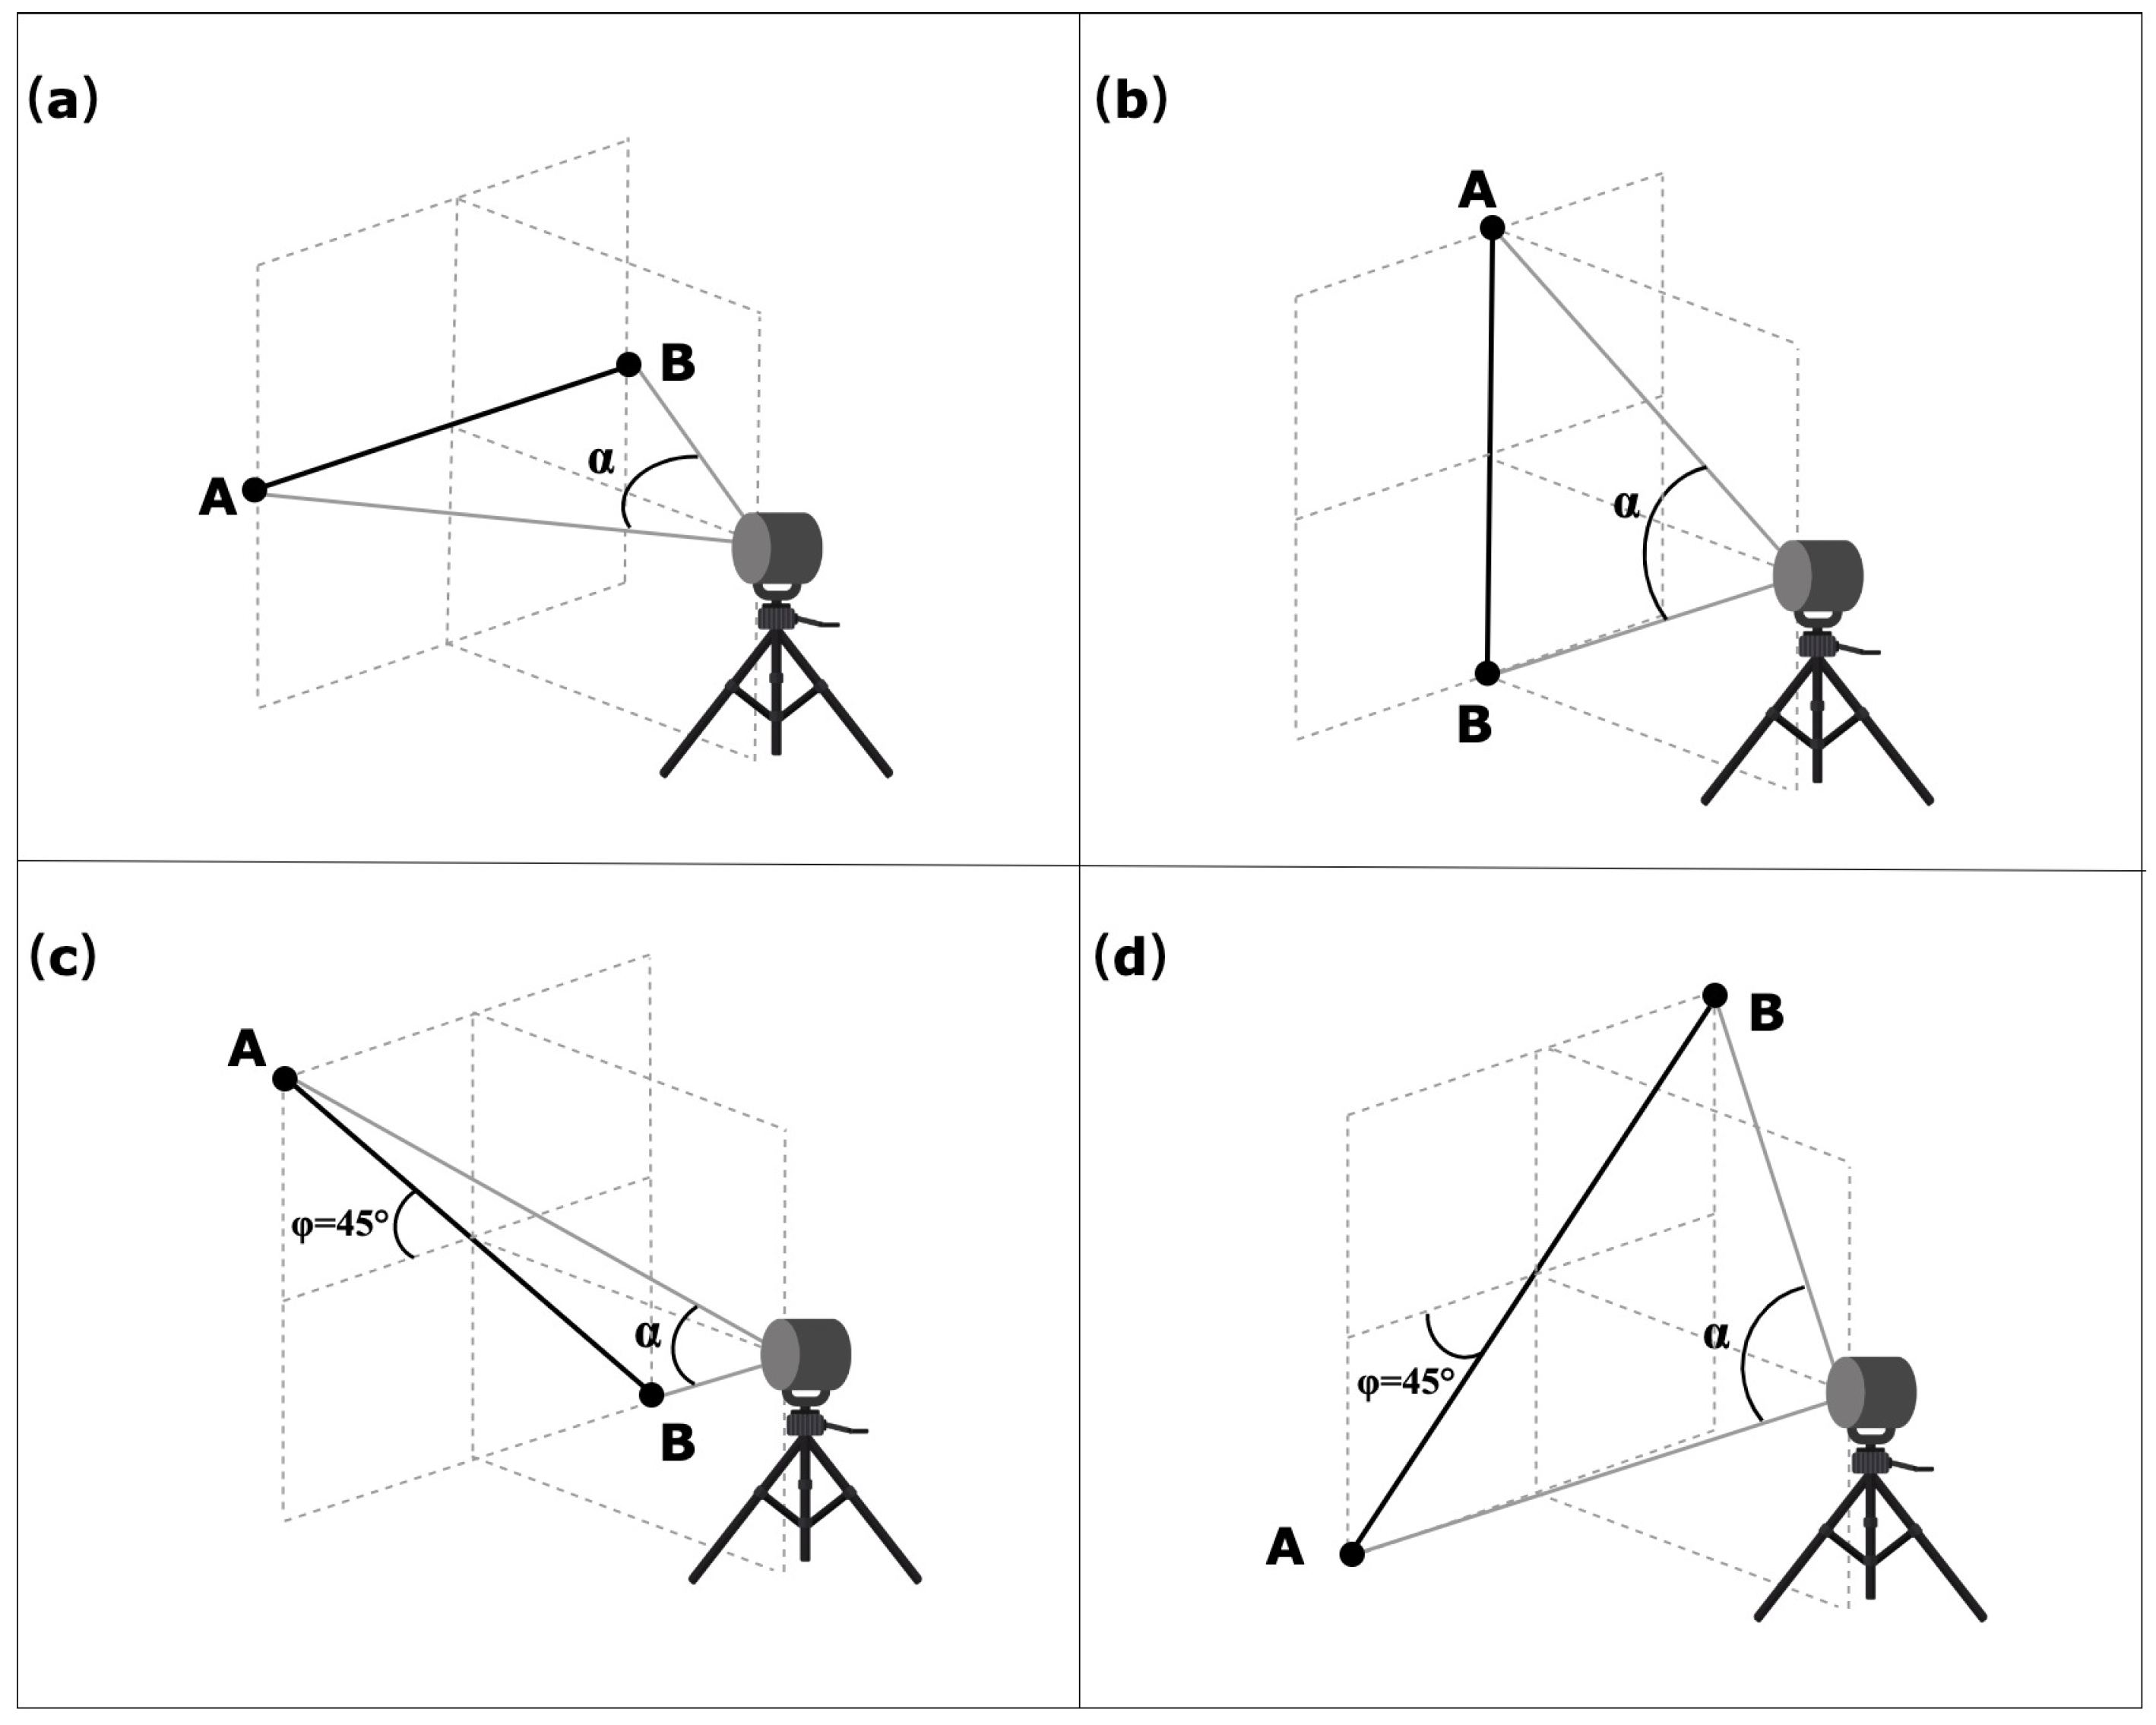
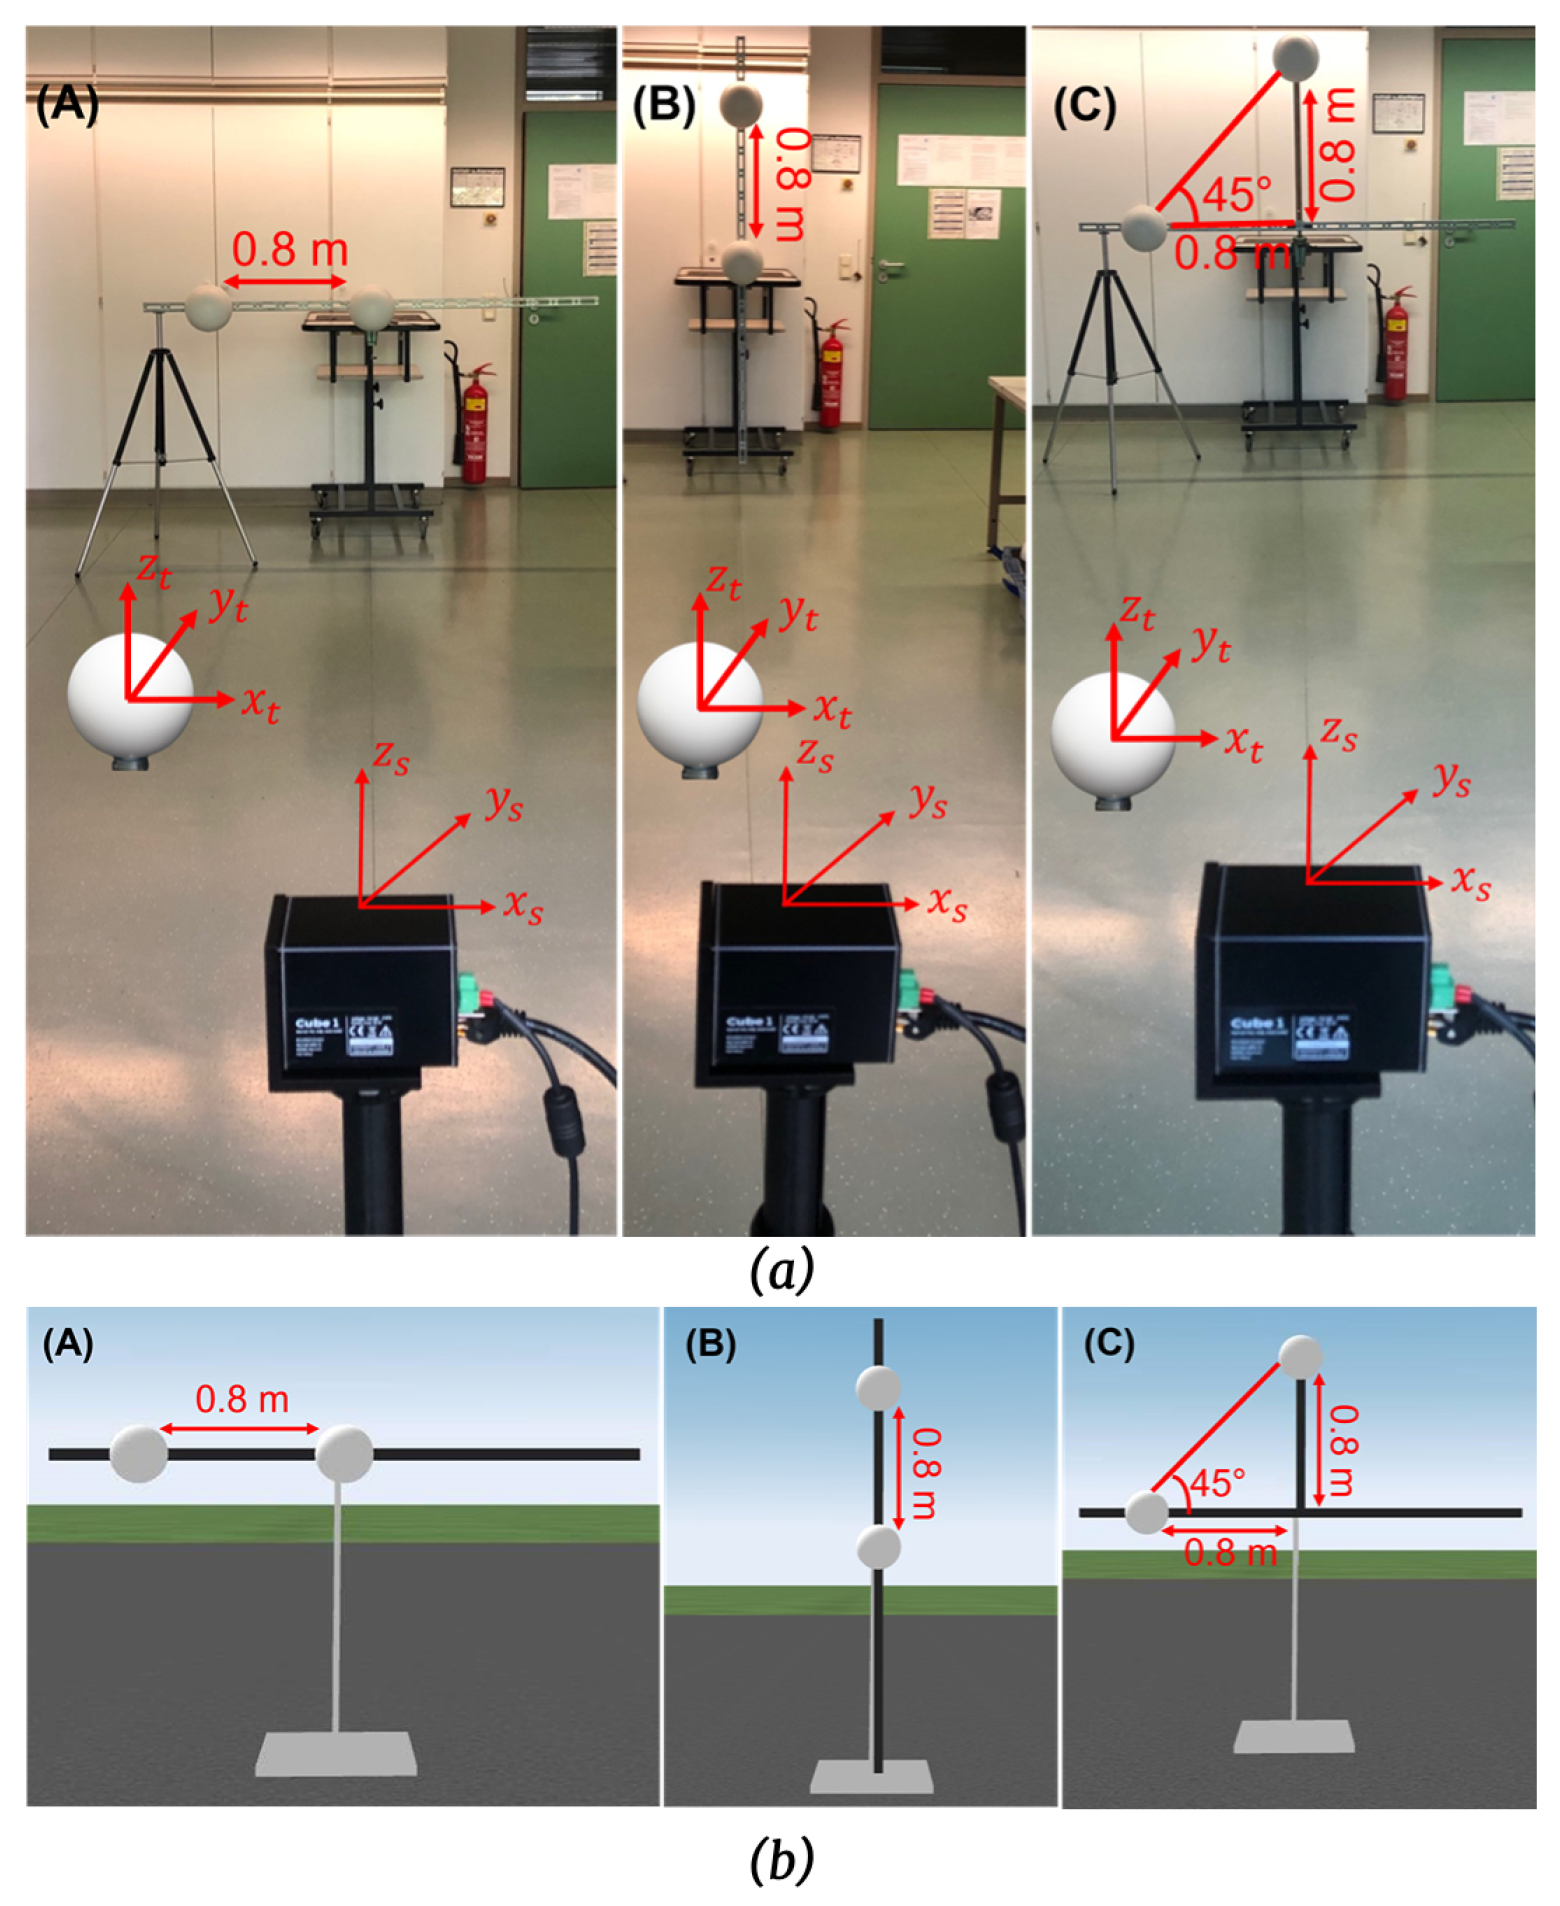
4.4. Asymmetric Test
4.5. Relative Range Test
4.6. User-Selected Tests
5. Data Analysis
5.1. Calculation of Sphere Target Derived Points Coordinates
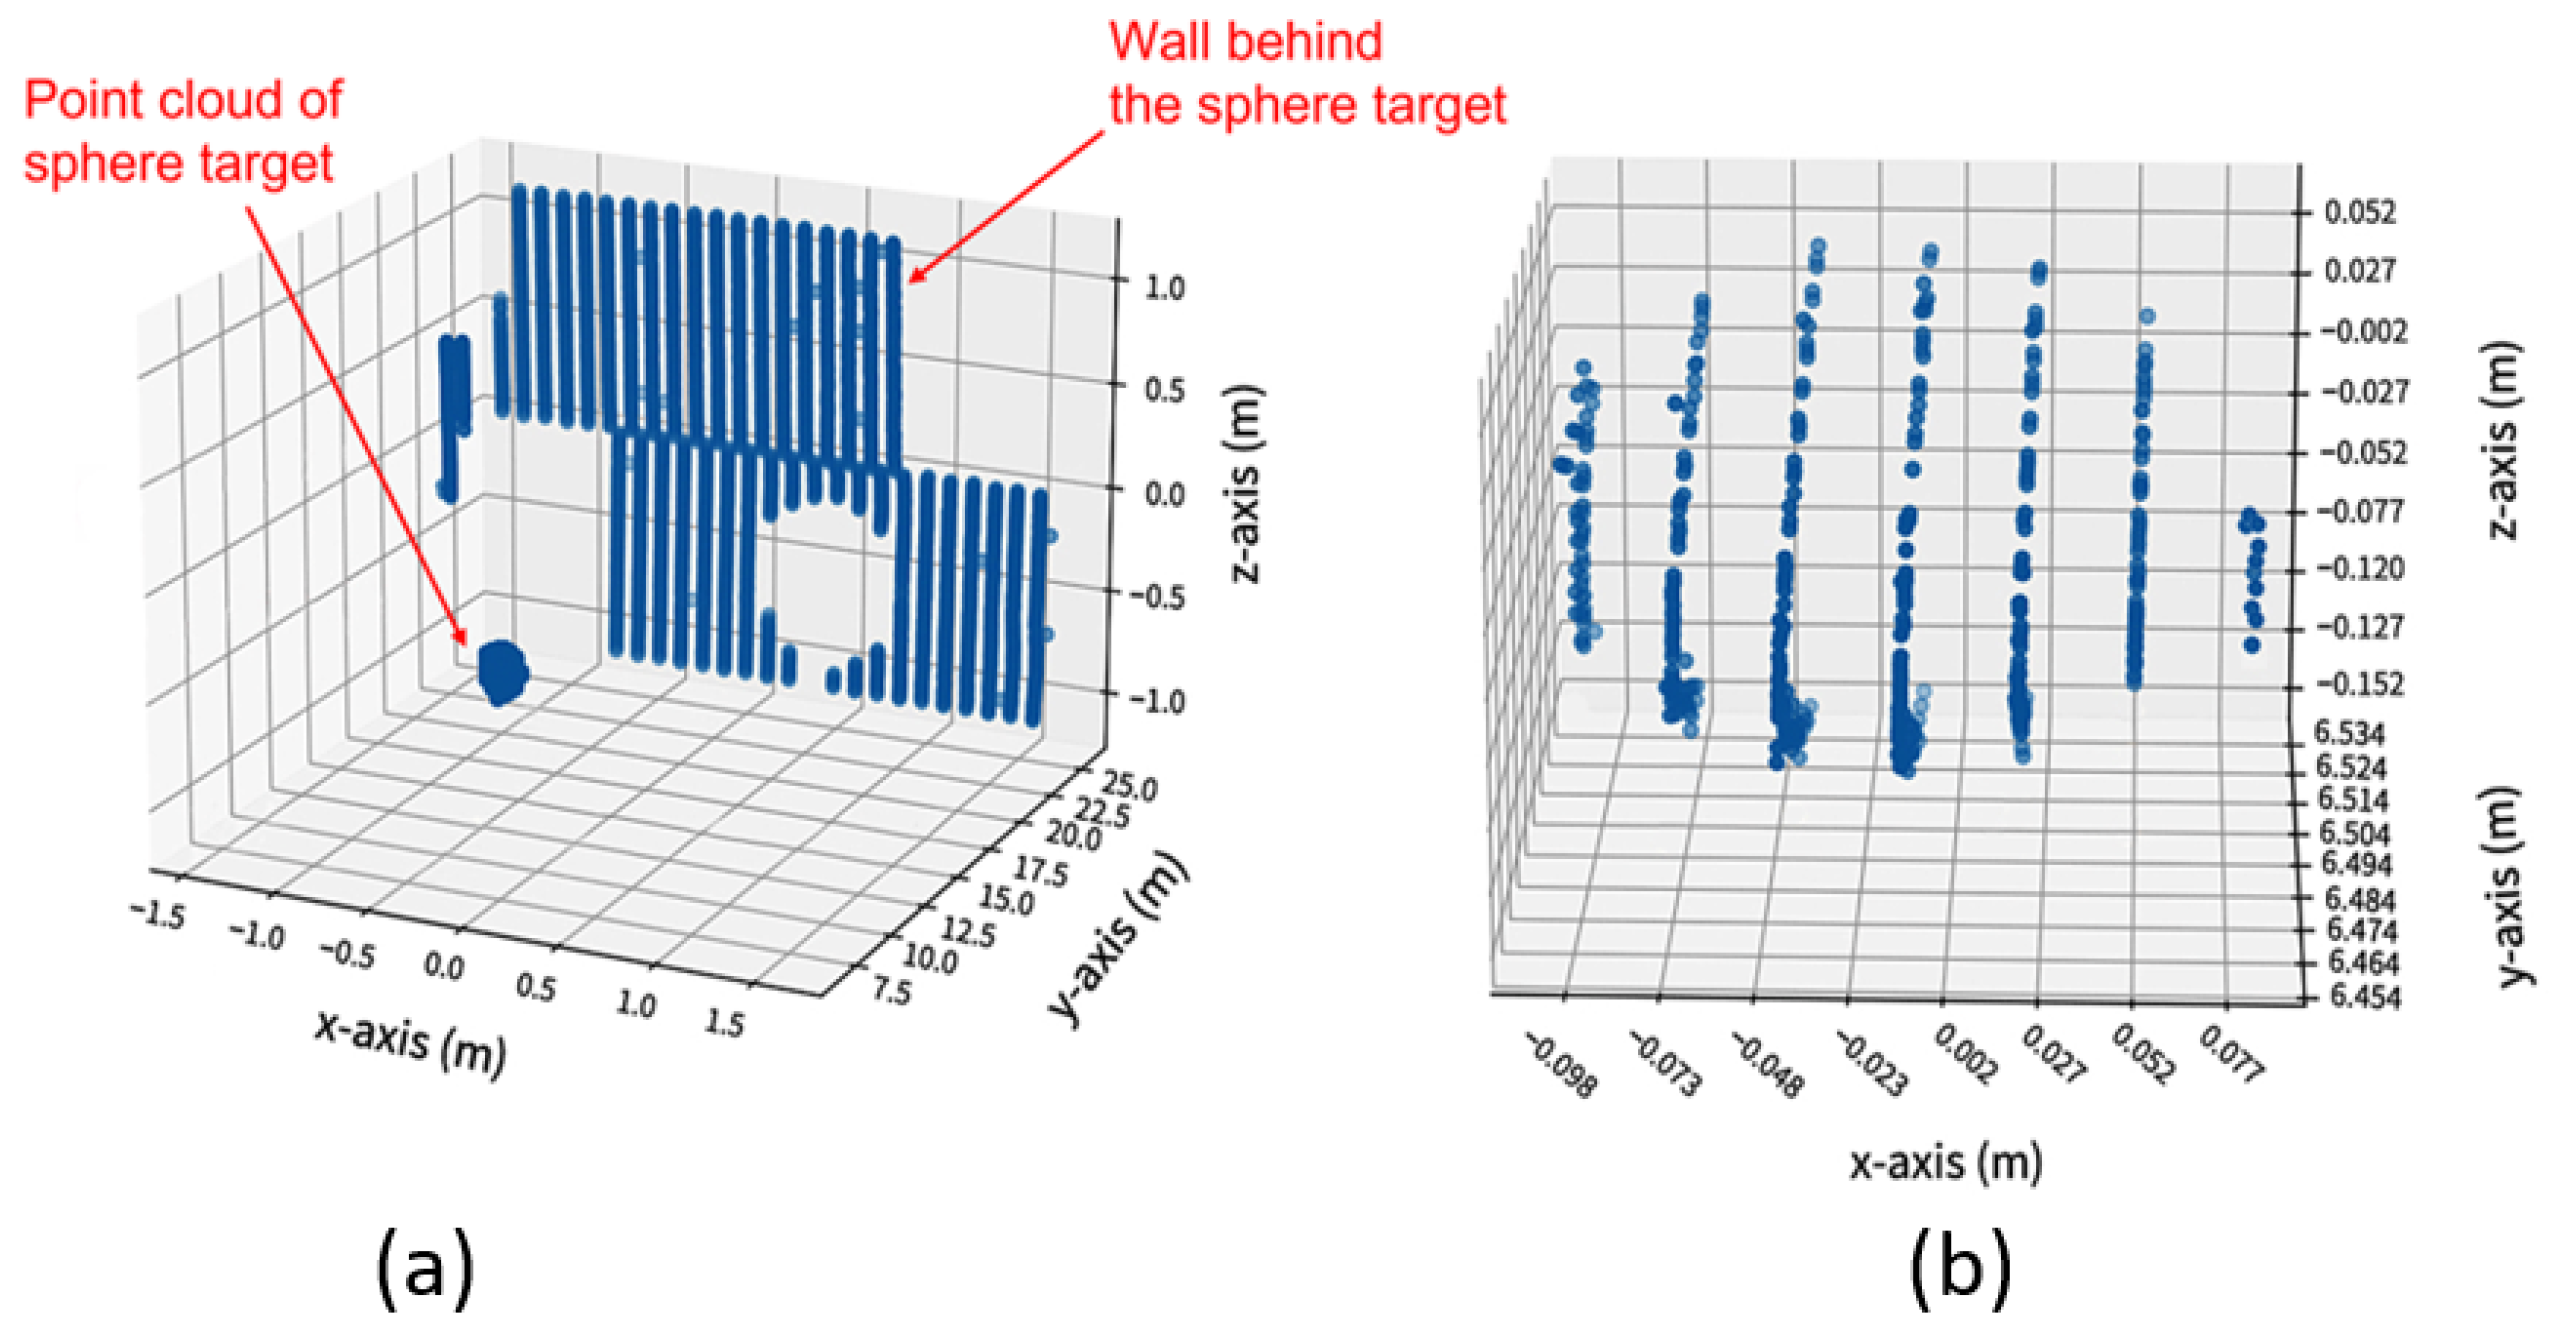
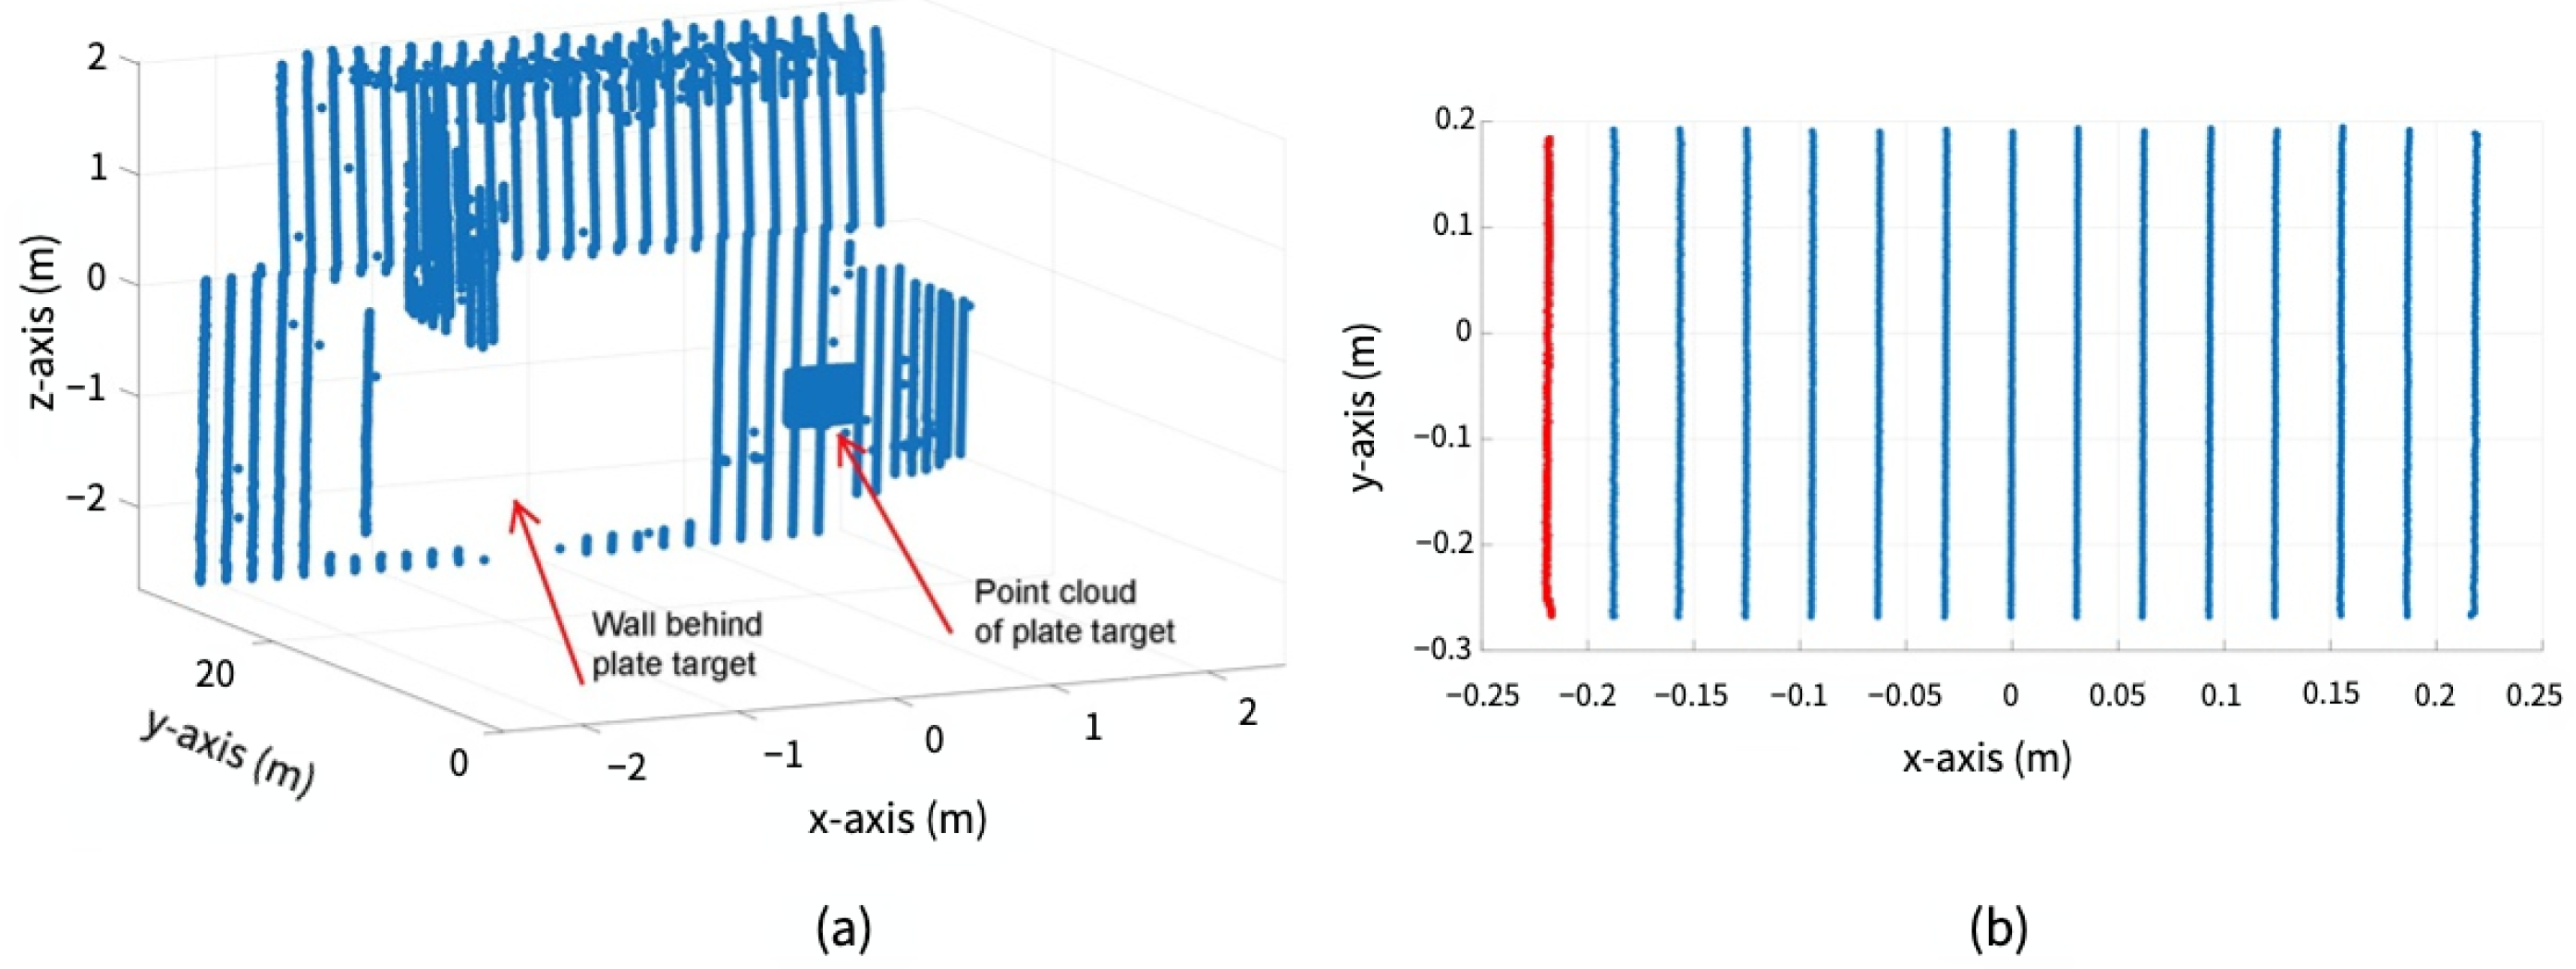
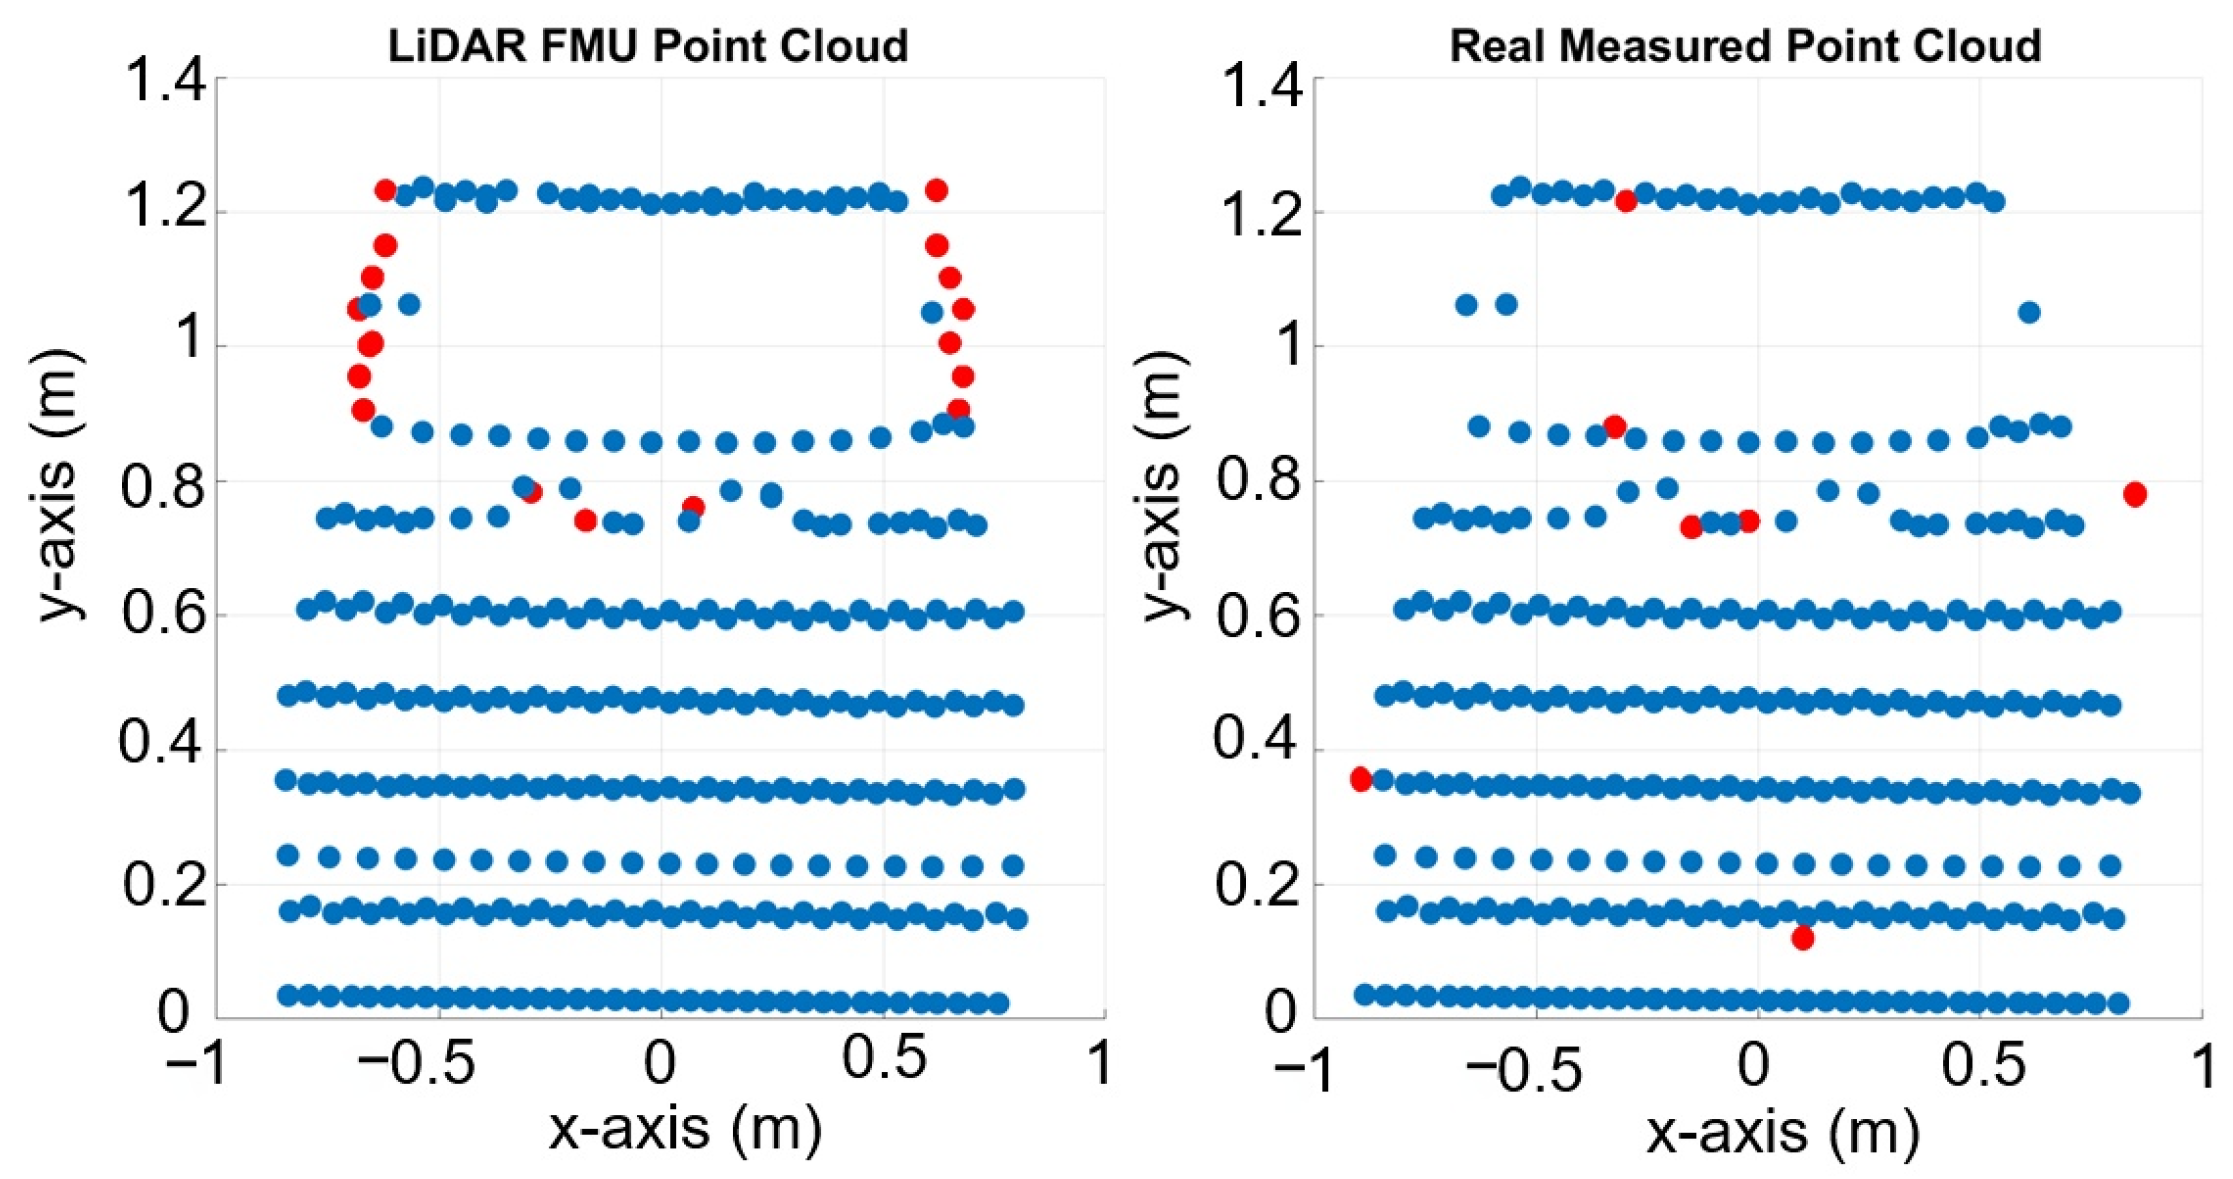
- Initial segmentation: The measured data corresponding to sphere targets shall be segmented from the surroundings since the DUT measures every object in its work volume [22]. The exemplary point clouds before and after the initial segmentation are shown in Figure 13. The points obtained after the initial segmentation are regarded as .
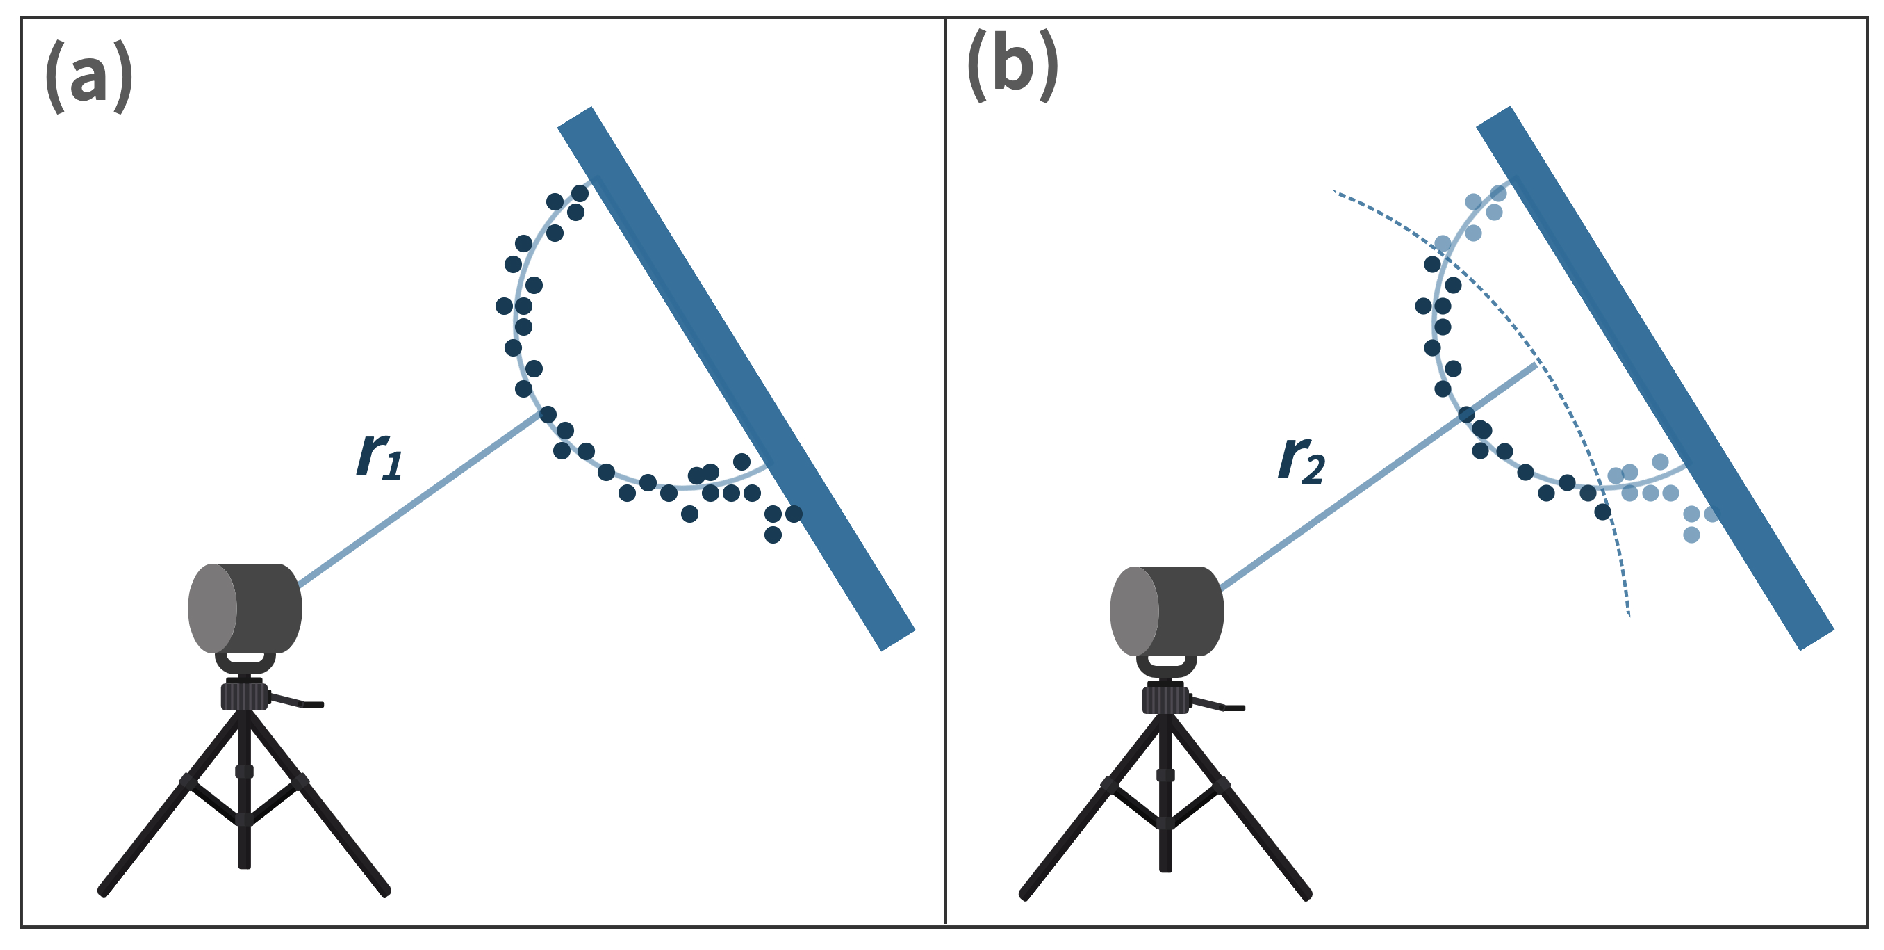
- Initial estimation: The initial estimation is used to find the coordinate of the derived point, which is the center of the point set received from the surface of the sphere target [22]. Several methods are introduced in the standard for the initial estimation, including manual estimation, the software provided by the DUT manufacturer, and the closest point method [22]. In this work, we have used the closest point method to estimate the derived point, as shown in Figure 14. First, the Euclidean distances of all the LiDAR points in data set to the origin of DUT are calculated. is determined as the median of the M closest distances of points from the DUT origin, as shown in Figure 14a). Afterward, the distance is calculated by adding the half radius of the sphere target to , as illustrated in Figure 14b). The points within the radius are represented by [22].
- Initial least squares sphere fit: A non-linear, orthogonal, least squares sphere fit (LSSF) is used on the points to determine the initial derived point . The general equation of the sphere can be expressed as follows [37]:where x, y, and z are the cartesian coordinates of the points on the sphere’s surface, and R represent the center and radius of the sphere, respectively. Equation (2) is expanded and rearranged as [37]To apply the least squares fit on all points obtained from the sphere surface, Equation (3) can be expressed in vector/matrix notation for all points in the data set as given in [37]Here, the terms , , and represent the initial points of the data set, and , , and show the last points of the data set. Vector , matrix A, and vector contain the expanded terms of the sphere, Equation (3). The vector is the least squares fit method used to calculate the vector that contains the sphere’s center coordinates and radius R. We used the Python Numpy library [38] least squares function to calculate the vector that returns the sphere’s center coordinates and radius R. We can fit a sphere to our original data set by using the output of vector .
- Cone cylinder method: As recommended in the standard, in the next step, we refine the derived point coordinates through the cone cylinder method for the sphere target, as shown in Figure 15. A straight line is drawn between the origin of DUT O and the initial derived point given in Figure 15a. A new point data set is generated from the initial segmented points , which lie within both cones shown in Figure 15b,c [22].
- Second least squares sphere fit: Furthermore, an orthogonal non-linear LSSF is applied to the data set to find the updated derived point of the sphere target [22].
- Calculation of residuals and standard deviation: Afterward, the residual and standard deviation of every point within is calculated. The residual is the difference between the sphere-updated derived point and the points in the set . In the next step, a new point set is defined, including the points whose absolute residual value is less than three times the standard deviation [22].
- Third least squares sphere fit: On the new set , another LSSF is performed to find the updated derived point [22].
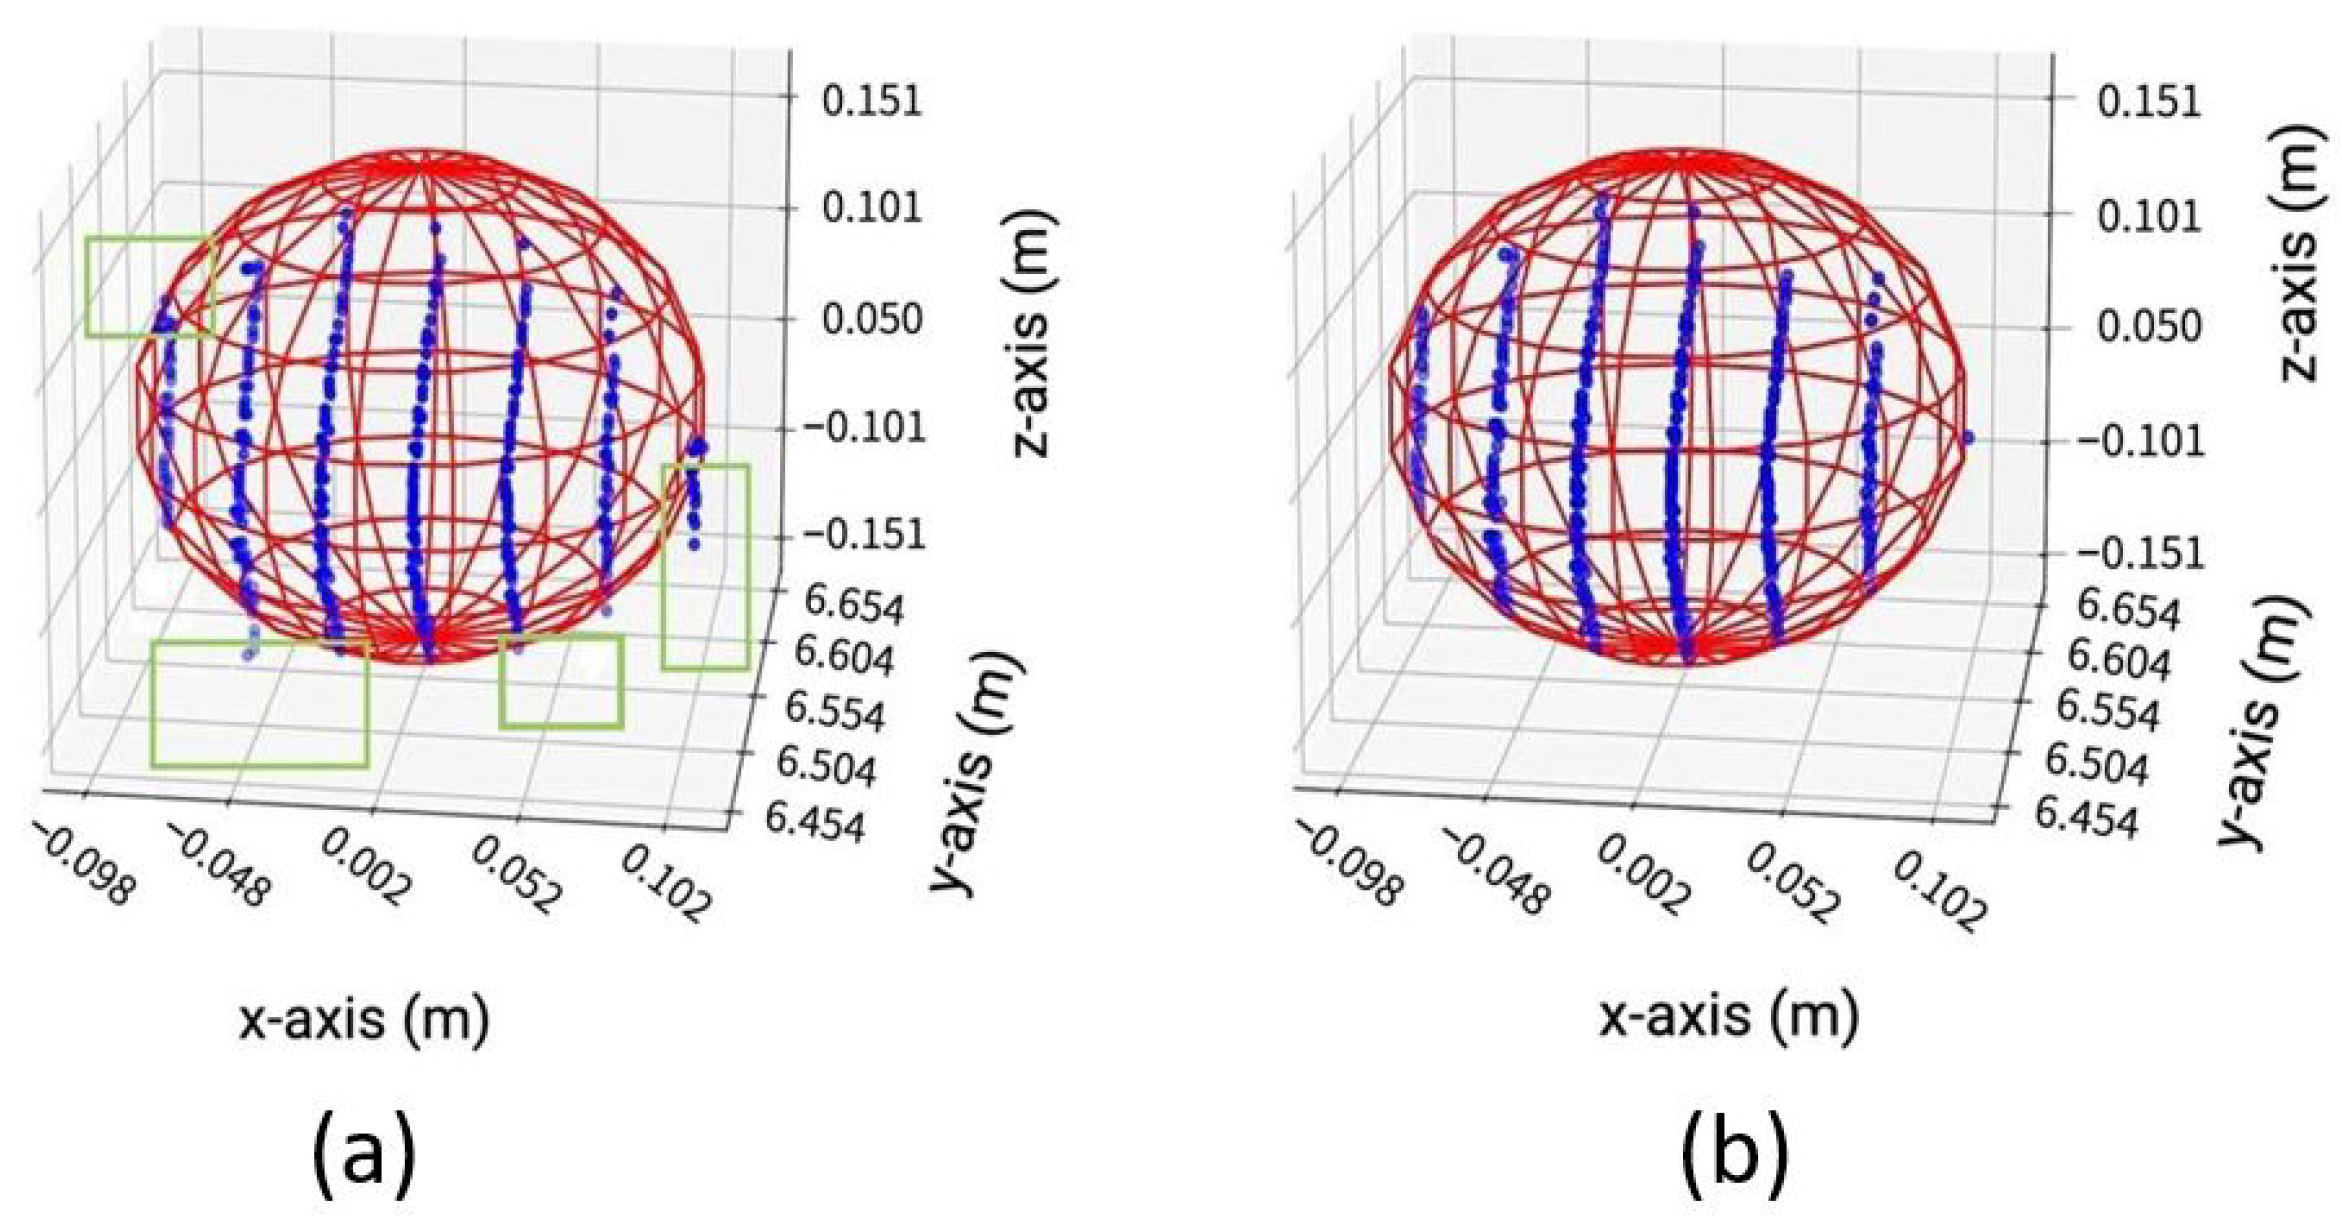
- Calculation of final derived point coordinates: The final derived point is determined after at least four more times repeating the previous procedures on as recommended in the standard. The newly derived point of the prior task is regarded as in the subsequent iteration tasks [22]. The comparison between the sphere’s point cloud after initial and final LSSF is given in Figure 16.
Test Acceptance Criteria
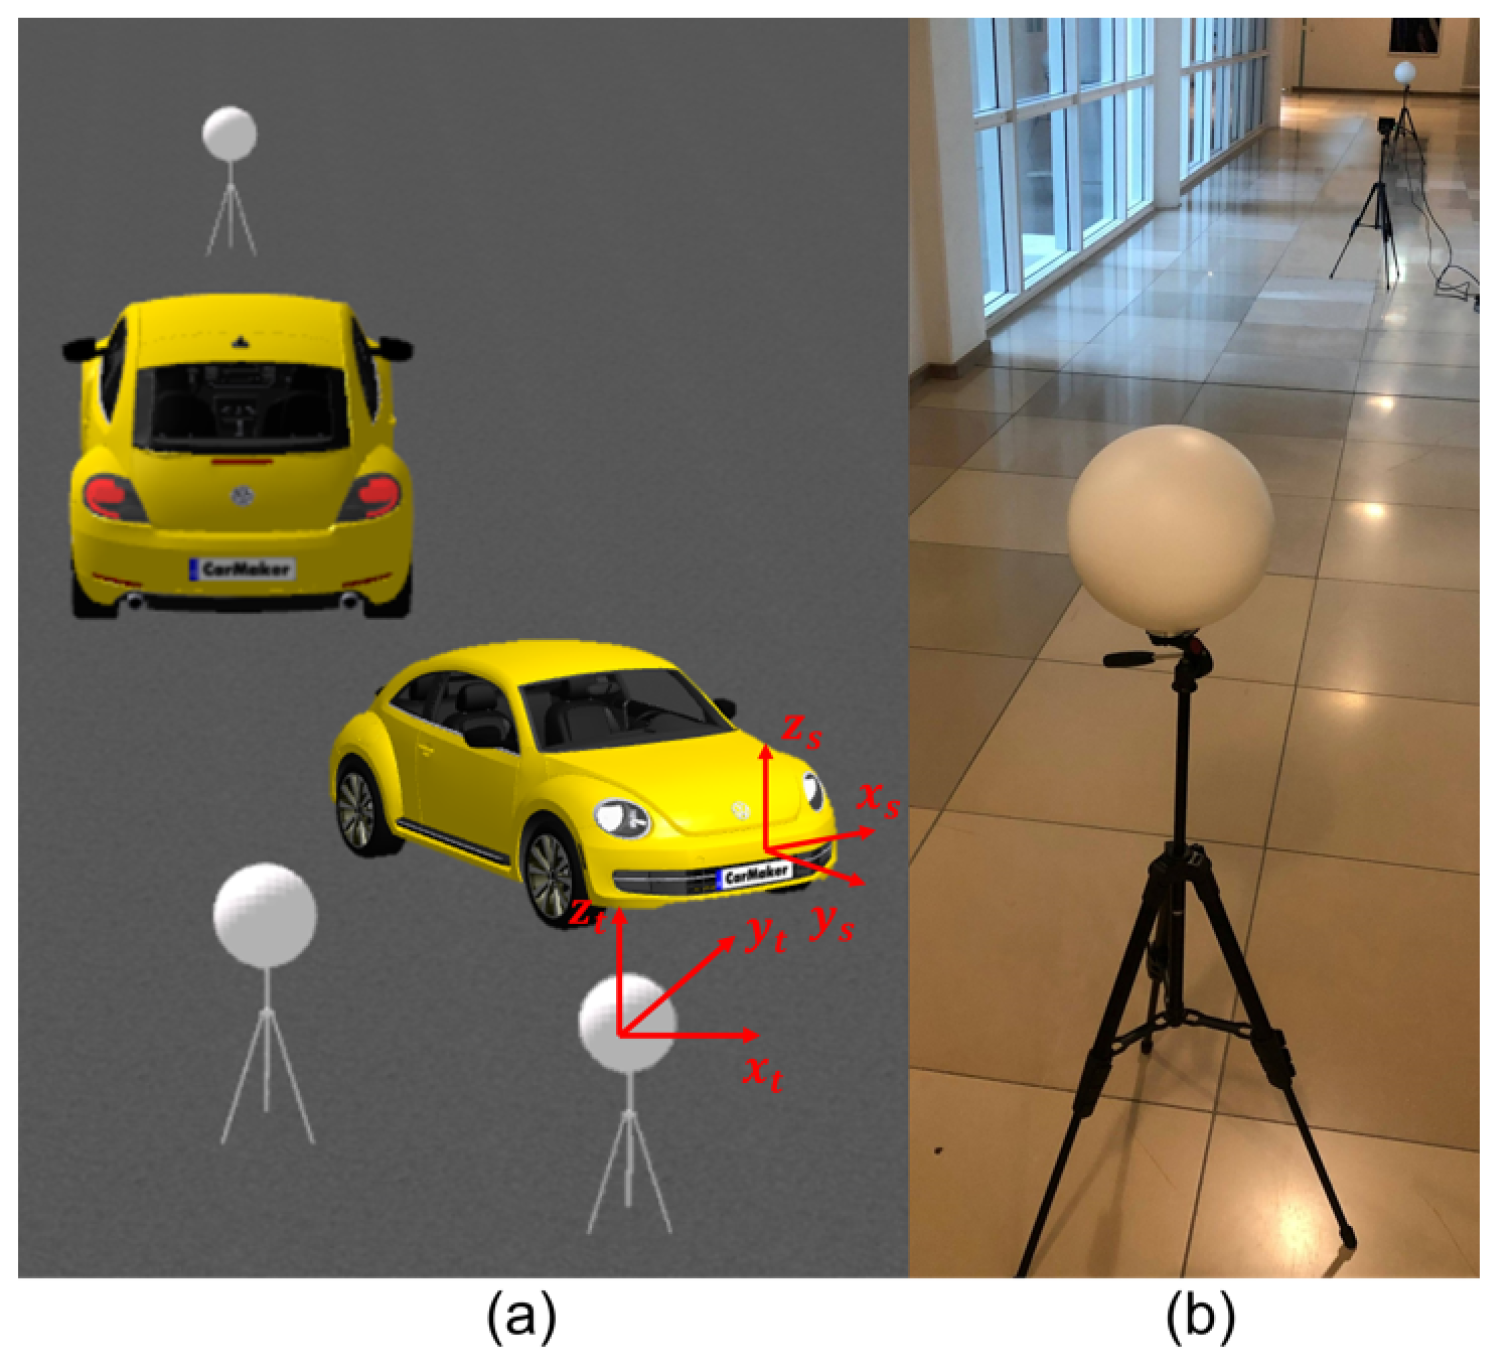
- According to the specifications of the DUT, the value of the distance MPE is equal to 20 . The distance error shall be less than 20 [22]. The distance error between the two derived points can be written as:where the targets’ x, y, and z coordinates are denoted by the subscript t and the sensors’ by s [39].where the targets’ x, y, and z coordinates are denoted by the subscript t and the reference instrument by RI [39]. We have used Leica DISTO S910 as the RI for the real measurements, and OSI ground truth interface osi3::GroundTruth is used to retrieve the sensor’s origin and target center position in 3D coordinates in the virtual environment. [40,41].
- In the case of the sphere target, the number of points in the data set shall be greater than 300 [22].
5.2. Calculating Coordinates of Derived Point for the Plate Target
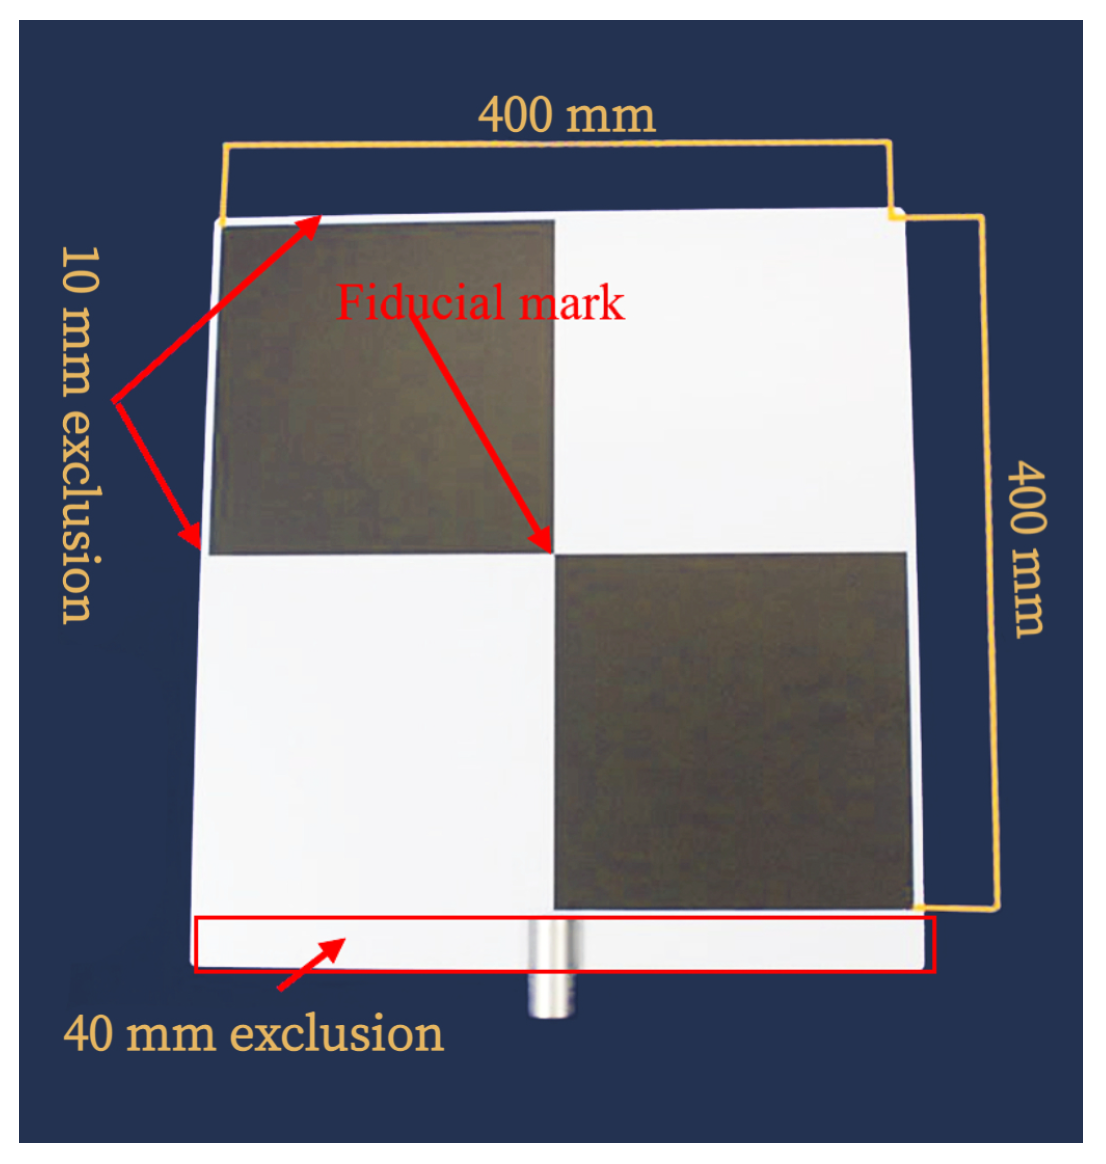
- Point selection for plane fit: Afterward, as required in the standard, the measured points from the edges of a rectangular plate are removed to fit a plane. This new point set is designated as [22].
- Least squares plane fit: The least squares plane fit (LSPF) method is applied on the point set defined in [42] to determine the location and orientation of the plate target. In addition, the standard deviation s of residual q of the plane fit is measured at each position of the plate target, as required in the standard. The plane fit residuals q are the orthogonal distances of every measured point of the plate target to its respective plane [22].
- Second data segmentation: The points whose residuals q are greater than double the corresponding standard deviation s were eliminated to visualize the best plane fit, as suggested in the standard. The updated point set is regarded as . The number of points in should be more than 95% of all measured points from the plate target. The distance error and the root mean square (RMS) dispersion of the residuals q in are calculated using Equation (11) at the reference and each test position.where q is the residual, and N denotes the number of points in the subset [22].
- Derived point for plate target: Although the plate target has a fiducial mark, it was still challenging to determine a derived point precisely at the center of the plate target. Because of that, we use the 3D geometric center method on the point set to determine the derived point of the plate target, as recommended in the standard [22].
Test Acceptance Criteria
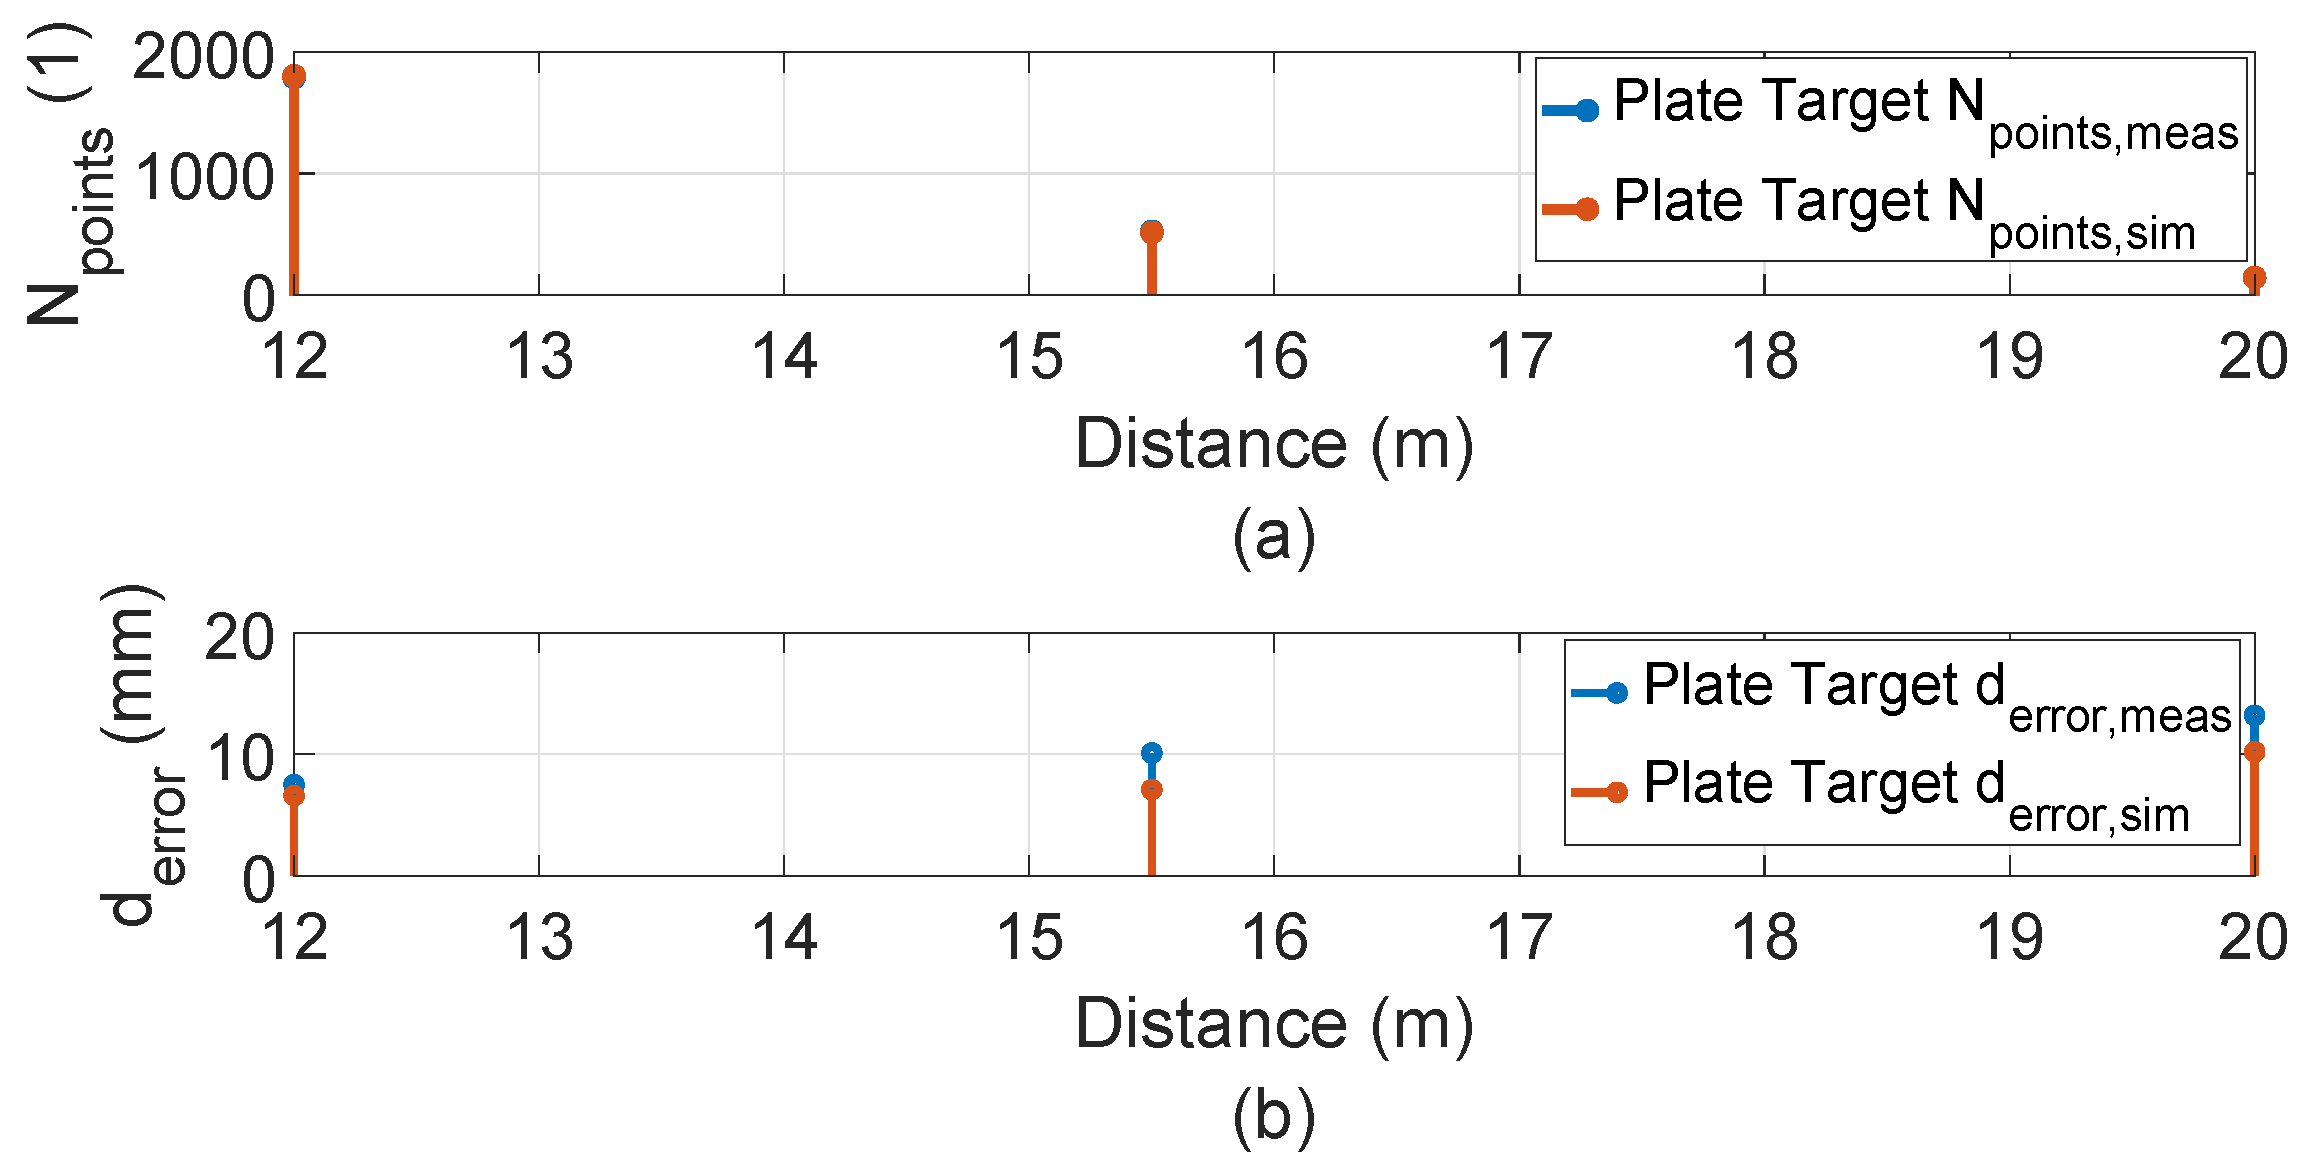
- The plate target should yield a minimum of 100 points in the point cloud [22].
6. Tests Setup and Results
6.1. Inside Test
6.2. Symmetric Test
6.3. Asymmetric Tests
6.4. Relative Range Tests
6.5. Uncertainty Budget for ASTM E3125-17 Tests
6.5.1. Uncertainty Budget of Real Measurements
- Contribution of RI (external influences): The RI has a range accuracy of ± , from to 10 , with a confidence level of 95%. That is why we consider a range uncertainty due to the RI for the ASTM E3125-17 tests because we place the targets within the 10 .
- Contribution of misalignment between the target and RI center (external influences): We aligned the center of the targets and the laser tracker of RI manually, and it is tough to always aim the laser tracker in the center of the sphere compared to the plate target. The highest standard uncertainty due to this factor was for the top sphere of test position C of symmetric tests. However, for all the other tests, the standard uncertainty due to this factor is less than .
- Contribution of environmental conditions (external influences): All the tests were performed in the lab; therefore, environmental conditions’ influence on the measurements is negligible.
- Contribution of DUT internal influences (internal influences): The ranging error due to the internal influences of the DUT is for all the tests. These internal influences include the ranging error due to the internal reflection of the sensor, detector losses, peak detection algorithm, and precision loss due to the spherical coordinates conversion to the cartesian coordinates. It should be noted that the distance error due to the sensor’s internal influences may vary depending on the temperature (see point 3 above).
6.5.2. Uncertainty Budget of Simulation
- Contribution of DUT (internal influences): As given above, the LiDAR FMU simulation model considers the exact scan pattern, signal processing chain, and sensor-related effect of Blickfeld Cube 1. Therefore, the uncertainty due to the internal influences of the sensor model is (see 4 above).
- Contribution of environmental conditions effect model (external influences): Environmental conditions effects are not modeled for these tests.
6.6. Comparison of Simulation and Real Measurements Results
6.7. User-Selected Tests
6.8. Influence of ASTM Standard KPIs on Object Detection
7. Conclusions
8. Outlook
Author Contributions
Funding
Institutional Review Board Statement
Informed Consent Statement
Data Availability Statement
Acknowledgments
Conflicts of Interest
Abbreviations
| ACC | Adaptive cruise control |
| AOS | Average orientation similarity |
| ADAS | Advanced driver-assistance system |
| BSD | Blind-spot detection |
| DUT | Device under test |
| Effect Engine | FX engine |
| FMU | Functional mock-up unit |
| FMI | Functional mock-up interface |
| FCW | Forward collision warning |
| FoV | Field of view |
| GNSS | Global navigation satellite system |
| INS | Inertial navigation system |
| LDWS | Lane departure warning system |
| LiDAR | Light detection and ranging |
| LDM | Laser and detector module |
| LSSF | Least square sphere fit |
| LSPF | Least square plane fit |
| MPE | Maximum permissible error |
| MEMS | Micro-electro-mechanical systems |
| MAPE | Mean absolute percentage error |
| OSI | Open simulation interface |
| OEMs | Original equipment manufacturers |
| OSMP | OSI sensor model packaging |
| OPA | Optical phased array |
| ODCS | Object detection confidence score |
| RADAR | Radio detection and ranging |
| RTDT | Round-trip delay time |
| RI | Reference instrument |
| RMS | Root mean square |
References
- Bilik, I. Comparative Analysis of Radar and Lidar Technologies for Automotive Applications. IEEE Intell. Transp. Syst. Mag. 2022, 15, 244–269. [Google Scholar] [CrossRef]
- Dey, J.; Taylor, W.; Pasricha, S. VESPA: A framework for optimizing heterogeneous sensor placement and orientation for autonomous vehicles. IEEE Consum. Electron. Mag. 2020, 10, 16–26. [Google Scholar] [CrossRef]
- Winner, H.; Hakuli, S.; Lotz, F.; Singer, C. Handbook of Driver Assistance Systems; Springer International Publishing: Amsterdam, The Netherlands, 2014; pp. 405–430. [Google Scholar]
- Kochhar, N. A Digital Twin for Holistic Autonomous Vehicle Development. ATZelectron. Worldw. 2022, 16, 8–13. [Google Scholar] [CrossRef]
- Synopsys, What is ADAS? 2021. Available online: https://www.synopsys.com/automotive/what-is-adas.html (accessed on 26 August 2021).
- Fersch, T.; Buhmann, A.; Weigel, R. The influence of rain on small aperture LiDAR sensors. In Proceedings of the 2016 German Microwave Conference (GeMiC), Bochum, Germany, 14–16 March 2016; pp. 84–87. [Google Scholar]
- Bellanger, C. They Tried the Autonomous ZOE Cab. Here Is What They Have to Say. Available online: https://www.renaultgroup.com/en/news-on-air/news/they-tried-the-autonomous-zoe-cab-here-is-what-they-have-to-say/ (accessed on 27 July 2022).
- Valeo. Valeo’s LiDAR Technology, the Key to Conditionally Automated Driving, Part of the Mercedes-Benz DRIVE PILOT SAE-Level 3 System. Available online: https://www.valeo.com/en/valeos-lidar-technology-the-key-to-conditionally-automated-driving-part-of-the-mercedes-benz-drive-pilot-sae-level-3-system/ (accessed on 27 July 2022).
- Chen, Y. Luminar Provides Its LiDAR Technology for Audi’s Autonomous Driving Startup. Available online: https://www.ledinside.com/press/2018/12/luminar_provides_its_lidar_technology_audi_autonomous_driving_startup (accessed on 27 July 2022).
- Cooper, M.A.; Raquet, J.F.; Patton, R. Range Information Characterization of the Hokuyo UST-20LX LIDAR Sensor. Photonics 2018, 5, 12. [Google Scholar] [CrossRef]
- Rachakonda, P.; Muralikrishnan, B.; Shilling, M.; Sawyer, D.; Cheok, G.; Patton, R. An overview of activities at NIST towards the proposed ASTM E57 3D imaging system point-to-point distance standard. J. CMSC 2017, 12, 1–14. [Google Scholar] [PubMed]
- Beraldin, J.A.; Mackinnon, D.; Cheok, G.; Patton, R. Metrological characterization of 3D imaging systems: Progress report on standards developments, EDP Sciences. In Proceedings of the 17th International Congress of Metrology, Paris, France, 21–24 September 2015; p. 13003. [Google Scholar]
- Muralikrishnan, B.; Ferrucci, M.; Sawyer, D.; Gerner, G.; Lee, V.; Blackburn, C.; Phillips, S.; Petrov, P.; Yakovlev, Y.; Astrelin, A.; et al. Volumetric performance evaluation of a laser scanner based on geometric error model. Precis. Eng. 2015, 153, 107398. [Google Scholar] [CrossRef]
- Laconte, J.; Deschênes, S.P.; Labussière, M.; Pomerleau, F.; Milligan, S. Lidar measurement bias estimation via return waveform modelling in a context of 3d mapping. In Proceedings of the 2019 International Conference on Robotics and Automation (ICRA), Montreal, QC, Canada, 20–24 May 2019; pp. 8100–8106. [Google Scholar]
- Lambert, J.; Carballo, A.; Cano, A.M.; Narksri, P.; Wong, D.; Takeuchi, E.; Takeda, K. Performance analysis of 10 models of 3D LiDARs for automated driving. IEEE Access 2015, 8, 131699–131722. [Google Scholar] [CrossRef]
- Gumus, K.; Erkaya, H. Analyzing the geometric accuracy of simple shaped reference object models created by terrestrial laser. Int. J. Phys. Sci. 2015, 6, 6529–6536. [Google Scholar]
- Hiremagalur, J.; Yen, K.S.; Lasky, T.A.; Ravani, B. Testing and Performance Evaluation of Fixed Terrestrial 3D Laser Scanning Systems for Highway Applications. Transp. Res. Rec. 2009, 2098, 29–40. [Google Scholar] [CrossRef]
- Gomes, T.; Roriz, R.; Cunha, L.; Ganal, A.; Soares, N.; Araújo, T.; Monteiro, J. Evaluation and Testing Platform for Automotive LiDAR Sensors. Appl. Sci. 2022, 12, 13003. [Google Scholar] [CrossRef]
- Nahler, C.; Steger, C.; Druml, N. Quantitative and Qualitative Evaluation Methods of Automotive Time of Flight Based Sensors. In Proceedings of the 23rd Euromicro Conference on Digital System Design (DSD), Kranj, Slovenia, 26–28 August 2020; pp. 651–659. [Google Scholar]
- HESAI, Hesai Acts as Group Leader for ISO Automotive Lidar Working Group, 2022. Available online: https://www.hesaitech.com/en/media/98 (accessed on 15 March 2022).
- DIN, DIN SPEC 91471 Assessment Methodology for Automotive LiDAR Sensors. Available online: https://www.din.de/en/wdc-beuth:din21:352864796 (accessed on 27 July 2022).
- ASTM International. ASTM E3125-17 Standard Test Method for Evaluating the Point-to-Point Distance Measurement Performance of Spherical Coordinate 3D Imaging Systems in the Medium Range; ASTM International: West Conshohocken, PA, USA, 2017. [Google Scholar]
- Haider, A.; Pigniczki, M.; Köhler, M.H.; Fink, M.; Schardt, M.; Cichy, Y.; Zeh, T.; Haas, L.; Poguntke, T.; Jakobi, M.; et al. Development of High-Fidelity Automotive LiDAR Sensor Model with Standardized Interfaces. Sensors 2022, 22, 7556. [Google Scholar] [CrossRef] [PubMed]
- Wang, L.; Muralikrishnan, B.; Lee, V.; Rachakonda, P.; Sawyer, D.; Gleason, J. A first realization of ASTM E3125-17 test procedures for laser scanner performance evaluation. Measurement 2020, 153, 107398. [Google Scholar] [CrossRef]
- ASAM e.V. OSI Sensor Model Packaging Specification. Available online: https://opensimulationinterface.github.io/osi-documentation/osi-sensor-model-packaging/doc/specification.html (accessed on 7 June 2021).
- Wang, D.; Watkins, C.; Xie, H. MEMS Mirrors for LiDAR: A Review. Micromachines 2020, 11, 456. [Google Scholar] [CrossRef] [PubMed]
- Thakur, R. Scanning LIDAR in Advanced Driver Assistance Systems and Beyond: Building a road map for next-generation LIDAR technology. IEEE Consum. Electron. Mag. 2016, 5, 48–54. [Google Scholar] [CrossRef]
- Blickfeld “Cube 1 Outdoor v1.1”, Datasheet, 2022. Available online: https://www.blickfeld.com/wp-content/uploads/2022/10/blickfeld_Datasheet_Cube1-Outdoor_v1.1.pdf (accessed on 10 January 2023).
- Holmstrom, S.T.S.; Baran, U.; Urey, H. MEMS Laser Scanners: A Review. J. Microelectromech. Syst. 2014, 23, 259–275. [Google Scholar] [CrossRef]
- Blickfeld Gmbh. Crowd Analytics Privacy-Sensitive People Counting and Crowd Analytics. Available online: https://www.blickfeld.com/applications/crowd-analytics/ (accessed on 5 March 2023).
- Petit, F. Myths about LiDAR Sensor Debunked. Available online: https://www.blickfeld.com/de/blog/mit-den-lidar-mythen-aufgeraeumt-teil-1/ (accessed on 5 July 2022).
- Müller, M. The Blickfeld Scan Pattern: Eye-Shaped and Configurable September 2, 2020. Available online: Https://www.blickfeld.com/blog/scan-pattern/ (accessed on 23 March 2022).
- Blickfeld Scan Pattern. Available online: https://docs.blickfeld.com/cube/latest/scan_pattern.html (accessed on 7 July 2022).
- Müller, M. LiDAR Explained – Understanding LiDAR Specifications and Performance. Available online: https://www.blickfeld.com/blog/understanding-lidar-specifications/#Range-Precision-and-Accuracy (accessed on 8 March 2023).
- Hexagon Metrology, Romer Absolute Arm, 2015. Available online: https://www.atecorp.com/atecorp/media/pdfs/data-sheets/hexagon-romer-absolute-arm-datasheet-1.pdf?ext=.pdf (accessed on 10 January 2023).
- JARI, Automated Driving Test Center (Jtown) 2022. Available online: https://www.jari.or.jp/en/contract_testing_equipment/facilities_equipment/jtown/ (accessed on 10 January 2023).
- Jekel, C. Obtaining Non-Linear Orthotropic Material Models for PVC-Coated Polyester via Inverse Bubble Inflation. Master’s Thesis, Stellenbosch University, Stellenbosch, South Africa, 2016. [Google Scholar]
- Harris, C.R.; Millman, K.J.; van der Walt, S.J.; Gommers, R.; Virtanen, P.; Cournapeau, D.; Wieser, E.; Taylor, J.; Berg, S.; Smith, N.J.; et al. Array programming with NumPy. Nature 2020, 585, 357–362. [Google Scholar] [CrossRef] [PubMed]
- Lang, S.; Murrow, G. The Distance Formula. In Geometry; Springer: New York, NY, USA, 1988; pp. 110–122. [Google Scholar]
- Leica Geosystem, Leica DISTO S910, 2022. Available online: https://www.leicadisto.co.uk/shop/leica-disto-s910/ (accessed on 26 March 2022).
- ASAM e.V. Open Simulation Interface (OSI) 2022. Available online: https://opensimulationinterface.github.io/open-simulation-interface/index.html (accessed on 30 June 2022).
- Shakarji, C. Least-squares fitting algorithms of the NIST algorithm testing system. J. Res. Natl. Inst. Stand. Technol. 1998, 103, 633–641. [Google Scholar] [CrossRef] [PubMed]
- Community, B.O. Blender—A 3D Modelling and Rendering Package, Stichting Blender Foundation, Amsterdam. 2018. Available online: http://www.blender.org (accessed on 10 November 2022).
- Swamidass, P.M. (Ed.) Mean Absolute Percentage Error (MAPE). In Encyclopedia of Production and Manufacturing Management; Springer: Boston, MA, USA, 2000; p. 462. [Google Scholar]
- Lang, A.H.; Vora, S.; Caesar, H.; Zhou, L.; Yang, J.; Beijbom, O. Pointpillars: Fast encoders for object detection from point clouds. In Proceedings of the IEEE/CVF Conference on Computer Vision and Pattern Recognition, Honolulu, HI, USA, 21–26 July 2017; pp. 12697–12705. [Google Scholar]
- Geiger, A.; Lenz, P.; Urtasun, R. Are we ready for autonomous driving? The KITTI vision benchmark suite. In Proceedings of the IEEE Conference on Computer Vision and Pattern Recognition, Providence, RI, USA, 16–21 June 2012; pp. 3354–3361. [Google Scholar]









| Parameters | Values |
|---|---|
| Typical application range | 1.5 m–75 |
| Range resolution | <1 |
| Range precision (bias-free RMS, 10 , 50% reflective target). The standard deviation of range precision is one , which means a coverage of 68.26% [34]. | <2 |
| FoV (H × V) | × |
| Horizontal resolution | – (user configurable) |
| Vertical resolution | 5–400 scan lines per frame (user configurable) |
| Frame rate | –50 (user configurable) |
| Laser wavelength | 905 |
| x (mm) | y (mm) | z (mm) | Reference Diameter (mm) | Measured Diameter (mm) | Diameter Error (mm) | |
|---|---|---|---|---|---|---|
| Cube 1 | 1.3 | 6672.1 | 125.5 | 200.9 | 201.2 | 0.3 |
| LiDAR FMU | 2.1 | 6672.4 | 121.2 | 200.0 | 200.1 | 0.1 |
| Target | No. of Points (1) | Reference Distance to Target (mm) | Measured Distance (mm) | Distance Error (mm) | MPE (mm) | Pass/Fail | |
|---|---|---|---|---|---|---|---|
| Cube 1 | Front sphere | 354 | 6680.0 | 6689.0 | 9.0 | 20.0 | Pass |
| Cube 1 | Back sphere | 358 | 6680.0 | 6686.3 | 6.3 | 20.0 | Pass |
| LiDAR FMU | Front sphere | 358 | 6680.0 | 6685.5 | 5.5 | 20.0 | Pass |
| LiDAR FMU | Back sphere | 358 | 6680.0 | 6685.5 | 5.5 | 20.0 | Pass |
| Test Position | Target | No. of Points (1) | Reference Distance to Target (mm) | Measured Distance (mm) | Distance Error (mm) | MPE (mm) | Pass/Fail | |
|---|---|---|---|---|---|---|---|---|
| Cube 1 | A | Left sphere | 326 | 5050.0 | 5056.2 | 6.2 | 20.0 | Pass |
| Cube 1 | A | Right sphere | 319 | 5050.0 | 5059.1 | 9.1 | 20.0 | Pass |
| LiDAR FMU | A | Left sphere | 327 | 5050.0 | 5055.7 | 5.7 | 20.0 | Pass |
| LiDAR FMU | A | Right sphere | 327 | 5050.0 | 5055.7 | 5.7 | 20.0 | Pass |
| Cube 1 | B | Top sphere | 321 | 5050.0 | 5058.2 | 8.2 | 20.0 | Pass |
| Cube 1 | B | Bottom sphere | 325 | 5050.0 | 5057.3 | 7.3 | 20.0 | Pass |
| LiDAR FMU | B | Top sphere | 322 | 5050.0 | 5055.9 | 5.9 | 20.0 | Pass |
| LiDAR FMU | B | Bottom sphere | 323 | 5050.0 | 5055.8 | 5.8 | 20.0 | Pass |
| Cube 1 | C | Top sphere | 338 | 5050.0 | 5059.3 | 9.3 | 20.0 | Pass |
| Cube 1 | C | Bottom sphere | 343 | 5050.0 | 5058.8 | 8.8 | 20.0 | Pass |
| LiDAR FMU | C | Top sphere | 340 | 5050.0 | 5055.6 | 5.6 | 20.0 | Pass |
| LiDAR FMU | C | Bottom sphere | 339 | 5050.0 | 5055.8 | 5.8 | 20.0 | Pass |
| Cube 1 | D | Top sphere | 333 | 5050.0 | 5058.1 | 8.1 | 20.0 | Pass |
| Cube 1 | D | Bottom sphere | 332 | 5050.0 | 5057.8 | 7.8 | 20.0 | Pass |
| LiDAR FMU | D | Top sphere | 336 | 5050.0 | 5055.4 | 5.4 | 20.0 | Pass |
| LiDAR FMU | D | Bottom sphere | 338 | 5050.0 | 5055.2 | 5.2 | 20.0 | Pass |
| Test Position | Target | No. of Points (1) | Reference Distance to Target (mm) | Measured Distance (mm) | Distance Error (mm) | MPE (mm) | Pass/Fail | |
|---|---|---|---|---|---|---|---|---|
| Cube 1 | A | Center sphere | 332 | 5050.0 | 5057.7 | 7.7 | 20 | Pass |
| Cube 1 | A | Left sphere | 323 | 5050.0 | 5058.3 | 8.3 | 20 | Pass |
| LiDAR FMU | A | Center sphere | 339 | 5050.0 | 5055.7 | 5.7 | 20 | Pass |
| LiDAR FMU | A | Left sphere | 325 | 5050.0 | 5055.9 | 5.9 | 20 | Pass |
| Cube 1 | B | Top sphere | 319 | 5050.0 | 5058.2 | 8.2 | 20 | Pass |
| Cube 1 | B | Center sphere | 328 | 5000.0 | 5006.9 | 6.9 | 20 | Pass |
| LiDAR FMU | B | Top sphere | 323 | 5050.0 | 5055.5 | 5.5 | 20 | Pass |
| LiDAR FMU | B | Center sphere | 331 | 5000.0 | 5005.4 | 5.4 | 20 | Pass |
| Cube 1 | C | Top sphere | 317 | 5000.0 | 5008.8 | 8.8 | 20 | Pass |
| Cube 1 | C | left sphere | 322 | 5050.0 | 5057.4 | 7.4 | 20 | Pass |
| LiDAR FMU | C | Top sphere | 323 | 5000.0 | 5005.7 | 5.7 | 20 | Pass |
| LiDAR FMU | C | Left sphere | 324 | 5050.0 | 5055.5 | 5.5 | 20 | Pass |
| Target Position | No. of Points (1) | Reference Distance to Target (mm) | Measured Distance (mm) | Distance Error (mm) | MPE (mm) | (mm) | Pass/Fail | |
|---|---|---|---|---|---|---|---|---|
| Cube 1 | AB | 451 | 2000.0 | 2005.7 | 5.7 | 20 | 1.5 | Pass |
| Cube 1 | AC | 290 | 3000.0 | 3005.7 | 5.7 | 20 | 1.7 | Pass |
| Cube 1 | AD | 208 | 4000.0 | 4007.3 | 7.3 | 20 | 1.8 | Pass |
| LiDAR FMU | AB | 462 | 2000.0 | 2005.5 | 5.5 | 20 | 1.1 | Pass |
| LiDAR FMU | AC | 298 | 3000.0 | 3005.5 | 5.4 | 20 | 0.6 | Pass |
| LiDAR FMU | AD | 217 | 4000.0 | 4005.5 | 5.4 | 20 | 0.3 | Pass |
| Target | Distance (m) | ODCS (%) | AOS (%) | |
|---|---|---|---|---|
| Cube 1 | Vehicle | 12.0 | 94.2 | 98.1 |
| Cube 1 | Vehicle | 15.5 | 92.8 | 97.7 |
| Cube 1 | Vehicle | 20.0 | 90.6 | 97.2 |
| LiDAR FMU | Vehicle | 12.0 | 95.3 | 98.8 |
| LiDAR FMU | Vehicle | 15.5 | 94.6 | 98.6 |
| LiDAR FMU | Vehicle | 20.0 | 93.3 | 98.5 |
Disclaimer/Publisher’s Note: The statements, opinions and data contained in all publications are solely those of the individual author(s) and contributor(s) and not of MDPI and/or the editor(s). MDPI and/or the editor(s) disclaim responsibility for any injury to people or property resulting from any ideas, methods, instructions or products referred to in the content. |
© 2023 by the authors. Licensee MDPI, Basel, Switzerland. This article is an open access article distributed under the terms and conditions of the Creative Commons Attribution (CC BY) license (https://creativecommons.org/licenses/by/4.0/).
Share and Cite
Haider, A.; Cho, Y.; Pigniczki, M.; Köhler, M.H.; Haas, L.; Kastner, L.; Fink, M.; Schardt, M.; Cichy, Y.; Koyama, S.; et al. Performance Evaluation of MEMS-Based Automotive LiDAR Sensor and Its Simulation Model as per ASTM E3125-17 Standard. Sensors 2023, 23, 3113. https://doi.org/10.3390/s23063113
Haider A, Cho Y, Pigniczki M, Köhler MH, Haas L, Kastner L, Fink M, Schardt M, Cichy Y, Koyama S, et al. Performance Evaluation of MEMS-Based Automotive LiDAR Sensor and Its Simulation Model as per ASTM E3125-17 Standard. Sensors. 2023; 23(6):3113. https://doi.org/10.3390/s23063113
Chicago/Turabian StyleHaider, Arsalan, Yongjae Cho, Marcell Pigniczki, Michael H. Köhler, Lukas Haas, Ludwig Kastner, Maximilian Fink, Michael Schardt, Yannik Cichy, Shotaro Koyama, and et al. 2023. "Performance Evaluation of MEMS-Based Automotive LiDAR Sensor and Its Simulation Model as per ASTM E3125-17 Standard" Sensors 23, no. 6: 3113. https://doi.org/10.3390/s23063113
APA StyleHaider, A., Cho, Y., Pigniczki, M., Köhler, M. H., Haas, L., Kastner, L., Fink, M., Schardt, M., Cichy, Y., Koyama, S., Zeh, T., Poguntke, T., Inoue, H., Jakobi, M., & Koch, A. W. (2023). Performance Evaluation of MEMS-Based Automotive LiDAR Sensor and Its Simulation Model as per ASTM E3125-17 Standard. Sensors, 23(6), 3113. https://doi.org/10.3390/s23063113


