Abstract
An optical sensor system based on wavelength modulation spectroscopy (WMS) was developed for atmospheric oxygen (O2) detection. A distributed feedback (DFB) laser with butterfly packaging was used to target the O2 absorption line at 760.89 nm. A compact multi-pass gas cell was employed to increase the effective absorption length to 3.3 m. To ensure the stability and anti-interference capability of the sensor in field measurements, the optical module was fabricated with isolation of ambient light and vibration design. A 1f normalized 2f WMS (WMS-2f/1f) technique was adopted to reduce the effect of laser power drift. In addition, a LabVIEW-based dual-channel lock-in amplifier was developed for harmonic detection, which significantly reduced the sensor volume and cost. The detailed detection principle was described, and a theoretical model was established to verify the effectiveness of the technique. Experiments were carried out to obtain the device’s sensing performances. An Allan deviation analysis yielded a minimum detection limit of 0.054% for 1 s integration time that can be further improved to 0.009% at ~60 s. Finally, the reliability and anti-interference capability of the sensor system were verified by the atmospheric O2 monitoring.
1. Introduction
Oxygen (O2) is one of the most common gases and plays an indispensable role in people’s daily lives, as well as in industrial production. For example, O2 in indoor and outdoor environments is closely related to people’s breathing. Low oxygen concentration in an environment can cause weakness, dizziness, and even loss of consciousness. Low oxygen levels can result from activity in certain workplace settings, such as mining or welding, where heavy machinery can deplete the oxygen supply. OSHA (the Occupational Safety and Health Administration) specifies that a hazardous atmosphere may include one where the O2 concentration is below 19.5% or above 23.5%, so O2 concentration monitoring is important for ensuring safety in confined spaces, such as coal mines and tunnels [1,2]. Thus, analyzing the oxygen levels in these settings is essential to ensuring the safety of individuals working in such environments. In metallurgy, energy, and other industrial fields, O2 is used as an accelerant that directly affects the combustion process. Measuring the O2 concentration can effectively improve the performance of the engine and reduce the emission of pollutants [3,4]. Furthermore, measuring O2 concentration in natural environments, including forests and oceans, can help identify changes in ecosystems, which may indicate pollution or other underlying issues.
O2 concentration detection can be achieved through various methods, including the electrochemical method [5], gas chromatography [6], and optical methods. In recent years, optical-based measurement methods have garnered increased attention from researchers. Compared with traditional O2 detection methods, such as electrochemical method, gas chromatography, optical methods including optical absorption spectroscopy, quartz-enhanced photoacoustic spectroscopy (QEPAS) [7,8], and magnetic rotation spectroscopy (MRS) [9,10,11] have the advantage of fast response, non-contact measurement, and long life, making these methods suitable for online O2 monitoring. Tunable diode laser absorption spectroscopy (TDLAS) is an optical absorption spectroscopy employed in many fields due to its low cost, simple structure, and high sensitivity [12,13,14]. Some examples of O2 concentration measurement using TDLAS include the following. In 2009, Zhang S A et al. used a DFB laser as a light source to detect O2 with an absorption line near 760 nm by TDLAS combined with wavelength modulation spectroscopy (TDLAS-WMS), realizing a detection accuracy of 1000 ppmv [15]. In 2017, an O2 sensor system was proposed by Zhou X et al. with a cubic diffusion integral cavity as the gas absorption cell to increase the absorption optical path length, and a detection limit of 350 ppmv was achieved by the measurement of O2 absorption line at 764.38 nm [16]. In 2022, Luo Q W et al. proposed an effective interference fringe suppression method based on machine learning, which has been applied to the measurement of O2 concentration in medical bottles to achieve an average absolute inversion error of 0.57% [17].
Compared with directly using the second harmonic signal (2f) for concentration inversion, 1f-normalized 2f-wavelength modulation spectroscopy (WMS-2f/1f) has stronger anti-interference to the fluctuations of light intensity and adapts better to harsh environments. The WMS-2f/1f technology was developed by Rieker G B and co-workers [18] and was adopted by many other researchers [19,20]. In 2014, Neethu S et al. established an experimental set-up and measured O2 using three methodologies: (i) using only the second harmonic; (ii) using the second and fourth harmonics; and (iii) using the first and second harmonics. The advantages of the third technique in resisting laser intensity variations were proved [21]. Li C G et al. designed a dense multi-pass gas cell with an optical path of 54.6 m and raised the minimum detection limit (MDL) of ethane to 239 pptv using WMS-2f/1f technology in 2016 [22]. In 2017, He Q X et al. designed a near-infrared methane detection system with a hollow-core photonic crystal fiber (HC-PCF) as a gas absorption cell, which achieved an MDL of 8.7 ppmv in an average time of 0.1 s [23]. In 2019, Guo X Q et al. developed a portable ammonia sensor, which used the absorption line of 1500 nm to measure the concentration of ammonia, and the MDL could reach 0.16 ppmv at 184 s [24]. More recently, in 2022, Zhang L W et al. introduced a device for detecting carbon monoxide in the exhaust pipeline of a furnace based on WMS-2f/1f technology and achieved an MDL of 1.299 ppmv [25]. However, most of the above systems were built on optical platforms, and the experiments were conducted in the laboratory. In addition, commercial lock-in amplifiers were used in these systems for signal extraction, which was difficult to integrate due to the large volume.
Although some studies have reported the use of WMS for O2 detection, to the best of our knowledge, few studies have employed WMS-2f/1f for this purpose. In this study, we reported on developing an O2 sensor system based on WMS-2f/1f technology using a 761 nm DFB laser. A compact multi-pass gas cell with a 3.3 m optical path length was used, and a dual-channel digital orthogonal lock-in amplifier was designed based on LabVIEW to extract the 1f signal and the 2f signal. The theory and simulation of WMS-2f/1f technology were introduced first, then the design details of the sensor system were described. The sensor performance, including linearity, stability, and detection limits, was evaluated by laboratory experiments. Finally, field experiments were conducted to verify the reliability and anti-interference ability of the sensor system.
2. Theory and Simulation
2.1. Theory of WMS-2f/1f Technology
According to the Beer-Lambert law, when a laser passes through a target gas with an optical path , the light intensity will decrease, which can be expressed as:
where and indicate the incident and outgoing light intensity, respectively; is the concentration of the gas; is the absorption coefficient of the corresponding gas: ; () is the line strength; (cm) is the line shape function; is the molecular density of the gas, where is the total pressure, is the Boltzmann constant, and is the temperature. Considering that collisional broadening plays a major role in the full-width at half-maximum (FWHM) at normal temperature and pressure, Lorentz lineshape is selected as the line shape function in this paper.
As , Equation (1) can be transformed into:
In wavelength modulation spectroscopy (WMS) technology, a low-frequency triangular driver signal and a high-frequency sinusoidal driver signal were generated to scan across the selected absorption line and suppress the background noise. After modulation, the frequency and light intensity can be expressed as [18,26]:
where is the center frequency of the laser; is the frequency modulation depth; is the phase of frequency modulation represents the light intensity after modulation; is average laser intensity over modulation period; and and are the linear and nonlinear light intensity modulation coefficients. Generally, is only 2, and the modulation coefficients of higher harmonics are small and can be ignored. The and represent the phase differences of the output light intensity before and after modulation; and , represents the modulation frequency of the high-frequency sinusoidal signal.
After Fourier expansion of the transmissivity , the following can be obtained:
Combined with Equation (5), the -th harmonic coefficient can be obtained:
When :
It can be seen that the harmonic components are in direct proportion to the gas concentration. The and components of the 2f signal can be obtained by an orthogonal lock-in amplifier (multiplying the absorbed signal with the cosine reference signal and the sine reference signal , respectively, and then pass the low pass filter):
Similarly, the and can be expressed as follows:
where is the conversion coefficient of photodetector, and the 1f signal can be obtained:
The expression of the WMS-2f/1f after deducting the background signal is as follows:
Since the harmonic expansion of Lorentz lineshape has even harmonic characteristics, the amplitude of the odd harmonic component is 0 at the center frequency, and low concentration gases, , and , are both far less than 1. Therefore, at the center frequency, the Equation (12) can be simplified as:
As can be concluded from Equation (13), the WMS-2f/1f method can effectively avoid the interference of laser intensity fluctuations, temperature drift, and pressure drift, thus improving the anti-interference of the system.
2.2. Selection of O2 Absorption Line
The main factors to be considered in the selection of an absorption line are the line strength, selectivity, and system cost [27]. O2 has a relatively strong absorption band near 760 nm. A spectral simulation of 5% O2 in this spectral range was conducted according to the HITRAN 2020 database [28] under a condition of 300 K, 1 atm, and 100 cm absorption length as depicted in Figure 1. Considering the sensor system should work normally in an atmospheric environment, the absorption of 0.038% carbon dioxide and 4.38% water vapor were also simulated. It can be seen that H2O and CO2 in ambient air produce little interference to the O2 detection in this wavelength, and the absorption line at 760.89 nm was selected as the optimal absorption line due to its strong line strength.
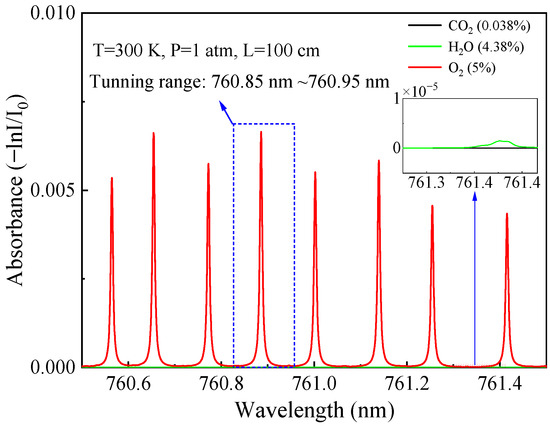
Figure 1.
HITRAN based absorption spectra of O2 (5%), H2O (4.38%), and CO2 (0.038%) in a spectral range from 760.5 nm to 761.5 nm for a 100 cm path length at a pressure of 1 atm. O2, H2O, and CO2 lines are shown in red, green, and black, respectively.
A DFB laser emitting at 761 nm was chosen as the laser light source. The tuning range of the laser was set to be 760.85 nm to 760.95 nm to scan across the optimal absorption line. According to the laser wavelength tuning experiment, the temperature and current tuning coefficient of the laser were 0.014 nm/mA and 0.06 nm/°C, respectively. In the experiment, the laser operating temperature was set to 40 °C, and the driving current was swept from 27 mA to 40 mA.
2.3. Simulation
In order to verify the feasibility of WMS-2f/1f technology and optimize the parameters of the system, a simulation model of the O2 sensor system was established by the MATLAB Simulink platform based on the WMS-2f/1f theory and the parameters of the selected absorption line. Next, the influence of concentration and modulation coefficients on the sensor output signals were simulated by the model.
In WMS, the modulation coefficient is defined as , where is the frequency modulation depth, and is the half-width at half-maximum (HWHM) of the gas sample absorption line. At the central frequency, the amplitude of the second harmonic coefficient is:
From Equation (14), it can be seen that the modulation coefficients () directly affect the amplitude of the second harmonic (). Using , it can be calculated that the largest second harmonic amplitude is at . In the simulation, the concentration was set to 1%, and was changed from 0.5 to 4. The waveform and amplitude of 2f signals under different modulation coefficients were simulated as depicted in Figure 2a,b. The largest 2f amplitude was obtained at , which is consistent with the theoretical value.
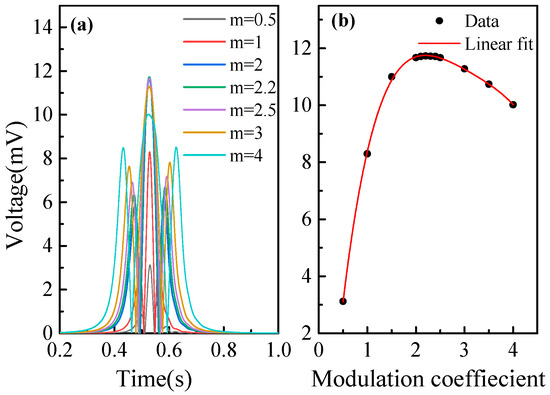
Figure 2.
(a) Simulated 2f signals at different modulation coefficients. (b) Simulated amplitude of the WMS-2f signals at different modulation coefficients.
The relationship between the 1f normalized 2f (WMS-2f/1f) signal and the O2 concentration was simulated under the condition of optimal modulation coefficients. The WMS-2f/1f signals with a concentration of 1~20% were obtained by the simulation model, then the relationship was fitted as shown in Figure 3. The correlation coefficient is >0.999, which indicates this method has good linearity.
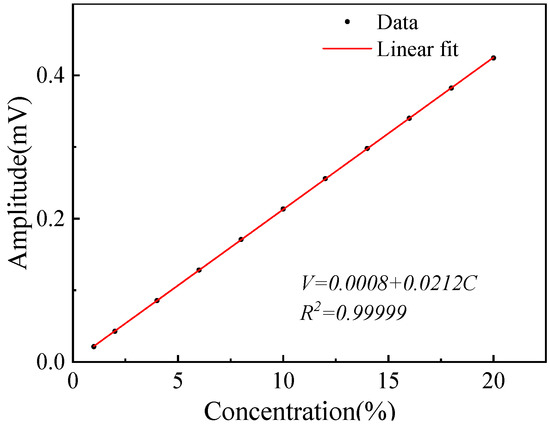
Figure 3.
Simulated amplitude of the WMS-2f/1f signals at different concentrations.
3. System Design
3.1. System Structure
The architecture of the O2 sensor system, depicted in Figure 4, is mainly composed of three modules: light source module, optical path transmission module, and signal processing module. In the light source module, the temperature of the DFB laser (Nanoplus, nominal power is ~5 mW) was stabilized by a temperature controller (Thorlabs, TED200C, Perth Amboy, NJ, USA). A low-frequency triangular signal (2 Hz) and a high-frequency sinusoidal signal (2 kHz) were generated and superimposed to a current driver (Thorlabs, LDC210C) to modulate the laser current. The DFB laser was connected to an optical isolator (Thorlabs, IO-F-780APC) to avoid the interference of the reflected light to the light source. Then the emitting light was collimated by a collimator (Thorlabs, F230APC-780). A flip mirror and two reflective mirrors (M1 and M2) were used to induce the laser and the reference light into a compact multi-pass gas cell (URAY-Herriott Cell). With 16 times reflection in the gas cell, an effective optical path of 3.3 m was obtained. The optical signal with O2 concentration information emitted from the multi-pass gas cell was focused to a photoelectric detector (Thorlabs, PDA100A2) and then processed in a computer with a DAQ card (National Instrument, USB-6211, Austin, TX, USA) and LabVIEW software platform. The dimensions of the optical path transmission module are 47 × 32 × 24 (length × width × height), the light source module has dimensions of 31 × 26 × 11 (length × width × height), and the signal processing module has dimensions of 33 × 23 × 3 (length × width × height). By selecting lasers and detectors of different wavelengths, it is possible to detect various other gases.
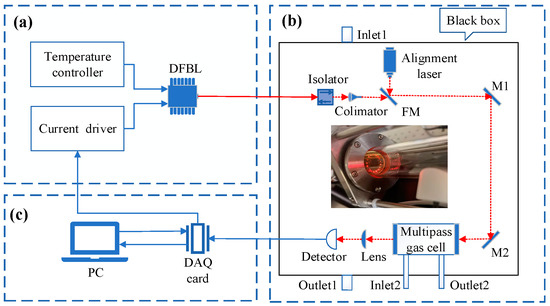
Figure 4.
The schematic diagram of the O2 detection system. (a) Light source module; (b) optical module; (c) data processing module. DFBL: distributed feedback laser, FM: flip mirror.
To achieve reliable and accurate ambient O2 detection in field environments, the sensor design incorporates the following measures. To reduce the effect of vibration in the environment, a switchable gain Silicon amplified detector with a large active area of 75.4 mm2 was selected. To reduce the interference of ambient O2 and the environmental light, the optical module was sealed and covered with black shade papers. Before measurement, the optical module was purged with pure nitrogen through Inlet 1, while air was discharged through Outlet 1. A vacuum pump (Kamoer, HLVP15, Shenzhen, China) was connected to Outlet 2 to pump gas into the gas cell, and a drying tube was connected to Inlet 2 to remove moisture from the gas sample.
3.2. LabVIEW-Based Data Processing and Signal Generation Platform
A LabVIEW-based platform was developed for data processing and laser driver signal generation. The function diagram of the platform was shown in Figure 5. The analog electronic signal generated by the detector was sent to the laptop through the analog-to-digital converter (ADC) module of the DAQ card. Then the collected digital signal was processed in the LabVIEW platform including harmonic extraction, filtering, and background signal fitting. The third order polynomial baseline fitting was conducted to reduce the influence of light intensity variation and waveform distortion. A dual-channel digital lock-in amplifier was developed for the extraction of 1f signal and 2f signal. Peak-to-peak amplitude of 2f signal was chosen and normalized by 1f signal to calculate the concentration. The signal generator module in LabVIEW was designed to generate a driver signal for laser current modulation. Simultaneously, the module produced a reference signal with the same frequency and phase as the driver signal, which serves for the harmonic extraction of the lock-in amplifier.
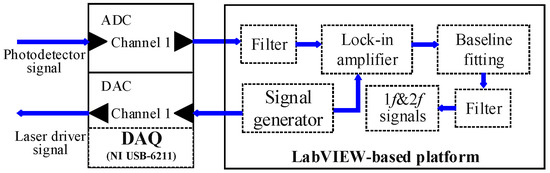
Figure 5.
Function diagram of the LabVIEW-based data processing and signal generation platform. ADC: analog-to-digital converter; DAC: digital-to-analog converter.
4. Sensor Performance
4.1. Modulation Amplitude Optimization
The experiments were conducted at pressure of 1 atm and temperature of 23 °C. The frequency of the triangular signal was 2 Hz. In order to scan across the selected absorption line at 760.89 nm, the amplitude of the triangular signal was set to 0.15 V. In order to determine the optimum modulation amplitude of the sensor system, experiments on different modulation amplitudes were conducted. Measured amplitude of the 2f signal versus the modulation amplitude were shown in Figure 6. It can be seen that the variation trend of 2f signal amplitude with modulation amplitude is consistent with the theoretical, and the maximum amplitude is ∼0.02 V. Thus, 0.02 V was selected as modulation amplitude.
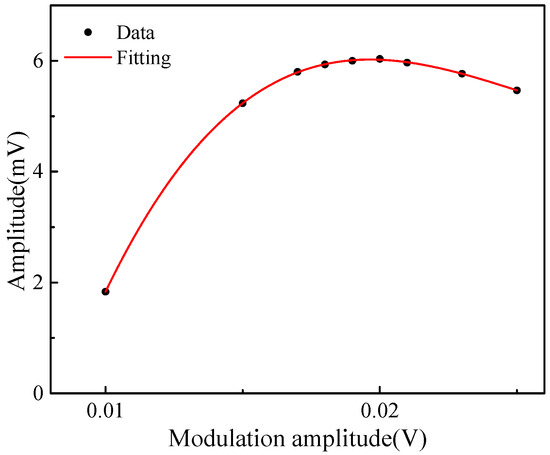
Figure 6.
Measured amplitude of the 2f signal versus the modulation amplitude.
4.2. Calibration and Fitting
O2 samples with different concentrations from 3.5% to 20.9% were prepared by mixing pure N2 with pure O2. The prepared gas samples were pumped into the multi-pass gas cell, and the extracted 1f and 2f signals were shown in Figure 7. As for the 3.5% O2 sample, the amplitude and noise level of 2f signals were roughly 1.206 mV and 2.02 µV. The SNR was calculated to be 27.06 dB. It can be seen that the maximum value of the 2f signal increases with the concentration levels, while the mean value of the 1f signal remains constant. Hence, the mean value of the 1f signal was used to normalize the 2f signal in the experiment to reduce the effect of laser power variations.
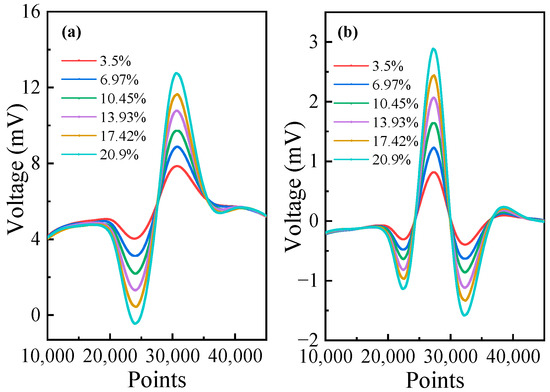
Figure 7.
The 1f and 2f signals at different O2 concentration levels. (a) 1f signals, (b) 2f signals.
When the concentration in the gas cell reaches a stable level, the ratio of maximum (2f)/mean (1f) was recorded for 50 s at a sampling frequency of 1 Hz, as shown in Figure 8a. Figure 8b shows the relationship between the ratio of maximum (2f)/mean (1f) and the concentration. After averaging the sampling data at each concentration, linear fitting was carried out, and the relationship was calculated as follows:
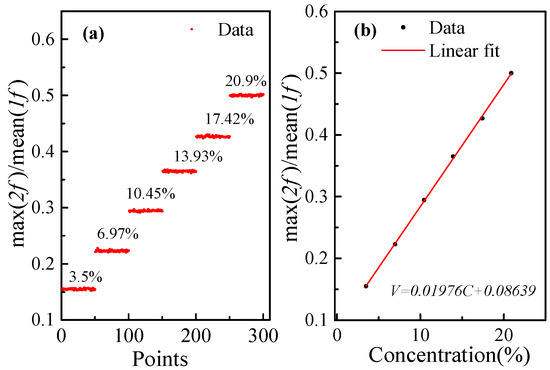
Figure 8.
(a) The 2f/1f signal amplitudes at different O2 concentration levels. (b) The linear fitting curve.
The square of the correlation coefficient of the fitting curve is .
4.3. Response Time and Stability
The response time mainly depends on the gas cell volume and the gas flow rate. In order to determine the response time of the designed sensor system, a pump was connected to the outlet of the 50 mL gas cell, and the pumping rate was set to 400 mL/min. The experiment was divided into two phases: in phase I, the O2 concentration was changed from 20.9% to 13.3% starting from point A; and in phase II, the O2 concentration was changed from 13.3% to 20.9% starting from point B. The variation trend of the measured concentration was shown in the Figure 9a. At the same time, a commercial electrochemical O2 detector (SAFEGAS, SKY6000, Shanghai, China) was connected in series with the gas cell for comparison, and the results are shown in Figure 9b. The concentration curve indicated that the designed sensor response time is ∼50 s for phase I and phase II, which is shorter than the commercial electrochemical O2 detector. The trends of the two sensors were consistent, a finding which also verifies the effectiveness of the designed sensor system.
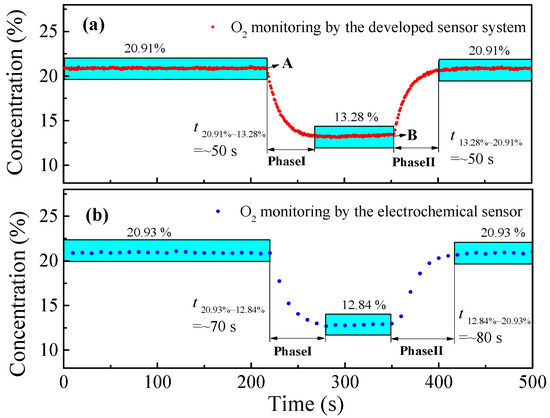
Figure 9.
Response time measurement result by varying O2 concentration levels. (a) Measured by the designed sensor. (b) Measured by the electrochemical sensor.
In order to test the stability of the system, measurements of an O2 sample with a concentration of 20.9% over time periods of ~2.2 h were performed. An amount of 8000 measured points was obtained as shown in Figure 10a. Allan variance analysis was performed to evaluate the MDL of the system. As shown in Figure 10b, the MDL is 0.054% under 1 s integration time. When the integration time reaches ~60 s, the optimal MDL is 0.009%.
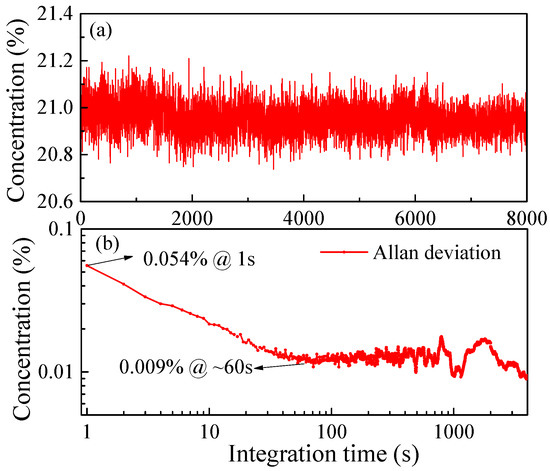
Figure 10.
(a) Stability test result. (b) Allan variance analysis for the sensor system.
5. Atmospheric O2 Detection
The designed sensor system was also evaluated for the detection of atmospheric O2 at the Beijing Jiaotong University. The optical module was sealed in a black box, which can effectively avoid the influence of ambient light. Indoor measurements were conducted in the Optoelectronic Science and Technology Laboratory. The measurements were conducted on 8 April, lasting for a total of seven hours, from 11 a.m. to 6 p.m. The summarized results of the measurements can be found in Figure 11a. The O2 concentration in an indoor environment exhibited relatively minor variations of 20.85~21.2% during the measurement. In outdoor measurement, the sensor system was mounted on a cart and placed outside the Optoelectronic Science and Technology Laboratory. The outdoor detection experiments were conducted on 9 and 10 April, each lasting for a period of seven hours, from 11 a.m. to 6 p.m. The results of these experiments can be found in Figure 11b,c, respectively. Compared with indoor monitoring, larger fluctuations in concentration levels were observed in the outdoor monitoring of O2.
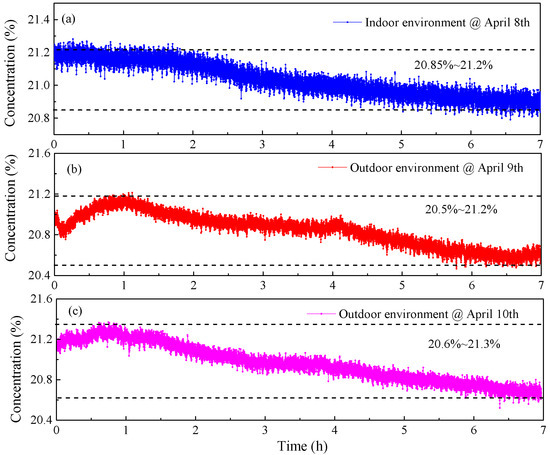
Figure 11.
(a) Measured concentrations of O2 in indoor environment. (b) Measured concentrations of O2 in outdoor environment on 9 April. (c) Measured concentrations of O2 in outdoor environment on 10 April.
6. Conclusions
In this paper, an O2 sensor system using multi-pass absorption spectroscopy and WMS-2f/1f technology was developed. A DFB laser with butterfly packaging was used to target the O2 absorption line located at 760.89 nm. A compact Herriott cell was used which can provide an effective optical path of 3.3 m. The optimum modulation amplitude was obtained, and sensor performance was evaluated by experiments. Based on Allan variance analysis, the MDL is 0.054% under 1 s integration time, which can be improved to 0.009% when the integration time reaches ~60 s. Table 1 listed the performance and parameters of O2 detection systems based on TDLAS technology in recent years. Upon comparison, it is evident that the system exhibits high sensitivity. Additionally, the dual-channel orthogonal lock-in amplifier, which was designed using LabVIEW, has effectively reduced the sensor system’s size and weight. This has made the system smaller, enabling easy measurement of O2 concentration in outdoor environments. Atmospheric O2 monitoring in indoor and outdoor environment on the Beijing Jiaotong University campus was conducted, and the results show that the designed system has good stability, anti-interference ability, and the ability to meet the requirements of long-term on-line monitoring of O2 in the environment.

Table 1.
Comparison of O2 detection systems based on TDLAS technology.
Author Contributions
Conceptualization, J.C., Q.H. and M.L.; Software, J.C. and Q.H.; Validation, J.C. and Q.H.; Data Curation, J.C. and M.L.; Writing-Original Draft Preparation, J.C.; Writing-Review & Editing, Q.H. and M.L.; Funding Acquisition, Q.H. All authors have read and agreed to the published version of the manuscript.
Funding
This work was supported by the National Natural Science Foundation of China (Nos. 61905009).
Institutional Review Board Statement
Not applicable.
Informed Consent Statement
Not applicable.
Data Availability Statement
The data presented in this study are available on request from the corresponding author.
Acknowledgments
The authors would like to acknowledge the financial supports from the National Natural Science Foundation of China (Nos. 61905009).
Conflicts of Interest
The authors declare no conflict of interest.
References
- 1910.146; Occupational Safety and Health Standards. U.S. Department of Labor: Washington, DC, USA, 2013.
- Smith, P.A.; Lockhart, B.; Besser, B.W.; Michalski, M.A. Exposure of unsuspecting workers to deadly atmospheres in below-ground confined spaces and investigation of related whole-air sample composition using adsorption gas chromatography. J. Occup. Environ. Hyg. 2014, 11, 800–808. [Google Scholar] [CrossRef]
- Wei, Y.B.; Chang, J.; Lian, J.; Liu, T.Y. Multi-point optical fibre oxygen sensor based on laser absorption spectroscopy. Optik 2015, 126, 2394–2397. [Google Scholar] [CrossRef]
- Inaba, T.; Saji, K. Low temperature operation of thin-film limiting-current type oxygen sensor using graded-composition layer electrodes. Photoacoustics 2008, 129, 874–880. [Google Scholar] [CrossRef]
- Lee, H.J.; Kim, H.M.; Park, J.H.; Lee, S.K. Fabrication and characterization of micro dissolved oxygen sensor activated on demand using electrolysis. Sens. Actuators B Chem. 2017, 241, 923–930. [Google Scholar] [CrossRef]
- Wei, Y.G.; Jiao, Y.S.; An, D.; Li, D.L.; Li, W.S.; Wei, Q. Review of dissolved oxygen detection technology: From laboratory analysis to online intelligent detection. Sensors 2019, 19, 3995. [Google Scholar] [CrossRef] [PubMed]
- Zheng, H.D.; Liu, Y.H.; Lin, H.Y.; Liu, B.; Gu, X.H.; Li, D.Q.; Huang, B.C.; Wu, Y.C.; Dong, L.P.; Zhu, W.G. Quartz-enhanced photoacoustic spectroscopy employing pilot line manufactured custom tuning forks. Photoacoustics 2020, 17, 100158. [Google Scholar] [CrossRef] [PubMed]
- Ma, Y.F.; Hong, Y.H.; Qiao, S.D.; Lang, Z.T.; Liu, X.N. H-shaped acoustic micro-resonator-based quartz-enhanced photoacoustic spectroscopy. Opt. Lett. 2022, 47, 601–604. [Google Scholar] [CrossRef] [PubMed]
- Zhang, E.J.; Brumfield, B.; Wysocki, G. Hybrid Faraday rotation spectrometer for sub-ppm detection of atmospheric O2. Opt. Express 2014, 22, 15957–15968. [Google Scholar] [CrossRef]
- Westberg, J.; Wysocki, G. Cavity ring-down Faraday rotation spectroscopy for oxygen detection. Appl. Phys. B 2017, 123, 168. [Google Scholar] [CrossRef]
- Brecha, R.J.; Pedrotti, L.M.; Krause, D. Magnetic rotation spectroscopy of molecular oxygen with a diode laser. JOSA B 1997, 14, 1921–1930. [Google Scholar] [CrossRef]
- Hodgkinson, J.; Tatam, R.P. Optical gas sensing: A review. Meas. Sci. Technol. 2012, 24, 012004. [Google Scholar] [CrossRef]
- Ren, W.; Luo, L.Q.; Tittel, F.K. Sensitive detection of formaldehyde using an interband cascade laser near 3.6 μm. Sens. Actuators B Chem. 2015, 221, 1062–1068. [Google Scholar] [CrossRef]
- Weldon, V.; O’Gorman, J.; Pérez-Camacho, J.J.; Hegarty, J.; Connolly, J.C.; Morris, N.A. Oxygen sensing using single-frequency DFB laser diodes at λ = 761 nm. Sens. Actuators B Chem. 1997, 42, 163–168. [Google Scholar] [CrossRef]
- Zhang, S.; Dong, F.; Zhang, Z.; Wang, Y.; Kan, R.; Zhang, Y.; Liu, J.; Liu, W. Monitoring of Oxygen Concentration Based on Tunable Diode Laser Absorption Spectroscopy. Spectrosc. Spect. Anal. 2009, 29, 2593–2596. [Google Scholar]
- Zhou, X.; Yu, J.; Wang, L.; Gao, Q.; Zhang, Z.G. Sensitive detection of oxygen using a diffused integrating cavity as a gas absorption cell. Sens. Actuators B Chem. 2017, 241, 1076–1081. [Google Scholar] [CrossRef]
- Luo, Q.; Zhou, J.; Li, W.; Yang, C.; Gui, W. Interference Fringe Suppression for Oxygen Concentration Measurement Using Adaptive Harmonic Feeding Generative Adversarial Network. IEEE Sens. J. 2021, 22, 2419–2429. [Google Scholar] [CrossRef]
- Rieker, G.B.; Jeffries, J.B.; Hanson, R.K. Calibration-free wavelength-modulation spectroscopy for measurements of gas temperature and concentration in harsh environments. Appl. Opt. 2009, 48, 5546–5560. [Google Scholar] [CrossRef]
- Du, Y.J.; Peng, Z.M.; Ding, Y.J. Wavelength modulation spectroscopy for recovering absolute absorbance. Opt. Express 2018, 26, 9263–9272. [Google Scholar] [CrossRef] [PubMed]
- Qu, Z.C.; Ghorbani, R.; Valiev, D.; Schmidt, F.M. Calibration-free scanned wavelength modulation spectroscopy–application to H2O and temperature sensing in flames. Opt. Express 2015, 23, 16492–16499. [Google Scholar] [CrossRef]
- Neethu, S.; Verma, R.; Kamble, S.S.; Radhakrishnan, J.K.; Krishnapur, P.P.; Padaki, V.C. Validation of wavelength modulation spectroscopy techniques for oxygen concentration measurement. Sens. Actuators B Chem. 2014, 192, 70–76. [Google Scholar] [CrossRef]
- Li, C.G.; Dong, L.; Zheng, C.T.; Tittel, F.K. Compact TDLAS based optical sensor for ppb-level ethane detection by use of a 3.34 μm room-temperature CW interband cascade laser. Sens. Actuators B Chem. 2016, 232, 188–194. [Google Scholar] [CrossRef]
- He, Q.X.; Dang, P.P.; Liu, Z.W.; Zheng, C.T.; Wang, Y.D. TDLAS–WMS based near-infrared methane sensor system using hollow-core photonic crystal fiber as gas-chamber. Opt. Quantum Electron 2017, 49, 115. [Google Scholar] [CrossRef]
- Guo, X.; Zheng, F.; Li, C.; Yang, X.; Li, N.; Liu, S.; Wei, J.; Qiu, X.; He, Q. A portable sensor for in-situ measurement of ammonia based on near-infrared laser absorption spectroscopy. Opt. Laser Eng. 2019, 115, 243–248. [Google Scholar] [CrossRef]
- Lewen, Z.; Zhirong, Z.; Qianjin, W.; Pengshuai, S.; Bian, W.; Tao, P.; Hua, X.; Sigrist, M.W. A sensitive carbon monoxide sensor for industrial process control based on laser absorption spectroscopy with a 2.3 μm distributed feedback laser. Opt. Laser Eng. 2022, 152, 106950. [Google Scholar] [CrossRef]
- Li, H.; Rieker, G.B.; Liu, X.; Jeffries, J.B.; Hanson, R.K. Extension of wavelength-modulation spectroscopy to large modulation depth for diode laser absorption measurements in high-pressure gases. Appl. Opt. 2006, 45, 1052–1061. [Google Scholar] [CrossRef] [PubMed]
- Wang, M.J.; Wang, D.; Lv, Y.; Li, P.Y.; Li, D.; Li, Y.S. In-situ laser detection of water vapor based on circular prism array multi-pass cell enhanced near-infrared absorption spectroscopy. Infrared Phys. Technol. 2021, 116, 103811. [Google Scholar] [CrossRef]
- Gordon, I.E.; Rothman, L.S.; Hargreaves, R.J.; Hashemi, R.; Karlovets, E.V.; Skinner, F.M.; Conway, E.K.; Hill, C.; Kochanov, R.V.; Tan, Y.; et al. The HITRAN2020 molecular spectroscopic database. J. Quant. Spectrosc. Radiat. Transf. 2022, 277, 107949. [Google Scholar] [CrossRef]
- Luo, Q.; Yang, C.; Song, C.; Zhou, J.; Gui, W. TDLAS/WMS embedded system for oxygen concentration detection of glass vials with variational mode decomposition. IFAC-Pap. 2020, 53, 11626–11631. [Google Scholar] [CrossRef]
- Jatana, G.S.; Perfetto, A.K.; Geckler, S.C.; Partridge, W.P. Absorption spectroscopy based high-speed oxygen concentration measurements at elevated gas temperatures. Sens. Actuators B Chem. 2019, 293, 173–182. [Google Scholar] [CrossRef]


Disclaimer/Publisher’s Note: The statements, opinions and data contained in all publications are solely those of the individual author(s) and contributor(s) and not of MDPI and/or the editor(s). MDPI and/or the editor(s) disclaim responsibility for any injury to people or property resulting from any ideas, methods, instructions or products referred to in the content. |
© 2023 by the authors. Licensee MDPI, Basel, Switzerland. This article is an open access article distributed under the terms and conditions of the Creative Commons Attribution (CC BY) license (https://creativecommons.org/licenses/by/4.0/).