
Echo-ID: Smartphone Placement Region Identification for Context-Aware Computing


Abstract
:1. Introduction
- We propose Echo-ID, a low-cost region identification system for providing contextual services that exploits FMCW as a sensing medium. Echo-ID is not limited to placement position and angle, adapts to environmental changes, and without requiring any additional sensors or pre-installed infrastructure.
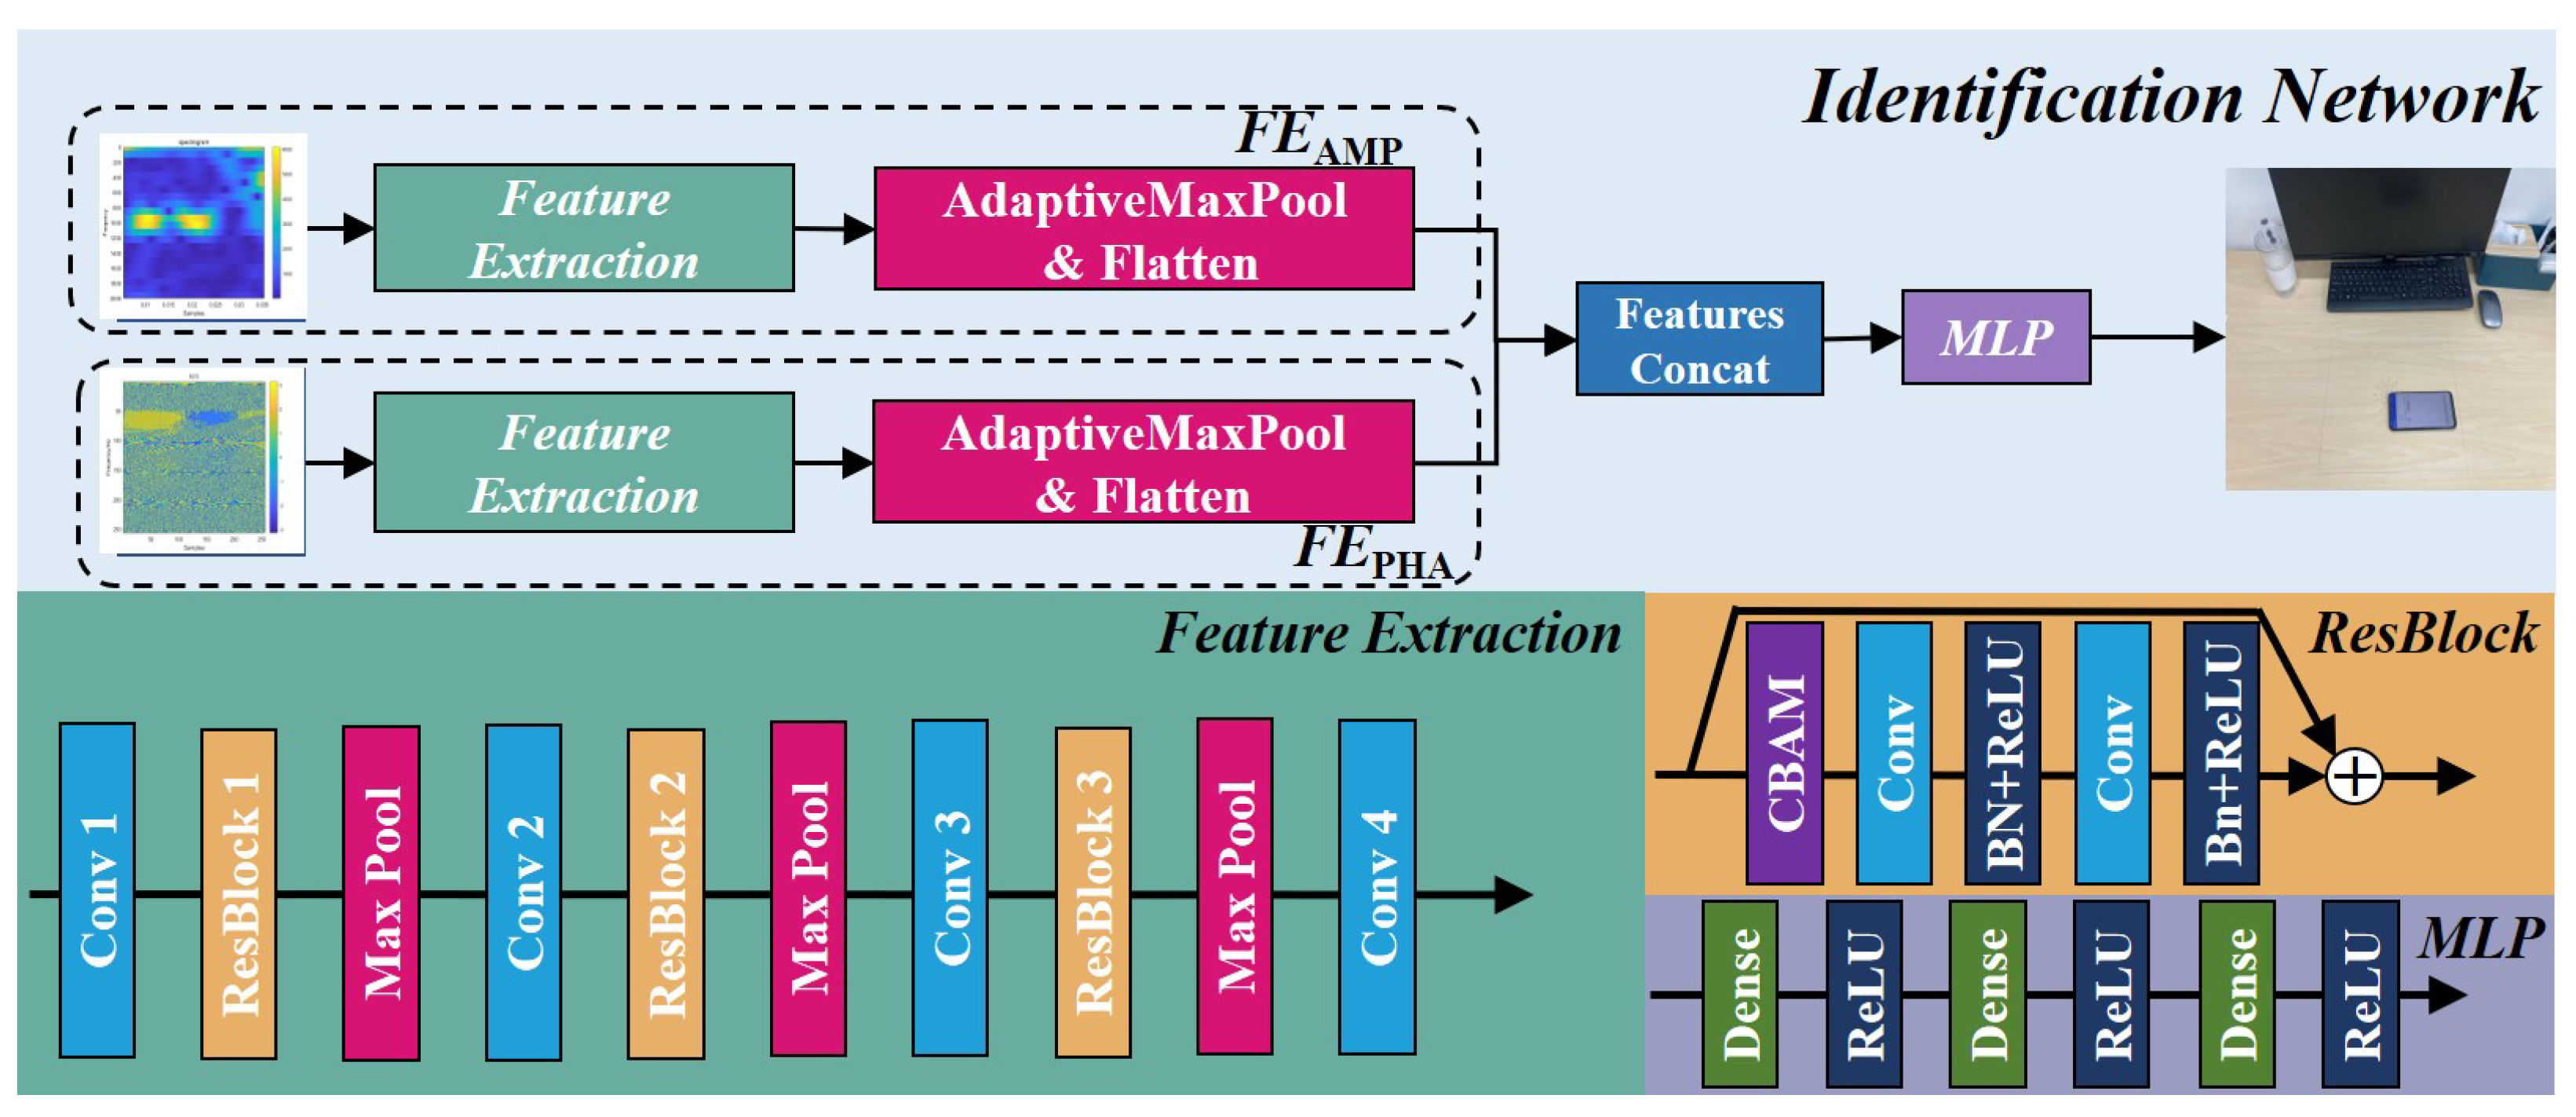
- Based on the extraction of spatial properties of surrounding reflective objects of the target region, we design a region identification model incorporating residual networks, attention mechanisms, and multi-layer perceptron to enable Echo-ID to achieve high accuracy in region recognition under the constraints of arbitrary placement of smartphones and dynamic nature of the surrounding environment.
- We implement Echo-ID on the Android platform and evaluate it with Xiaomi 12 Pro and Honor-10 smartphones, demonstrating its usability and robustness through extensive experiments.
2. Preliminaries
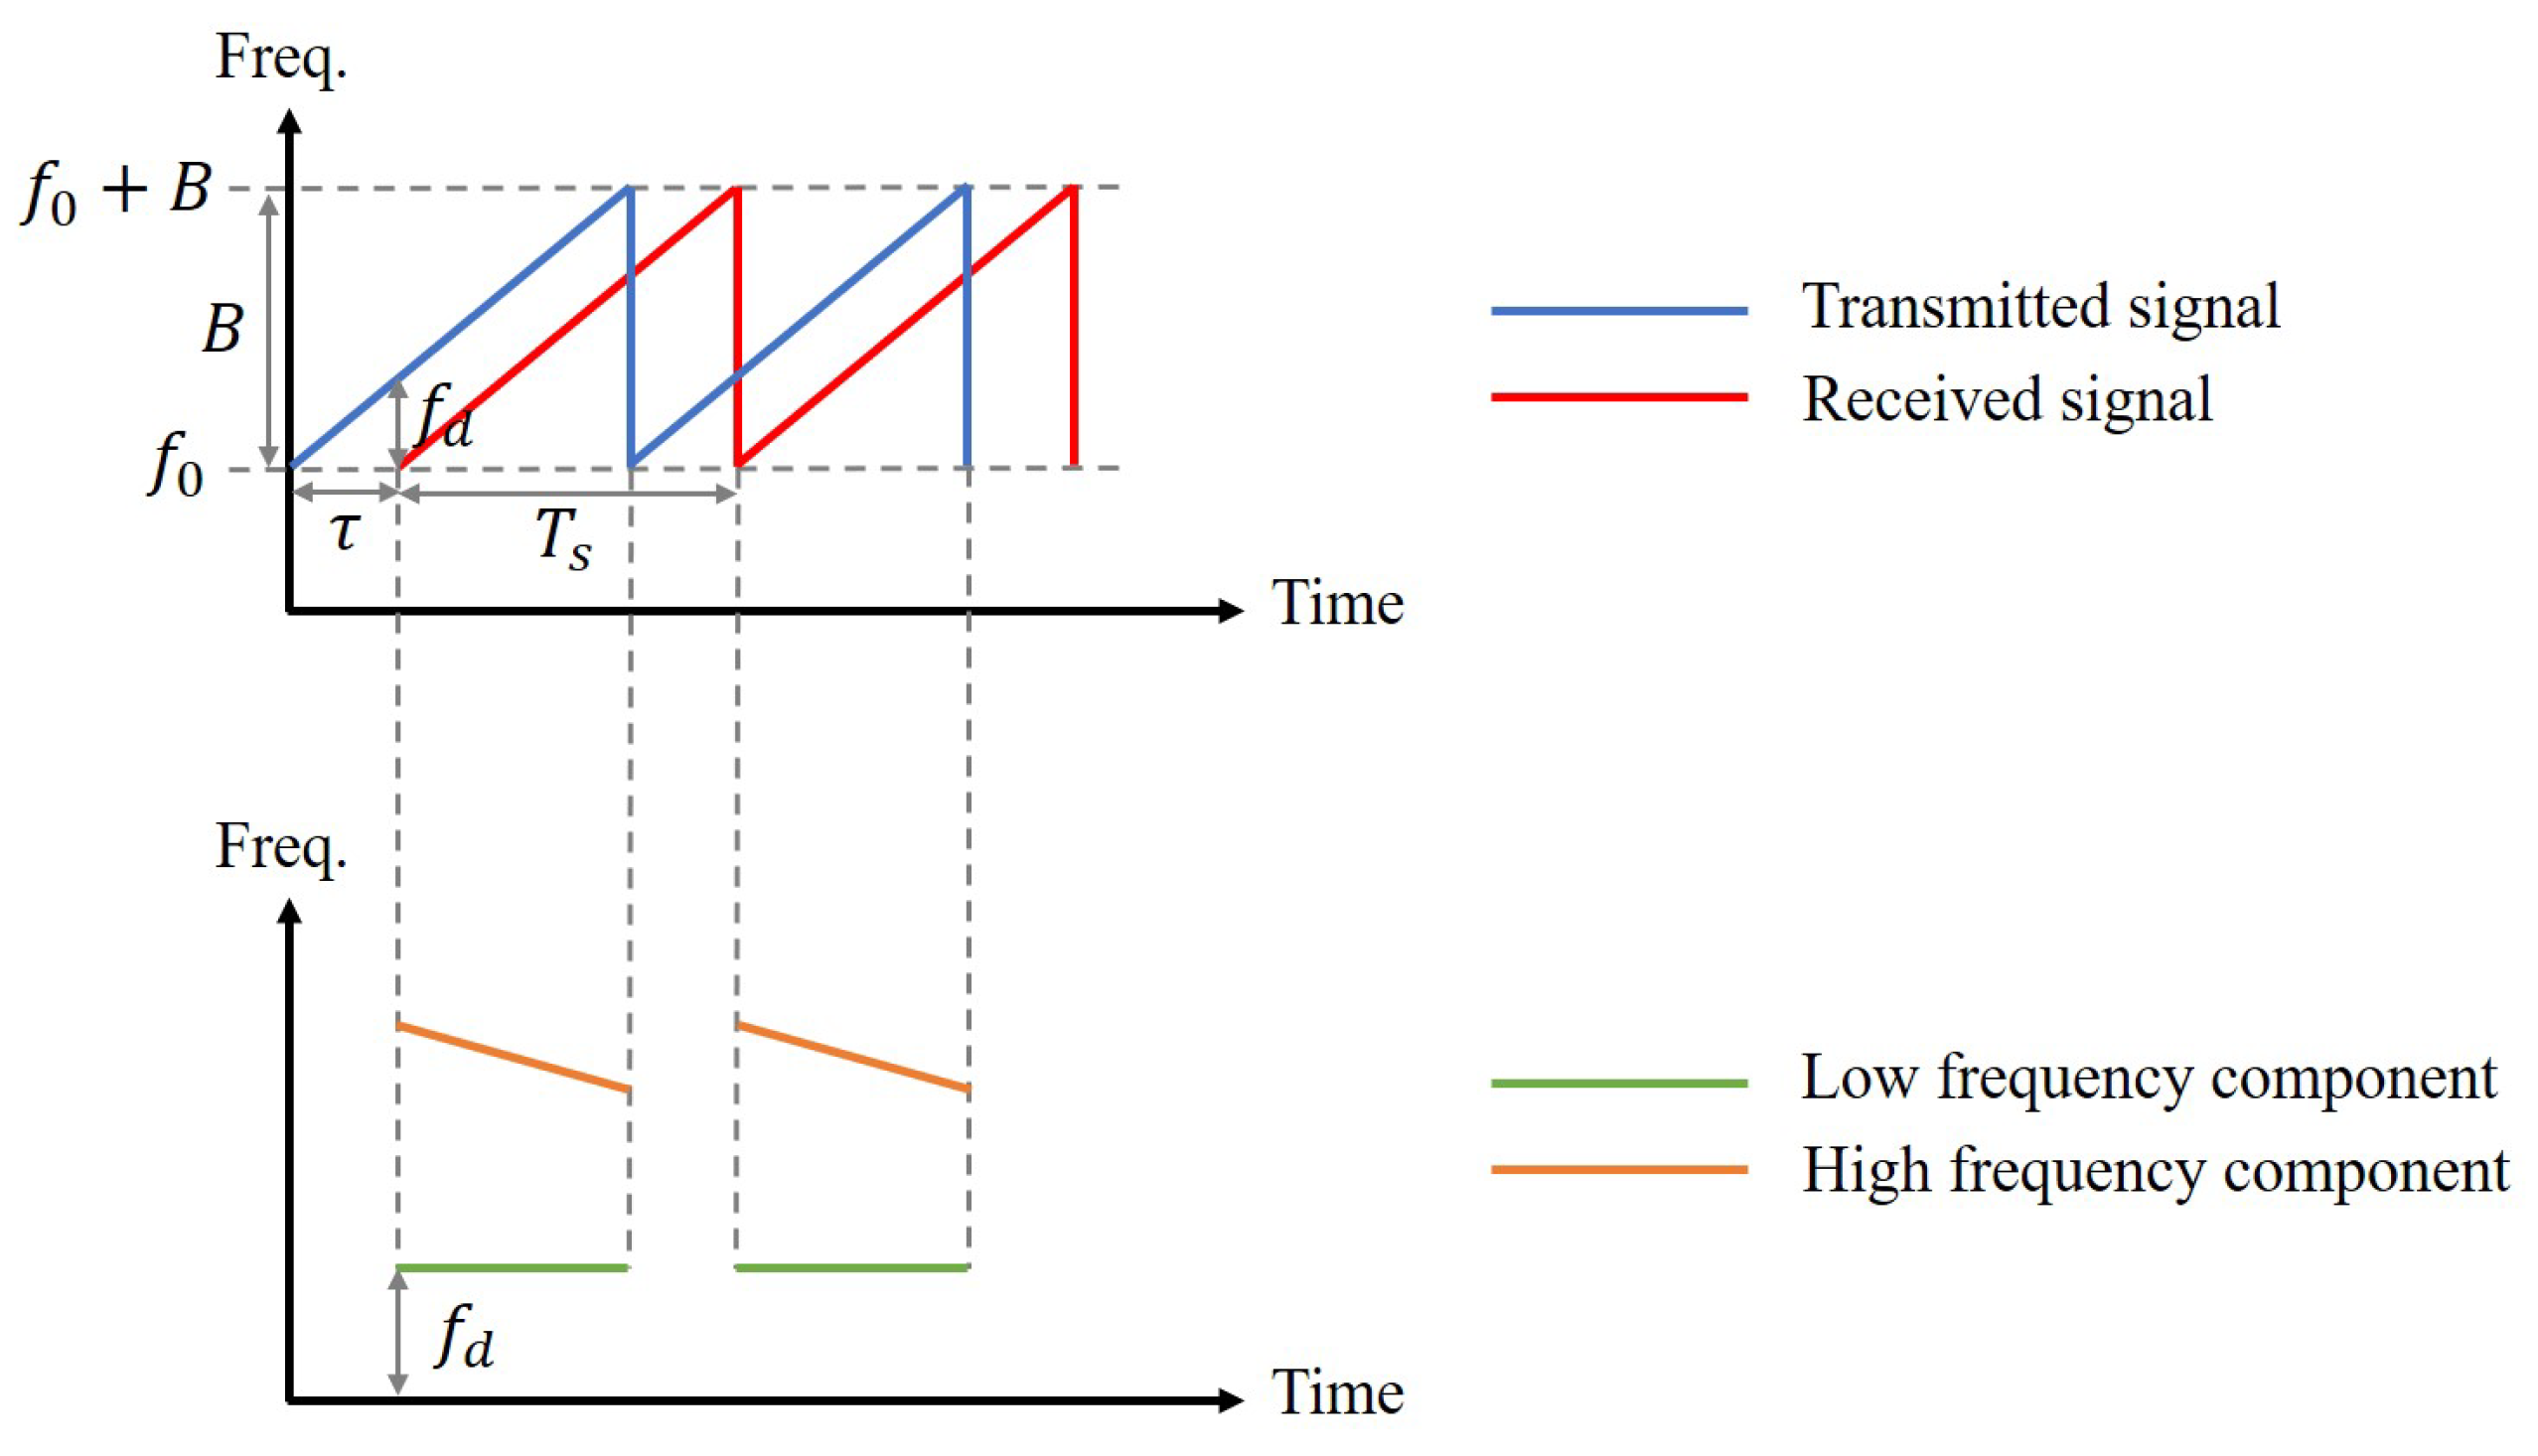
2.1. FMCW Fundamentals
2.2. Ranging Model
2.3. Multi-Target Range
3. System Design
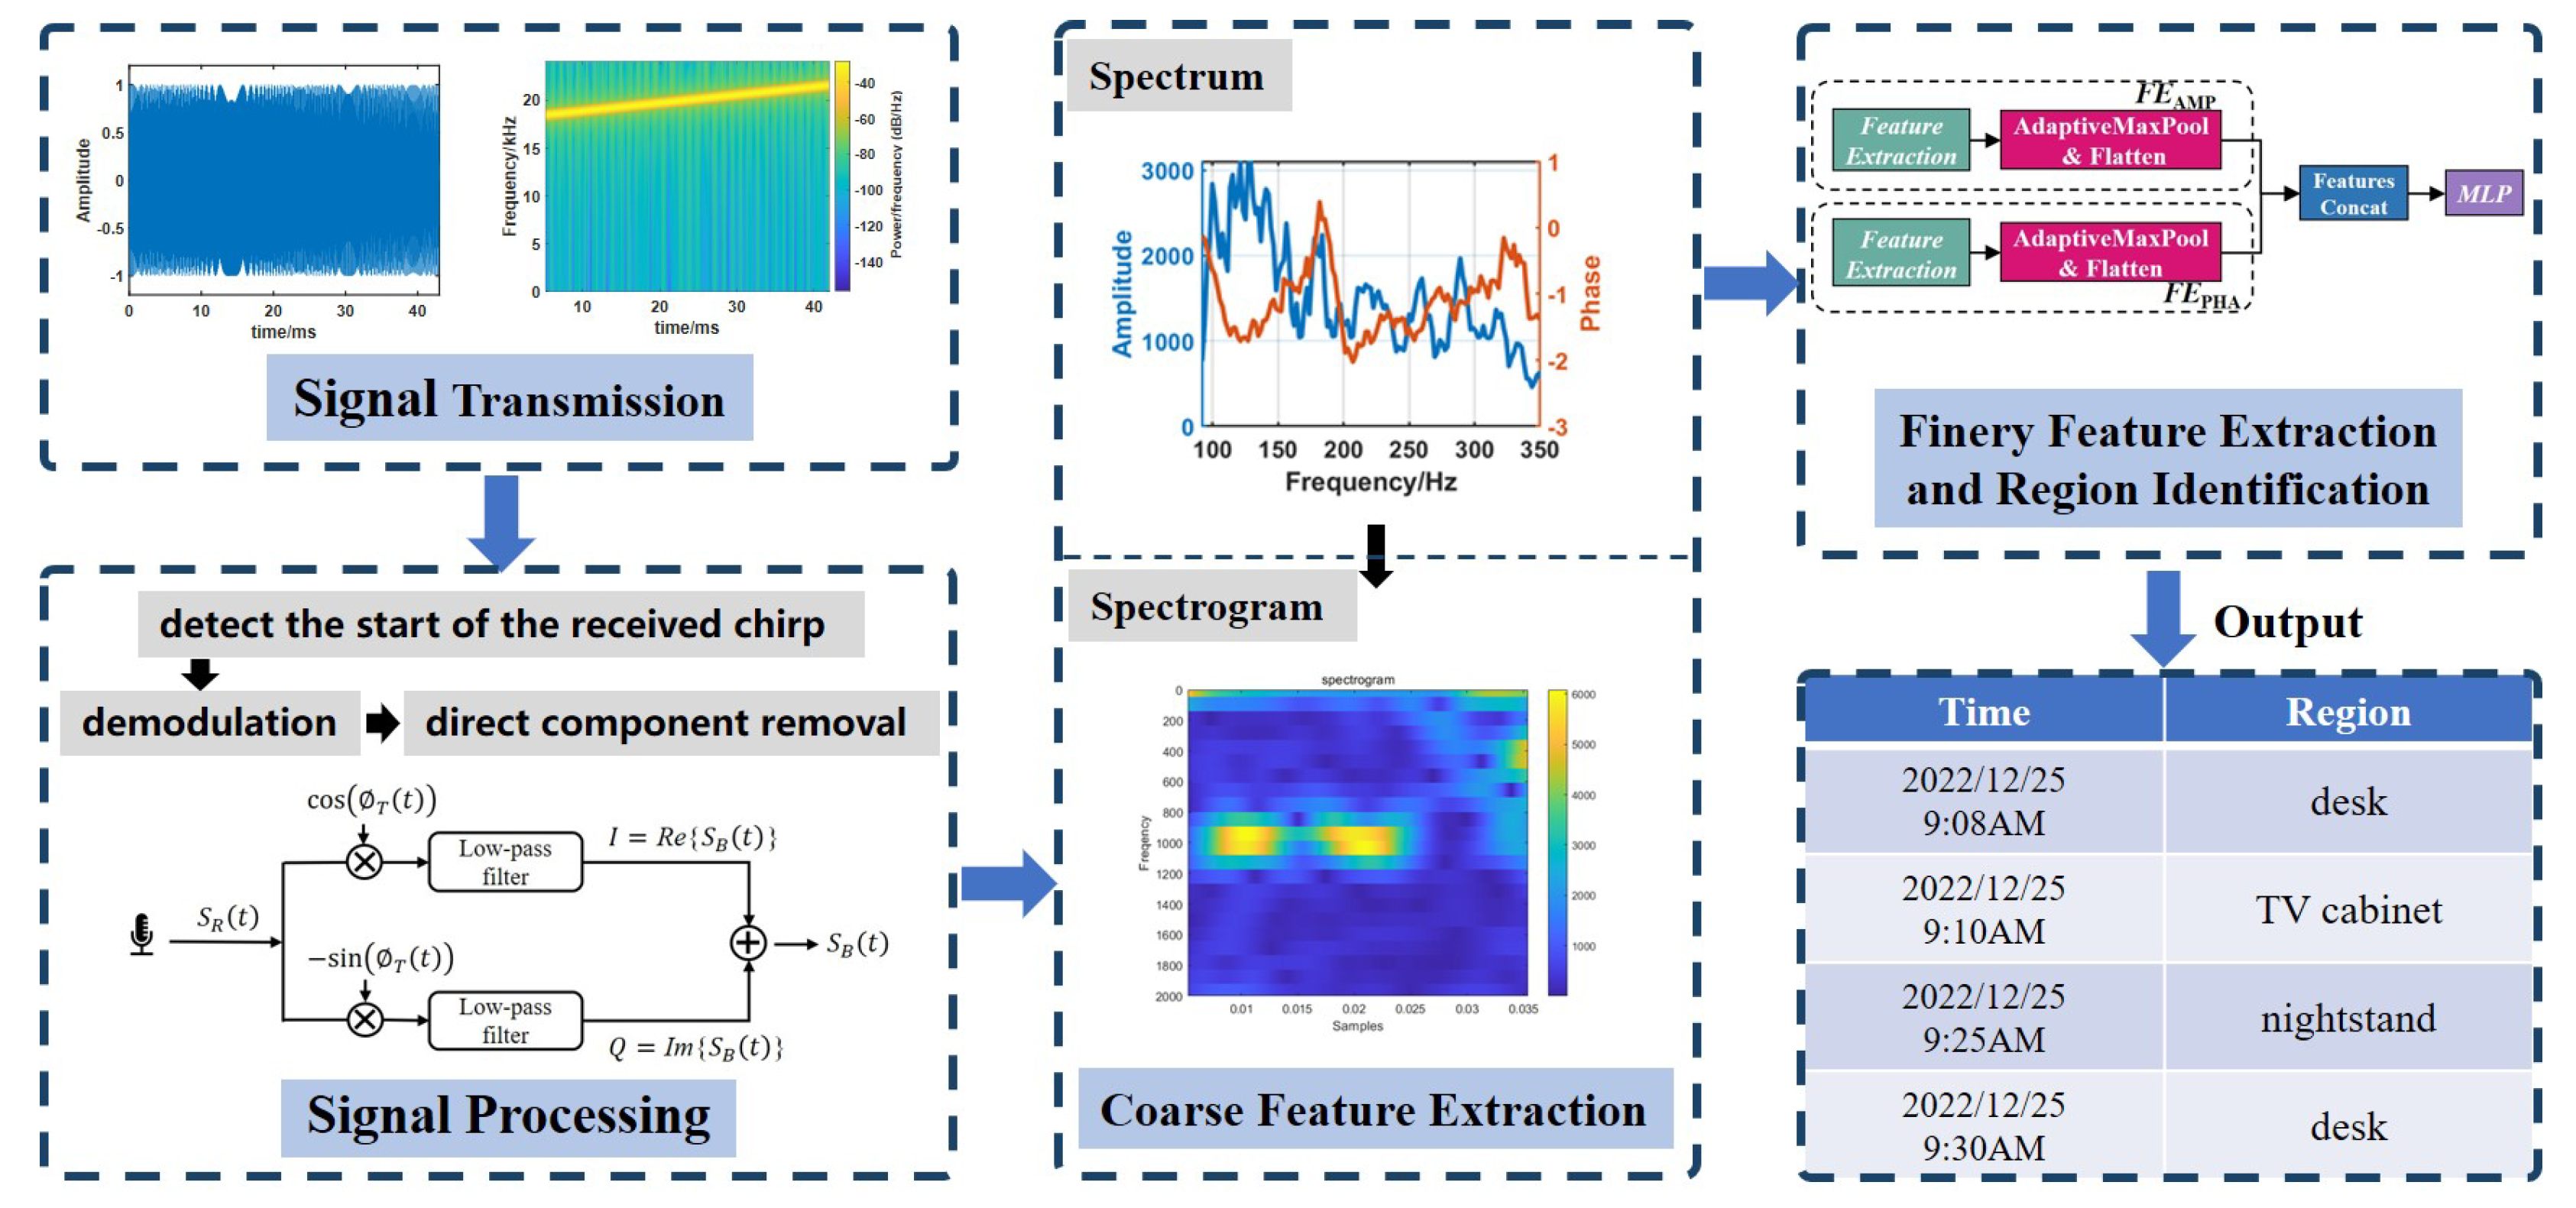
3.1. System Overview
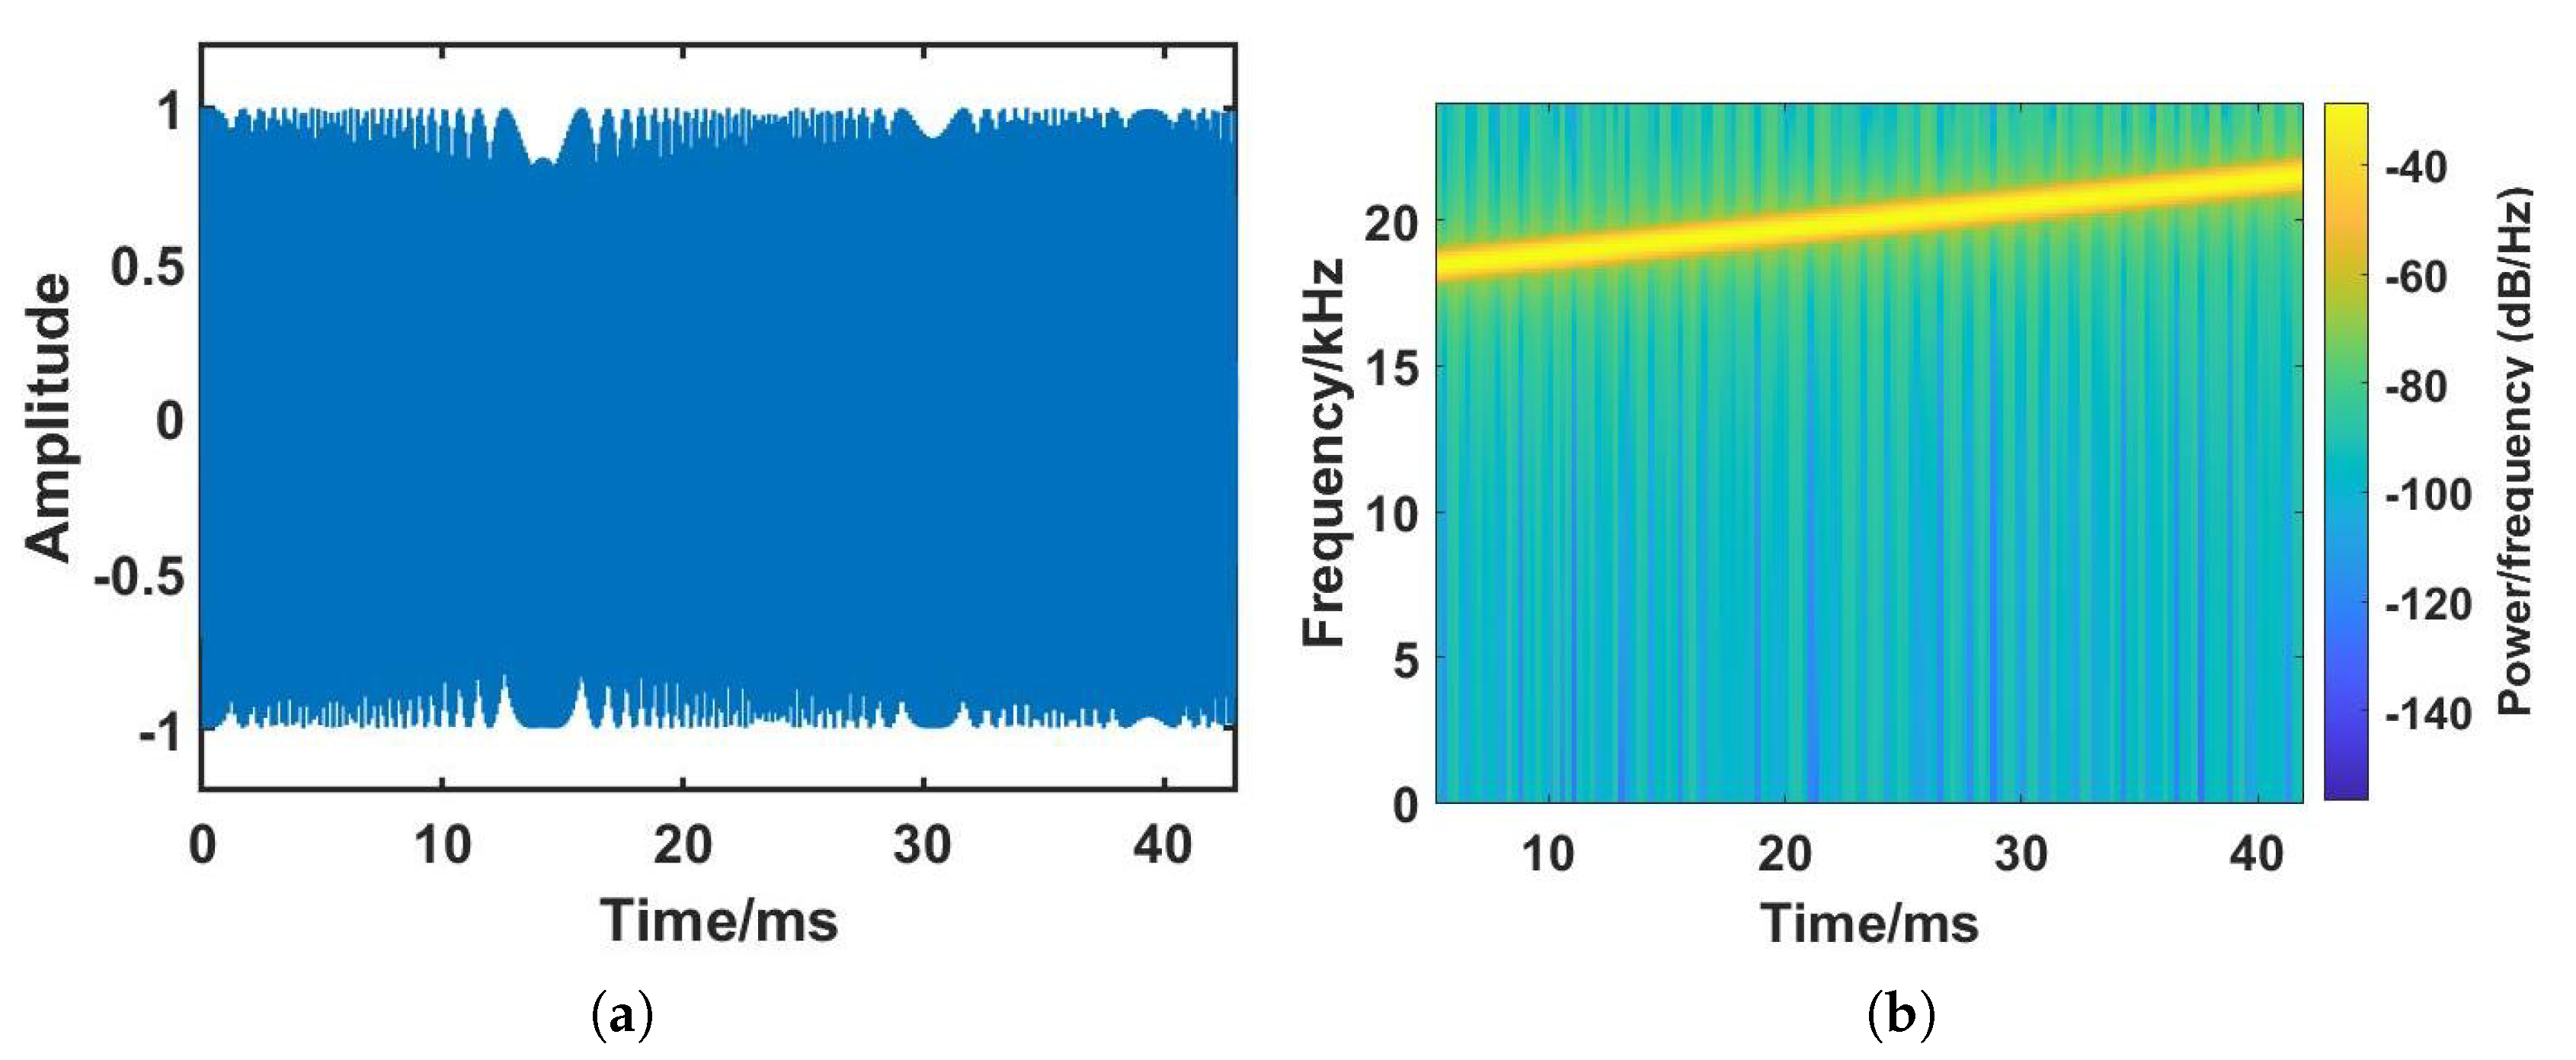
3.2. Signal Transmission
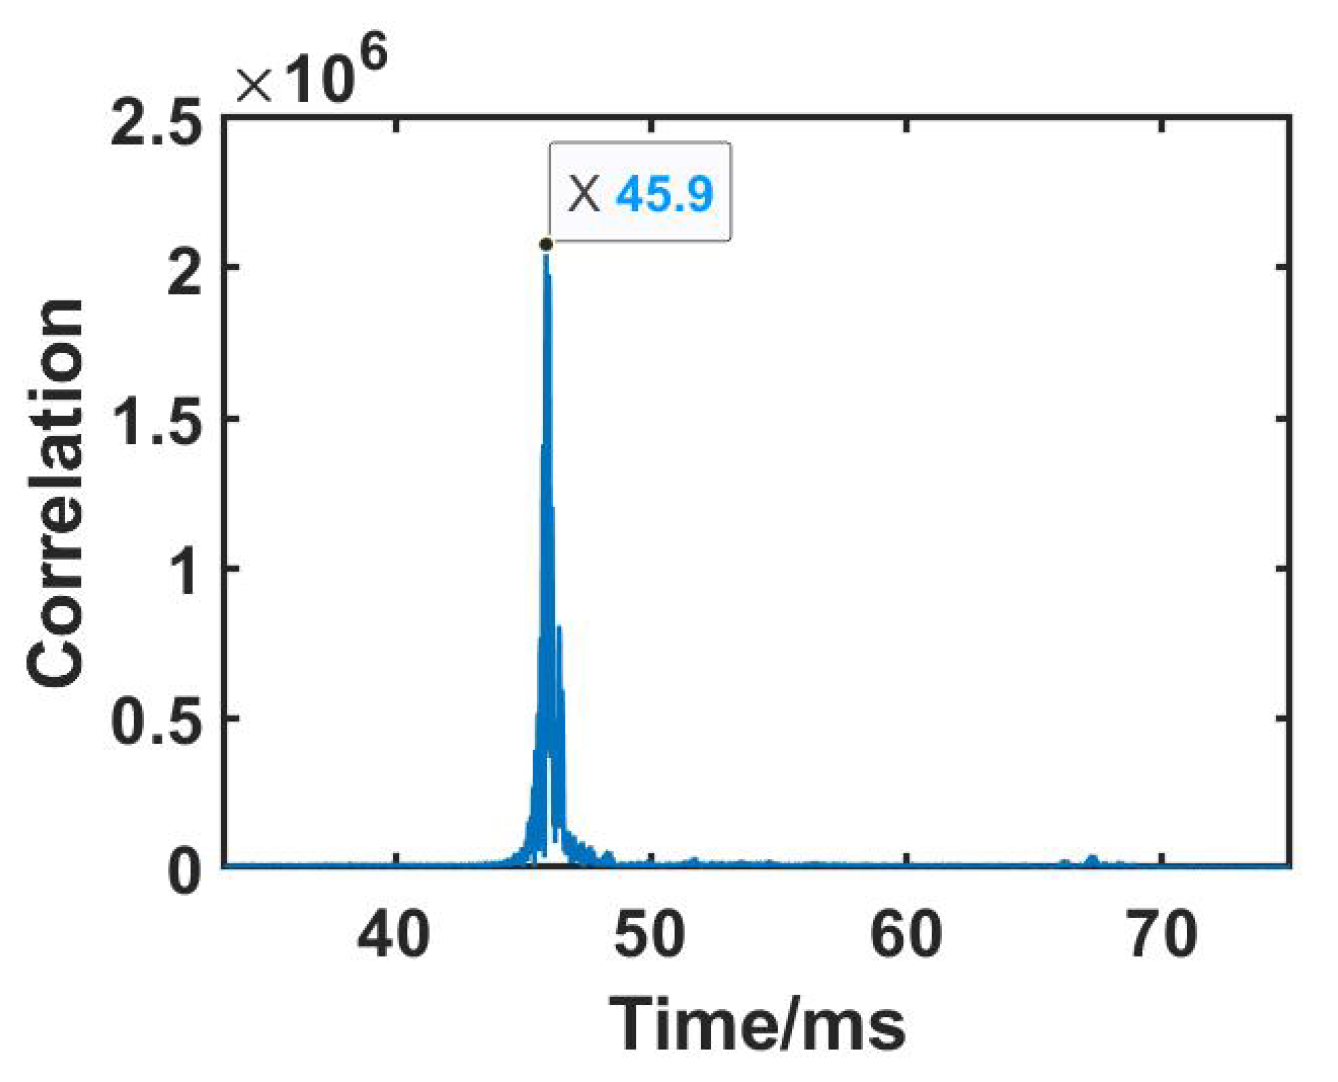
3.3. Signal Processing
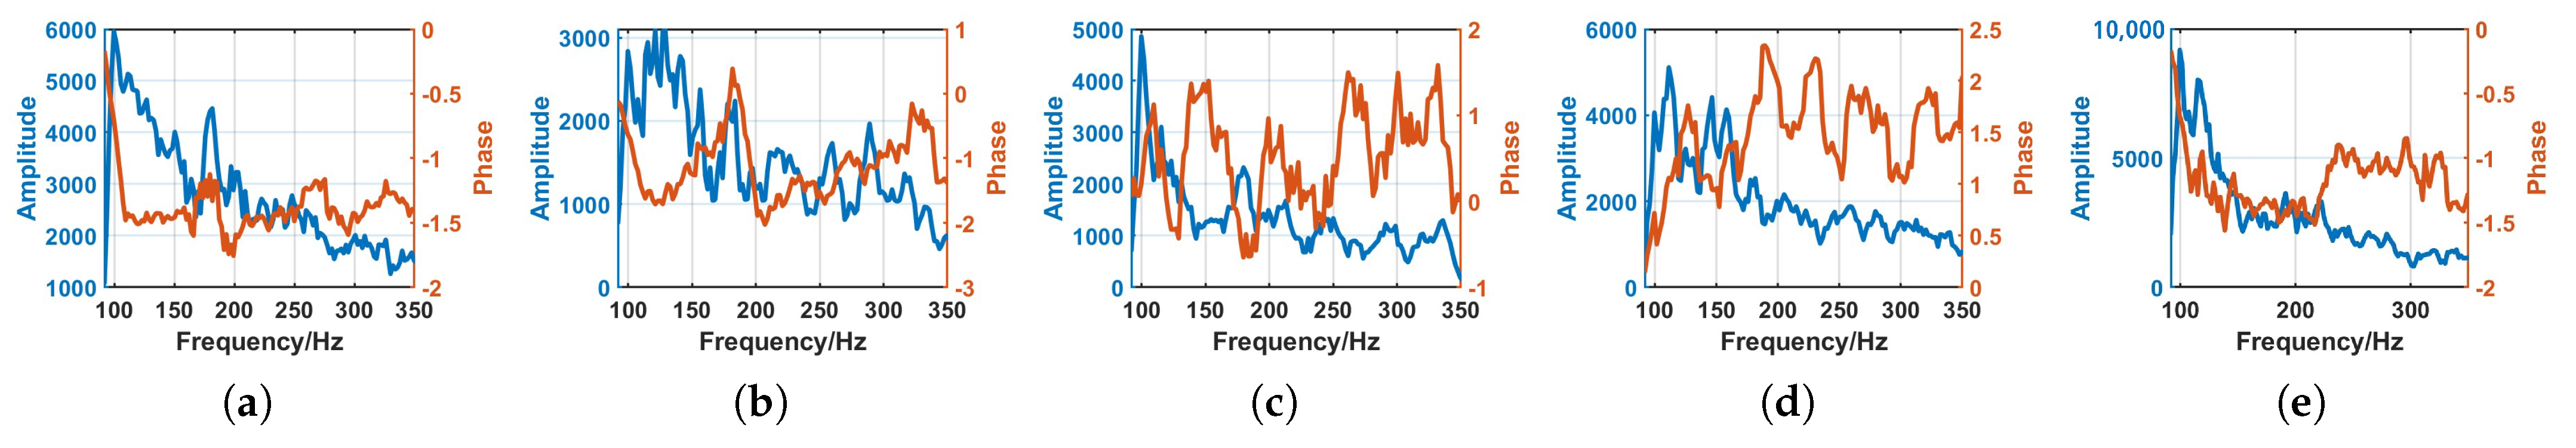
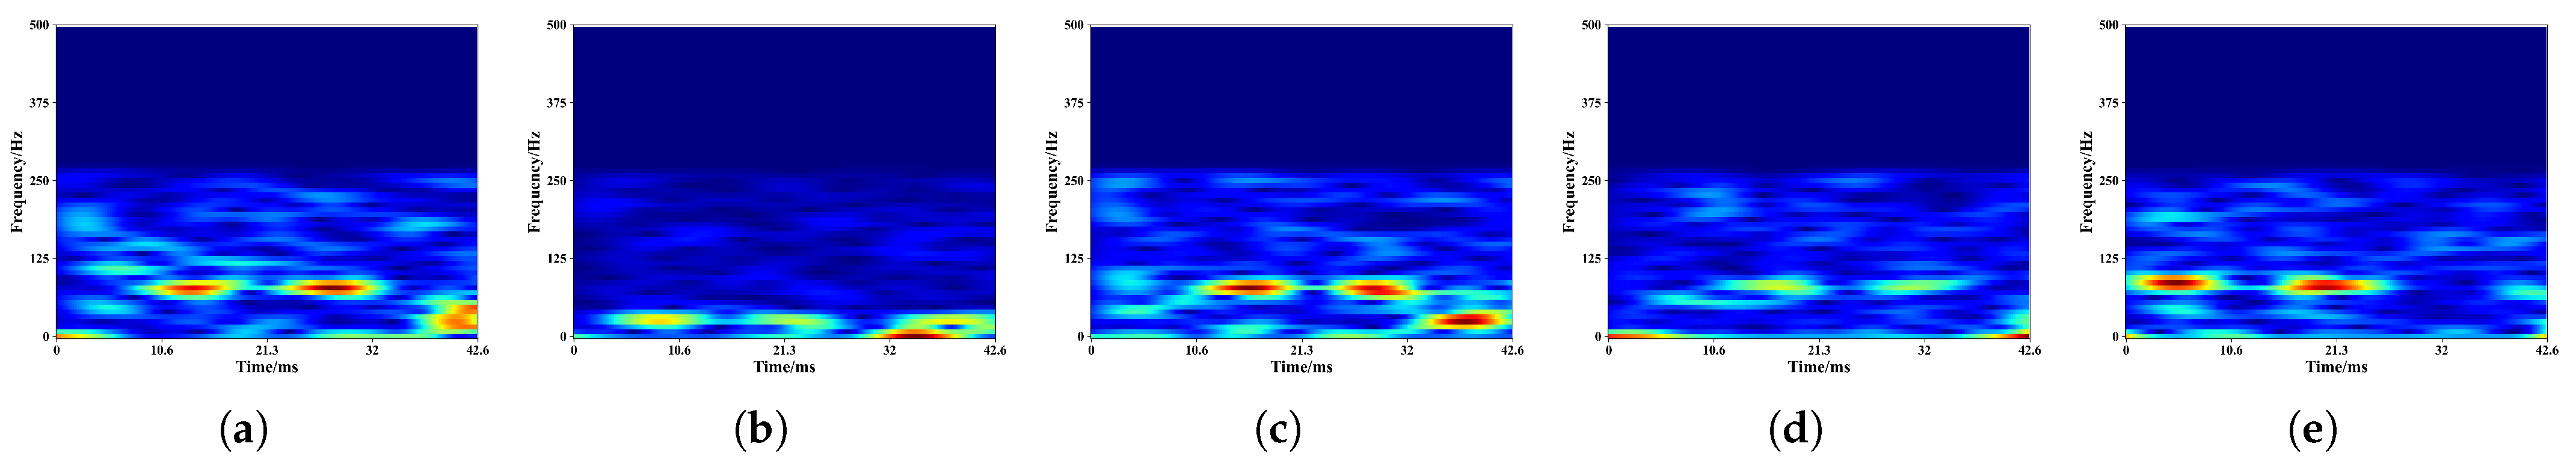
3.4. Coarse Feature Extraction
3.5. Deep Learning Model
4. Experiment and Evaluation
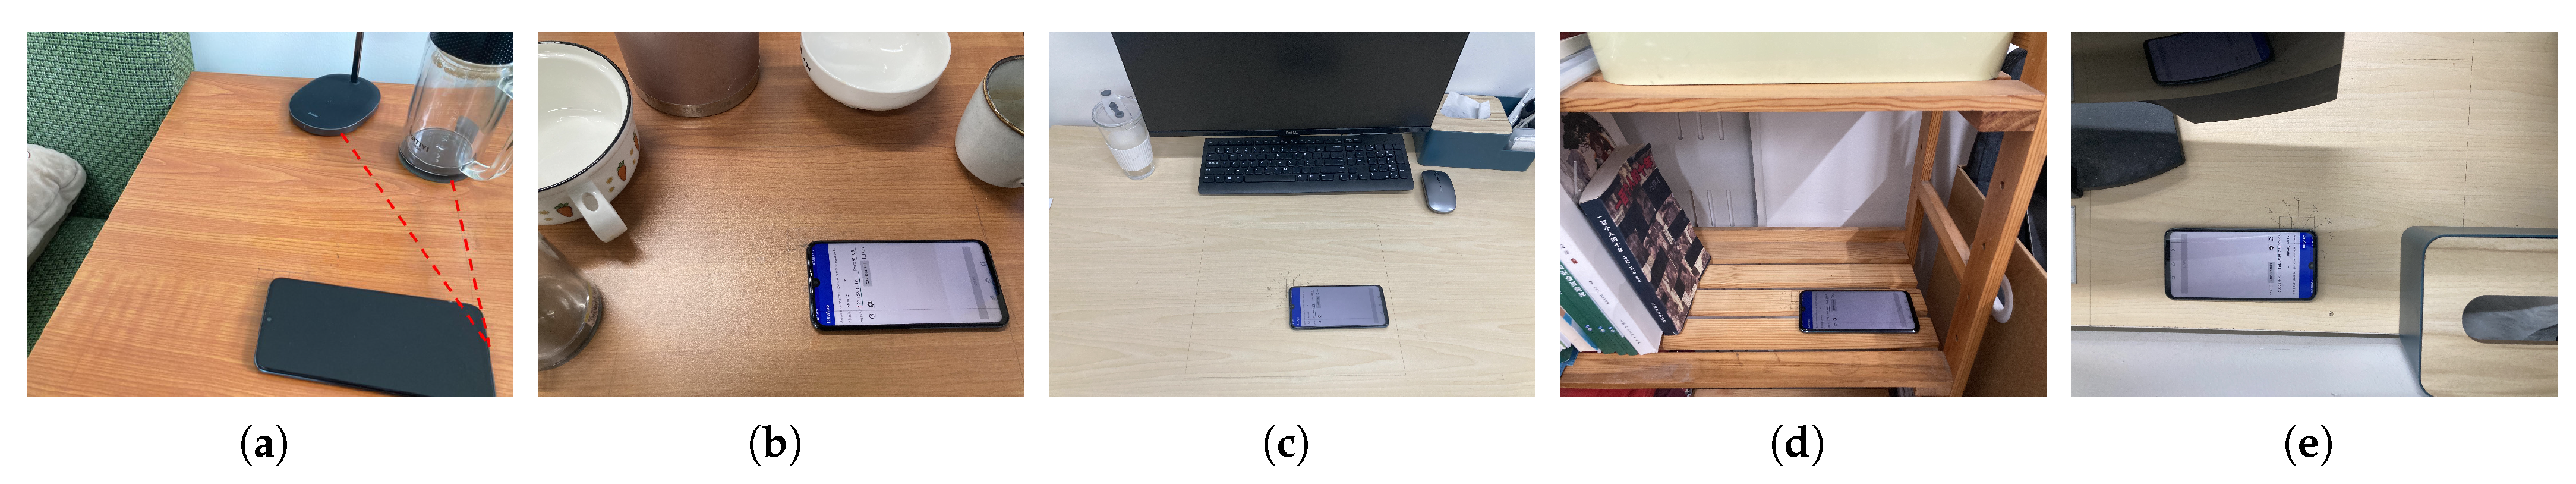
4.1. Experiment
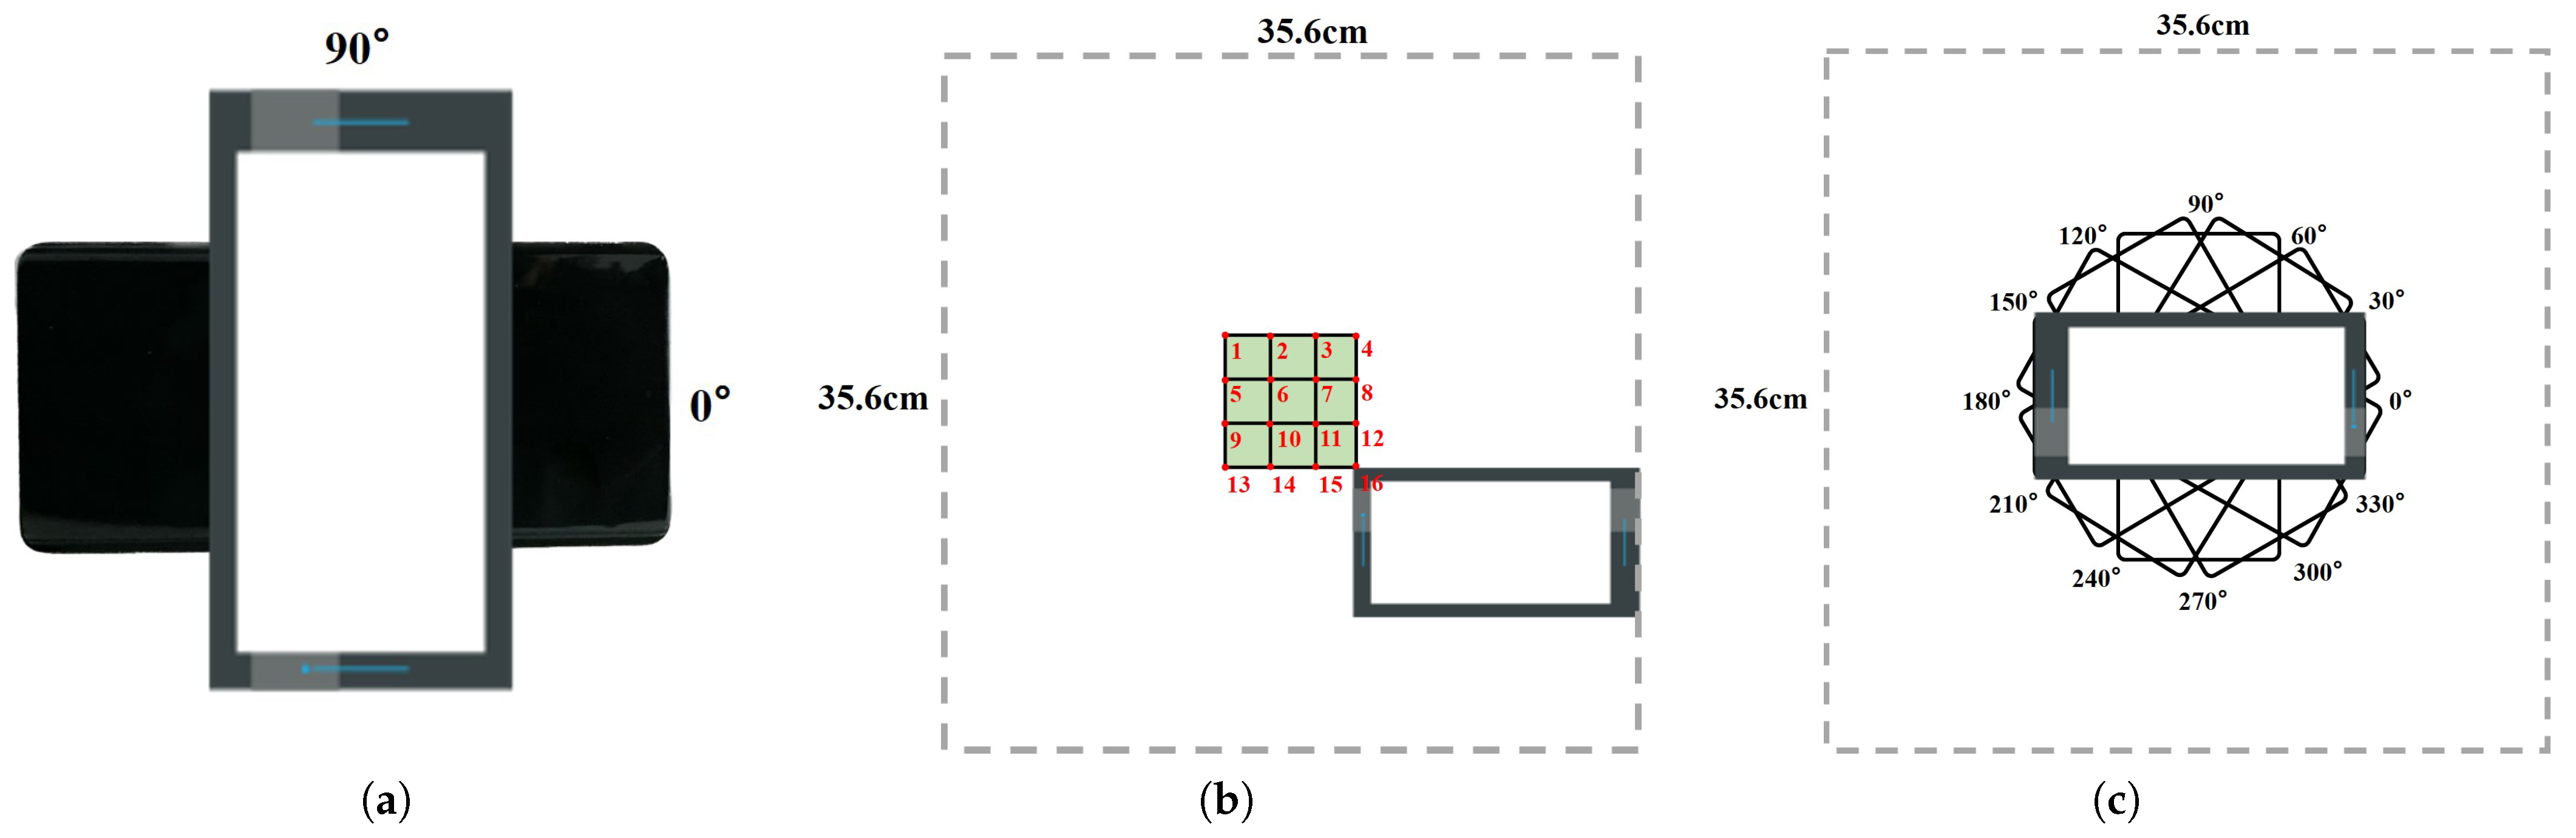
4.1.1. Settings
4.1.2. Dataset
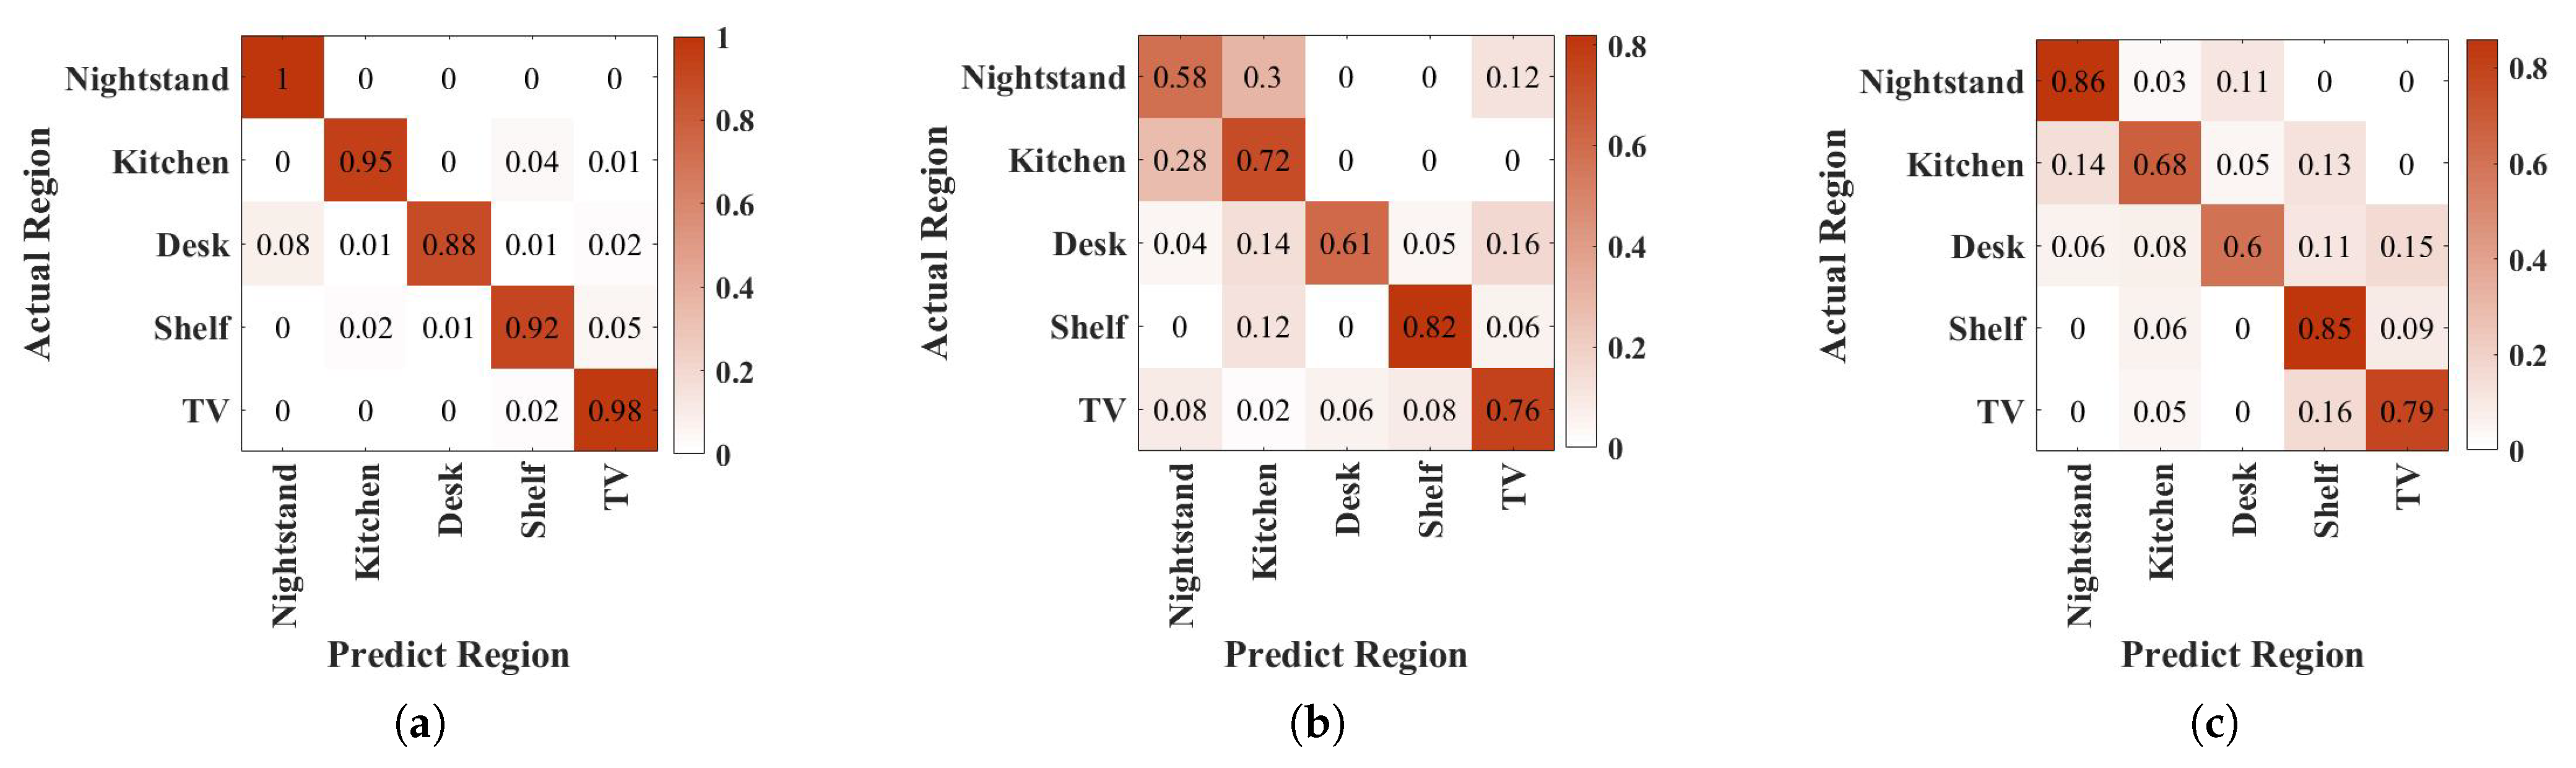
4.2. Identification Accuracy
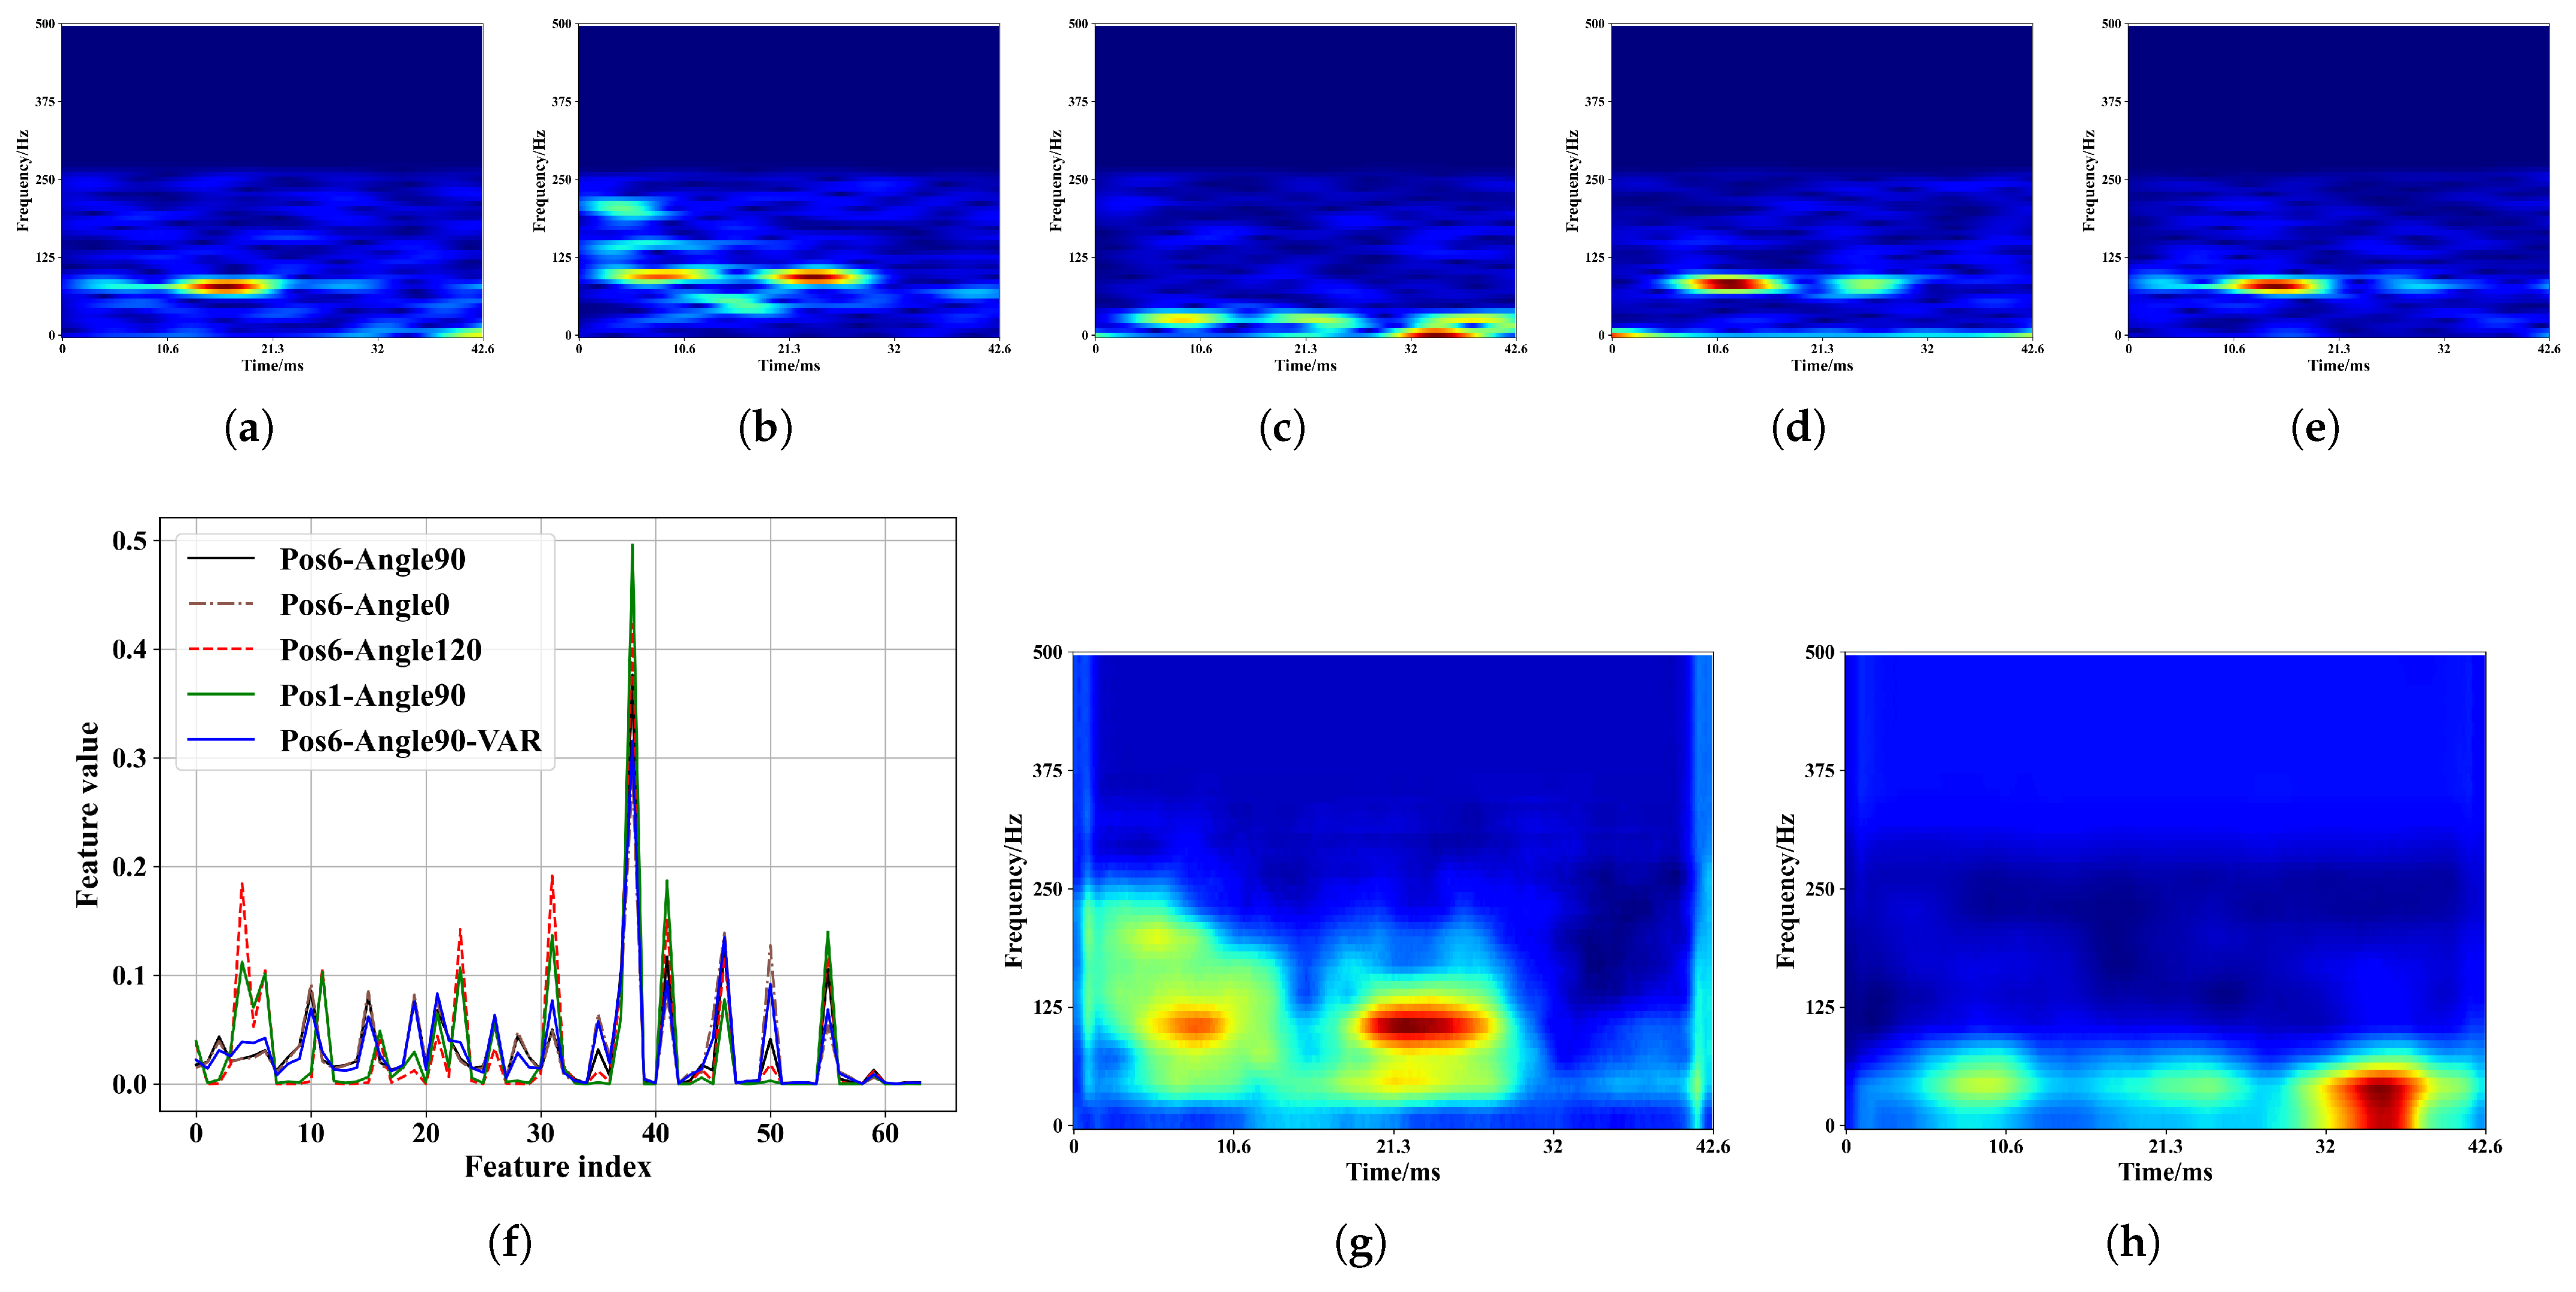
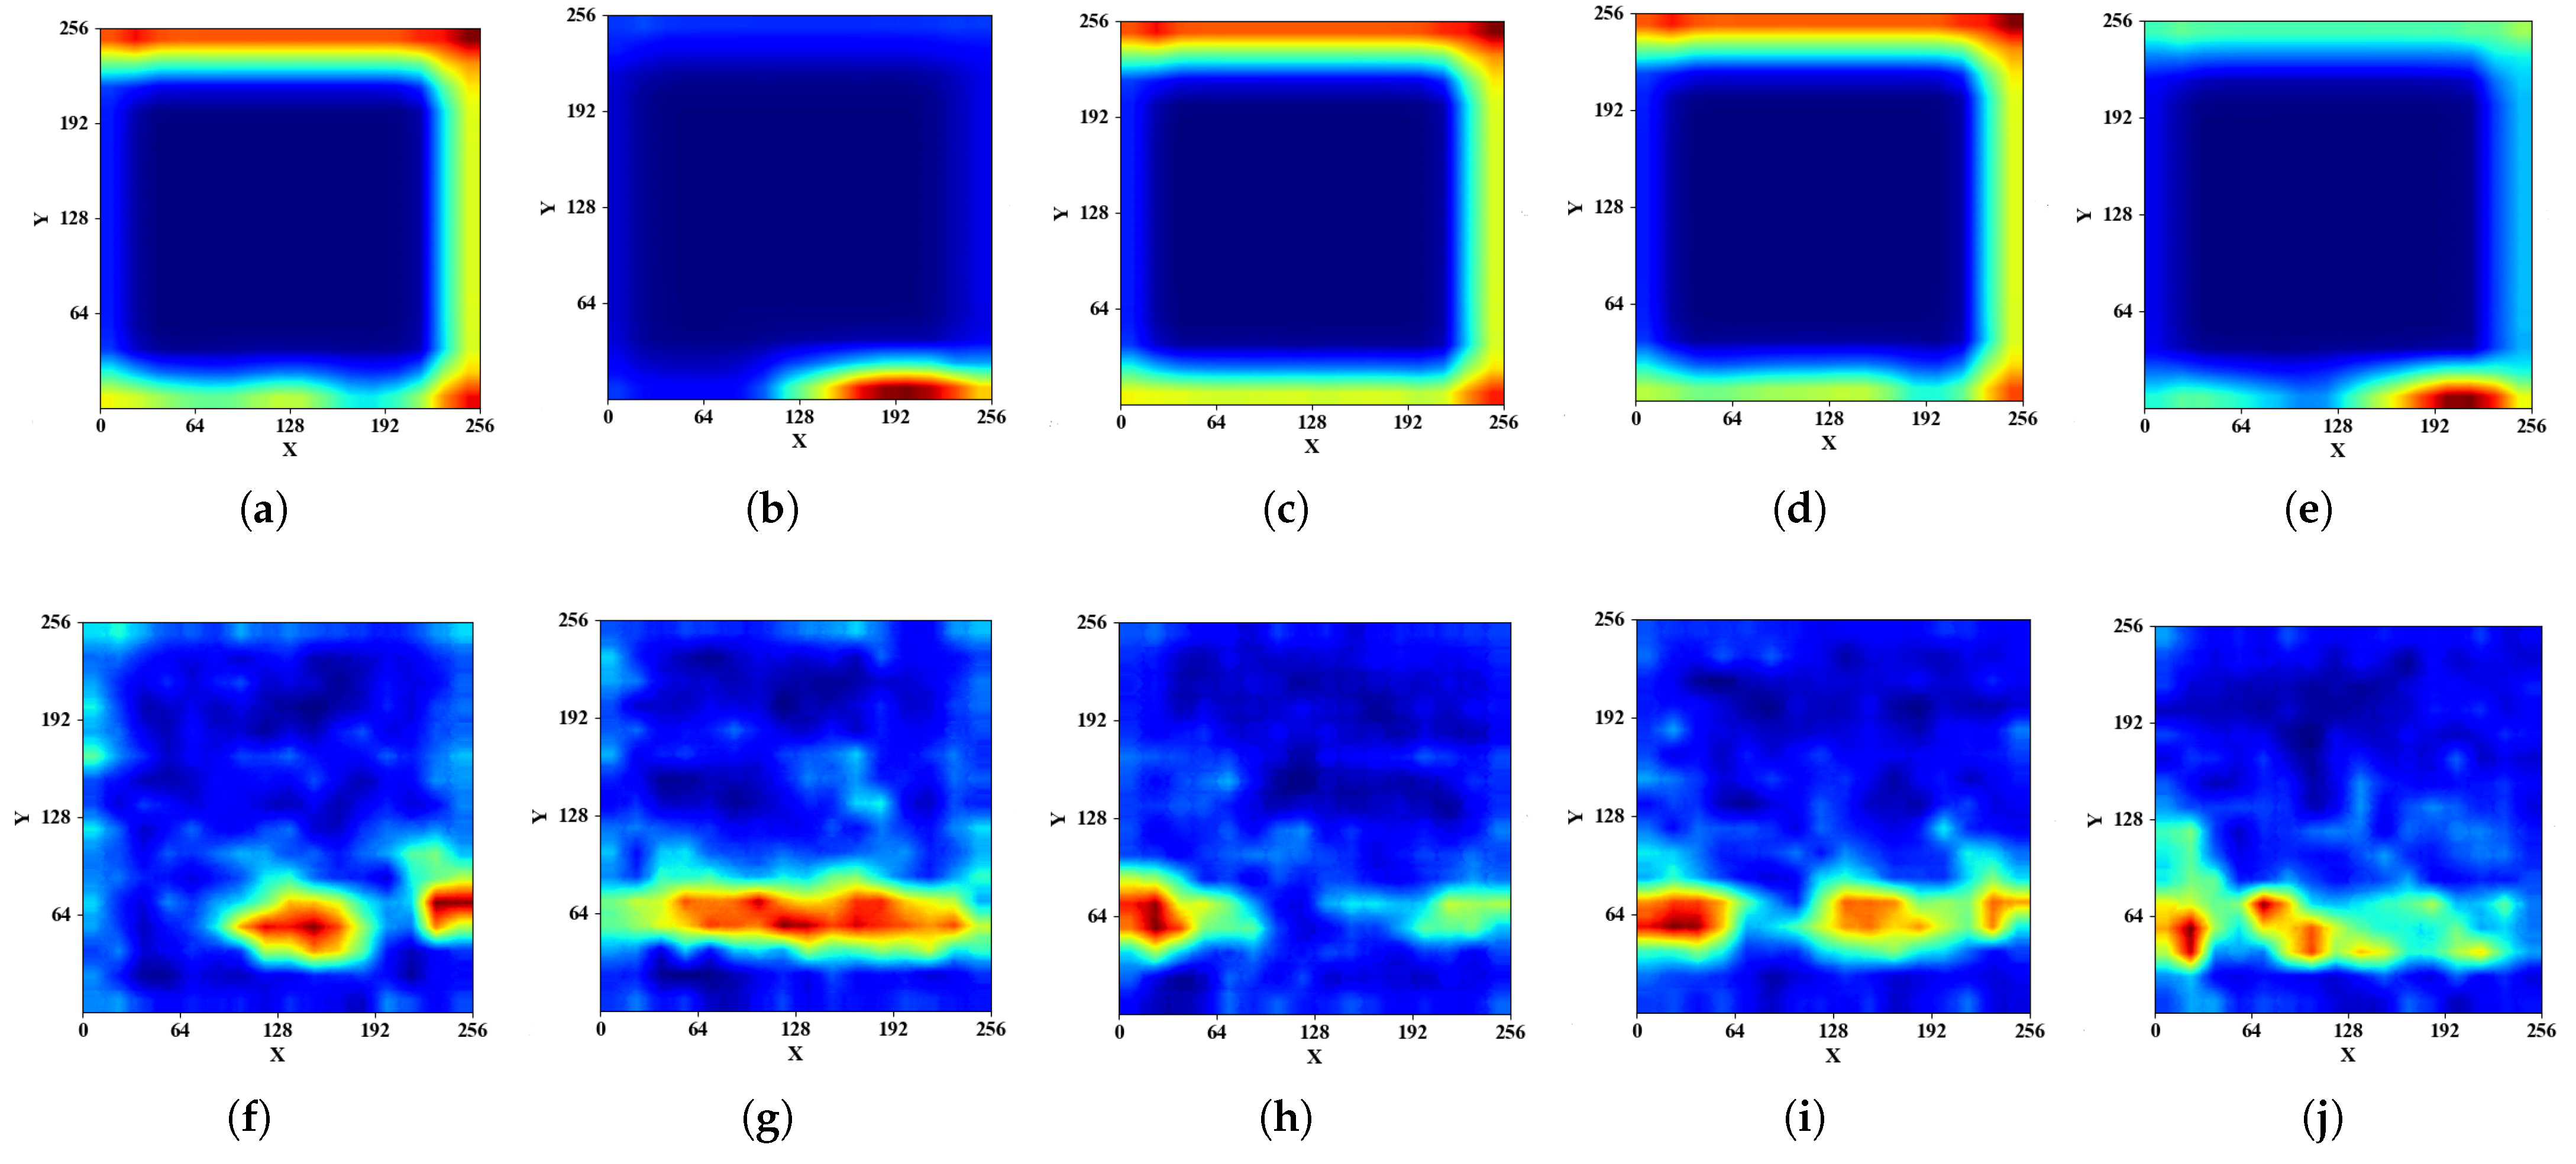
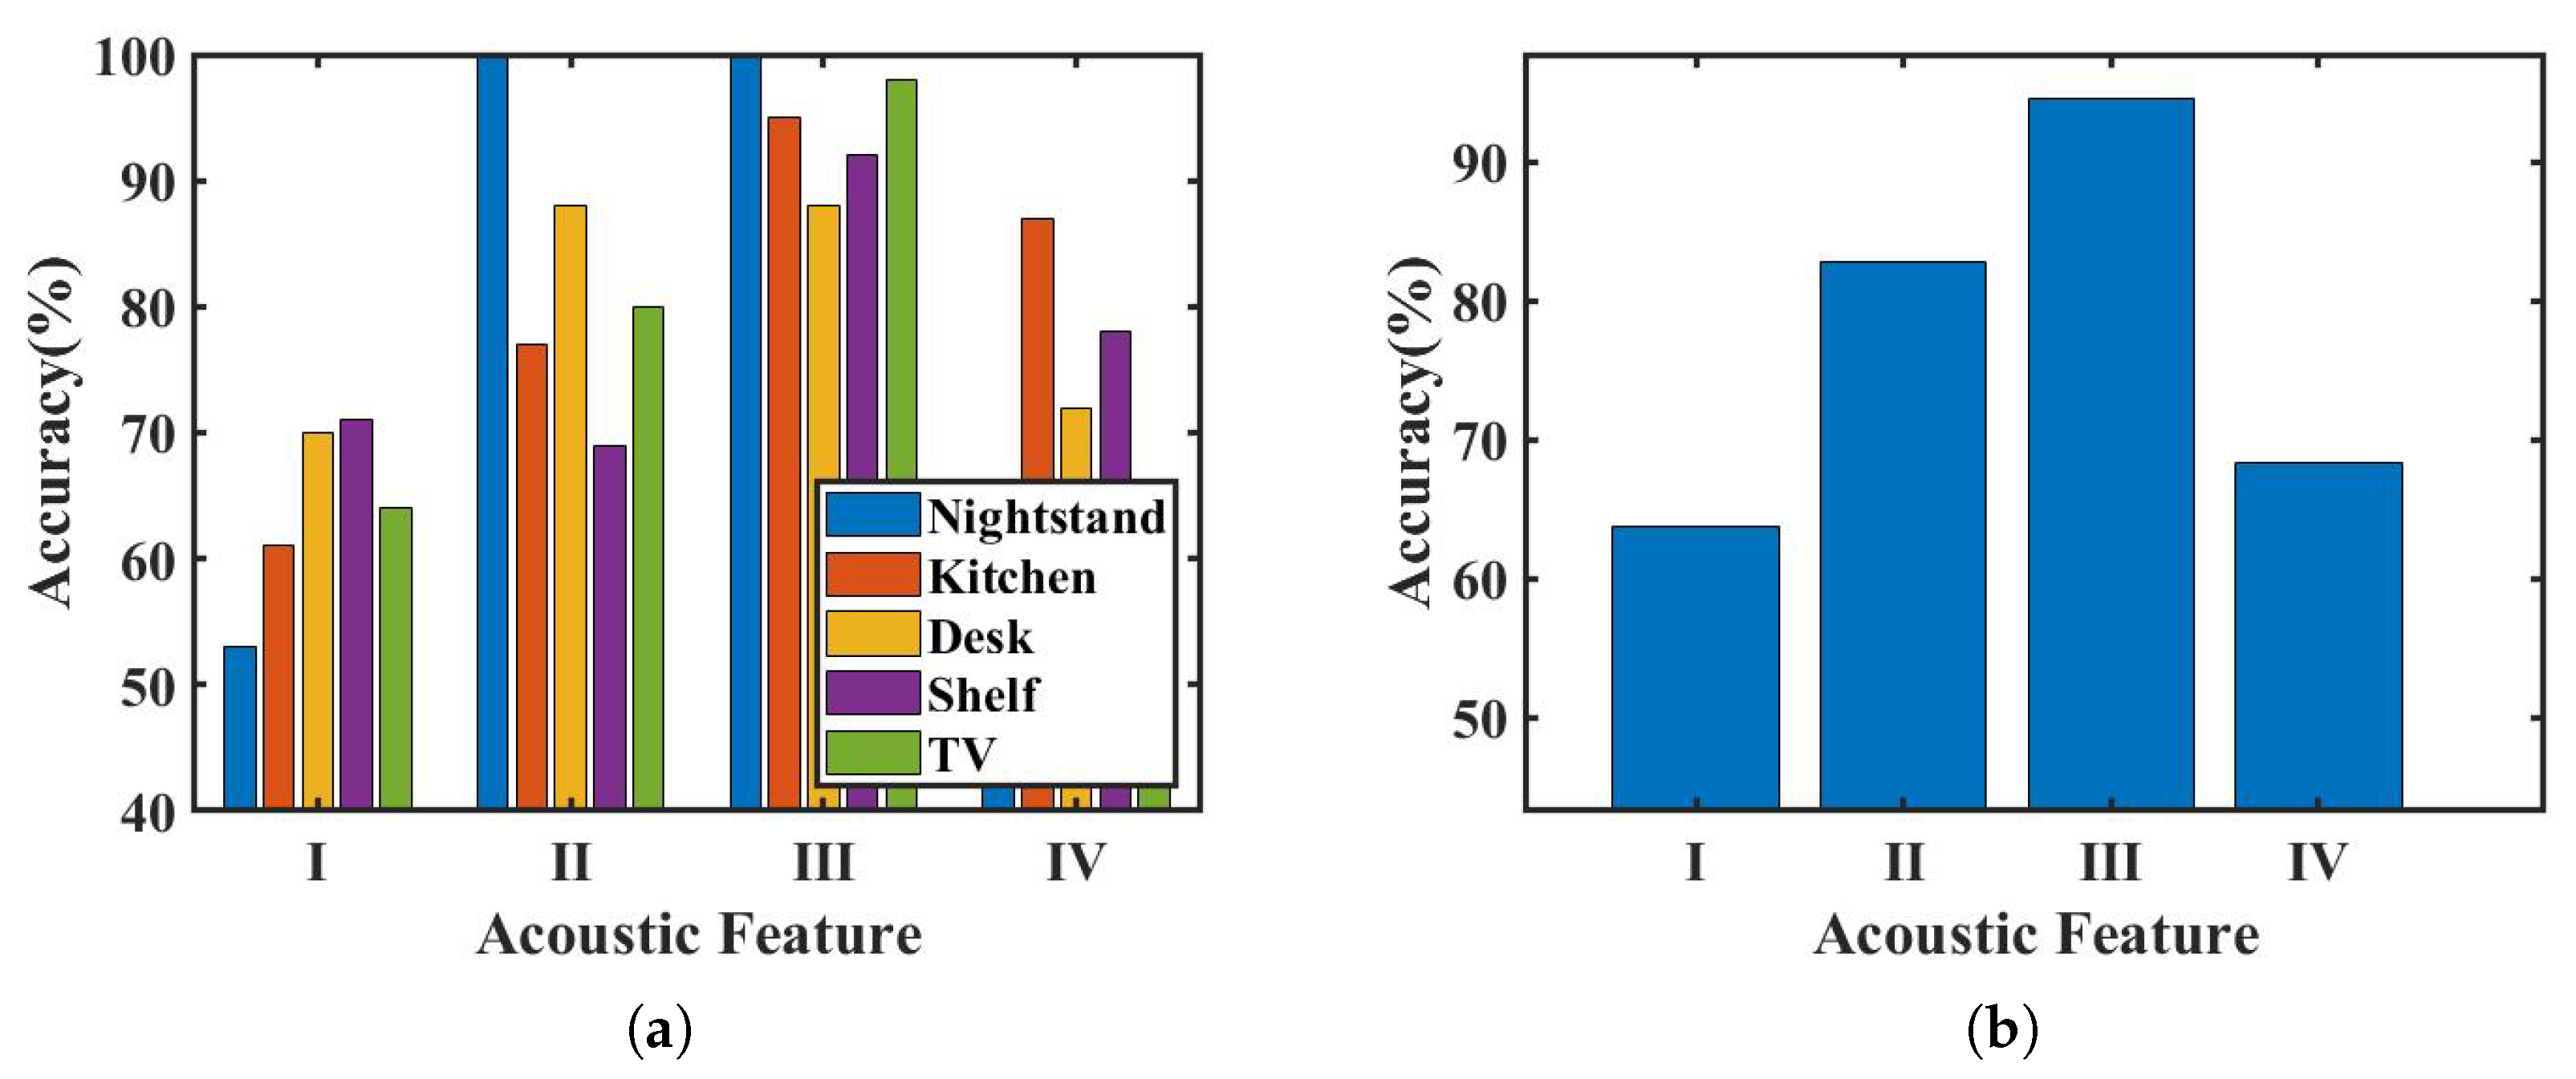
4.3. Acoustic Feature
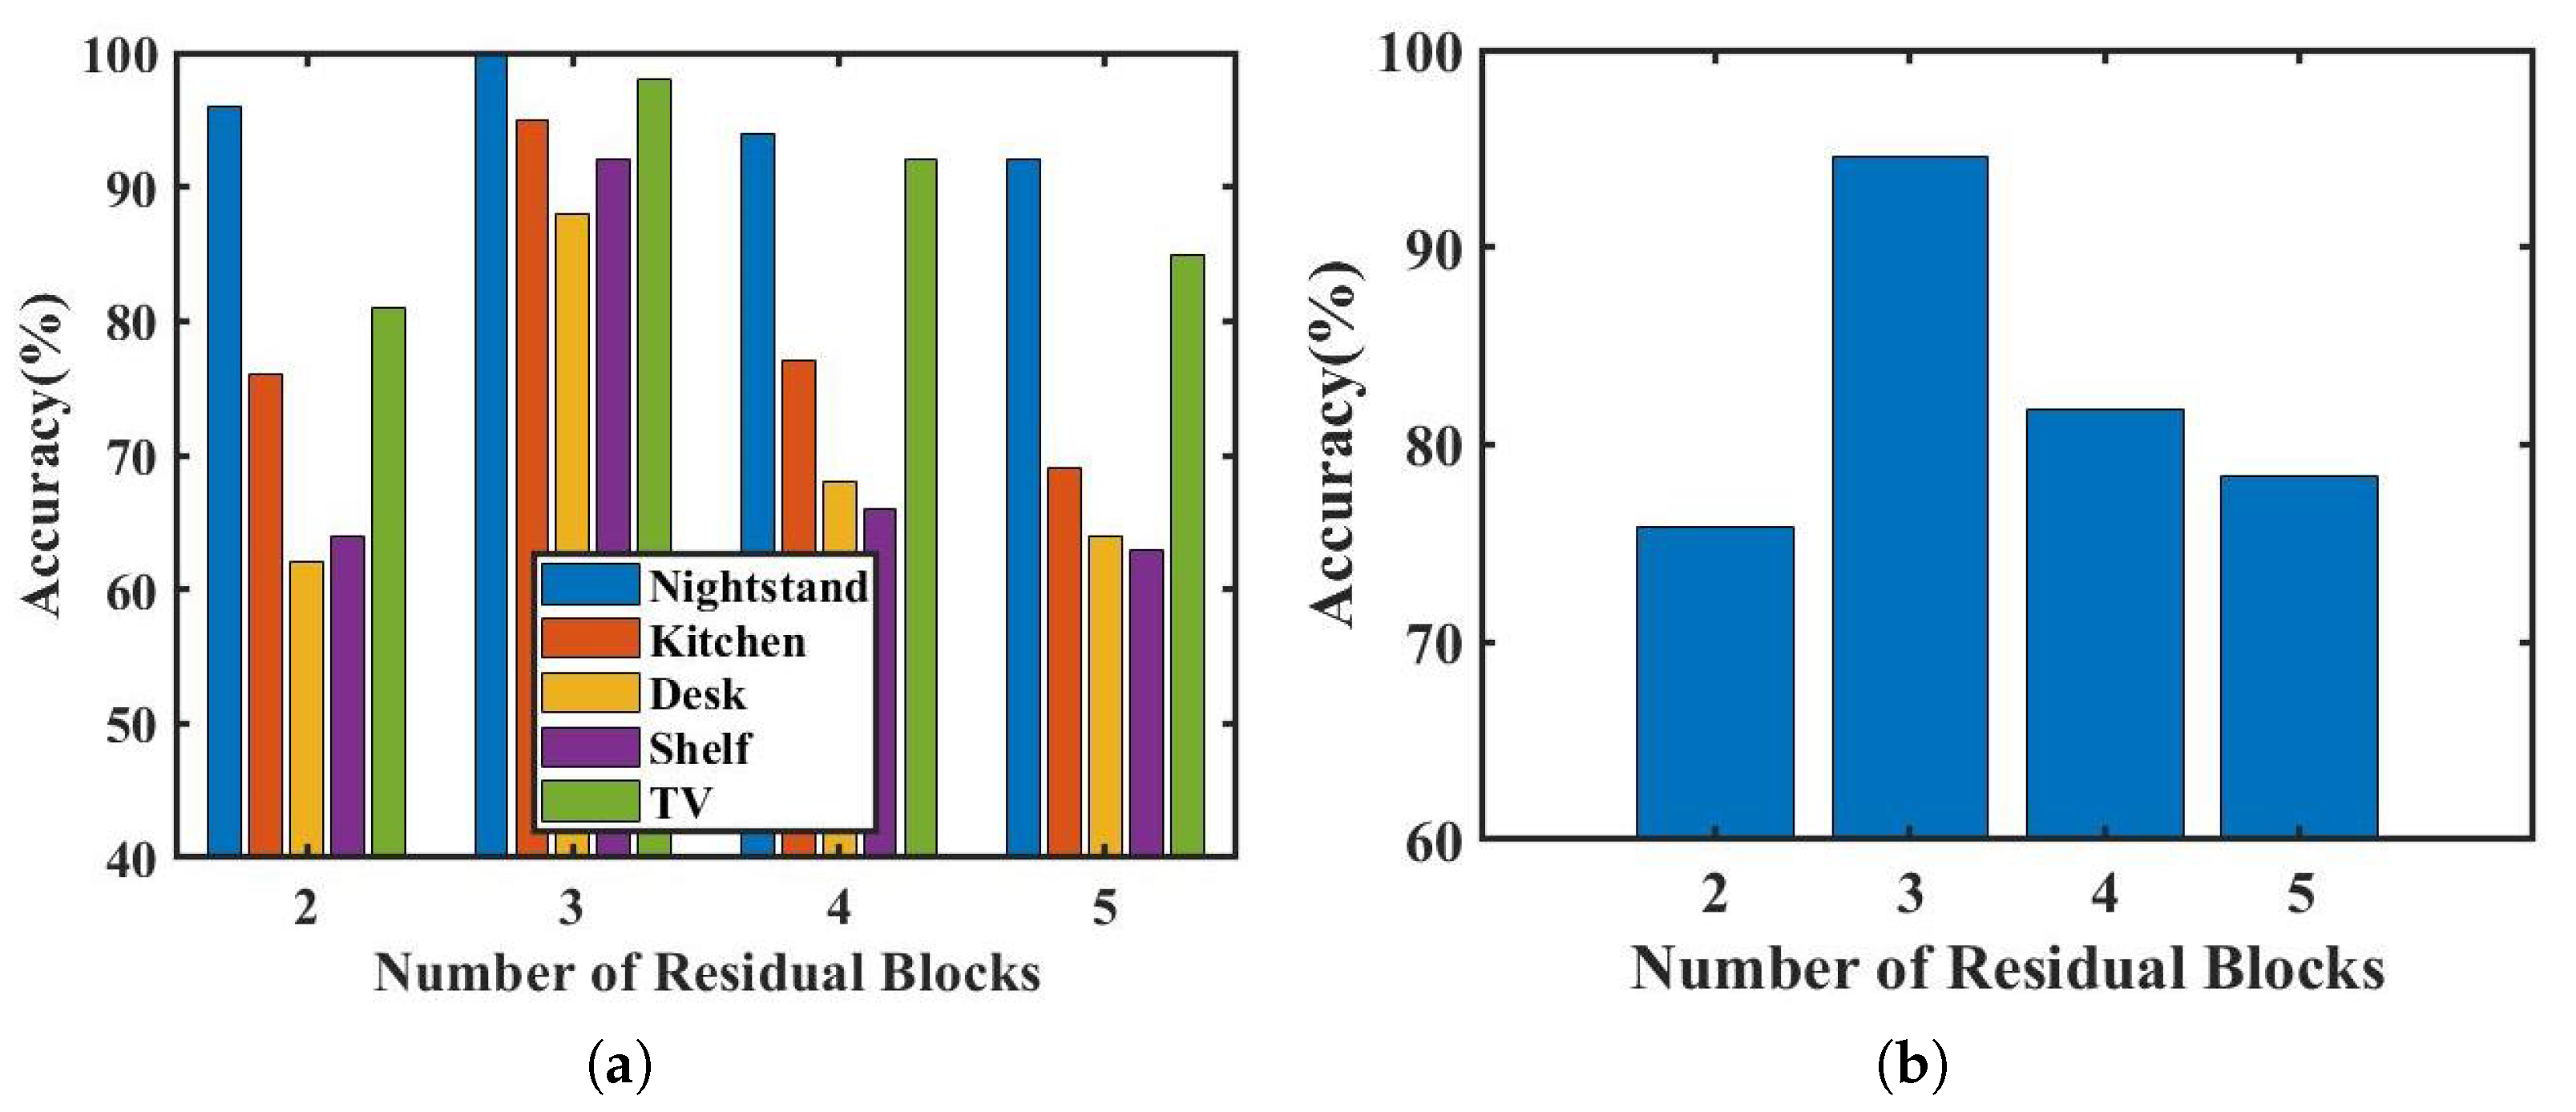
4.4. Number of Residual Blocks
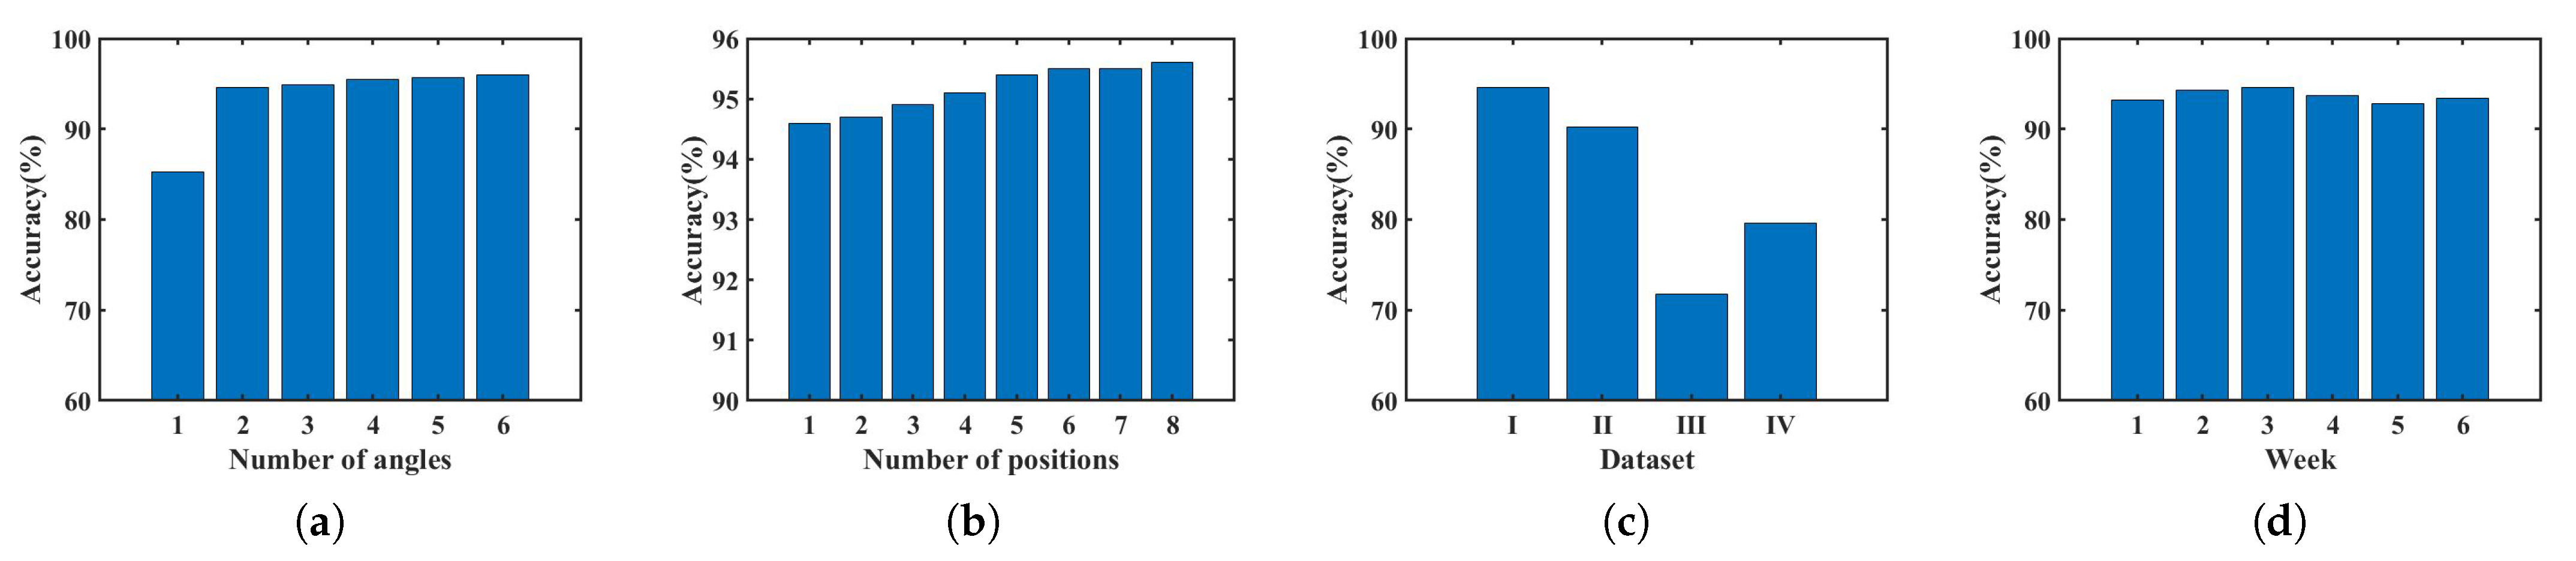
4.5. Size of Training Set
4.6. Mobile Phone Model
4.7. Permanence
4.8. Ten Regions Identification
5. Related Works
5.1. Dedicated Equipment
5.2. RF Signal
5.3. Acoustic
6. Conclusions and Future Work
Author Contributions
Funding
Institutional Review Board Statement
Informed Consent Statement
Data Availability Statement
Acknowledgments
Conflicts of Interest
References
- Yan, Z.; Chakraborty, D.; Parent, C.; Spaccapietra, S.; Aberer, K. Semantic trajectories: Mobility data computation and annotation. ACM Trans. Intell. Syst. Technol. 2013, 4, 49:1–49:38. [Google Scholar] [CrossRef]
- Li, F.; Chen, H.; Song, X.; Zhang, Q.; Li, Y.; Wang, Y. CondioSense: High-quality context-aware service for audio sensing system via active sonar. Pers. Ubiquitous Comput. 2017, 21, 17–29. [Google Scholar] [CrossRef]
- Khanum, A.; Lee, C.Y.; Yang, C.S. Deep-Learning-Based Network for Lane Following in Autonomous Vehicles. Electronics 2022, 11, 3084. [Google Scholar] [CrossRef]
- Faisal, M.M.; Mohammed, M.S.; Abduljabar, A.M.; Abdulhussain, S.H.; Mahmmod, B.M.; Khan, W.; Hussain, A. Object Detection and Distance Measurement Using AI. In Proceedings of the 2021 14th International Conference on Developments in eSystems Engineering (DeSE), Sharjah, United Arab Emirates, 7–10 December 2021; pp. 559–565. [Google Scholar]
- Mohammed, M.S.; Abduljabar, A.M.; Faisal, M.M.; Mahmmod, B.M.; Abdulhussain, S.H.; Khan, W.; Liatsis, P.; Hussain, A. Low-cost autonomous car level 2: Design and implementation for conventional vehicles. Results Eng. 2023, 17, 100969. [Google Scholar] [CrossRef]
- Mayabrahmma, A.; Beesetty, Y.; Shadaab, K.; Vineet, K. Location-Based Services Market. 2021. Available online: https://www.alliedmarketresearch.com/location-based-services-market (accessed on 1 March 2023).
- Addlesee, M.; Curwen, R.W.; Hodges, S.; Newman, J.; Steggles, P.; Ward, A.; Hopper, A. Implementing a Sentient Computing System. Computer 2001, 34, 50–56. [Google Scholar] [CrossRef]
- Want, R.; Hopper, A.; Falcao, V.; Gibbons, J. The active badge location system. ACM Trans. Inf. Syst. 1992, 10, 91–102. [Google Scholar] [CrossRef]
- Azizyan, M.; Constandache, I.; Choudhury, R.R. SurroundSense: Mobile phone localization via ambience fingerprinting. In Proceedings of the ACM/IEEE International Conference on Mobile Computing and Networking, Beijing, China, 20–25 September 2009. [Google Scholar]
- Borriello, G.; Liu, A.L.; Offer, T.; Palistrant, C.; Sharp, R. WALRUS: Wireless acoustic location with room-level resolution using ultrasound. In Proceedings of the ACM SIGMOBILE International Conference on Mobile Systems, Applications, and Services, Singapore, 25–30 June 2005. [Google Scholar]
- Tarzia, S.P.; Dinda, P.A.; Dick, R.P.; Memik, G. Indoor localization without infrastructure using the acoustic background spectrum. In Proceedings of the ACM SIGMOBILE International Conference on Mobile Systems, Applications, and Services, Bethesda, MD, USA, 28 June–1 July 2011. [Google Scholar]
- Hightower, J.; Consolvo, S.; LaMarca, A.; Smith, I.E.; Hughes, J. Learning and Recognizing the Places We Go. In Proceedings of the Ubiquitous Computing, Nagasaki, Japan, 6–9 December 2005. [Google Scholar]
- Tung, Y.C.; Shin, K.G. EchoTag: Accurate Infrastructure-Free Indoor Location Tagging with Smartphones. In Proceedings of the 21st Annual International Conference on Mobile Computing and Networking, Paris, France, 7–11 September 2015. [Google Scholar]
- Tung, Y.C.; Bui, D.V.; Shin, K.G. Cross-Platform Support for Rapid Development of Mobile Acoustic Sensing Applications. In Proceedings of the 16th Annual International Conference on Mobile Systems, Applications, and Services, Munich, Germany, 10–15 June 2018. [Google Scholar]
- Cheng, H.; Lou, W. Push the Limit of Device-Free Acoustic Sensing on Commercial Mobile Devices. In Proceedings of the IEEE INFOCOM 2021—IEEE Conference on Computer Communications, Vancouver, BC, Canada, 10–13 May 2021; IEEE Press: Piscataway, NJ, USA, 2021; pp. 1–10. [Google Scholar]
- Kunze, K.; Lukowicz, P. Symbolic Object Localization Through Active Sampling of Acceleration and Sound Signatures. In Proceedings of the Ubiquitous Computing, Innsbruck, Austria, 16–19 September 2007. [Google Scholar]
- Zhou, Z.; Diao, W.; Liu, X.; Zhang, K. Acoustic Fingerprinting Revisited: Generate Stable Device ID Stealthily with Inaudible Sound. In Proceedings of the 2014 ACM SIGSAC Conference on Computer and Communications Security, Scottsdale, AZ, USA, 3–7 November 2014. [Google Scholar]
- Horai, M.; Kobayashi, H.; Nitta, T.G. Chirp Signal Transform and Its Properties. J. Appl. Math. 2014, 2014, 161989:1–161989:8. [Google Scholar] [CrossRef]
- Yang, Y.; Cao, J.; Liu, X.; Liu, X. Door-Monitor: Counting In-and-Out Visitors with COTS WiFi Devices. IEEE Internet Things J. 2020, 7, 1704–1717. [Google Scholar] [CrossRef]
- Abdulhussain, S.H.; Mahmmod, B.M.; Baker, T.; Al-Jumeily, D. Fast and accurate computation of high-order Tchebichef polynomials. Concurr. Comput. Pract. Exp. 2022, 34, e7311. [Google Scholar] [CrossRef]
- Heaton, J. Ian Goodfellow, Yoshua Bengio, and Aaron Courville: Deep learning. Genet. Program. Evolvable Mach. 2017, 19, 305–307. [Google Scholar] [CrossRef]
- Gu, J.; Wang, Z.; Kuen, J.; Ma, L.; Shahroudy, A.; Shuai, B.; Liu, T.; Wang, X.; Wang, G.; Cai, J.; et al. Recent advances in convolutional neural networks. arXiv 2015, arXiv:1512.07108. [Google Scholar] [CrossRef]
- He, K.; Zhang, X.; Ren, S.; Sun, J. Deep Residual Learning for Image Recognition. In Proceedings of the 2016 IEEE Conference on Computer Vision and Pattern Recognition (CVPR), Las Vegas, NV, USA, 27–30 June 2016; pp. 770–778. [Google Scholar]
- Woo, S.; Park, J.; Lee, J.Y.; Kweon, I.S. CBAM: Convolutional Block Attention Module. In Proceedings of the European Conference on Computer Vision, Munich, Germany, 8–14 September 2018. [Google Scholar]
- Zhou, B.; Khosla, A.; Lapedriza, À.; Oliva, A.; Torralba, A. Learning Deep Features for Discriminative Localization. In Proceedings of the 2016 IEEE Conference on Computer Vision and Pattern Recognition (CVPR), Las Vegas, NV, USA, 27–30 June 2016; pp. 2921–2929. [Google Scholar]
- GPS: The Global Positioning System. 2022. Available online: https://www.gps.gov/ (accessed on 20 January 2023).
- Chen, Y.; Lymberopoulos, D.; Liu, J.; Priyantha, B. FM-based indoor localization. In Proceedings of the ACM SIGMOBILE International Conference on Mobile Systems, Applications, and Services, Low Wood Bay Lake District, UK, 25–29 June 2012. [Google Scholar]
- Liu, K.; Liu, X.; Li, X. Guoguo: Enabling Fine-Grained Smartphone Localization via Acoustic Anchors. IEEE Trans. Mob. Comput. 2016, 15, 1144–1156. [Google Scholar] [CrossRef]
- Haeberlen, A.; Flannery, E.; Ladd, A.M.; Rudys, A.; Wallach, D.S.; Kavraki, L.E. Practical robust localization over large-scale 802.11 wireless networks. In Proceedings of the ACM/IEEE International Conference on Mobile Computing and Networking, Philadelphia, PA, USA, 15–18 September 2004. [Google Scholar]
- Youssef, M.; Agrawala, A.K. The Horus WLAN location determination system. In Proceedings of the ACM SIGMOBILE International Conference on Mobile Systems, Applications, and Services, Seattle, WA, USA, 6–8 June 2005. [Google Scholar]
- Vasisht, D.; Kumar, S.; Katabi, D. Decimeter-Level Localization with a Single WiFi Access Point. In Proceedings of the Symposium on Networked Systems Design and Implementation, Santa Clara, CA, USA, 16–18 March 2016. [Google Scholar]
- Labinghisa, B.A.; Lee, D.M. Indoor localization system using deep learning based scene recognition. Multimed. Tools Appl. 2022, 81, 28405–28429. [Google Scholar] [CrossRef]
- Lu, L.; Yu, J.; Chen, Y.; Wang, Y. VocalLock: Sensing Vocal Tract for Passphrase-Independent User Authentication Leveraging Acoustic Signals on Smartphones. Proc. ACM Interact. Mob. Wearable Ubiquitous Technol. 2020, 4, 51:1–51:24. [Google Scholar] [CrossRef]
- Zhou, M.; Wang, Q.; Yang, J.; Li, Q.; Xiao, F.; Wang, Z.; Chen, X. PatternListener: Cracking Android Pattern Lock Using Acoustic Signals. In Proceedings of the 2018 ACM SIGSAC Conference on Computer and Communications Security, Toronto, ON, Canada, 15–19 October 2018. [Google Scholar]
- Rathore, A.S.; Zhu, W.; Daiyan, A.; Xu, C.; Wang, K.; Lin, F.; Ren, K.; Xu, W. SonicPrint: A generally adoptable and secure fingerprint biometrics in smart devices. In Proceedings of the 18th International Conference on Mobile Systems, Applications, and Services, Toronto, ON, Canada, 15–19 June 2020. [Google Scholar]
- Dai, H.; Wang, W.; Liu, A.X.; Ling, K.; Sun, J. Speech Based Human Authentication on Smartphones. In Proceedings of the 2019 16th Annual IEEE International Conference on Sensing, Communication, and Networking (SECON), Boston, MA, USA, 10–13 June 2019; pp. 1–9. [Google Scholar]
- Tan, J.; Nguyen, C.T.; Wang, X. SilentTalk: Lip reading through ultrasonic sensing on mobile phones. In Proceedings of the IEEE INFOCOM 2017—IEEE Conference on Computer Communications, Atlanta, GA, USA, 1–4 May 2017; pp. 1–9. [Google Scholar]
- Lu, L.; Yu, J.; Chen, Y.; Liu, H.; Zhu, Y.; Kong, L.; Li, M. Lip Reading-Based User Authentication Through Acoustic Sensing on Smartphones. IEEE/ACM Trans. Netw. 2019, 27, 447–460. [Google Scholar] [CrossRef]
- Tan, J.; Wang, X.; Nguyen, C.T.; Shi, Y. SilentKey: A New Authentication Framework through Ultrasonic-based Lip Reading. Proc. ACM Interact. Mob. Wearable Ubiquitous Technol. 2018, 2, 36:1–36:18. [Google Scholar] [CrossRef]
- Zhou, B.; Lohokare, J.; Gao, R.; Ye, F. EchoPrint: Two-factor Authentication using Acoustics and Vision on Smartphones. In Proceedings of the 24th Annual International Conference on Mobile Computing and Networking, New Delhi, India, 29 October–2 November 2018. [Google Scholar]
- Wang, X.; Huang, R.; Mao, S. SonarBeat: Sonar Phase for Breathing Beat Monitoring with Smartphones. In Proceedings of the 2017 26th International Conference on Computer Communication and Networks (ICCCN), Vancouver, BC, Canada, 31 July–3 August 2017; pp. 1–8. [Google Scholar]
- Wang, T.; Zhang, D.; Zheng, Y.; Gu, T.; Zhou, X.; Dorizzi, B. C-FMCW Based Contactless Respiration Detection Using Acoustic Signal. Proc. ACM Interact. Mob. Wearable Ubiquitous Technol. 2018, 1, 1–20. [Google Scholar] [CrossRef]
- Qian, K.; Wu, C.; Xiao, F.; Zheng, Y.; Zhang, Y.; Yang, Z.; Liu, Y. Acousticcardiogram: Monitoring Heartbeats using Acoustic Signals on Smart Devices. In Proceedings of the IEEE INFOCOM 2018—IEEE Conference on Computer Communications, Honolulu, HI, USA, 16–19 April 2018; pp. 1574–1582. [Google Scholar]
- Xu, X.; Yu, J.; Chen, Y.; Zhu, Y.; Kong, L.; Li, M. BreathListener: Fine-grained Breathing Monitoring in Driving Environments Utilizing Acoustic Signals. In Proceedings of the 17th Annual International Conference on Mobile Systems, Applications, and Services, Seoul, Republic of Korea, 17–21 June 2019. [Google Scholar]
- Nandakumar, R.; Gollakota, S.; Watson, N.F. Contactless Sleep Apnea Detection on Smartphones. GetMobile Mob. Comput. Commun. 2015, 19, 22–24. [Google Scholar] [CrossRef]
- Du, H.; Li, P.; Zhou, H.; Gong, W.; Luo, G.; Yang, P. WordRecorder: Accurate Acoustic-based Handwriting Recognition Using Deep Learning. In Proceedings of the IEEE INFOCOM 2018—IEEE Conference on Computer Communications, Honolulu, HI, USA, 16–19 April 2018; pp. 1448–1456. [Google Scholar]
- Kim, H.; Byanjankar, A.; Liu, Y.; Shu, Y.; Shin, I. UbiTap: Leveraging Acoustic Dispersion for Ubiquitous Touch Interface on Solid Surfaces. In Proceedings of the 16th ACM Conference on Embedded Networked Sensor Systems, Shenzhen, China, 4–7 November 2018. [Google Scholar]
- Chen, M.; Lin, J.; Zou, Y.; Ruby, R.; Wu, K. SilentSign: Device-free Handwritten Signature Verification through Acoustic Sensing. In Proceedings of the 2020 IEEE International Conference on Pervasive Computing and Communications (PerCom), Austin, TX, USA, 23–27 March 2020; pp. 1–10. [Google Scholar]
- Zou, Y.; Yang, Q.; Ruby, R.; Han, Y.; Wu, S.; Li, M.; Wu, K. EchoWrite: An Acoustic-based Finger Input System Without Training. In Proceedings of the 2019 IEEE 39th International Conference on Distributed Computing Systems (ICDCS), Dallas, TX, USA, 7–9 July 2019; pp. 778–787. [Google Scholar]
- Zou, Y.; Yang, Q.; Han, Y.; Wang, D.; Cao, J.; Wu, K. AcouDigits: Enabling Users to Input Digits in the Air. In Proceedings of the 2019 IEEE International Conference on Pervasive Computing and Communications (PerCom 2019), Kyoto, Japan, 11–15 March 2019; pp. 1–9. [Google Scholar]
- Xiao, Z.; Chen, T.; Liu, Y.; Li, Z. Mobile Phones Know Your Keystrokes through the Sounds from Finger’s Tapping on the Screen. In Proceedings of the 2020 IEEE 40th International Conference on Distributed Computing Systems (ICDCS), Singapore, 29 November–1 December 2020; pp. 965–975. [Google Scholar]
- Lu, L.; Yu, J.; Chen, Y.; Zhu, Y.; Xu, X.; Xue, G.; Li, M. KeyLiSterber: Inferring Keystrokes on QWERTY Keyboard of Touch Screen through Acoustic Signals. In Proceedings of the IEEE INFOCOM 2019—IEEE Conference on Computer Communications, Paris, France, 29 April–2 May 2019; pp. 775–783. [Google Scholar]
- Wang, Y.; Shen, J.; Zheng, Y. Push the Limit of Acoustic Gesture Recognition. In Proceedings of the IEEE INFOCOM 2020—IEEE Conference on Computer Communications, Virtual, 6–9 July 2020; pp. 566–575. [Google Scholar]
- Ling, K.; Dai, H.; Liu, Y.; Liu, A.X.; Wang, W.; Gu, Q. UltraGesture: Fine-Grained Gesture Sensing and Recognition. IEEE Trans. Mob. Comput. 2022, 21, 2620–2636. [Google Scholar]
- Sun, K.; Zhao, T.; Wang, W.; Xie, L. VSkin: Sensing Touch Gestures on Surfaces of Mobile Devices Using Acoustic Signals. In Proceedings of the 24th Annual International Conference on Mobile Computing and Networking, New Delhi, India, 29 October–2 November 2018. [Google Scholar]
- Wirz, M.; Roggen, D.; Tröster, G. A wearable, ambient sound-based approach for infrastructureless fuzzy proximity estimation. In Proceedings of the International Symposium on Wearable Computers (ISWC) 2010, Seoul, Republic of Korea, 10–13 October 2010; pp. 1–4. [Google Scholar]
- Shen, S. Voice localization using nearby wall reflections. In Proceedings of the 26th Annual International Conference on Mobile Computing and Networking, London, UK, 21–25 September 2020. [Google Scholar]
- Wang, W.; Li, J.; He, Y.; Liu, Y. Symphony: Localizing multiple acoustic sources with a single microphone array. In Proceedings of the 18th Conference on Embedded Networked Sensor Systems, Virtual Event, Japan, 16–19 November 2020. [Google Scholar]
- Tachikawa, M.; Maekawa, T.; Matsushita, Y. Predicting location semantics combining active and passive sensing with environment-independent classifier. In Proceedings of the 2016 ACM International Joint Conference on Pervasive and Ubiquitous Computing, Heidelberg, Germany, 12–16 September 2016. [Google Scholar]
- Song, Q.; Gu, C.; Tan, R. Deep Room Recognition Using Inaudible Echos. Proc. ACM Interact. Mob. Wearable Ubiquitous Technol. 2018, 2, 135. [Google Scholar] [CrossRef]
- Chen, C.; Ren, Y.; Liu, H.; Chen, Y.; Li, H. Acoustic-Sensing-Based Location Semantics Identification Using Smartphones. IEEE Internet Things J. 2022, 9, 20640–20650. [Google Scholar] [CrossRef]
- Rossi, M.; Seiter, J.; Amft, O.; Buchmeier, S.; Tröster, G. RoomSense: An indoor positioning system for smartphones using active sound probing. In Proceedings of the International Conference on Adaptive Hypermedia and Adaptive Web-Based Systems, Stuttgart, Germany, 7–8 March 2013. [Google Scholar]
- Dissanayake, T.; Maekawa, T.; Hara, T.; Miyanishi, T.; Kawanabe, M. IndoLabel: Predicting Indoor Location Class by Discovering Location-Specific Sensor Data Motifs. IEEE Sens. J. 2022, 22, 5372–5385. [Google Scholar] [CrossRef]
- Pradhan, S.; Baig, G.; Mao, W.; Qiu, L.; Chen, G.; Yang, B. Smartphone-based Acoustic Indoor Space Mapping. Proc. ACM Interact. Mob. Wearable Ubiquitous Technol. 2018, 2, 75. [Google Scholar] [CrossRef]
- Zhou, B.; Elbadry, M.; Gao, R.; Ye, F. BatMapper: Acoustic Sensing Based Indoor Floor Plan Construction Using Smartphones. In Proceedings of the 15th Annual International Conference on Mobile Systems, Applications, and Services, Niagara Falls, NY, USA, 19–23 June 2017. [Google Scholar]


| Model Name | Input Dimension | Parameter Settings | Output Dimension |
|---|---|---|---|
| Conv 1 | 1 × 256 × 256 | 32 × 3 × 3 | 32 × 256 × 256 |
| ResBlock 1 | 32 × 256 × 256 | 32 × 3 × 3 | 32 × 256 × 256 |
| MaxPooling | 32 × 256 × 256 | 2 × 2 | 32 × 128 × 128 |
| Conv 2 | 32 × 128 × 128 | 32 × 3 × 3 | 32 × 128 × 128 |
| ResBlock 2 | 32 × 128 × 128 | 32 × 3 × 3 | 32 × 128 × 128 |
| MaxPooling | 32 × 128 × 128 | 2 × 2 | 32 × 64 × 64 |
| Conv 3 | 32 × 64 × 64 | 32 × 3 × 3 | 32 × 64 × 64 |
| ResBlock 3 | 32 × 64 × 64 | 32 × 3 × 3 | 32 × 64 × 64 |
| MaxPooling | 32 × 64 × 64 | 2 × 2 | 32 × 32 × 32 |
| Conv 4 | 32 × 32 × 32 | 32 × 3 × 3 | 32 × 32 × 32 |
| AdaptiveMaxPool + Flatten | 32 × 32 × 32 | - | 32 |
| Feature Fusion | 32 (Amplitude feature) 32 (Phase feature) | - | 64 |
| MLP | 64 | 64 × 512 512 × 1024 1024 × 512 512 × 5 | 5 (Probability of classifying 5 regions) |
| Total number of parameters | 180M | ||
| Feature I | Feature II | Feature III | Feature IV |
|---|---|---|---|
| received signal spectrum | baseband signal spectrum | baseband signal spectrogram | spectrum and spectrogram of baseband signal |
| Index | Region | Index | Region |
|---|---|---|---|
| 1 | nightstand | 6 | corridor |
| 2 | kitchen operating table | 7 | washbasin |
| 3 | desk | 8 | washing machine |
| 4 | shelf | 9 | classroom |
| 5 | TV cabinet | 10 | wonference room |
Disclaimer/Publisher’s Note: The statements, opinions and data contained in all publications are solely those of the individual author(s) and contributor(s) and not of MDPI and/or the editor(s). MDPI and/or the editor(s) disclaim responsibility for any injury to people or property resulting from any ideas, methods, instructions or products referred to in the content. |
© 2023 by the authors. Licensee MDPI, Basel, Switzerland. This article is an open access article distributed under the terms and conditions of the Creative Commons Attribution (CC BY) license (https://creativecommons.org/licenses/by/4.0/).
Share and Cite
Jiang, X.; Zhao, Z.; Li, Z.; Hong, F. Echo-ID: Smartphone Placement Region Identification for Context-Aware Computing. Sensors 2023, 23, 4302. https://doi.org/10.3390/s23094302
Jiang X, Zhao Z, Li Z, Hong F. Echo-ID: Smartphone Placement Region Identification for Context-Aware Computing. Sensors. 2023; 23(9):4302. https://doi.org/10.3390/s23094302
Chicago/Turabian StyleJiang, Xueting, Zhongning Zhao, Zhiyuan Li, and Feng Hong. 2023. "Echo-ID: Smartphone Placement Region Identification for Context-Aware Computing" Sensors 23, no. 9: 4302. https://doi.org/10.3390/s23094302