1. Introduction
Climate change stands as one of the most pressing challenges confronting contemporary society. International bodies such as the United Nations Framework Convention on Climate Change (UNFCCC), the Intergovernmental Panel on Climate Change (IPCC), and national/regional Environmental Protection Agencies (EPAs) have meticulously identified the primary sources of carbon emissions. These emissions predominantly emanate from sectors such as electricity and heat, transport, manufacturing and construction, agriculture, and waste disposal [
1,
2,
3]. The imperative to accurately monitor and quantify carbon emissions on a continuous basis for informing mitigation efforts has spurred the deployment of sensor networks. This focus has garnered considerable attention from governing bodies, industries, and academic institutions over an extended period [
4,
5,
6,
7].
In the domain of wireless sensor networks (WSNs), a noticeable trend is the integration of artificial intelligence (AI) and machine-learning (ML) models for processing and interpreting the steady influx of time-series data [
8,
9,
10,
11]. The development and application of these models often necessitate a significant volume of data points, ranging from thousands [
12] to hundreds of thousands [
13]. It is worth noting that non-eventful data holds almost equal importance to eventful data for the training and validation of these models. As more advanced approaches gain ground over traditional ML algorithms in WSNs such as deep learning [
14,
15], the demand for data generation on sensor nodes has surged, sometimes reaching into the millions [
16]. However, the drawback of this approach, particularly concerning the tracking of carbon emissions, lies in the energy-intensive systems required to power standard and specialized server farms [
17]. These systems can paradoxically exacerbate the very carbon emissions that sensor networks aim to alleviate. Studies have estimated that data centers alone contribute significantly to climate change, with emissions as high as 100 megatons of CO
per year [
18,
19,
20]. For instance, Strubell et al. [
21] estimated the financial and environmental costs associated with training/tuning neural network models; they concluded that the carbon footprint increases proportionally with model size. Other works have focused on the environmental impacts of AI [
22] and offer insights into calculating the carbon footprint of machine learning [
23,
24,
25].
Although the application of ML systems for event classification in time-series data has yielded considerable benefits [
26,
27], the prevailing design philosophy for sensors has shifted towards configuring sensor nodes as basic devices primarily, if not entirely, responsible for data sampling and transmission. This approach offers several advantages, including efficient and standardized WSN design and the integration of advanced classification algorithms using growing libraries of big data analytics. However, a notable consequence of this approach is the increased demand for sensor node resources for data generation and transmission. Coupled with the need for higher sampling frequencies to train ML models for event detection, this approach significantly raises power consumption and, consequently, reduces the operational lifespan of these devices.
Concurrently, advances in computing hardware, such as edge computing, have spurred progress in microcontroller unit (MCU) technology [
28,
29]. These advancements have expanded the processing capabilities of microcontrollers while maintaining their energy-efficiency attributes [
30]. This transformation can be partly attributed to the ongoing development of personal devices, such as wearables, smartphones, tablets, and more. Such devices have witnessed substantial enhancements in processing power and extended lifespans. Regrettably, these achievements have somewhat overshadowed the potential of microcontrollers in favor of the migration toward ML-based solutions. This shift raises a second paradox: prioritizing the computational demands of data transmission inadvertently shortens the operational lifespan of sensors.
The overarching challenges associated with the current/traditional server/desktop-based computers approach for machine learning have been well recognized, primarily in terms of their energy consumption, carbon footprint, and operational costs, which has consequently given rise to a young but growing paradigm shift (deemed TinyML) involving utilizing microcontrollers for data analysis as an alternative/solution [
31,
32,
33,
34,
35]. Some examples where AI/ML can complement the efficiency of microcontrollers without compromising environmental sustainability include life prediction of turbofan engines [
36], gas leakage detection [
37], driver drowsiness detector [
38], water leak detection [
35], or fruit variety classification [
39].
Microcontrollers play a crucial role in Internet of Things (IoT) applications [
40]. Their compact size, low power consumption, and ability to integrate seamlessly with sensors make them fundamental components in IoT ecosystems [
41,
42,
43,
44]. With their embedded processing capabilities, microcontrollers enable real-time data acquisition and local decision-making, reducing the need for continuous communication with centralized servers [
28,
33,
45,
46,
47]. This not only enhances system responsiveness but also contributes to energy efficiency, a critical factor in the design of sustainable IoT solutions [
48,
49]. Moreover, the cost-effectiveness and accessibility of microcontrollers have spurred innovation across industries, from smart homes and healthcare to industrial automation [
50,
51,
52,
53,
54,
55,
56,
57,
58,
59]. Understanding the pivotal role of microcontrollers in IoT is essential for harnessing their full potential in addressing contemporary challenges and advancing the capabilities of connected devices. In the context of carbon-emission monitoring, microcontrollers play a vital role in monitoring solutions. For instance, Brown et al. present a low-cost, microcontroller-based CO
concentration data logger that can be used for field deployment [
60]. Devan et al. [
61] used a microcontroller to monitor carbon emissions in air pollutants. Afroz et al. used an ESP32 to measure CO
emissions in urban areas [
62]. Additionally, Vargas-Sansalvador [
63] reported an interesting approach to CO
sensing using an LED as the light detector with a colorimetric indicator. Although there are many examples in the literature [
64], it is clear that microcontrollers have been used extensively for carbon-emission sensing, showcasing the importance of their use in monitoring systems.
An optimally designed WSN should, at least partially, offload low-level event detection tasks to sensor nodes. This approach capitalizes on the evolving processing capabilities of sensor technology, alleviating the necessity of expending energy reserves on data transmission and, therefore, server/cloud carbon emissions, specifically when no events occur. This is a more efficient utilization model of power resources, particularly for sensors expected to operate for extended periods of time, if not indefinitely, and for sensors that have already been deployed for several years. Additionally, it is crucial to recognize that the interpretation of data is often context-specific. Consequently, it raises a compelling question regarding what operations of event detection can be feasibly implemented on low-powered devices that are suitable for application across diverse domains.
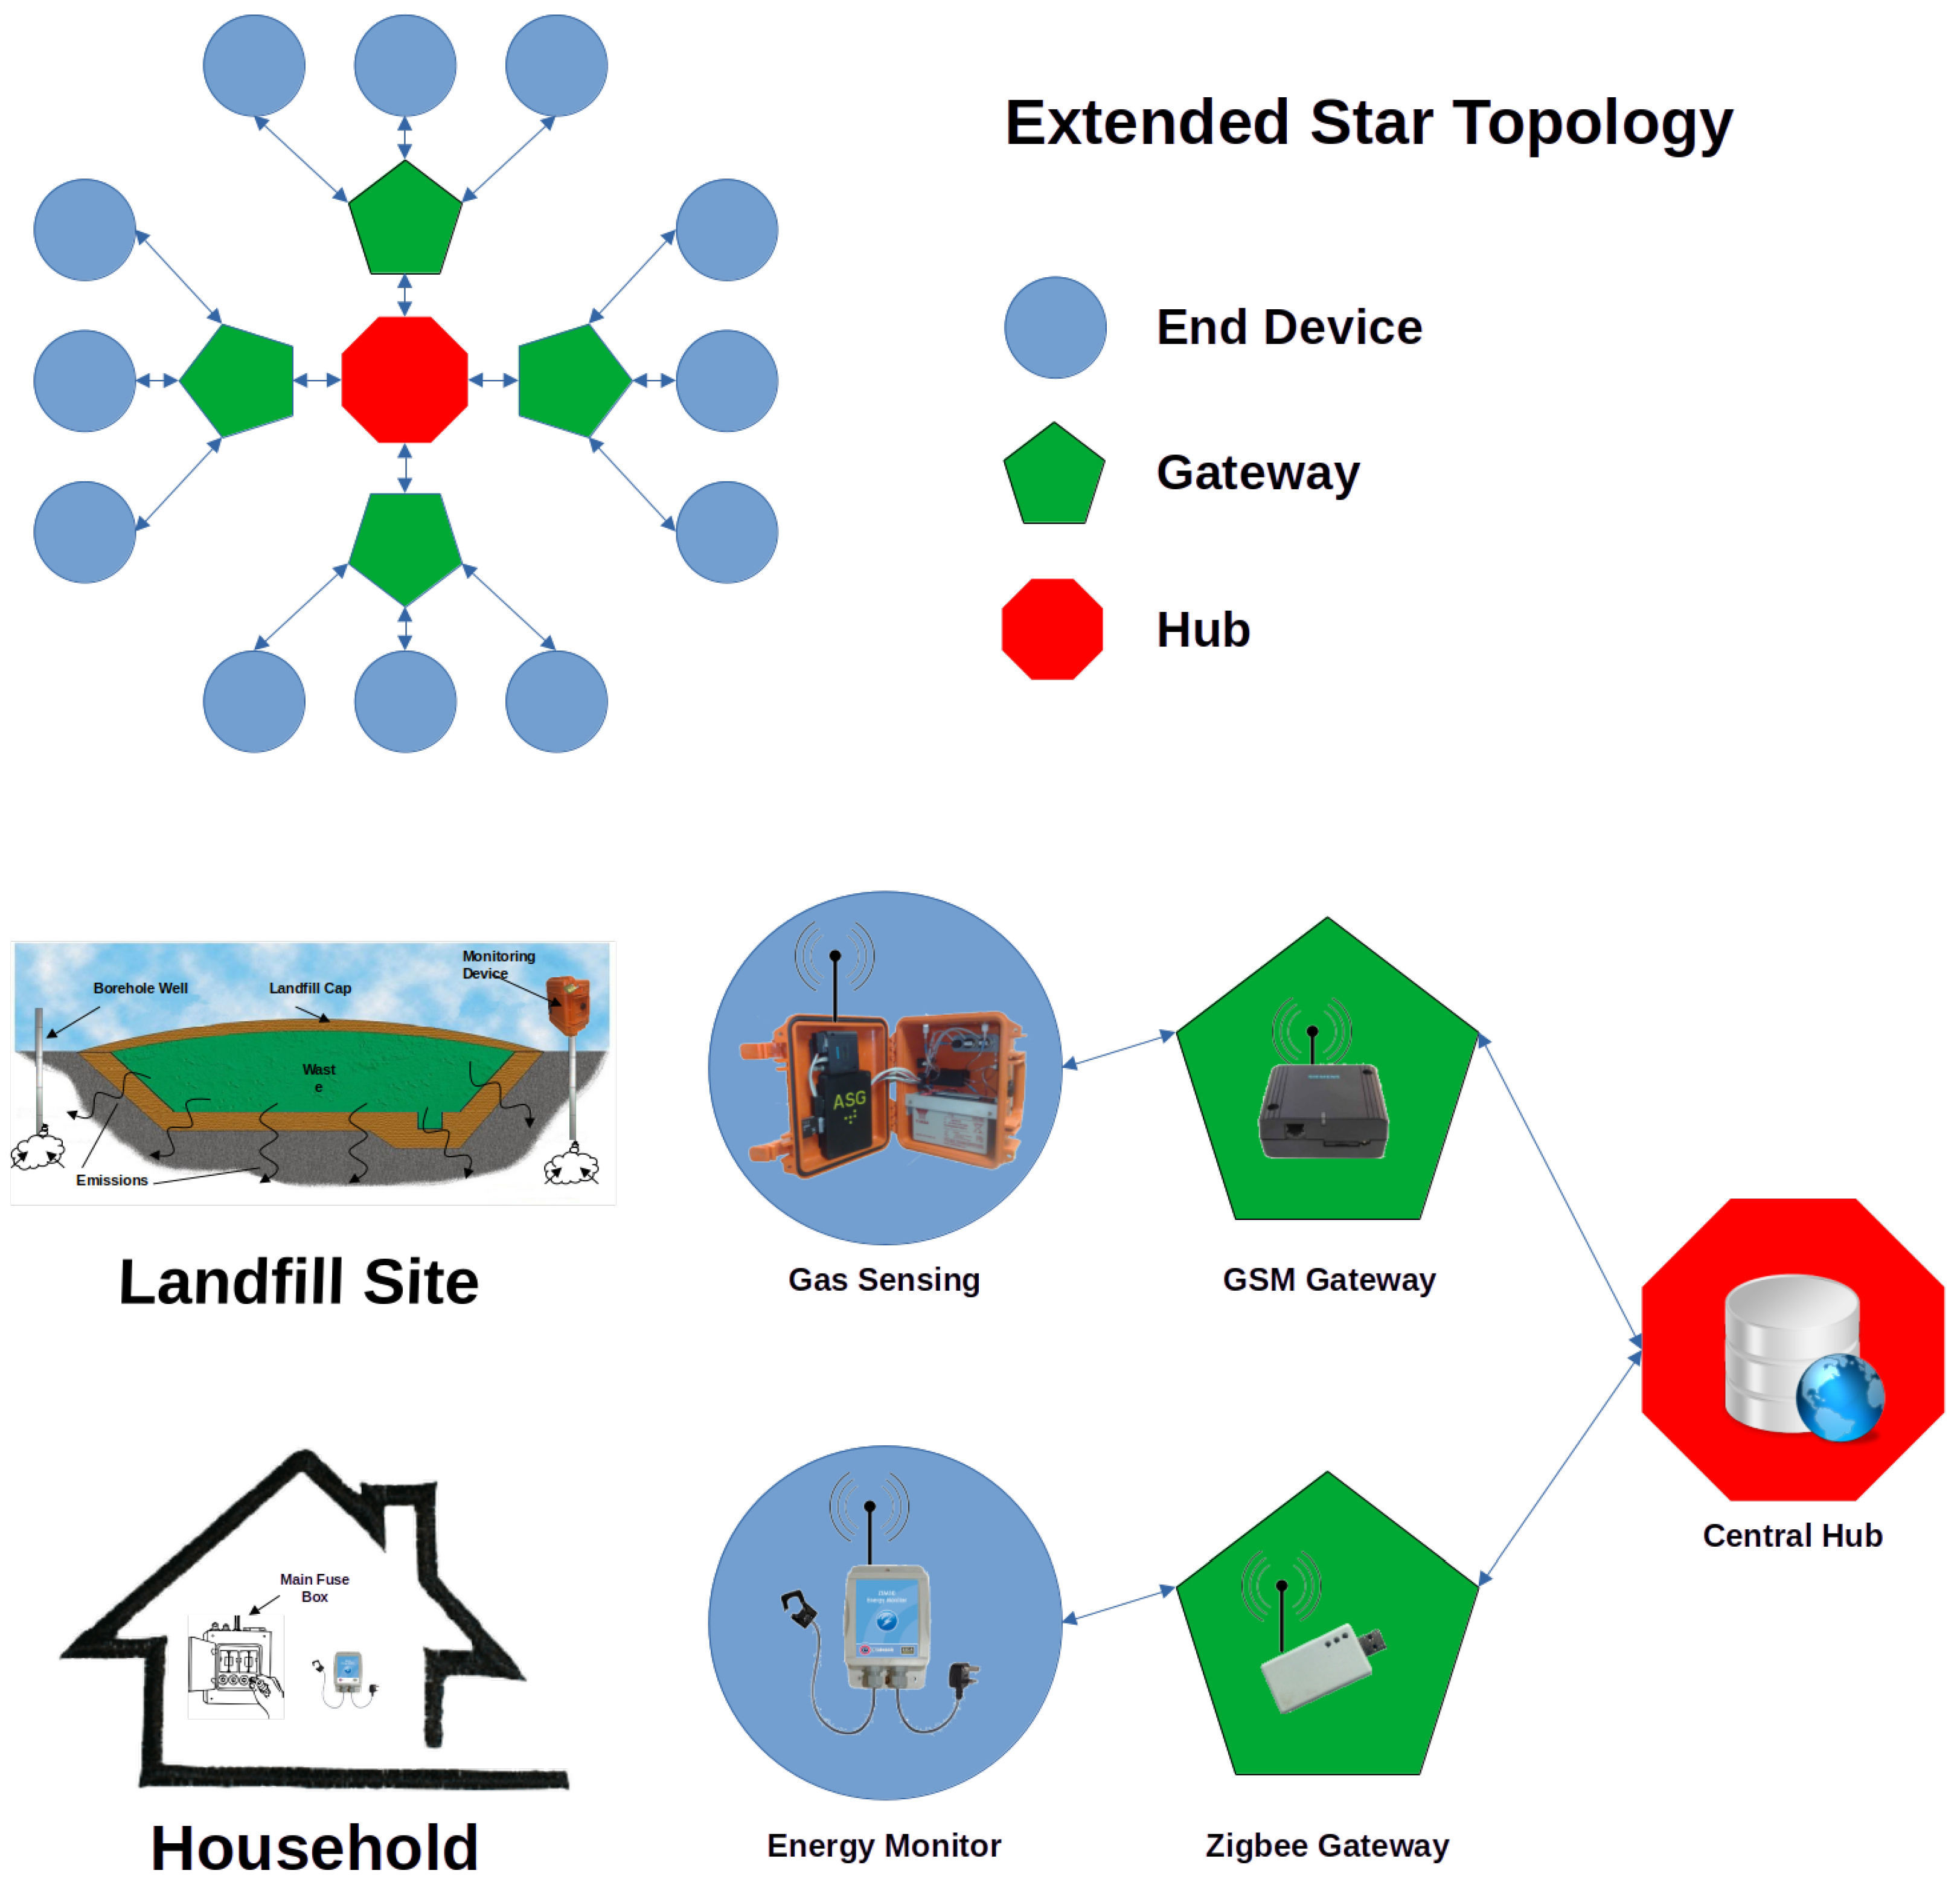
Although the application of microcontroller-based data processing offers significant advantages, it also faces several challenges, including hardware heterogeneity, MCU architectures, resource constraints, limited memory management, and software interoperability between devices. When such an overarching challenge is presented, it is often valuable to examine fundamental elements and explore solutions capable of producing workable models in compliance with such constraints. In this study, we explore the potential for implementing a heterogeneous event detection approach based on binary classification, which can be adapted to different data sources within the realm of monitoring carbon emissions. Our investigation revolves around two distinct case studies closely tied to emission sectors. The first is a complex dataset of domestic energy monitoring, representing the electricity and heating sector. The second is less complex data comprised of environmental chemical sensing, focused on monitoring CO emissions within the waste disposal sector. Leveraging algorithms that can be efficiently implemented on standard microcontrollers, our objective is to detect specific events of interest in these crucial sectors to best demonstrate a heterogeneous approach across vastly differing data sets across two distinct domains from a sensory viewpoint.
4. Discussion
4.1. Global Analysis
The initial sweep involved gathering global summary information on the total number of measurements, maximum/minimum/average sensed value, and percentage of measurements above critical thresholds. These global statistics are presented in
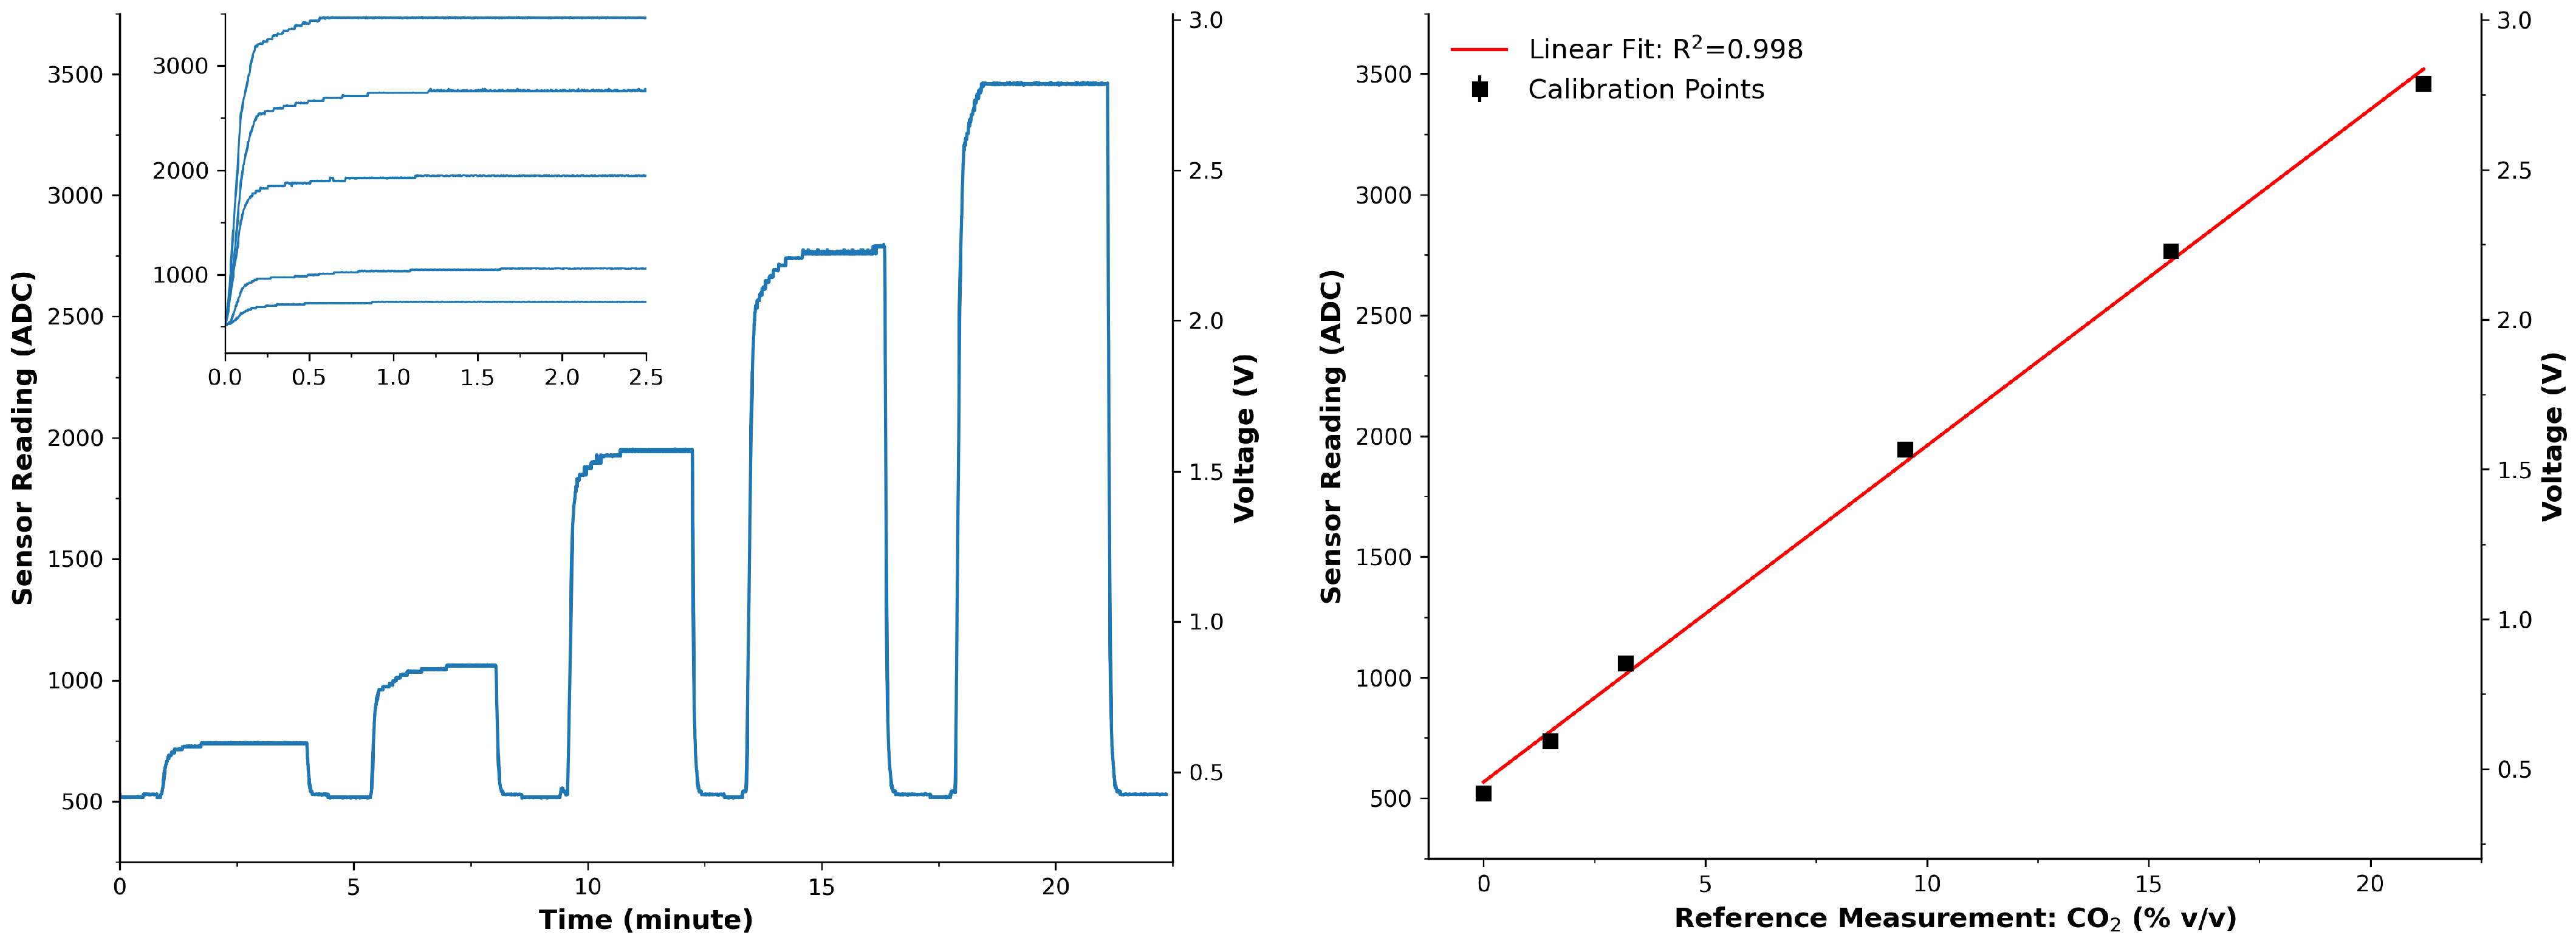
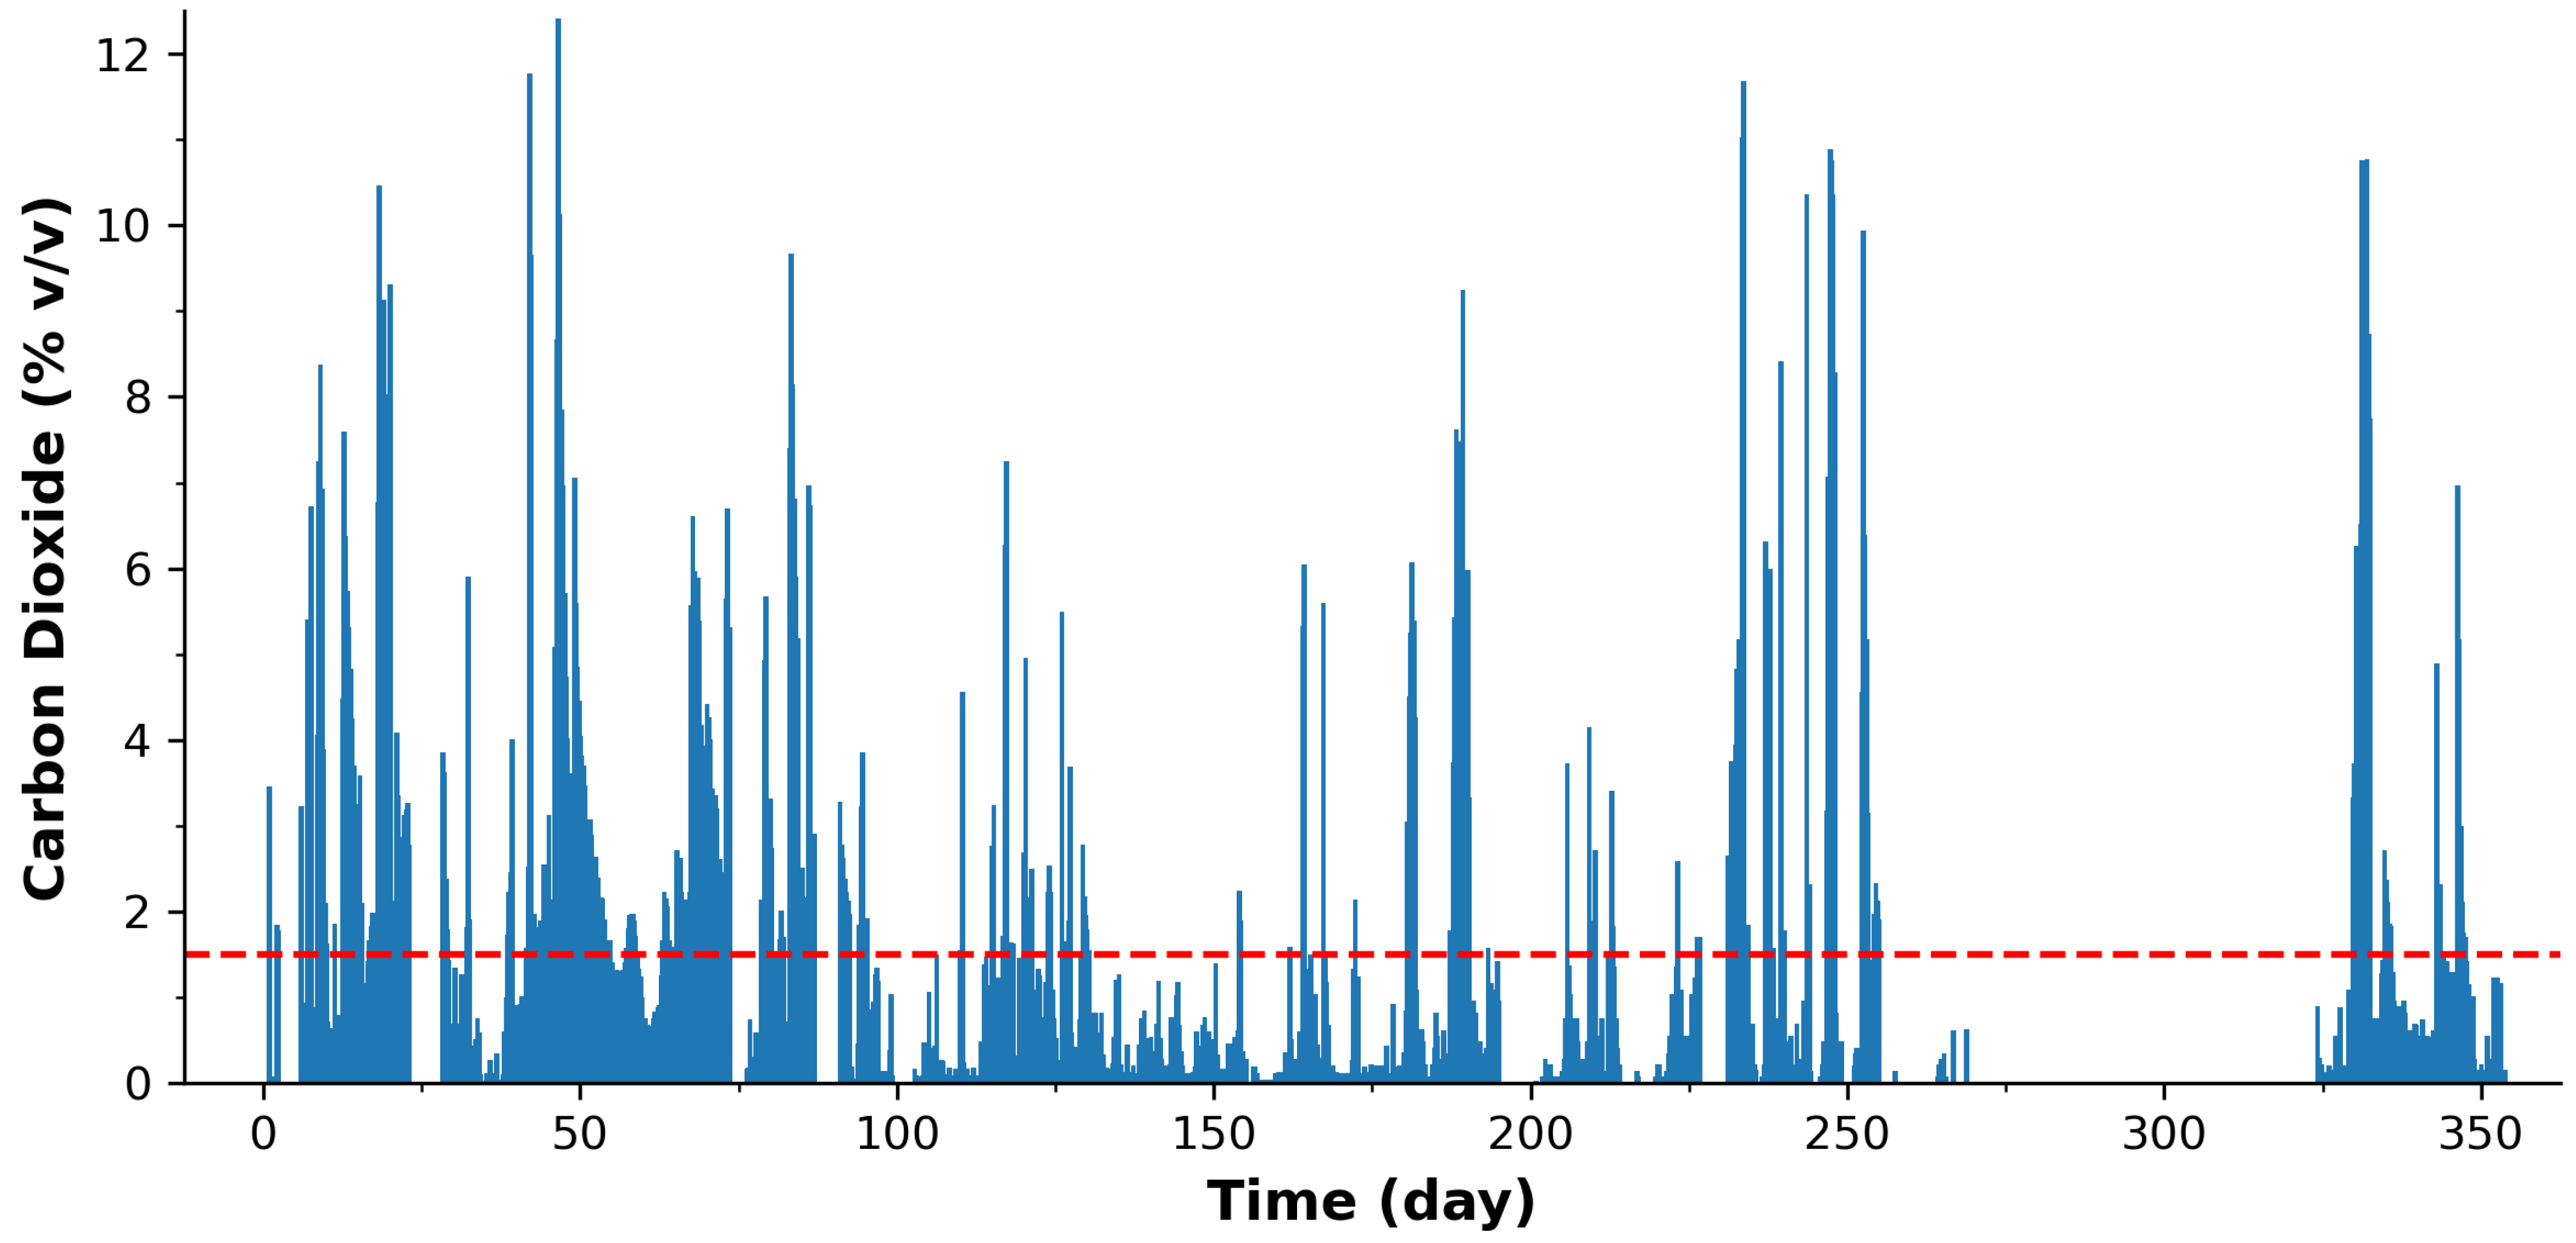
Table 1. For the environmental CO
emissions, the recorded concentration for the entire year was, on average, 1.41%
, which is surprisingly very close to the 1.5%
legal emission limit permitted by legislation [
69]. This trigger level for CO
emissions by the governing body laid the basis of our binary classification event detection. Furthermore, it seems that for ca. 28.5% of the total recorded measurements, the borehole well emission level was in excess of the regulatory limit.
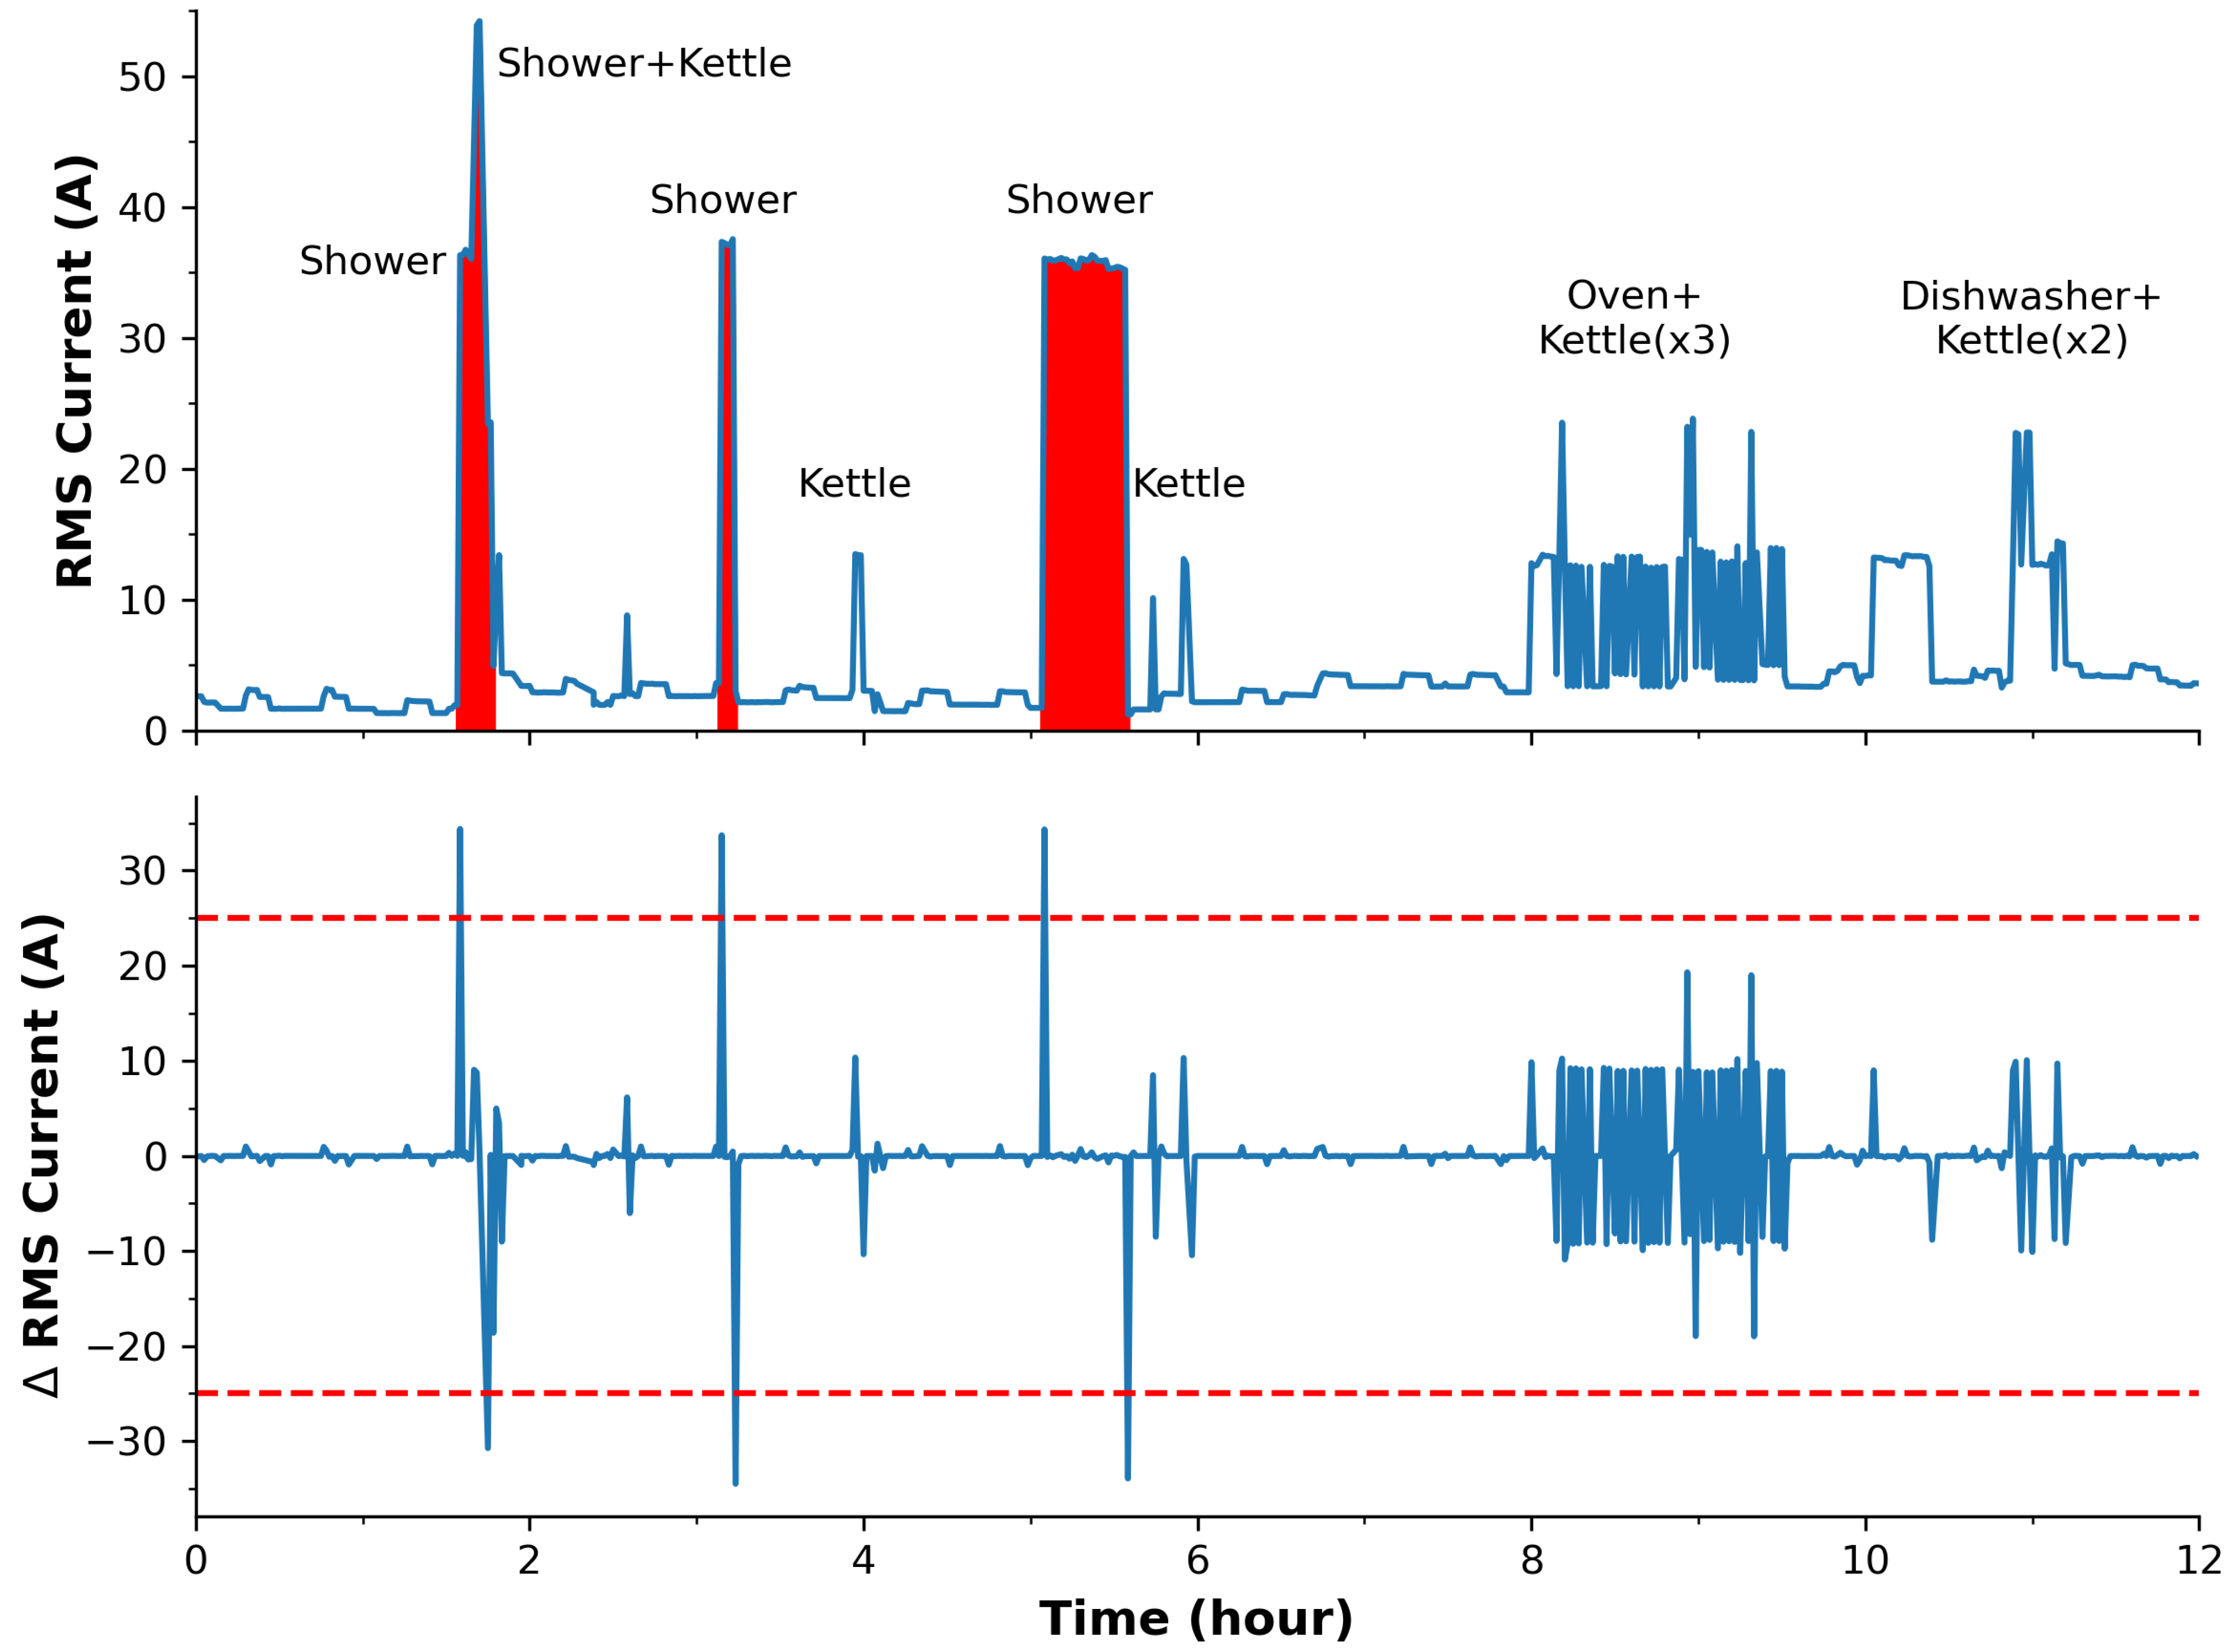
For the home energy data, the data reflects the RMS current measurement via the reported data, i.e., not the differential dataset. The differential set was used to detect the bottom statistic in the table. Based on the training set in
Figure 4, it is evident why two different thresholds were chosen for identifying shower use, i.e., due to the offset effect of other appliances. The offset also accounts for differences in the calculated maximum values. Curiously, the minimum was not 0 A, as one may expect; this is a good indication that the background appliances (e.g., refrigerators/freezers) are constantly in operation. The average RMS current of the household was 3.39 A over the entire year, and this can be used to estimate average costs and contributions to carbon footprint.
One point to note for both deployment data is the capability of the microcontroller to calculate the average value. First, both systems were capable of handling 4-byte floating point numbers as part of the microcontroller’s arithmetic logic units (ALUs). This meant that values from 1.2 × to 3.4 × were possible, with calculations therein. This is clearly in range for calculation of the average and demonstrated through the summation field in the table. It is also worth noting that many microcontrollers are equipped with a carry flag, allowing for larger arithmetic ranges where required. The capability of generating such information by the microcontroller demonstrates its ability to provide meaningful information without the need for cloud-based servers and heavy computational processing.
One point to note is that fading problems affect data transmission. For the environmental data,
Table 1 shows 1121 packets/measurements, yet an ideal packet count should be 1460 at 6 h/day over the year with a packet loss of 23.2%. This can be accounted for by battery depletion during the winter months, as discussed earlier. For the energy monitoring, the gateway was placed in the adjacent room to the monitor to ensure data reception. Ideally, at the set sampling frequency, 350,400 packets should be received over the year, yet 344,922 were accounted for. This yields a 98.4% successful transmission and a 1.6% packet loss, which could be due to attenuation by householder activity. Although the household sensor was equipped with CRC checking per transmitted packet coupled with 3 retries, the environmental sensor was not equipped with this capability due to the larger amount of resources required to transmit data via SMS. To ensure data redundancy, the system was equipped with flash memory where the data were stored for backup/later recovery. Overall, it appears that there is value in performing transmissions only when an event occurs (discussed later), yet one must enable robust checking/handshaking to ensure delivery.
4.2. Event Detection
Table 2 presents summary statistics for the landfill and home energy event data sets. It should be noted that the minimum sensed value and the minimum event duration are dependent on the set threshold level for event identification and on the sampling frequency.
With respect to the CO event statistics, it can be seen that the total number of events is high at 70 (should ideally be 0 for full compliance) with an average of ca. 6 events per month. Furthermore, the average CO concentration during the detected ‘events’ was 9%, and in some cases, events lasted longer than 8 days.
With respect to the home energy usage, the RMS current measurement results show the frequency of shower events was, on average, 1.5 per day, with an average power draw of ca. 32 A and an average duration of ca. 7 min. This is important for calculating how much the shower alone is costing the household and if it is a high proportion of the electrical bill (in one case, the shower was active for 33 min!—as seen in
Figure 4).
4.3. Selectivity and Accuracy
Event classification in the Environmental dataset followed a relatively straightforward path guided by legal emission limits. In contrast, the energy monitoring task proved to be more complex, necessitating the use of a differential dataset. The differential approach underscores the significance of algorithms in conferring “selectivity” to decision-making processes based on signals from physical transducers. In essence, these algorithms serve a role akin to binding sites in chemical sensing. Their function is to recognize and report features in the electronic signal that align with predefined “event” patterns.
Similar to binding sites, algorithmic selectivity is not always absolute. A decision must be made regarding whether the event originates from the primary target signal or an interfering source. In both cases, practical compromises are necessary to address analytical challenges. Perfectly selective binding sites that only report the binding of the primary molecule under all conditions are a rarity, leading to inevitable occurrences of false positives and false negatives. Likewise, in appliance detection, complex algorithms may achieve near-perfect classification accuracy, but their implementation becomes impractical in distributed sensor networks, where computational resources are limited.
To put it differently, a certain degree of uncertainty is inherent in all elements of sensor networks. Our experience in both chemical sensing and data analytics has revealed similarities in the functioning of the two networks presented in this paper. Environmental IR sensors may encounter interferences from molecules with similar binding characteristics, just as appliance recognition may yield false positives when multiple appliances drawing power simultaneously create overlaps. The practical objective is to deliver data of sufficient quality to meet the application’s requirements. In smart metering, this means initially detecting activity versus inactivity and subsequently identifying appliances with acceptable accuracy. Combining relatively simple algorithms can achieve this goal, at least for power-hungry devices that generate distinct signature profiles in the root mean square (RMS) current when operated.
Furthermore, the integration of AI and ML for event detection introduces a compelling challenge. Overfitting, a common concern, can significantly impact the effectiveness of event detection models. Overfitting occurs when a model becomes excessively specialized in performing well on the training data but struggles to generalize its performance to new, unseen data [
70,
71]. This challenge is particularly relevant when dealing with large datasets, as previously mentioned. In the context of IoT event detection, striking a balance between avoiding overfitting and achieving generalization is essential for a robust and effective event detection system. The challenge lies in ensuring that the model performs well on the training data without becoming overly specialized and, as a result, less adaptable to different environments or domains.
Although the use of relatively simple algorithms for data processing on microcontrollers may exhibit limitations, they can demonstrate substantial value in green IoT event detection. Similar to the imperfections encountered in chemical binding and AI/ML approaches, some degree of uncertainty may persist in the data produced. However, it is crucial to recognize the potential value that sensor node-based data processing can bring, especially in the context of reducing overall carbon emissions in terms of data processing. It must be noted that the detection of the longest shower (33.17 min,
Table 2) corresponds with the third shower duration in the training set in
Figure 4, which supports the accuracy of our approach.
The primary events of interest, such as detecting primary appliances for carbon emissions in the electricity and heating sector or tracking environmental chemical sensing related to waste disposal, hold significant implications for addressing the critical challenge of climate change. Therefore, embracing the possible imperfections and exploring the possibilities offered by these low-power devices is a worthwhile pursuit with promising environmental and societal benefits.
4.3.1. Accuracy of the Event Classification Algorithm
The accuracy of our event classification algorithm is a critical aspect of our study. We have made the algorithm’s source code, written in the C programming language, available in
Listing A1 in
Appendix A.1 for comprehensive transparency. The algorithm operates in real time, processing data on the fly without the need for extensive memory storage, therefore minimizing memory requirements.
To assess the accuracy, we performed a manual comparison with the Environmental CO dataset. Although the Energy-Monitoring dataset contains a higher sampling frequency (1.5 min), the Environmental dataset, with a sampling period of 6 h, was chosen for this specific analysis due to the manageable number of data points for auditing. The manual processing of the Environmental data, when compared with the outcomes of our binary classification algorithm, demonstrated complete agreement. This meticulous verification process attests to the algorithm’s accuracy in identifying and classifying events.
4.3.2. Advantages of the Event Classification Algorithm
Our event classification algorithm exhibits notable advantages. Operating autonomously, the algorithm processes data in real time, eliminating the need for extensive memory storage during its operation and contributing to reduced memory requirements. The device’s on-the-fly processing further minimizes its memory footprint, aligning with resource-efficient practices and memory constraints on microcontrollers. With a relatively high sampling frequency of 6 h for the Environmental dataset, our device offers a significant monitoring advantage over traditional manual methods, which often operate on a much lower frequency (e.g., 4 times per year). This autonomous capability allows for continuous monitoring, showcasing its practicality in environmental applications. Our validation of our algorithm on the Environmental dataset resulted in a 100% agreement in event statistics. This reliability underscores the effectiveness of our algorithm in field measurements. Importantly, our algorithm’s efficiency reduces reliance on manual data collection and the deployment of highly advanced machine-learning systems. By utilizing the processing capabilities of the microcontroller, our device provides critical information with high accuracy, contributing to a reduction in carbon emissions associated with complex computational processes.
4.4. Power Impact
One of the critical factors in the design of deployable sensor networks is power consumption. Transmitting data consumes a significant amount of energy, especially when using battery-powered devices. To address this issue, we explore a scenario where the sensor network minimizes data transmission when no events occur, as indicated by the deployment statistics presented in
Table 1 and
Table 2.
4.4.1. Deployments
First, let us examine the environmental CO data, where a total of 70 events were detected out of 1121 transmitted measurements over the year. If the system were configured to transmit data only when an event occurs, an impressive 93.8% of measurements could be spared from transmission, resulting in substantial power savings. Alternatively, even if data were transmitted at the beginning and end of an event, it would still mean that 87.5% of the transmitted data were redundant, representing a significant energy waste. This aspect becomes particularly critical for battery-powered devices, especially when utilizing power-hungry communication methods like GSM.
In contrast, the energy data presents an even more pronounced opportunity for power conservation. A staggering 99.8% of the transmitted data are considered redundant if data transmission occurs only once per event. Even with data transmitted at the start and end of an event, 99.7% of the transmitted data remains unnecessary. This high percentage of redundant data underscores the significant energy waste in the context of energy monitoring. However, it is worth noting that, unlike environmental data, the tracking of significant appliance usage may not require real-time alerts. Thus, in the context of energy monitoring, a single transmission per event could be a practical and energy-efficient approach, balancing the need for data with power conservation.
In the current paradigm of sensor networks, the prevalent approach often involves collecting raw data and transmitting it to the cloud for later processing using AI/ML techniques. However, this approach can result in unnecessary processing and energy consumption. By adopting a more efficient strategy, as demonstrated in this study with event detection on the microcontroller itself, significant benefits can be achieved. Not only does this approach lead to reduced data transmission, prolonging the operational lifespan of the sensor, but it also contributes to the reduction of carbon emissions. The need for continuous server farms can be minimized, aligning with the broader goal of addressing climate change by making resource allocation more sustainable and environmentally friendly.
4.4.2. Power Savings
To assess the power savings achieved through our event detection method, we conducted a detailed analysis of the power usage for the two deployments. The results presented in
Table 3 highlight the significant reduction in energy consumption when the platform is not required to transmit until the end of an event.
In the context of environmental CO monitoring, the average current during transmission (TX) was measured at 37 mA, with an average TX time of 22.9 s. The energy consumption per TX was calculated as 10.1 J, resulting in an overall energy consumption of 11.4 kJ for all TX events. However, by leveraging our event detection method, the energy expended for events (TX/RX) was substantially reduced to 710.2 J, leading to an impressive energy savings of 93.8%.
Similarly, in the case of energy monitoring, where the platform transmits only to report an event, the energy savings were even more remarkable. With an average TX current of 35.5 mA and a minimal TX time of 0.1 s, the energy consumption per TX was merely 19.2 mJ. The overall energy consumption for all TX events was 6.6 kJ, but with the event detection method, the energy expended for events (TX/RX) reduced significantly to 10.3 J, yielding an extraordinary energy savings of 99.8%.
These findings underscore the effectiveness of our event detection method in minimizing energy consumption, making it a crucial component for sustainable and energy-efficient sensor network operations in addition to further reducing the carbon footprint. By extending this to a WSN of thousands of sensory devices, one can understand the significance of adopting a more power-efficient strategy.
4.4.3. Platform Power Comparison
A traditional AI/ML system typically refers to a setup where machine-learning tasks, such as training and inference, are performed on powerful computational platforms, often involving high-performance servers or cloud-based infrastructure. These systems may include Graphics Processing Units (GPUs) or specialized hardware like Tensor Processing Units (TPUs) to accelerate the computational demands of machine-learning algorithms. In the context of this work centralized around carbon emissions and generation, it becomes important to compare the various platforms in terms of power use.
Table 4 presents the power draw of the platforms used in this study and alike with other platforms typically used for AI/ML with conversion to carbon emissions using the USA current definition of 367 gCO
e [
72]. We note that the first two platforms in the table were used in this study: MSP430 (Case Study I) and EMP250 (Case Study II). Although server farms clearly use significantly more power than those listed, they were omitted for closer comparisons, i.e., it was more comparable to list microcontrollers with edge devices and desktop equivalents. A stark contrast exists between the power draw of microcontrollers (top 3) and CPU/GPU-based platforms (bottom 6), which draws approximately ×20,000 the amount of power as microcontrollers, resulting in the same proportion of carbon emissions.
4.5. Energy Harvesting
In the context of addressing carbon emissions, it is essential to consider the sustainability of sensor nodes, particularly their ability to operate using renewable energy sources, such as solar cells. Sensor networks are uniquely positioned to operate for extended periods, thanks to the low-power characteristics of microcontrollers, which complement the energy output of available energy harvesting methods. This stands in stark contrast to the resource-intensive operation of server farms. Although significant advancements are being made in harnessing renewable energy sources for data centers [
79], the demand on server farms remains such that achieving zero carbon emissions is still a challenge.
Alternative approaches to sustainable sensing systems involve strategies aimed at significantly reducing the per-sample power cost. For instance, opting for reagent chemistry with LEDs for gas detection [
63,
80], as opposed to IR-based methods, can lead to substantial power savings. We note that the use of LEDs as light detectors has demonstrated significantly less power consumption than the traditional photodiode counterpart [
81,
82,
83]. For instance, previous work in turbidity sensing [
84] performed a direct comparison between photodiodes (447 mW) and LED (446 nW) power draw and found two orders of magnitude difference, i.e., 1.002 ×
less power draw. Such advances, coupled with renewable energy strategies, could prove invaluable for battery-powered devices.
In scenarios where water-based sensors are employed [
85,
86], especially in environments with limited access to renewable energy sources such as solar or wind, an event-driven approach proves advantageous. The attenuation of RF signals in water can hinder data transmission, making it essential to minimize data transmission and adopt an event-driven model. Additionally, alternative communication methods like sonar, while effective, can be power-intensive, and their usage should be optimized to maximize the longevity of deployments.
By integrating energy harvesting and optimizing power usage in sensor networks, we can further reduce the carbon footprint associated with continuous data transmission and processing, contributing to a more sustainable and environmentally responsible approach to sensor network design.
4.6. Resource Placement
Historically, the development of sensor systems necessitated a myriad of specialized resources, often involving the expertise of electrical engineers, intricate PCB design and assembly, and the creation of custom firmware. These requirements made entry into the field of sensor networks daunting and limited to those with extensive technical knowledge.
However, a transformative shift occurred with the advent of single-board microcontrollers. These compact, versatile devices ushered in a new era of sensor system development, democratizing the process and making it accessible to a wider range of enthusiasts. A pivotal aspect of this transformation was the emergence of a vibrant community of users and the availability of libraries that offered pre-built code for common functions. As a result, the barriers to entry significantly lowered, enabling a more diverse group of individuals to engage in sensor network projects.
In recent times, there has been a prevailing trend toward harnessing the power of artificial intelligence (AI) and machine learning (ML) for data processing within sensor networks. The appeal of these technologies lies in their ability to perform complex tasks, offering high-level programming and classification solutions. AI and ML tools continue to evolve, providing increasingly sophisticated capabilities for handling data and making sense of intricate patterns.
Although the integration of AI and ML for data processing presents remarkable advantages, it is not without drawbacks. One of the significant downsides is the increased power consumption associated with these resource-intensive systems. Consequently, the carbon footprint of sensor networks can expand, which may counteract the overarching goal of reducing carbon emissions.
In this study, we have demonstrated the noteworthy achievements that can be unlocked through the utilization of microcontrollers as primary resources for gathering and processing data in sensor networks. Our research has highlighted the potential of these low-power yet efficient devices to extract valuable insights from data, particularly in contexts where the primary focus is the identification and management of high-power-consuming appliances—a critical aspect of reducing carbon emissions.
To achieve the best possible reduction in carbon emissions, it is imperative to optimize the placement of resources within sensor networks. This entails careful consideration of when and where to employ resource-intensive AI/ML systems and when to leverage the efficiency of microcontrollers. Software tools like openLCA offer a means to assess the environmental impacts associated with every stage of the life cycle of WSN systems, from sensor deployment to data processing on servers. By optimizing resource placement, we can strike a balance between data processing efficiency and environmental sustainability, aligning with the overarching goal of addressing climate change.
Applications and Advantages of Microcontroller Methods
The applications of MCU methods in sensor networks for carbon emissions monitoring are diverse and offer distinct advantages. In the context of this research, the implementation of MCU-based real-time event detection has been successfully demonstrated in two specific applications: environmental CO monitoring and home energy usage tracking.
In environmental CO monitoring, the MCU method excels in providing a low-power solution for gathering and processing data from sensors. The MCU’s ability to perform event detection locally on the sensor node minimizes the need for continuous data transmission, resulting in significant energy savings. This approach is particularly advantageous for remote or inaccessible deployment locations, where frequent data transmission may not be feasible and/or transmission costs are a bottleneck. The MCU’s efficiency (coupled with event-driven data transmission) ensures that only relevant information is transmitted, which reduces the overall power consumption of the sensor node.
For home energy usage tracking, the MCU method proves instrumental in detecting and classifying events related to high-power-consuming appliances. The efficiency of MCU-based algorithms allows for real-time processing of data, enabling the identification of specific appliance usage patterns. This capability is crucial for assessing the contribution of individual appliances to the overall carbon footprint of a household. The MCU’s low-power characteristics make it a suitable choice for deployment in smart homes, where continuous monitoring is essential for understanding energy consumption patterns.
The advantages of MCU methods extend beyond specific applications to address overarching challenges in sensor network design. The inherent low-power characteristics of microcontrollers contribute to prolonged sensor node operational lifespans, reducing the frequency of battery replacements and associated environmental impact. Additionally, the accessibility and affordability of microcontrollers have democratized sensor system development, making it feasible for a broader range of individuals and communities to engage in carbon emissions monitoring initiatives.
In summary, the applications of microcontroller methods in carbon emissions monitoring encompass diverse scenarios. In this work, we demonstrated this from environmental sensing to household energy tracking. The inherent advantages of low-power real-time processing contribute to energy efficiency, sustainability, and accessibility in sensor network design. These attributes position microcontrollers as key components in addressing the challenges of climate change through effective resource placement and optimized data processing strategies.
4.7. Current and Future Challenges
As outlined in the Introduction, MCU-based data processing comes with various challenges, such as hardware heterogeneity, diverse MCU architectures, resource limitations, constrained memory management, and the need for seamless software interoperability across devices. These challenges can be addressed through the development of standardized programming libraries and compatibility with device-specific code compilation. This has been demonstrated through the developed code in
Listing A1 in
Appendix A.1 for event detection for two diverse applications. It is noted that this was 98 lines of C code, while the same result can be achieved through a few lines in Python due to the relatively plentiful availability of memory and imported libraries.
Network connectivity remains a significant challenge for MCU-based solutions. Emphasis should be placed on standard protocols, interoperability, and security to overcome this challenge. The LwM2M protocol is discussed as a potential solution for addressing the challenges related to network connectivity and interoperability. Additionally, the first ACM/IEEE TinyML Design Contest (TDC’22) focuses on developing AI/ML-based real-time detection algorithms for life-threatening ventricular arrhythmia on low-power microcontrollers used in Implantable Cardioverter-Defibrillators (ICDs) [
87].
Another concern is security and data trustworthiness issues for IoT systems [
88,
89]. Critical assurances must be put in place for the environmental data, as landfill sites can be financially penalized for breaching legal limits and be appealed in court systems. Moreover, considering that many are privately owned sites, there is a vested interest in favoring sub-threshold values by the owners and/or higher for competitors. For the household data, access by unauthorized persons could reveal when the household is empty as seen in
Figure 5 and therefore be vulnerable to burglary [
90]. Parikh et al. [
91] outlined opportunities and challenges related to wireless systems, particularly for smart grid applications, which is particularly relevant for our household monitoring system. In addition, a game-theoretic approach has been proposed by Abdalzaher et al. [
92] to enhance security and data trustworthiness in IoT applications. This model focuses on clustered wireless sensor networks (WSNs) in IoT, addressing challenges such as data trustworthiness (DT) and power management. The repeated game model presented in the paper aims to enhance security against selective forwarding attacks, detect hardware failures in cluster members, and conserve power consumption due to packet retransmission.
Another challenge is incremental on-device learning, which allows both inference and training of models directly on MCU devices. A toolbox called TyBox is introduced to address this challenge and provide automatic design and code generation for incremental on-device classification models [
93].


